Article

Behavioral Model Deployment for the Transportation Projects within a Smart City Ecosystem: Cases of Germany and South Korea

1
School of Industrial Management, Korea University of Technology and Education (KOREATECH), Cheonan 31254, Republic of Korea
2
School of Engineering Business and Management, Bauman Moscow State Technical University, Moscow 105005, Russia
*
Author to whom correspondence should be addressed.
Processes 2023, 11(1), 48; https://doi.org/10.3390/pr11010048
Submission received: 28 November 2022 / Revised: 17 December 2022 / Accepted: 20 December 2022 / Published: 26 December 2022
(This article belongs to the Special Issue Advanced Processes Creating New Technologies in Tomorrow's Industry)

Abstract

:
This research focused on a behavioral model as a significant tangible enabler for smart city plans and initiatives across Asian and EU regions as per transportation projects. This study aimed to create a behavioral model to serve as a planning tool for policymakers, planners, and implementers of transportation initiatives in smart cities. The paper discusses the validity of the proposed model framework for fostering the diffusion of a successful smart city project transformation in a general smart city ecosystem and particularly within the transportation industry. The framework was verified using three different methods: literature review to give a speculative understanding of current smart city approaches; case studies from Germany and South Korea smart city ecosystems that were selected and applied against the behavioral model; and finally, desktop research (behavioral model) performed for smart city project development. As a result, the authors recognized key variables for deriving a possible successful behavioral model as a suggested efficient framework for further smart city strategic projects. Researchers developed and tested, with two validated examples, the suggested behavioral model for smart city projects with a focus on the transportation industry. Results of this survey could help stakeholders in different countries analyze factors influencing decision-making processes and adopt smart city projects to local business environments.

1. Introduction

Nowadays, the progress of technological advances allows researchers to create different innovation concepts, which simplify daily human routines and become a part of the ecosystem life chain. Different innovative concepts are also designed to solve the appropriate modern problems humanity faces [1]. Investment in smart cities is all about making it easier, safer, and better to live in these cities, and connected transport is key to this. It allows city managers to focus on meeting passenger expectations with digital technology that helps both riders and transport operators [1]. In this case, the smart city idea was put forward for further implementation around the world, because it helps to improve the efficiency of urban resources, infrastructure, and service management by providing citizens with comfortable living conditions. Since each city’s assets include a wide range of departments to control, smart transport and smart energy aspects have been recognized as the first of these to achieve higher levels of territorial development [2], so that other fields of government can receive stable long-term financing projects to address each urban challenge.
In 2006, Cisco corporation launched the Connected Urban Development program in cooperation with the cities of Amsterdam, San Francisco, and Seoul, aimed to increase the efficiency of urban infrastructure using digital technologies. Three years later, in 2008, IBM corporation developed new urban planning projects as part of the Smart Planet initiative that could cope with the growing population and provide it with a high standard of living. In 2021, the annual IMD-SUTD Smart City Index (SCI) [3] already evaluated 118 cities using economic and technological indicators, as well as citizens’ opinions on how smart their cities were developed. Singapore, Zurich, and Oslo were ranked first, second, and third respectively [4].
Due to the wide diversity of smart city projects implemented nowadays, the precise definition of a “smart city” may vary depending on the scientific researcher or author of the Smart city concept. For example, IMD-SUTD SCI experts provide a definition of an “urban setting that applies technology to enhance the benefits and diminish the shortcomings of urbanization for its citizens” [4]. This quote reflects four main “smart” factors covered by Deakin M. and Waer H. (2011) [4]: “sufficient implementation of electronic and digital gadgets, widespread of information and communication technologies (ICT) to enhance a daily life and working environment for people within a covered area; introduction of ICT functions to government systems; territorializing of ICT and people in order to improve the chain of innovation and knowledge united together”. As a distinct part of the modern ICT technology process, possessed by cities, best-in-class marketing organizations (BICs) represent big data collection, the internet of things (IoT), and cloud computing to engage physical infrastructure, local governance, and citizens to respond to the upcoming changes through data analytic (DA) facilities that enclose the ecosystem of listed devices [4].
The latest discussions and trends in the application of advanced technologies in transportation projects of smart city concepts have experienced rapid growth. The Intelligent Transportation System (ITS) can fundamentally change the way people travel in smart cities and metro systems. In offering multiple transport modes, developed infrastructure, traffic, and connectivity management strategies, ITS presents a better solution [5]. The Internet of Things (IoT) implies that it is possible to link all individuals and objects across networks. These extensive channels could affect various areas of our day-to-day driving, such as route design, emergency preparedness, and security [6]. Big data are used to save traffic and ease congestion by assisting in traffic analysis and planning. Sensors built on transportation systems and fast vehicles help firms to gather streams of data from transportation agencies [7].
The latest study in October 2022 performed a foresight exercise on emerging trends in European smart cities, transport, and energy in urban settings with the participation of 120 experts using a Delphi-method survey [8]. The results revealed mostly probable trends to come true until 2030 year (Table 1).
The understanding of emerging trends mentioned above in smart city concepts help governments and enterprises to arrange successful strategies. If well connected with inclusive growth objectives, smart city tools and applications can offer a powerful tool to support the shift from in-person to remote-service delivery, mitigate the fallout of the crisis on urban residents and businesses, including the most vulnerable ones, and empower new forms of local governance. Even though these future expectations have a strong impact on smart city understanding based on the perspective of future road-map creation, population growth, urbanization, and migration remain smart city transportation systems that are still the first to be prioritized (World bank record, 2020) [9]. According to the US Department of Transportation, “Intelligent Transportation Systems (ITS) apply a variety of technologies to monitor, evaluate, and manage transportation systems to enhance efficiency and safety” [10]. Therefore, the current goal of a transportation system is not the delivery, but also the sufficient smart usage of resources required. Therefore, high mobility and traffic congestion could be considered the main challenge to face.
Many cities in developed countries develop both advanced and efficient digital ecosystems for transportation to operate the source movement process. For example, in Hamburg (Germany), citizens use a phone application to track their current location and match it to available buses and trains around. Helsinki (Finland) has WHIM—a mobility application that integrates public transport access with bike and car-sharing services. Copenhagen (Denmark) developed adaptive traffic lights to reduce bus travel by up to 20% [11]. Comparatively, in the Asian region, South Korea launched an AI-driven traffic prediction solution that analyzes traffic patterns and predicts traffic conditions for drivers, giving them optimized data for quick decisions [12].
Solutions mentioned above reflect the idea of smart cities worldwide relying on masses of information generated within the created eco-cycle of a digital transportation environment. As a part of the smart city, smart transportation and smart mobility efficiency rely on ICT and its byproduct value: information provided by the government, manufacturers, and companies with insights to evolve products and services they offer.
This research is focused on studying smart city cases of South Korean and German economies with a focus on problems and perspectives of transportation system implementation. The aim of the study was to understand the similarities and differences within the application of a smart city transportation strategy between two countries (regions) and define key variables for deriving the possible success behavioral model of further projects in the scope of the smart city concept. This survey was based on the hypothesis that “fixed and variable parameters of behavioral models have a strong impact on the efficiency of project implementation and depend on the period of a project’s implementation and flexibility of the smart city ecosystem”. Research questions supporting the hypothesis are discussed in Section 3 “Methodology”.

2. Literature Review: Smart City Concept Development and Related Work

The basic theory of the smart city described by Yun and Lee (2019) consists of industry as a production element, people as a consuming element, and a government itself with a circulation body [13]. Three of them create a one-unique space for live and living purposes. However, the city has been described as a consumption subject only, and a real smart city idea could generate more than 60% of its GDP in value creation from a production viewpoint [14]. The 4th industrial revolution also pushed the smart city concept further to overview a simple smart city model to an operating platform or operation system (OS) from online to offline network cooperation.
The collection of data, analytics, communication, and action are the four basement steps in smart city projects fostering the sustainability of urban transport network management, security, public services, energy and water rationalization, waste disposal, innovative agriculture, and healthcare [15,16]. Depending on the economic development level of the country and city infrastructure, the basic strategy of the smart city’s main directions may change in a priority order; moreover, appropriate global situations appear, thus making city smart trends transform very often. Apart from environmental emergencies and global air pollution, the humanity fight against Pettit, C. et al. (2018) indicates that the COVID-19 pandemic“ has changed the ways in which leaders and citizens of smart cities view the challenges ahead” [17]. The research of Dipak and Aithal (2021) shows that smart city priorities have changed to focus on building smart healthcare facilities, and services mention “virtual doctor”, “smart isolation wards”, “smart medicare”, and transportation areas [18], etc. At the same time, an analysis of the latest trends in a smart city in 2022 by Šulyová and Kubina (2022) revealed the preference for social aspects based on technology for improving smart transportation strategies [19]. The figure scale determines a centrist orientation towards citizens, data management, transparency, and cyber security with a higher frequency of demand among occurrence in the articles of different experts and consulting companies that they looked through using the Web of Science and Scopus databases (Figure 1).
Among the research works aimed at analyzing the evolution of the smart city concept, B. Cohen (2015) divides the smart city projects into smart city 1.0, smart city 2.0, and smart city 3.0 steps as progress from businesses that supply technology and knowledge to the government, who decides relevant city solutions for citizen co-creation as a result of the last transformation point of the smart city trajectory [21] (Figure 2).
The Smart Cities Wheel developed by Boyd Cohen and Rob Adams in 2012 shows how the technology and innovation can help cities get smarter. It views the city following the top-down approach (Figure 3) [21,22]. The smart city model presented with Cohen’s wheel was rethought regarding what to measure and how to make cities better.
Unlike B. Cohen, evolutionary direction designed by Eggers D. and Skowron J. in 2016 [23,24] split it into infrastructure and human-centered design with digitalization and data technologies united together for the best synergy in the decision-making process (Figure 4).
Many commentators argue that advances in information technology open up the potential for decision making and problem solving to take place more collaboratively between government and citizens. An approach that is becoming common within IT projects is to include research into the perspectives and experience of existing and potential users of products, services, and systems into their design (Gutierrez et al., 2019) [25].
Hwang J. (2016) on other hand sees the evolution as a five-step perspective. The first step concentrates on the transportation system [26]. The second step presents tasks and service integration in a vertical connection grid. The third step follows data and intelligential steps in a horizontal connection grid. During the fourth step, the city becomes a platform as a cycled system with natural data sharing processes. The last, fifth step presents the city of the future with an intelligent society and different city institutions replaced by artificial intelligence forces (Figure 5).
Combining the wide range of approaches and relevant data, Lee M. et al. in 2018 show an exact case of smart city evolution to self-organize smart city 4.0 from the perspective of open innovation as a step to be implemented today [27]. However, new studies (2021) already have proposed Smart City 5.0 as an urban ecosystem of smart services based on a decision-making digital platform. The same concept follows the research (2022) on the smart city technology in the super-intellectual society 5.0 with megaprojects in cyber-structured deep penetration into the world (Table 2).
To follow the Smart city 5.0 concept, major smart cities still have to start from both mobility and environmental essentials, because urban sustainability and connectivity are the core basics for cyber-perspectives. Therefore, the success of being in-time-developed depends on the correct start with smart transportation projects as it is one of the most prioritized Smart city units to create a formula to measure the intensity of project development in the future with relation to investors, government, and technology business. This research presents an analysis of smart city projects in the transportation field based on example of two well developed countries: Germany and South Korea [30].

3. Methodology

Scope of the Research and Applicable Methods

This research focused on a behavioral model as a significant tangible enabler for smart city plans and initiatives across the Asian and EU regions as per transportation projects. This study aimed to create a behavioral model to serve as a planning tool for policymakers, planners, and implementers of transportation initiatives in smart cities. The paper discusses the validity of the proposed model framework for fostering the diffusion of a successful smart city transformation in general and particularly within the transportation industry. The researchers recognized key variables for deriving the possible success of the behavioral model as a suggested efficient framework for further smart city strategic projects.
The practical framework is verified by three different methods: 1. literature review—to give a speculative understanding of current smart city approaches; 2. case studies of the Germany and South Korea smart city transportation ecosystems—which were selected and applied against the behavioral model; 3. desktop research (behavioral model)—performed for smart city project development with defining key variables. This study contributes to the conceptual and practical body of research on smart cities through four different aspects:
  • This study analyzes several project efforts that support the ultimate implementation goals of smart cities to identify key parameters (both fixed and variable) to provide a framework for the deployment of smart cities
  • This study develops a conceptual framework (behavioral model) for the effective planning and implementation of smart cities.
  • To test and validate the suggested model, this paper offers two case studies from Germany and South Korea to illustrate the applicability of the proposed framework developed. The main scenarios, projects, and practices of the smart city initiative are considered and identified.
To achieve its findings, this study designed and used a hybrid research methodology that collected data from various sources and then consolidated each data analysis technique into a holistic approach.
Hypothesis 1 and research questions (3):
Hypothesis 1. 
Fixed and variable parameters of the behavioral model have a strong impact on the efficiency of project implementation and depend on the period of a project’s implementation and flexibility of a smart city ecosystem.
RQ 1. What are the current theoretical and practical smart city approaches?
RQ 2. How to define the fixed and variable parameters of a smart city project?
RQ 3. How do schematic approaches help to visualize the interaction between variables and the model’s behavior during the development of the smart city project?
Limitation of the research: period of the quantitative survey—6 years (2017–2022), suggested period for model application—5 years; region of the survey—Germany and Korea; industry scope—transportation; there is a risk of different scenarios for behavioral model implications.

4. Survey: Case Study of Smart City Project Development

This study covers two cases of transportation projects with respect to smart city concepts of South Korea and Germany. These countries were chosen based on enriched analytical research. It was found that these countries have a lot of similarities in their smart city strategies and factor analysis; for example, the next steps in their smart city programs will further advance knowledge on the drivers and pitfalls of smart cities, help to better measure smart city performance, and provide targeted support to interested cities and countries to improve the effectiveness of their smart city initiatives [31].

4.1. Case Study of South Korea

Per Lee J.-Y. in 2017 [32] defined smart cities with seven keywords:
  • ICT technologies,
  • Improvement of civil functions;
  • Environment and climate change;
  • Economic growth;
  • Life quality;
  • Civil service;
  • Governance.
Meanwhile, smart mobility can be defined with five key functions:
  • Transportation paradigm change;
  • Sharing–automation–electrification;
  • ICT technologies;
  • Sustainability and safety;
  • Social inclusiveness and quality of life.
The Korean government enacted the Ubiquitous City Construction Act (U-City Act, Ubiquitous City Act) as Act No. 9052 in March 2008, and implemented it in September 2008 [33]. The barrier of the U-City projects in Korea is that they are focused on “new cities and were led by the central government”, which means it was difficult to “present solutions reflecting the characteristics and conditions of established cities or provide user-centered transportation services for city members”. Although local governments have smart city infrastructure compared to other countries abroad, they provide identical services and solutions regardless of the characteristics of the city [33].
Since 2014, the government has changed the nature of the U-City project from a form of building high-tech transportation infrastructure when developing a new city to a low-cost, high-efficiency problem-solving method that links and integrates the functions of the already established high-tech infrastructure [34]. Subsequently, the domestic smart city policy, including the transportation area, was revised to Smart City Creation and the Industrial Promotion Act (Smart City Act) in September 2017 (Figure 6).
The main difference between U-City and Smart City policy focuses on the idea that the latter act creates an urban environment where innovation can take place to solve urban and transportation problems and create new industries, which is shifted from presenting decided items to supporting transportation projects and programs where innovation can operate [36]. Furthermore, the project module, progression party, and information sharing also show distinguishing points. While the U-city was more of top to bottom, central government oriented, and one-way information sharing, the Smart City is bottom to up, open governance, and both-way information sharing in real-time (Table 3).
Referring to the Ministry of Land, Infrastructure, and Transport, the U-City was conducted with 101.7 billion won in research funds for the sixth year from 2007 to 2013, with investments of 75.2 billion won by the government and 26.5 billion won by the private sector, and the Smart City Innovation Growth Engine R&D was conducted with research funds of 131.3 billion won from 2018 to 2022 [37].
Kim, Y. et. al. (2021) categorized 352 U-City services into 11 types, and the top three frequent services were in the order of crime prevention & disaster prevention, transportation, and medical care & welfare, which accounted for almost 50% of all service proportions [38].
According to Choi C. et al. in 2020 Spatial information and information technology are commonly required for the implementation of transportation services, which requires real-time location information on mobility and GNSS, IoT-based information collection technology [12].
The Smart City project is categorized into seven types depending on the regional size, project frequency, project size, budget, and other special characteristics, for example, the creation of a smart city for regional bases and small and medium-sized cities, smart challenge, smart city sandbox, smart city urban regeneration, smart city integration platform, and creative talent promotion project [38]. More detailed information about smart city projects in South Korea can be found in Table A1 (Appendix A).

4.2. Case Study of Germany

Germany is the most populous country in the European Union [39]. However, for a long time, there has been steady growth of the country’s cities, since Germany is one of the leading countries in terms of innovation and economy. The percentage of the population living in cities is about 76%, while by 2050, the population in cities is expected to increase by 70% relative to those who currently live in the country [39]. This is one of the main reasons for the active digitalization and implementation of innovative transportation projects in the country (Figure 7). At the same time, the main priority of the activity is aimed at the use of artificial intelligence in transportation. Thanks to the Internet of Things, networks and mobile technologies are at the core of Germany’s smart city transportation concept. Thus, artificial intelligence is used in all areas of the smart city (transport, logistics and ports, construction, energy, environmental technologies, and management) when creating urban design. Urban design refers to a set of activities to create a smart city in German cities. According to Treude, M. et al. (2022) Germany adheres to the strategy of integrating the Smart City into existing concepts for the development of transportation industries; that is, nothing is created from scratch and existing models are being developed and improved [40].
It should be noted that Germany uses not only the concept of the Smart City to describe its strategy, but also the Digitalization approach, while some members of the German administration (mainly Hamburg) prefer to avoid the term “smart city” due to the negative understanding of this term among the population, and refer to the relevant plans as a digitalization strategy. This aspect fully determines the main development of the concept of the digitalization and improvement of German cities.
In 2012, the European Commission responded to the international Smart City movement by creating the European Innovation Partnership for Smart Cities and Communities (also known as the Smart Cities Initiative). There was a focus on improving the structure of cities and introducing an integrated system between regions. For example, in 2013, the first Berlin-focused smart city strategy was published in Germany. This concept was focused on the environmental friendliness of cities and the impact of the environment on the strategy of urban development [42].
Later, the focus shifted to the complete digitalization of all city activities and a strategy for the unified digitalization of society, and all of its aspects began development. Nowadays, Germany has several cities with focuses on project implementation. At the same time, each of these cities is aimed at developing one of the priority areas of Germany’s Smart City. With the support from the government, local authorities in the regions are launching their own smart city projects together with the private sectors, utilities and universities, and other organizations. Various platforms are being created that allow for the delivery of a range of administrative, political, and social services through communication technologies and geographic information systems. These systems make it possible to integrate the development network of digitalization projects and combine different directions and one concept, the parts of which interact with each other, and give feedback. Among the smart cities in Germany that have the main power are: Berlin (the goal is to turn Berlin into an urban laboratory where services and products of the future are created with the help of universities and research centers; the focus is on the development of smart homes and networks); Freiheim (the focus is on energy-saving innovations); Manheim (creation of an intelligent energy system that allows you to control electricity consumption); Hamburg (pilot projects in the field of intelligent traffic and street lighting, infrastructure monitoring, and virtual services for citizens); Stuttgart (development of e-mobility services). As a consequence, smart cities in this sense are smart region accelerators [43].
Nowadays, Germany is promoting the ideas of digitalization in the aggregate orientation of cities with respect to the main prospects for their development. The revenue and growth of the German smart city markets from transport and logistics is growing by 1 billion euros annually [44]. In 2020, the Federal Minister of the Interior of Germany announced a decision on large-scale funding for the transport industry and the creation of a transport ecosystem. Investments in the transport industry amounted to 1250 billion euros [44]. At the same time, projects for the implementation of a smart city in the field of transport will be divided into five stages, which consist of initiating the very concept and goals, discussing ideas, and direct implementation of the project. The most important areas are investments in public transport and intelligent traffic systems, electromobility, electric vehicle charging infrastructure, and autonomous driving. For more detailed information about smart city projects in South Korea, please see Table A2 (Appendix A) [44].
According to Smart City Index (SCI) of 2022, Berlin, Hamburg, and Nuremberg are the top three cities targeted for smart city transport in Germany. The assessment of this index takes place annually and allows for the identification of the main directions of the smart city concept in Germany.
Thus, Germany is a country that strives to organize smart city transportation projects into a single collaboration concept to identify opportunities and challenges in order to maintain competitiveness. Investments in the transportation industry show that Germany is aiming to expand the transportation network in order to improve the innovativeness of the state and social system.

5. Results (Modeling)

The smart city transportation project of each country develops at its own speed, which is determined by certain characteristics of the country that wants and plans to develop such a project. If doing so, the project itself can be considered from the perspective of its performance, which reflects the expected progress and the degree of progress towards the goal and the planned outcome, with the input parameters set. These parameters are possessed by the country as a system. Input parameters provide a smart city system with an environment in which it can develop and achieve results [45].
Such a phenomenon is observed in the stable laws of the kinematics of physics, namely in the process of equal acceleration of the body, where parameters, such as a —acceleration, t —time of movement, V 0 —the initial speed with which the body began to come into this type of movement, set the character of the whole path and movement of the body in the plane and in space. There is an attempt in this research to adapt some formulas from the kinematics of physics to economic and business areas where it should be used for the behavioral model creation process.
After the submission of these parameters, it is possible to calculate the value of the path traveled by the body, which had these input parameters before the immediate beginning of its movement. Moreover, the value of the traversed path depends directly on the input parameters that characterize the movement of the body in a given situation with these specific parameters [46].
Considering that the smart city transportation project requires resources and input parameters that will provide and help predict the development of the project, it is possible to draw up a mathematical model describing the behavior of a smart city project based on the laws of kinematics. To help the smart city transportation project be effective, it is necessary to consider the initial speed and momentum V 0 —parameter, which determines the speed at which a project starts to develop, a set of values that are determined by the country’s ability to implement a smart city transportation project; the planned time to implement the project t —the period of time that the country allocates to the smart city project (indicated in the project plan before the transportation project begins); and the intensity I —with which the project will develop, indicating project progress or project effectiveness. The end result of the project, which is the implementation of the planned project, denotes the indicator H .
In this case, we can construct a mathematical model for consideration to describe its essence and the variables included in the model (Equation (1)):
H = V 0 t + I t 2 2
Considering an average period of a 5-year life cycle of implemented projects, we choose a time interval from 1 to 5 years when developing the presented model. It is possible to take a time value t = 5 years.
Parameters speed V 0 and intensity I are the oriented vectors in the provided mathematical model. This means that they are not only numerical parameters, but they also present the direction of their influence based on the project’s result. If the speed and intensity are directed in one direction, it contributes to more effective project implementation and progress to the final goal (efficiency). The opposite direction of these vectors will hinder the accelerated development of the smart city transportation project. This is because the reverse direction of the speed will slow down the entire project process. The positive direction of speed and intensity allows the project to be implemented at a given pace. The positive direction of speed and intensity are provided by the input parameters that contribute to the development of the project. Examples of input positive parameters are: the level of ecosystem innovation of the country, high speed of effective decision-making, developed communication and information network, high resource endowment. The negative direction of these vectors is taken by the set of conditions that hinder the project at all stages of its implementation. These include such factors as a lack of motivation of project implementers, lack of funding and other resources, poor organization, and poor development strategies.
Thus, if the indicators negatively affect the speed or intensity, the vector value is converted into a scalar with a minus sign “−”, which worsens and slows down the project steps itself. If the indicators contribute to the development of the project and its implementation, the vector value is replaced by the scalar without changing the mathematical sign.
Following Formula (1) authors accept the success of the project as 1 and the failure and inefficiency of the actions based on the implementation of the project as 0. In this case, let us assume that Korea H 1 and Germany H 2 have achieved success in the implementation of smart city projects and received the expected result. In this case, H 1   = H 2 = 1.
Thus, we obtain Equation (2):
1 = V 0 t + I t 2 2
Let us express I from Equation (2) to Equation (3):
I = 2 2 V 0 t t 2
Now it is necessary to transform Equation (3) using mathematics into Equation (4):
I = 2 t 2 2 V 0 t = 2 ( 1 t 2 V 0 t )
I —acceleration, intensity of progress of the smart-city project.
Now, move to consider the formula for speed V 0 .
V 0 —speed reflecting the initial energy and potential of the country for the development of the project.
Speed can be represented as the sum of some variables and constants, with variables depending on time (Equation (5)):
V 0 = V c o n s t + i = 1 n K i t
V c o n s t —the sum of the initial constant indicators and those indicators of the country that do not change much from year to year in the period from one to five years. There was small variation in the value of the indicators before the smart city draft was considered. These include: country risk assessment, business climate of the concerned country, and initial fixed investment (dependence on the industry of a smart city, in our case—investments to the transport industry). In this case, we consider that these indicators are not changed much over time and generally depend on the culture of the country, its economy, and its priorities and strategies for the development of various economic fields. We consider that these indicators contribute to the development of the smart city project in the country, as the country tries to use the best resources to implement the planned innovation project. Moreover, we have to mention that the country risk assessment ( C R A ) parameter is measured by levels. The level itself is denoted as a letter, and then, a number is added that describes a country’s sensitivity to risk. Because the larger the number, the more risk-dependent the country, we will use the value as the final value for the calculation 1 C R A . As a result, the direction of the velocity vector is chosen to be positive, that is, correlated with the direction of development of the project during time.
i = 1 n K i t —the sum of variables affecting the intensity and performance of the smart city project. That is, there is a tendency to change the value of indicators over time. It is not a clear statement to the country that a provided indicator will not be changed in five years and allows it to vary over the time allotted for the design of a smart city. In this case, the calculation takes the average values of the indicators. Therefore, the values and directions of the vector are determined by the project owners.
If there is a possibility that the indicator worsens over time, it may negatively affect the outcome of the project and the process; in such a case, K i < 0 . If the change in the indicator is positive for the given period and leads to an increase in efficiency of work on the smart city project, then K i > 0 . The indicators that are changed over time include the Smart Mobility Market Index (SMMI), the volume of the Gross Domestic Product (GDP), and the Global Innovation Index (GII) (all indexes and parameters are explained in Appendix B).
Since the vector signs itself and is revealed when determining the value of the indicator with a positive or negative impact on the project, the vector sign can be omitted. It is considered when placing the meaning of a variable (more or less than “0”).
Thus, summarizing these indicators i = 1 n K i , dependent on time and considering their sign, the result is either a positive or negative accrual of this sum. In turn, if the sum exceeds zero ( i = 1 n K i > 0 ), the rate of speed increases, which means that the country has a large stock of resources and opportunities for effective smart city project implementation. If the sum is less than zero ( i = 1 n K i < 0 ), the total speed of project’s implementation is reduced. This means that the country may face various challenges in the implementation of the smart city project (unstable strategy, lack of resources, high level of uncertainty), and efficiency and effectiveness may also decline.
Thus, substitute the resulting Equation (5) into Equation (6):
I = 2 ( 1 t 2 V c o n s t + i = 1 n K i t t )
By analyzing the resulting Equation (6), it is noticeable that as the subtracted ( V c o n s t + i = 1 n K i t ) increases, the intensity decreases. This means that with the necessary resources and a sustainable financial and innovative position, which are included in the concept of the initial speed, the country does not need to increase the intensity of work for the successful implementation of the project. In this case, using these indicators, the development and implementation of the project are in the set pace, and resources are used to the maximum. Therefore, the country does not need to spend more resources in the process of the project’s development for smart city implementation on time, because the project has already been implemented at an excellent pace with the rational use of resources. When the initial speed is reduced, the intensity value increases. This means that the country needs to accelerate the implementation of the project to successfully complete it on time and without wasting resources, time, and funds. In this case, the initial conditions, in which the country finds itself at the time of the creation of the smart city, the project plan, and the development of the strategy are decisive and significant.
Thus, we have a model for calculating the intensity and efficiency of the process of implementing a smart city project. Calculating the intensity of a given situation allows us to estimate the rate at which the project is developing and how close it is to the goal and completion. This indicator is necessary when calculating and evaluating the planned time frame for the implementation of the follow-up projects based on a smart city (discussing not only transportation, but also other industries) and analyzing the innovation and attractiveness of the project and the expected results of the project [47,48].
Then, we calculate the intensity with which Korea and Germany will implement the project in order to achieve the results in time using the allocated resources.
Example 1. 
Firstly, we must define the necessary parameters for Korea (Table 4).
Thus, the intensity of implementation of the Smart city in Korea (Equation (7)) is:
I = 2 ( 1 5 2 0.5 + 1 + 1.75 + ( 59.3 + 90.19 + 1798.53 ) · 5 5 ) = 3897.26   b i l l . $ y e a r
Example 2. 
The next step is a valuation of the same parameters for Germany (Table 5).
The intensity of implementation of the Smart city in Germany is Equation (8):
I = 2 ( 1 5 2 0.333 + 1 + 24.29 + ( 57.3 + 97.43 + 4223.12 ) · 5 5 ) = 8526.6692   b i l l . $ y e a r
By comparing the results by Equations (7) and (8), it can be concluded that the lower the intensity, the faster the country can develop a smart city project. The negative sign means that the country has the resources to properly develop the project. The more given stock, the better the smart city ecosystem conditions. At the same time, Germany has a better position than Korea because of more “permissible conditions”. The scale of intensity can be presented from plus to minus, and the highest parameter of the value considers the higher number of resources that the country needs to implement the project at the desired pace and to achieve the intended result. The lower level of the value considers the allocated resources that the country can manage and implement into the project (Figure 8).
These results confirm the high level of development of Germany and Korea and their high level of innovation and productivity in terms of the smart city transport industry projects. Both countries have a large stock with which they can regulate the project intensity. Thus, the presented model can describe the intensity of a country not only in the variform sector of a smart city, but also in other directions, which will require different investment values for a particular industry and the recalculation of parameters.

6. Discussion

As it was found and justified, the result of the smart city project can be represented by the following Equation (9):
H = V 0 t + I t 2 2
Aside from the situation, we considered that the success of the project is 1, and the failure and inefficiency of the actions based on the implementation of the project is 0; it is also necessary to consider the process in which representatives of project implementers should use this model to find the result itself, that is, not only to assess the actual success or failure of the project, but perform a numerical calculation of the result, which will be determined by the input parameters for the country. Thus, the higher the value of parameter H , the more efficient the project is and the better the result of the Smart City; the more competitive the project is at the international level, the possibility of comparing the result with the result of another country based on this model appears. In this case, the considering condition (10) is:
H 1 H 2 1
It is useful to divide the time period t into small time intervals d t . That is, all time intervals d t add up to the time interval t . Note that the time period d t is very shallow, at which we consider the function for the performance of H , given the time parameters.
Thus, using the d t -time intergang rule and Equation (11) to find the project result, we get the equation:
H = t 2 t 1 ( V 0 t + I t 2 2 ) d t
where t 1 and t 2 comprise the expected interval of project implementation.
In this case, consider the integral (12) using mathematic rules:
H = t 2 t 1 V 0 t d t + t 2 t 1 I t 2 2 d t
Since the speed has a direction that is determined by the initial parameters, the sign of the vector from this indicator can be removed and left as the scalar value, because the speed is directed towards the development of the project. Given that the intensity and speed are interconnected and directed in the same direction, the intensity vector can also be removed, but it must be considered that it is directed towards the coordinate system towards the implementation of the project. In this case we get Equation (13):
H = t 2 t 1 V 0 t d t + t 2 t 1 I t 2 2 d t = V 0 t 2 2 | t 1 t 2 + I 2 t 3 3 | t 1 t 2 = 1 2 V 0 t 2 | t 1 t 2 + 1 6 I t 3 | t 1 t 2
Using Equation (14) and rules of the integration of a certain integral with specified variables are:
H = 1 2 V 0 ( t 2 2 t 1 2 ) + 1 6 I ( t 2 3 t 1 3 )
If we substitute the time intervals t 1 and t 2 for the implementation of the project H (which are determined by the country), we will get the dependence of the effectiveness based on the intensity of the project H = H ( I ) .
This dependence shows that the result that a country can achieve in its smart city project in a given period of time (for example, 5 years) directly depends on the equal distribution of resources for the project, the characteristics of the country itself, state economy, and the level of innovations, etc. In this case, the intensity determines the range from the result that the country wants to achieve. Therefore, if the I value is small (it was determined in the main body), the country is spending its resources moderately and moving at a good pace to implement the project on time. The completion of the project is getting closer. However, if the intensity is high, it means that it is necessary to increase the capacity to discharge the project in a set period of time, and the distance to the finished project increases.
This model is focused on forecasting and the analysis of resources and the possibility of implementing the project in time with a fixed position of the country in the world market, its development equations. This is necessary for project stakeholders when planning and allocating funds to a smart city project, especially when it is not only the transport industry, but the implementation of the smart city project in other industries (Figure 9).
The above Figure 9 illustrates the interaction among all variables that determine the outcome of actions for the implementation of the smart city project. The time scale indicates the time period during which a smart city project is to be developed. This is based on a period of one to five years within which the directions of the variables V c o n s t , V 0 , and I are shown.
As described earlier, the velocity vector V c o n s t , which is measured by a country’s fixed totals remains unchanged both before and after the launch of the project, as well as after the end of the reporting period (this is important for future projects and their projections). The vector K i , which is the summary of the variables that change over time, is represented by a curve line, and it is possible to notice the variability of the values of a given vector at any time point within period. As a result, a vector of intensity I can be considered. Intensity is also a vector value, as it can change direction and influence project progress in different ways. Thus, the intensity behavior is determined by the speed values. The distance between the country and the smart city project is determined by the result of the project H .
Finally, the schematic allows us to visualize the interaction of variables and their behavior during the development of the smart city project.

7. Conclusions (Summary)

Through this study, the authors answered research questions and found several results based on the suggested hypothesis:
  • This study analyzed smart city transportation ecosystems in developed countries from Asian and EU regions and found common major influencing factors, such as the economy development level, investment pool, readiness for innovations, and others.
  • The authors researched current smart city approaches and found that most of the strategies are focused on industrial 5.0 perspectives, and this trend has a strong impact on transportation project capacity.
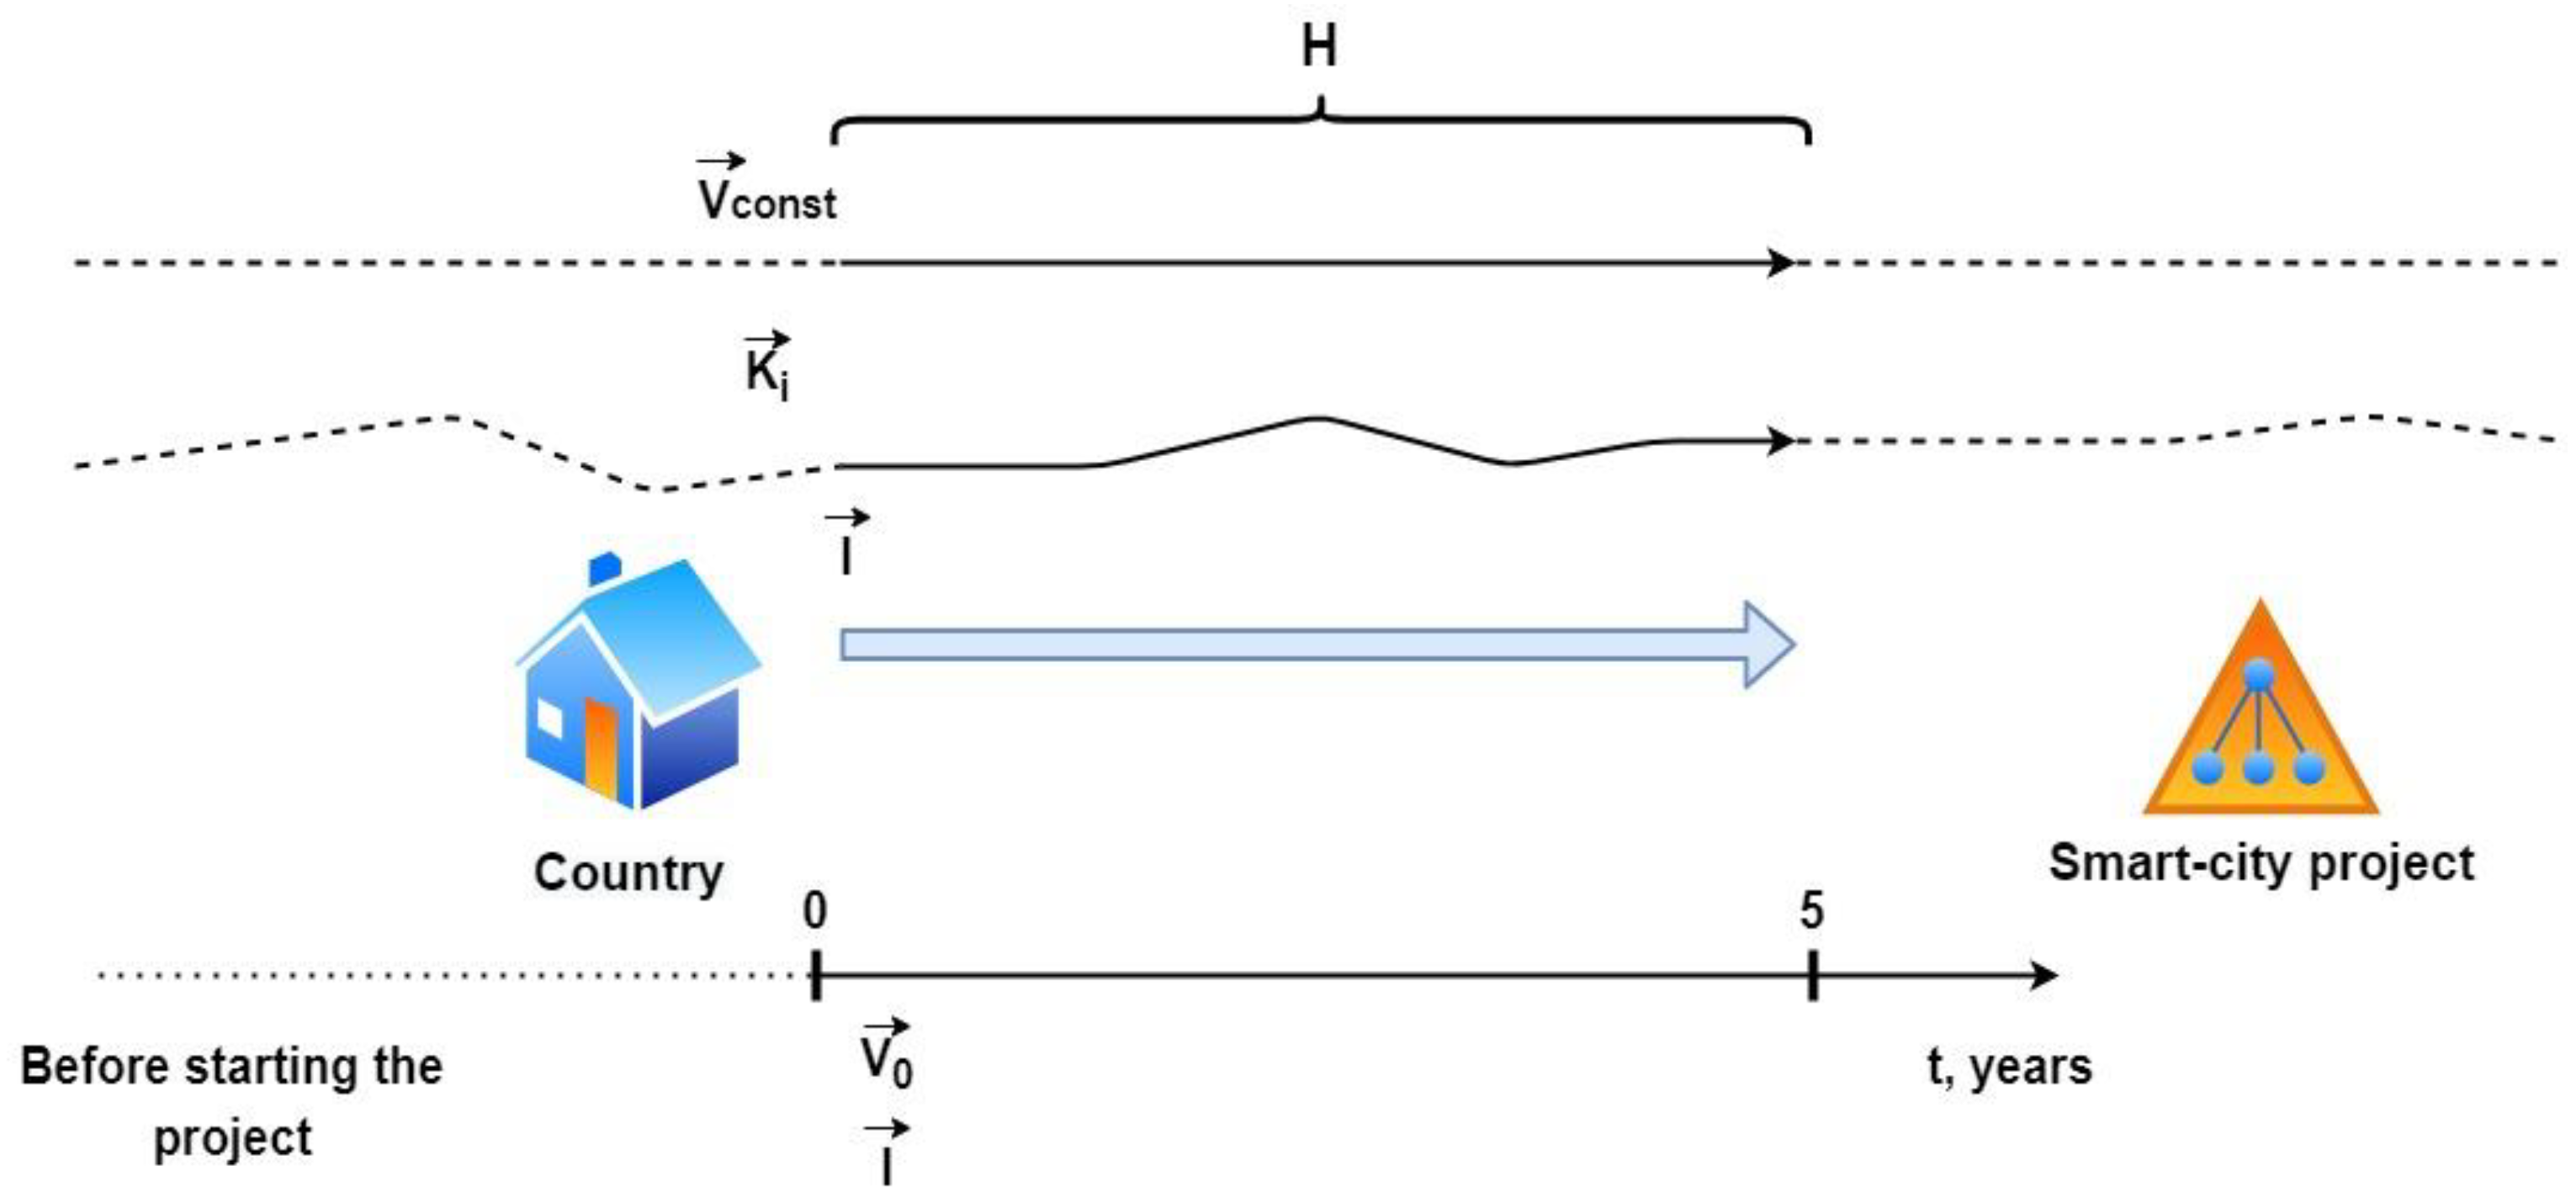
  • The researchers developed and tested, with two validated examples, the suggested behavioral model for smart city projects with focus on the transportation industry. Different scenarios, projects, and practices of the smart city transportation initiative were considered and identified.
  • Among research findings, fixed and variable parameters of the behavioral model were investigated; therefore, the authors noticed that these parameters have a strong impact on the efficiency of transportation project implementation and depend not only on the period of the project’s implementation and flexibility of the smart city ecosystem, but also on the economic environment, global indexes, country’s innovativeness, and other parameters. Therefore, the suggested hypothesis was not only improved but also extended with additional influences.
As should be apparent from the ideas outlined above, business interests in the ideas of design, systems thinking, community engagement, and smart cities are very much interconnected. Some limitations of this survey were investigated as it has been argued that effective design, especially design that is concerned with complex problems, requires community involvement, and smart cities are an example of complex environments that require community involvement in design to achieve effective and impactful results. Therefore, there are main trends and further considerations that are recognized within a smart city concept discussion: the objective, hard data, cybernetic, form tends to create knowledge based on sophisticated models to inform city managers about planning services; more subjective and critical systems-thinking approaches conceive knowledge being created through interactions between people; a more subjective form of systems thinking leads to a more community-focused conceptualization of smart cities, one where definitions of smart cities and the concept of smart communities move closer together.

Author Contributions

Conceptualization, O.S., A.B. and M.V.; methodology, O.S.; software, M.V.; validation, A.B. and M.V.; formal analysis, M.V.; investigation, J.K.; resources, J.K. and A.B.; data curation, O.S., A.B. and M.V.; writing—original draft preparation, O.S., A.B., J.K. and M.V.; writing—review and editing, O.S.; visualization, O.S. and M.V.; supervision, O.S.; project administration, O.S.; funding acquisition, O.S. All authors have read and agreed to the published version of the manuscript.

Funding

This research was supported by an internal research fund for Professors of Korea University of Technology and Education #2022-03-01~2023-02-28 (period of 2022–2023).

Institutional Review Board Statement

Not applicable.

Informed Consent Statement

Not applicable.

Data Availability Statement

Not applicable.

Conflicts of Interest

The authors declare no conflict of interest.

Appendix A

Table A1. Smart city projects in South Korea, 2017–2022 (with forecast until 2026).
Project CategoryProject NamePeriodLocationEstimated Project Budget (KRW)Key Innovation FactorProject Implementer/Constructor
National pilot smart citySejong 5-1 living area2017.07~2021.12Hapgang-ri, Sejong-si1 trillion 4876 billion (in public 9500 billion, private 5376 billion)Mobility
Healthcare
Education and jobs
Energy and environment
Governance
Culture and shopping
Life and safety
Ministry of Land, Infrastructure, and Transport
LH
K-Water
National pilot smart cityBusan Eco Delta Smart City2019~2023Gangseo-gu, Busan2.2 trillion (public 1.45 trillion, private 0.76 trillion)Space planning for New Smart Growth City
Smart City 3 platform based on technology
“10 innovation service” that adds value to citizens’ lives
Ministry of Land, Infrastructure, and Transport
Busan
K-water
Busan Metropolitan Corporation
Creation of a regional base smart cityE100 Creation of an energy-independent smart city for carbon neutrality2022–2024Gwangju Metropolitan City240 billion won (5:5 matching of national and local expenses).Mobility
Energy
Green
AI
Ministry of Land, Infrastructure and Transport
Gwangju
Creation of a regional base smart cityCitizens’ participatory carbon-neutral city development project2022–2024Changwon, Gyeongnam240 billion won (5:5 matching of national and local expenses)Eco-friendly Living Space
Green Mobility Circular economy
Smart Transportation
Ministry of Land, Infrastructure, and Transport
Changwon
Creation of a regional base smart cityEco-friendly, renewable energy-based new urban tourism, and leisure smart city creation2022–2024Haenam-gun, Jeollanam-240 billion won (5:5 matching of national and local expenses)Regional economic foundation centered on smart service and balanced national development
Eco-friendly mobility
Ministry of Land, Infrastructure, and Transport
Haenam-gun
Creation of a regional base smart cityCreation of a smart work city for the revitalization of a city with a depopulated local population2022–2024Hoengseong-gun, Gangwon-do240 billion won (5:5 matching of national and local expenses)Expansion of convenient services
Strengthening regional competitiveness
Ministry of Land, Infrastructure, and Transport
Hoengseong-gun
Smart City ChallengeAI-based city transportation service2021.04–2022Daegu Metropolitan CityPreliminary: 215 billion won, Main: 200 billion (50% of local expenses) Real-time traffic navigation
AI-based signal control
Ministry of Land, Infrastructure, and Transport
Daegu Metropolitan City
Emotion
EMG
KAIST
Kakao Mobility
MJVT
Continentals
Smart City ChallengeRealization of a citizen-participating zero carbon city2021.04–2023Chuncheon, GangwonPreliminary: 215 billion won, main: 200 billion (50% of local expenses) Linking individual eco-friendly efforts and mobility sharing services with the carbon credit revenue structure
Provides carbon saving points
Ministry of Land, Infrastructure, and Transport
City of ChunCheon Kangwon National University
NRIC
KT
Motovelo
GATI
KEVC
NAMO
KOLED
Smart City ChallengeSmart emergency medical care and autonomous driving mobility service2021.04–2024ChungcheongbukdoPreliminary: 215 billion won, main: 200 billion (50% of local expenses) Smart Energy and Smart Life Automatically classifies patient severity, selects a transfer hospital, provides remote emergency medical guidance
Increase convenience in mobility—autonomous driving shuttle
Ministry of Land, Infrastructure and Transport
ChungCheongbukdo
Springcloud
CheongJu University
Daechang Motors
KB bank
Smart City ChallengeRoad safety and transportation services that are convenient for citizens2021.04–2025Pohang, GyeongbukPreliminary: 215 billion won, main: 200 billion (50% of local expenses) Internet of Things (IoT) sensors to traffic light Ministry of Land, Infrastructure and Transport
Pohang City
H Energy
PM grow
ioCrops
NeuroSense
MHE
NC-and
Smart City Urban Regeneration Jemulpo Station.J2022–2026Michuhol-gu, Incheon646.71 billion won (228 billion of local expense)Smart Village Platform
Smart Media Platform
Creating a smart residential environment
Ministry of Land, Infrastructure and Transport
Incheon
Smart City Urban Regeneration The center of Tamna, the gateway to Jeju, Yongdam Urban Regeneration2022–2025Jeju City, Jeju Special Self-Governing Province373.60 billion won (80 billion of local expense)Jeju Northern Region Smart Regeneration-based Service
Problem-solving smart village environment service
Jeju Northern Region Smart Regeneration-based Service
Problem-solving smart village environment service
Ministry of Land, Infrastructure and Transport
Jeju
Creative Talent Promote Project Smart City Innovative Human Resources Development Project 2019–2023Seoul University
Sungkyunkwan University
Yonsei University
Seoul National University
Pusan National University
KAIST
17.4 billion won annuallySatisfaction of high-quality manpower in industry
Fostering experts
Strengthening trainees’ practical capabilities Establishing a Smart City Research Foundation
KAIA (by 2023)
Table A2. Projects for the implementation of smart city in the transport industry in Germany.
Innovative DirectionImplementation Path
Transport network consolidationCombining traffic lights into a special network that allows it to signal a traffic light to change color when public transport approaches to control traffic congestion.
The interaction of traffic lights and personal transport through the signaling of the flow density (considering the fact that more people go to the city in the morning than leave it).
Traffic lights are programmed to optimize traffic flow.
Optimization of digital mobility (transport sector)Holding international conferences of intelligent transport systems to discuss future strategies and share experiences.
Integration between drivers and traffic lights at the level of informing about the change of color of the traffic light in advance of the intersection, or crossing in order to minimize accidents.
Creation of a public transport ecosystemA single online platform where not only the options for the route from A to B are shown, but there is also an ability to pay for travel and register—the focus is on rail transport.
Digital city modelUsing research centers, the creation of a digital model of the city, which allows us to see exactly where people spend their time most often and why. Those who want to build a new facility can set their parameters to the digital model program and find out where it is better, more convenient, and more profitable to build a store, hospital, etc.
This system allows users to analyze the efficiency of using public transport and identify the need to reduce or increase the interval of public transport for the comfortable movement of citizens.
Environmental friendliness of transportElectric vehicles and electric buses to reduce environmental emissions. Germany is expected to have one million new charging stations installed by 2030.
Creation of a platform through which any type of vehicle could be rented, track its condition, book it, and see reviews and information about previous users.

Appendix B. Indicators and Their Meaning

Country risk assessment (CRA)—a «country risk analysis, is the process of determining a nation’s ability to transfer payments. It considers political, economic, and social factors and is used to help organizations make strategic decisions when conducting business in a country with excessive risk». The scale designed by COFACE is divided into A1—very low, A2—low, A3—satisfactory, A4—reasonable, B—fairly high, C—high, D—very high, and E—extreme. We take A1 as 1, A2 as 2, A3 as 3, A4 as 4, B as 5, C as 6, D as 7, and E as 8, respectively.
Business Climate (BC)—a set of external (not dependent on the firm) conditions of entrepreneurial activity that determines the production and investment decisions of firms/entrepreneurs. The scale designed by COFACE is divided into A1—very low, A2—low, A3—satisfactory, A4—reasonable, B—fairly high, C—high, D—very high, and E—extreme. We take A1 as 1, A2 as 2, A3 as 3, A4 as 4, B as 5, C as 6, D as 7, and E as 8, respectively.
Initial fixed investment on transport or transport budget (billion dollars)—a key determinant of performance in the transport sector.
Smart City Mobility Index (SCMI)—evaluation of the innovation level of mobility for each area with focus on three main indicators: innovative parking solutions, the overall traffic management system, and how clean transport is in each location.
Global innovation index (GII)—an annual ranking of countries by their capacity for, and success in innovation, published by the World Intellectual Property Organization. ()
Gross domestic production (GDP) (billion US dollars)—a monetary measure of the market value of all the final goods and services produced and sold (not resold) in a specific time period by countries.

References

  1. Eskelinen, J. A Global Review of Smart City Strategies, Global Review, UK. 2017. Available online: https://www.arup.com/perspectives/publications/research/section/smart-city-strategies-a-global-review (accessed on 25 November 2022).
  2. International Institute for Management Development. Data Shows Effects of COVID-19 and Climate Change on Citizens’ Perceptions of How ‘Smart’ Their Cities Are. Available online: https://www.imd.org/news/updates/data-shows-effects-of-covid-and-climate-change-on-citizens-perceptions-of-how-smart-their-cities-are/ (accessed on 11 November 2022).
  3. Vision Edge Marketing. Available online: https://visionedgemarketing.com/bic-analytics-mastery/ (accessed on 26 November 2022).
  4. Deakin, M.; Waer, H. From intelligent to smart cities. Intell. Build. Int. J. 2011, 3, 140–152. [Google Scholar] [CrossRef]
  5. Sharma, A.; Podoplelova, E.; Shapovalov, G.; Tselykh, A.; Tselykh, A. Sustainable Smart Cities: Convergence of Artificial Intelligence and Blockchain. Sustainability 2021, 13, 13076. [Google Scholar] [CrossRef]
  6. Prashant, S.; Zeinab, E.; Vamshi, K.M.; Junayed, P.; Dulebenets, M.A. Internet of Things for sustainable railway transportation: Past, present, and future. Clean. Logist. Supply Chain 2022, 4, 100–165. [Google Scholar]
  7. Kong, X.; Wu, Y.; Wang, H.; Xia, F. Edge Computing for Internet of Everything: A Survey. IEEE Internet Things J. 2022, 9, 23472–23485. [Google Scholar] [CrossRef]
  8. Kim, J.H. Smart city trends: A focus on 5 countries and 15 companies. Cities 2022, 123, 103–551. [Google Scholar] [CrossRef]
  9. World Bank Report 2020. Available online: https://www.worldbank.org/en/about/annual-report (accessed on 20 November 2022).
  10. US Department of Transportation. Available online: https://www.standards.its.dot.gov/ (accessed on 10 October 2022).
  11. Digital Bulletin. Available online: https://medium.com/digital-bulletin/smart-cities-and-the-future-of-transport-c057ce0377b6 (accessed on 1 September 2022).
  12. Choi, C.; Choi, J.; Kim, C.; Lee, D. The Smart City Evolution in South Korea: Findings from Big Data Analytics. J. Asian Financ. Econ. Bus. 2020, 7, 301–311. [Google Scholar] [CrossRef]
  13. Yun, Y.; Lee, M. Smart City 4.0 from the Perspective of Open Innovation. J. Open Innov. Technol. Mark. Complex. 2019, 5, 92. [Google Scholar] [CrossRef] [Green Version]
  14. Correia, D.; Teixeira, L.; João, M. Study and analysis of the relationship between smart cities and Industry 4.0: A systematic literature review. Int. J. Technol. Manag. Sustain. Dev. 2022, 21, 37–66. [Google Scholar] [CrossRef]
  15. Hollands, R.G. Will the Real Smart City Please Stand Up?: Intelligent, Progressive or Entrepreneurial? Routledge: London, UK, 2020; pp. 179–199. [Google Scholar]
  16. Alsop, T. Smart City Initiative Investment Worldwide in 2018–2023; Statista GmbH: Hamburg, Germany, 2020. [Google Scholar]
  17. Pettit, C.; Bakelmun, A.; Lieske, S.N.; Glackin, S.; Thomson, G.; Shearer, H.; Dia, H.; Newman, P. Planning support systems for smart cities. City Cult. Soc. 2018, 12, 13–24. [Google Scholar] [CrossRef]
  18. Gade; Dipak, S.; Aithal, P.S. Smart Cities Development During and Post COVID-19 Pandemic—A Predictive Analysis. Int. J. Manag. Technol. Soc. Sci. (IJMTS) 2021, 6, 189–202. [Google Scholar]
  19. Šulyová, D.; Kubina, M. Managing Scarce Resources in Smart Cities. Conference: Quaere 2022; Hradec Králové Publisher: Hradec Králové, Czech Republic, 2022; Volume 12. [Google Scholar]
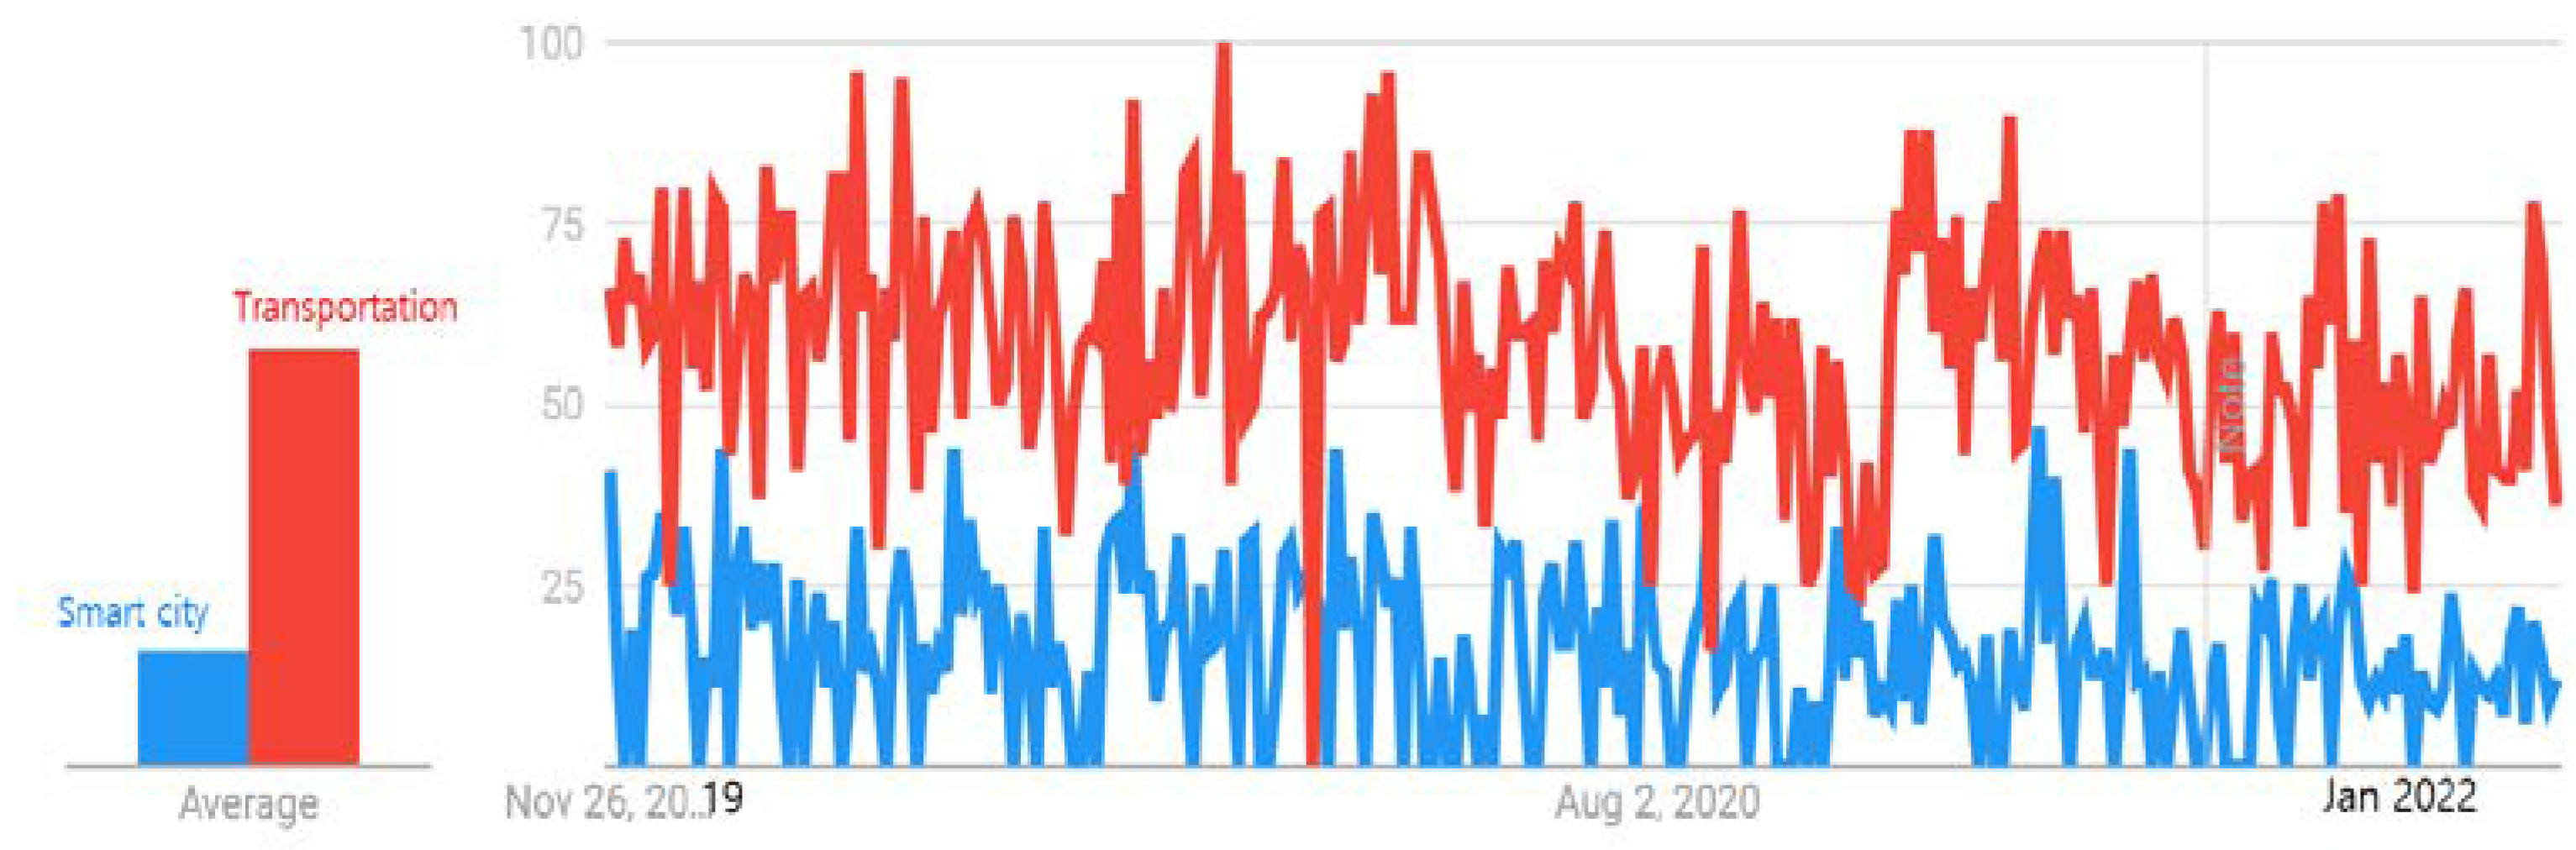
  20. Google Trends. Available online: https://trends.google.com/trends/explore?date=today%205-y&gprop=news&q=Smart%20City%20in%20Korea,Smart%20city%20in%20Germany (accessed on 22 December 2022).
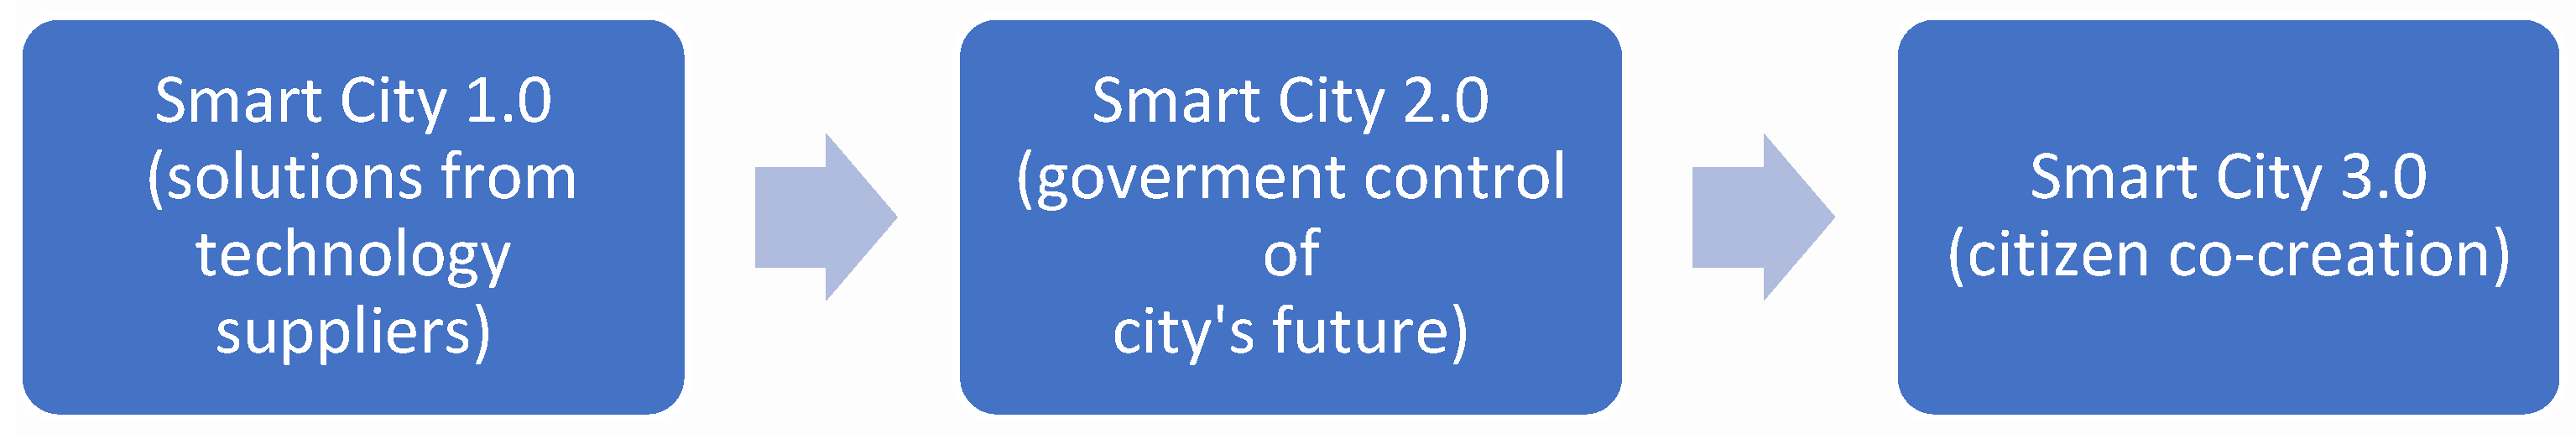
  21. Cohen, B. The 3 Generations of Smart Cities. 2015. Available online: https://www.fastcompany.com/3047795/the-3-generations-of-smart-cities (accessed on 12 November 2022).
  22. Qonita, M.; Giyarsih, S. Smart city assessment using the Boyd Cohen smart city wheel in Salatiga, Indonesia. GeoJournal 2022, 1–14. [Google Scholar] [CrossRef]
  23. Petrova-Antonova, A.; Dessislava, M.; Ilieva, S. Methodological Framework for Digital Transition and Performance Assessment of Smart Cities. In Proceedings of the 2019 4th International Conference on Smart and Sustainable Technologies (SpliTech), Split, Croatia, 18–21 June 2019; pp. 1–6. [Google Scholar]
  24. Eggers, D.; Skowron, J. Forces of change: Smart Cities. 2018. Available online: https://www2.deloitte.com/content/dam/insights/us/articles/4421_Forces-of-change-Smart-cities/DI_Forces-of-change-Smart-cities.pdf (accessed on 19 November 2022).
  25. Gutierrez-Perez, I.; Rowley, M.J.; Lyu, X.; Valadez-Graham, V.; Vallejo, D.M.; Ballesta-Illan, E.; Lopez-Atalaya, J.P.; Kremsky, I.; Caparros, E.; Corces, V.G.; et al. Ecdysone-Induced 3D Chromatin Reorganization Involves Active Enhancers Bound by Pipsqueak and Polycomb. Cell Rep. 2019, 28, 2715–2727. [Google Scholar] [CrossRef] [PubMed]
  26. Hwang, J. Smart City Development Outlook and Korea’s Competitiveness. In IT & Future Strategy; NIA: Seoul, Republic of Korea, 2016. [Google Scholar]
  27. Lee, M.; Ju, K.; Kim, A.; Kim, Y.; Yun, Y.; Jang, A.; Sohn, M.; Lee, M.; Cha, W.; Jung, H. A Policy Study for the Roadmap of the 4th Industrial Revolution; Special Committee on the 4th Industrial Revolution: Seoul, Republic of Korea, 2018. [Google Scholar]
  28. Jeong, H. Current Status and Implications of Smart Cities in Korea No. 792; The Industry Technology Research Centre under the Future Strategy Research Institute of Korea Development Bank (KDB): Seoul, Republic of Korea, 2021.
  29. Presidential Committee on The Fourth Industrial Revolution. 2018. Smart City Promotion Strategy. Available online: https://smartcity.go.kr/en/2018/01/29 (accessed on 22 December 2022).
  30. Ministry of Land, Infrastructure and Transport. Projects, Smart city Korea. 2022. Available online: https://smartcity.go.kr/rd/u-city-rd/ (accessed on 1 October 2022).
  31. Smart Cities and Inclusive Growth. Report. 2020. Available online: https://www.oecd.org/cfe/cities/OECD_Policy_Paper_Smart_Cities_and_Inclusive_Growth.pdf (accessed on 12 December 2022).
  32. Lee, J.-Y. Smart City Related Policy and Issues. Urban Aff. 2017, 52, 26–29. [Google Scholar]
  33. Kim, J.; Kim, T.; Kang, M.; Lee, J.; Choi, C.; Min, J. A Study on the Concept of Smart City and Smart City Transport. In Proceedings of the KOR-KST Conference, Chiang Mai, Thailand, 31 January–3 February 2018; pp. 384–389. [Google Scholar]
  34. Lee, J.; Tak, J.; Kim, S.; Hong, S. A Study on the Demands on Geospatial Information Technology in Smart City Services: Focusing on Transportation. J. Korean Soc. Geospat. Inf. Sci. 2022, 30, 13–21. [Google Scholar]
  35. Google Trends. Available online: https://trends.google.com/trends/explore (accessed on 22 December 2022).
  36. Ministry of Land, Infrastructure and Transport. U-City R&D, Smart city Korea. 2022. Available online: https://smartcity.go.kr/rd/u-city-rd/ (accessed on 1 September 2022).
  37. Smart City in South Korea. Market Intelligence Report 2019. Intralink Limited. Available online: https://www.intralinkgroup.com/Syndication/media/Syndication/Reports/South-Korea_Market-Intelligence-Report_Smart-Cities_Compressed.pdf (accessed on 1 September 2022).
  38. Kim, Y.; Hwang, H.; Choi, H. Impediments to driving smart city: A case study of South Korea. Asian J. Innovation Policy 2021, 10/2, 159–176. [Google Scholar]
  39. Worldometer. European Countries by Population. 2022. Available online: worldometers.info (accessed on 1 August 2022).
  40. Treude, M.; Schüle, R.; Haake, H. Smart Sustainable Cities—Case Study Südwestfalen Germany. Sustainability 2022, 14, 5957. [Google Scholar] [CrossRef]
  41. Google Trends Global 2022. Available online: https://trends.google.com/trends/yis/2022/GLOBAL/ (accessed on 22 December 2022).
  42. Presidential Committee on The Fourth Industrial Revolution, Smart City Promotion Strategy. EU. 2020. Available online: https://www.ellipsis.co.za/wp-content/uploads/2020/10/201023-Report-of-the-Presidential-Commission-on-the-Fourth-Industrial-Revolution.pdf (accessed on 1 December 2022).
  43. The German Smart City Market 2021–2026. EU Report. 2022. Available online: https://international.eco.de/topics/internet-of-things-home/study-the-smart-city-market-in-germany-2021-2026/ (accessed on 1 August 2022).
  44. International Trade Administration. 2022. Available online: https://www.trade.gov/ (accessed on 3 October 2022).
  45. Shvetsova, O.; Tanubamrungsuk, P.; Lee, S.-K. Organization Leadership in the Automobile Industry: Knowledge Management and Intellectual Capital. Open Transp. J. 2021, 15, 16–29. [Google Scholar] [CrossRef]
  46. Shvetsova, O.; Lee, S.-K. Living Labs in University-Industry Cooperation as a Part of Innovation Ecosystem: Case Study of South Korea. Sustain. J. 2021, 13, 5793. [Google Scholar] [CrossRef]
  47. EasyPark Group. Available online: https://easyparkgroup.com/news/the-smart-city-mobility-index/ (accessed on 15 November 2022).
  48. Global Innovation Index. Available online: https://www.globalinnovationindex.org/Home (accessed on 5 September 2022).
Figure 1. Number of newspaper articles about the smart city in South Korea and Germany (2018–2022). Source: Google Trends.: https://trends.google.com/trends/explore (accessed on 22 December 2022) [20].
Processes 11 00048 g001
Figure 2. Smart city concepts. Source: adapted from Qonita, M. and Giyarsih, S., 2022 [22].
Processes 11 00048 g002
Figure 3. Digital transition and performance assessment of smart cities. Reprinted/adapted with permission from Ref [23], 2019, Petrova-Antonova A., Dessislava M. and Ilieva, S.
Processes 11 00048 g003
Figure 4. Smart city projects with focus on human-centered design. Source: made by authors.
Processes 11 00048 g004
Figure 5. Five-step smart city perspective model. Source: made by authors.
Processes 11 00048 g005
Figure 6. Comparison between number of projects in a smart city and transportation in South Korea (2018–2022). Source: Google Trends https://trends.google.com/trends/explore (accessed on 22 December 2022) [35].
Processes 11 00048 g006
Figure 7. Comparison between number of projects in a smart city and transportation in Germany (2018–2022). Source: Google Trends Global 2022. https://trends.google.com/trends/yis/2022/GLOBAL/ (accessed on 22 December 2022) [41].
Processes 11 00048 g007
Figure 8. Visualization of smart city model effectiveness: safety margin and area of risk (South Korea and Germany). Source: made by authors.
Processes 11 00048 g008
Figure 9. Variable interactions within a smart city project outcome determination. Source: made by authors.
Processes 11 00048 g009
Table 1. Emerging trends in smart city infrastructure development, 2021–2023.
Current Megatrends (2022) Expectations (2030)
1. Responding to climate change issues, eliminating air and water pollution 1. Increase in energy prosumers number
2. Market addressing ethical concerns
2. Optimizing urban transport through real-time data analysis3. Intelligent public transport becomes more cost-effective
4. User-centric public services
3. Improving buildings’ energy efficiency5. Small- and medium-sized cities copy already working solutions in big cities
4. Popularization of smart city initiatives among countries and areas6. EU regulatory frameworks addressing privacy and safety
7. Participation of private business in projects
Source: adapted by authors from [8].
Table 2. Smart city concepts (summary) 2018–2022.
Smart City 1.0Smart City 2.0Smart City 3.0Smart City 4.0Smart City 5.0
ConnectivityUntil emergence of PCWired Internet Wireless internet,
IoT
Cloud + Edge blockchain Internet on Everything
HumanFive senses Neural networkBrainBehavior
(life)
Mental
CitySensorsSensors + CommunicationSensors +
Communication + AI
Sensors +
Communication + AI + Citizen
Sensors +
Communication + AI + Citizen + cyberproduction actual data
City size
(size/benefit)
Limited (optimization)ExpansionGiantizationSelf-organizingCyber-interaction/no boundaries
Value Sarnoff’s Law
N
Metcalfe’s Law
N2
Reed’s Law
2n
Source: [28,29].
Table 3. Comparison between U-city and Smart City concepts.
Year/Project ModuleU-City (2008.09–2017.08)Smart City (2017.09–Ongoing)
ConceptFocus on transportation infrastructure and public servicesResolve urban life (including transportation) issues with data of both public and private service
Progression PartyCentral government-oriented (Ministry of Land, Infrastructure, and Transport and LH)Open governance among central government, local government, corporate entities, and citizens
Information SharingOne way with time differenceBoth ways in real-time
Key Projects1. Sangam DMC (2003–2010): RnD center, North-east IT hub, oriented by Seoul.
2. U-Paju (2004–2009): Eco-friendly, industrial complex, information-based venture businesses, oriented by Paju and the Ministry of Land, Infrastructure, and Transport.
3. Digital city (2004–2008):
First digital pilot city of Korea, materialize FTTH based on the government BcN plan, oriented by the Ministry of Land, Infrastructure, and Transport.
1. (Sejong city) 5-1 living area (2017–2021): transport mobility, healthcare
education, jobs, energy and environment, governance,
culture, and shopping
life and safety
2. (Busan city) Eco Delta Smart City (2019–2023): Space and transportation planning for New Smart Growth City
Smart City 3 platform based on technology
10 innovation service that adds value to citizens lives
Source: made by authors.
Table 4. Model parameters for South Korea.
ParameterMeaning
Country risk assessment (level “A”) 1 2
Business climate1
Initial fixed investment, authors suggest one billion dollars (currency dollars-von 2022/11/22: 1 USD = 1354.87 KRW)1.75
Global innovation index59.3 (+)
Smart mobility market index90.19 (+)
The volume of the GDP (billion US dollars)1798.53 (+)
Source: made by authors.
Table 5. Model parameters for Germany.
ParameterMeaning
Country risk assessment (level “A”) 1 3
Business climate1
Initial fixed investment, authors suggest one billion dollars (currency dollars-euro 2022/11/22: 1 USD = 0.97447EUR)24.29
Global innovation index57.3 (−)
Smart mobility market index97.43 (+)
The volume of the GDP (billion US dollars)4223.12 (+)
Source: made by authors.
Disclaimer/Publisher’s Note: The statements, opinions and data contained in all publications are solely those of the individual author(s) and contributor(s) and not of MDPI and/or the editor(s). MDPI and/or the editor(s) disclaim responsibility for any injury to people or property resulting from any ideas, methods, instructions or products referred to in the content.

