1. Introduction
With rapid industrialization and economic development in China, emissions from atmospheric environmental pollution and the decline of environmental quality have become more serious since the country’s reform and opening-up. Since 2012, serious air pollution has occurred in many Chinese cities. The main reason is the excessive emission of environmental air pollutants caused by the excessive concentration of air pollution-intensive industries such as the thermal power industry. Since then, China has introduced a series of policies and measures on air pollution control, especially the five-year action plan on air pollution control. In the fifth year (2017) of the five-year action plan on air pollution control, China used administrative means to shut down a large number of enterprises related to thermal power and other air pollution-intensive industries. Remarkable progress has been made in controlling China’s serious air pollution.
When the 19th National Congress of the Communist Party of China put forward the idea of high-quality economic development, it systematically expounded its concept, key points, and objectives. This became the action guide for the development of air pollution prevention and control in the country. At the root of China’s high-quality economic development is green technological innovation. This paper studies the spatial effect and threshold characteristics of environmental pollution from Thermal power, etc., air pollution-intensive industrial (hereinafter referred to as “TPAPI”) agglomeration within the context of green technological innovation, which can improve the system and mechanism of high-quality economic development in China. Moreover, green technological innovation can ensure the realization of China’s economic sustainable development goals and promote harmonious development between humans and nature in the country.
In view of the above situation, the purpose of this paper is to scientifically find out the main sources of atmospheric pollution in China, correctly analyze the spatial effects and threshold characteristics of China’s green technology innovation on environmental pollution caused by the concentration of air pollution-intensive industries, such the as thermal power industry, and formulate targeted measures to solve the problem for these research purposes, so as to provide help for China to effectively deal with the problem of atmospheric pollution. In the process of achieving the research objectives, many results have been obtained, which contain elements of scientific novelty. Firstly, the air pollution-intensive industry is an important source of sulfur dioxide emissions, and its concentration degree is gradually increasing, resulting in an increase in sulfur dioxide emissions in air pollution-intensive agglomeration areas. Green technology innovation can significantly reduce sulfur dioxide emissions. Green technology innovation has the characteristics of increasing spatial agglomeration in the process of change. Improving the innovation ability of green technology in areas where air pollution intensive industries are concentrated can effectively reduce air pollution. In addition, it has been found through countermeasures and suggestions that China should improve the level of green technology innovation in key concentration areas of air pollution-intensive industries such as the thermal power industry, scientifically adjust the concentration degree of air pollution-intensive industries such as the thermal power industry, and facilitate gradient transfer of air pollution-intensive industries such as the thermal power industry.
The further sections are mainly divided into five parts: the first part, the Literature Review; the second part, the Relevant Parameter Settings; the third part, the Space Model Settings; the fourth part, the Empirical Analysis; and the fifth part, the Conclusion and Policy Implications.
2. Literature Review
Green technology innovation is an important way for industrial development, environment coordination, and sustainable attention. The academic circle has carried out a series of research on the concept connotation and the effect of green technology innovation. Many studies have shown that the agglomeration of polluting industries will increase the environmental pollution pressure in the region where they are located. However, the existing literature focuses on the effect of green technology innovation on the upgrading of polluting industries, and the research on the application of green technology innovation to reduce the negative environmental effects caused by air pollution industry agglomeration is relatively insufficient. It is of great significance to analyze the environmental pollution effect of green technology innovation on TPAPI agglomeration. Based on this, the literature closely related to the issues of this paper mainly consists of three aspects. The first one is about the definition of green technology innovation. The second aspect is the research on green technology innovation and industrial agglomeration. The third aspect is the threshold characteristics of technological innovation on environmental pollution. The current relevant literature is as follows:
2.1. Green Technological Innovation
Green technological innovation is mainly defined from the perspective of innovation characteristics and that of production processes. In terms of innovation characteristics, Hemmelskamp (1997) believes that green technological innovation can prevent or reduce waste emissions and resource use during production, consumption, and recycling processes [
1]. Klassen and Whybark (1999) claimed that green technological innovation is the organic combination of natural and social ecology, through which economic and environmental benefits can be achieved [
2]. In terms of production processes, Sun and Zhang (2018) defined green technology innovation as the technological innovation that can meet the green needs of human beings and reduce the marginal external costs of production and consumption to support sustainable development under the condition of increasing resource and environmental constraints [
3]. Cao (2019) explored the basic connotation, ethical value, and practice path of green technology innovation from the perspective of ethics and believed that green technology innovation is an activity that highlights ecological consciousness, conforms to ecological laws, and follows ecological norms [
4]. Another group of scholars have tried to define it from the perspective of production processes. Yang and Xu (1998) defined green technological innovation from the perspective of innovation decision-making information flow, and technology selection [
5]. They believed that it not only includes hardware, such as pollution control and governance, new energy technology, and energy conservation and emission reduction technological innovation, but also software, namely management methods and operations, such as green management and waste exchange. Koo (2005) defined green technological innovation as new or improved processes, technologies, practices, systems, and products that can prevent and reduce damage [
6]. Yao et al. (2020) believe that green technology innovation is a new technology based on the concept of green development [
7]. By applying green products and green processes to technology research, development, and production, green technology is expected to be realized in all stages of the enterprise life cycle and finally realize the economic, ecological, and social triple benefits.
2.2. Technological Innovation and Industrial Agglomeration
The relevant studies on the impact of technological innovation and industrial agglomeration include industrial agglomeration as an important reason to promote technological innovation. Marshall (1890), the founder of classical economics, stated that in the process of industrial agglomeration, industries share human resources, technical resources, and public facilities, thus reducing the cost of industrial technological innovation and accelerating the dissemination of various resources [
8]. Han et al. (2017) believe that industrial agglomeration plays a significant positive role in promoting technological innovation and has a spatial spill-over effect [
9]. Li (2018) found that it is conducive to the effective allocation of innovation elements and the improvement of technological innovation capacity [
10]. Shi and Li (2019) found that industrial agglomeration had a significant positive impact on technological innovation in the Yangtze River Economic Belt [
11]. When industrial agglomeration makes the local area highly specialized, it will promote continuous technological innovation by local industries. He and Cheng (2019) believe that the economic effect of collaborative agglomeration is more dependent on the level of local technological innovation ability [
12]. Only when the technological innovation ability reaches a certain level is the impact of collaborative agglomeration on regional economic growth positive; if it is lower than this level, collaborative agglomeration will inhibit regional economic growth. Du and Li (2021) believe that in the short term, technological innovation in China’s Yangtze River Delta can promote high-tech industrial agglomeration [
13].
2.3. Threshold Characteristics of Technological Innovation on Environmental Pollution
The relationship between technological innovation and environmental pollution is not single and linear, but rather the non-linear threshold effect. In their analysis of the inverted U-shaped relationship of the environmental Kuznets curve (EKC), Grossman and Kreuger (1991) reported a threshold effect between technological progress and environmental pollution [
14]. They found that technological progress is the key factor that will change the negative relationship between economic growth and environmental pollution to a positive one when the former reaches a certain critical point. Moreover, their analysis highlighted the important role of technological progress in improving environmental quality. Studies have also analyzed the single threshold characteristics between technological innovation and environmental pollution. Zhao et al. (2020) found that technological innovation has a single threshold on environmental pollution [
15]. Chen et al. (2019) discovered that when the level of technological innovation crosses the single threshold, it will greatly improve environmental pollution, and the number of cities with technological innovation below the threshold value will continue to decline [
16]. Liu et al. (2018) took environmental regulation as a threshold variable to build a non-linear threshold model [
17]. Their results showed that when the pollution degree exceeds the stipulated threshold value, the differences in the impact of environmental pollution on technological innovation ability are evident. For example, when the pollution degree changes from medium to high, there is an inverted U-shaped relationship between environmental pollution and technological innovation ability.
Yan and Cheng (2018) used panel data from 11 provinces and cities in the Yangtze River Economic Belt to test the double threshold effect of technological innovation efficiency on environmental pollution [
18]. Their results showed that technological innovation is more conducive to the improvement of environmental pollution when the first threshold is exceeded; however, the ability of technological innovation to improve environmental pollution weakens beyond the second threshold, showing an inverted U-shaped trend. This is mainly because technological innovation derives unexpected output that also affects the environment even though it promotes economic development. Lan and Wang (2019) applied the threshold model to study the threshold effect between environmental regulation intensity and carbon dioxide emission efficiency, as well as the driving effect of technological innovation on carbon emission efficiency [
19]. Zhang (2019) discovered that the impact of industrial agglomeration on environmental pollution will increase at the lower level of technological innovation but will slow down when technological innovation crosses the threshold to a higher level and the impact effect will slow down [
20]. Fan (2021) believes that technological innovation has a single threshold effect on environmental pollution. When the level of technological innovation is less than the threshold value, technological innovation will increase environmental pollution; when it crosses the threshold value, technological innovation will significantly inhibit environmental pollution [
21]. Guo et al. (2022) believe that environmental regulations strengthen the direct inhibition and spillover effect of green innovation on regional environmental pollution, but there is a threshold effect [
22].
To sum up, the literature has examined the relationship between technological innovation and industrial agglomeration, and the threshold effect of technological innovation on environmental pollution. However, studies on the threshold effect of green technological innovation on environmental pollution of TPAPI agglomeration are limited. The further sections are divided into several parts: the setting of relevant parameters in
Section 2, the selection of spatial models in
Section 3, the Empirical Analysis in
Section 4, and the main research Conclusions and Policy Implications in
Section 5. Using the threshold regression model and the spatial Durbin model, this paper aims to investigate the spatial effect and threshold characteristics of green technological innovation on the environmental pollution of TPAPI agglomeration. Using the threshold regression model and the spatial Durbin model, this paper aims to investigate the spatial effect and threshold characteristics of green technological innovation on the environmental pollution of TPAPI agglomeration. This will guide the agglomeration of TPAPI and the scientific innovation of green technology, which can effectively solve the problem of air pollution.
3. Relevant Parameter Settings
3.1. Distribution Concentration Index of TPAPI
TPAPI refers to those that directly or indirectly produce a large number of environmental pollutants during production. Currently, pollution industries can be divided according to the ratio of the pollution control cost of an industry to its total production cost (Tobey, 1990) [
23], the emission scale of pollutants (Becker and Henderson, 2000) [
24], or the amount of pollutants released per unit of output (Mani and Wheeler, 1998) [
25]. This paper comprehensively considers the emission scale and intensity of air pollution industries in China and calculates their air pollution intensity index according to relevant data from 2009, 2011, 2013, and 2015. Since 2015, coal-to-electricity conversion in the non-ferrous metal smelting industry has been vigorously promoted. A large number of cement plants have also been shut down and technological upgrading has been carried out. These factors have contributed to a rapid decrease in emission pollution from these industries, especially in areas with serious air pollution. Thus, this paper selects four industries as TPAPI: (1) electric power and the thermal production and supply industry; (2) the ferrous metal smelting industry; (3) the chemical raw material manufacturing industry; and (4) the petroleum processing and coking industry. The location entropy calculation method of TPAPI is as follows:
3.2. Technological Innovation Index
Green technological innovation is measured by the number of green patent grants in the region. The calculation method for green technological innovation according to Wang and Zhao (2019) [
26] and the Green List of International Patent Classification (WIPO, 2020) [
27] manually collects the data after comparing them individually through the patent information service platform of the China National Intellectual Property Administration. Technological innovation is measured by the number of patent grants in the region. Non-green technological innovation is measured by the number of patents granted in the region minus the number of green patents granted.
4. Space Model Settings
4.1. Definition of the Spatial Durbin Model
In the above Formula (1),
is the emissions of sulfur dioxide,
is the intercept term,
is the spatial weight matrix,
is the technological innovation,
is the green technological innovation,
is the non-green technological innovation,
is the industrial agglomeration index, and lnm1~5 is the control variable matrix.
In the formula, Model (2) is a single-threshold model, and Model (3) is a double-threshold model, where represents the threshold variable matrix, specific location technological innovation, green technological innovation, and non-green technological innovation; is a control variable matrix; represents a threshold value under a single threshold; is the first threshold value of a double threshold; represents the second threshold value of the double threshold; and is a model regression coefficient, and represents a disturbance term.
4.2. Variables and Data Sources
Table 1 below shows the definition and description of each variable.
The data in this paper were obtained from the China Industrial Statistical Yearbook, State Intellectual Property Office, and provincial and municipal statistical yearbooks from 2001 to 2018. Based on the principles of data availability and the easy processing of missing values, the sample size of this study was finally determined to be 540 and the data were analysed using STATA15.0 software. y is a dependent variable, x is a core independent variable, k is a threshold variable, and m is a control variable.
Table 2 gives the descriptive statistics of variables that show the differences in order of magnitude among the variables. The natural logarithm of all the variables was taken and they were winsorized at 95%.
Table 3 presents the descriptive statistics of the variables after taking the natural logarithm and winsorizing them. It can be observed that the variables eliminate the difference of the order of magnitude. This study uses the data to carry out the following threshold regression analysis.
5. Empirical Analysis
5.1. Spatial Heterogeneity Pattern
To further identify the spatial heterogeneity characteristics of pollution-intensive industrial agglomeration and air pollution, the sulfur dioxide index and average number of TPAPI agglomeration were used as critical points. The samples above the average level were high air pollution or high pollution-intensive industrial agglomeration, and those below the average level were low air pollution or low pollution-intensive industrial agglomeration. According to the different levels of air pollution and TPAPI agglomeration, the samples were divided into four groups: (1) high air pollution and high pollution-intensive industrial agglomeration (HH); (2) high air pollution and low pollution-intensive industrial agglomeration (HL); (3) low air pollution and high pollution-intensive industrial agglomeration (LH); and (4) low air pollution and low pollution-intensive industrial agglomeration (LL).
Based on the data found in
Table 4, Guangdong Province belonged to the high air pollution and high pollution-intensive industrial agglomeration type in 2000, but the province belonged to the low air pollution and high pollution-intensive industrial agglomeration type in 2017. The reason may be that Guangdong Province has more investment in green technology innovation, higher levels of green technology innovation, and stronger self-purification of the atmospheric environment; Sichuan Province belonged to the high air pollution and low pollution-intensive industrial agglomeration type in 2000, but the province belonged to the high air pollution and high pollution-intensive industrial agglomeration type in 2017. The reason may be that Sichuan Province has not invested much in green technology innovation due to its long-term extensive development; the Beijing, Shanghai, and Tianjing provinces belonged to the low air pollution and high pollution-intensive industrial agglomeration type in 2000, but the Beijing, Shanghai, and Tianjing provinces belonged to the low air pollution and low pollution-intensive industrial agglomeration type in 2017. The reason may be that these provinces invest more in green technology innovation, have higher levels of green technology innovation, and transfer more air pollution industries. A comparison through the years shows that China’s industrial transfer and technological innovation have led to environmental pollution and industrial agglomeration in a spatial asymmetric pattern since the new century. This implies that industrial agglomeration may have spatial dependence and a threshold effect on sulfur dioxide emissions.
5.2. Global Spatial Autocorrelation Characteristics Analysis Based on Moran’s I
The spatial autocorrelation test results are shown in
Table 5. The findings show that sulfur dioxide usually comes from economic and population activities with significant spatial agglomeration characteristics, such as industrial enterprise emissions, automobile exhaust, and domestic coal consumption, among others. The results of Moran’s I show that the spatial agglomeration characteristics of sulfur dioxide gradually strengthened from 2000 to 2017. Technological innovation, green technological innovation, and non-green technological innovation also showed increasing spatial agglomeration in the process of change, which is mainly due to the diffusion effect of technology. Neighboring areas can effectively reduce sulfur dioxide emissions by learning from the technological innovation within the region. The result of Moran’s I of air pollution-intensive industry agglomeration is significantly positive but shows gradually decreasing characteristics during the research period. This is because local governments have introduced preferential policies such as land, finance, and taxation to attract industries driven by economic development, which leads to the distribution of TPAPI in many provinces and weakens the agglomeration characteristics of TPAPI.
5.3. Analysis Results of the Spatial Durbin Model
The analysis results of the spatial Durbin model are shown in
Table 6. The agglomeration level of air pollution is positively correlated with the emission level of sulfur dioxide, which may be due to large amounts of it being emitted by TPAPI in the production process. With the increase in the agglomeration level, emissions of sulfur dioxide rise rapidly, consequently leading to an increase in regional sulfur dioxide emissions. The level of opening to the outside world has a significant negative correlation contrary to the ‘pollution haven hypothesis’. This idea posits that TPAPI tend to be established in countries or regions with low environmental control intensity. However, the level of China’s sulfur dioxide emissions does not support this view because most of its emissions come from heavy industries, such as power plants and residential coal and chemical plants. These are industries with a concentrated development of state-owned economy and a relatively low proportion of foreign investment. The gross domestic product (GDP) per capita, car ownership per capita, and population density all show significant positive correlations with sulfur dioxide emissions. This indicates that the process of population agglomeration improves economic the development level and people’s living standards, but also aggravates pollution. This shows that China’s economic development is still in the extensive development stage, which is contributing to air pollution and negatively affecting the environment.
Increased energy efficiency can significantly reduce sulfur dioxide emissions, indicating reduced energy use per unit of GDP. Reducing China’s use of coal, which still dominates its energy structure, can significantly decrease sulfur dioxide emissions. Technological innovation and green technological innovation can significantly reduce energy consumption, improve the efficiency of comprehensive utilisation and centralized treatment of pollutants, and reduce sulfur dioxide emission levels by improving production technology.
From the perspective of spatial spill-over, the degree of industrial concentration has a significant negative effect; it is gradually increasing and the trend of industrial differentiation in neighboring regions is becoming more evident. The concentration of TPAPI in a single province may lead to the relative lack of TPAPI in neighboring regions. As a result, sulfur dioxide emissions are increasingly concentrated in a few provinces and relatively reduced in neighboring ones. The spatial spill-over coefficients of GDP per capita and car ownership per capita are positively correlated, suggesting that there are significant spatial diffusion effects in economic development and population flow. Additionally, the diffusion of economic and population elements to neighboring areas is often accompanied by the diffusion of environmental pollution. The spatial spill-over coefficient of the degree of opening to the outside world is significantly positive. This may be because foreign investment is often directed towards labour-intensive industries and is limited to China’s energy industry opening policy, not its industrial fields where sulfur dioxide emissions are concentrated. At the same time, the higher the level of foreign investment, the better the industrial structure of the region will be. Therefore, energy-intensive and environmental pollution industries will be encouraged to move to neighboring areas, resulting in a significantly positive spatial spill-over effect.
5.4. Static Panel Regression Analysis
The static panel regression model presents the mathematical expressions of technological innovation (wlnk1), green technological innovation (wlnk2), and non-green technological innovation (wlnk3).
Table 7 shows the static panel regression results; the regression coefficient of wlnx4 is −0.230, which is less than 0.01 in significance, indicating that wlnx4 and wlny3 present a significant negative relationship and have an inverted U-shaped relationship. The quadratic term of technological innovation (qlnk1) is significant at −0.019; therefore, it presents a significant negative relationship with wlny3 and has an inverted U-shaped relationship. The coefficient of the quadratic term of green technological innovation (qlnk2) is significant at −0.027; therefore, the quadratic term of qlnk2 and wlny3 shows a significant negative relationship with an inverted U-shaped relationship. The coefficient of the quadratic term of non-green technological innovation (qlnk3) is significant at −0.018; therefore, the quadratic term of qlnk3 and wlny3 presents a significant negative relationship with an inverted U-shaped relationship. The results of the static panel regression analysis shows that technological innovation, green technological innovation, and non-green technological innovation may have a threshold effect.
5.5. Threshold Regression Analysis
A self-sampling test was conducted on the threshold effect of the variables k1, k2, and k3. The single threshold effect of green technological innovation (k2) passes the 10% significance test. While the double threshold effect does not, its regression coefficient is significant. Therefore, green technological innovation (k2) has a single threshold characteristic. However, the single threshold effect of technological innovation (k1) and non-green technological innovation (k3) passes the 10% significance test, but their regression coefficients are not significant. Therefore, only the single threshold effect of green technological innovation (k2) is analyzed in
Table 8 below.
Wlnk2 has a single threshold of 8.0523 and a double threshold of 8.2066 and 7.7519, with a 95% confidence interval (CI), as shown in
Table 9 below.
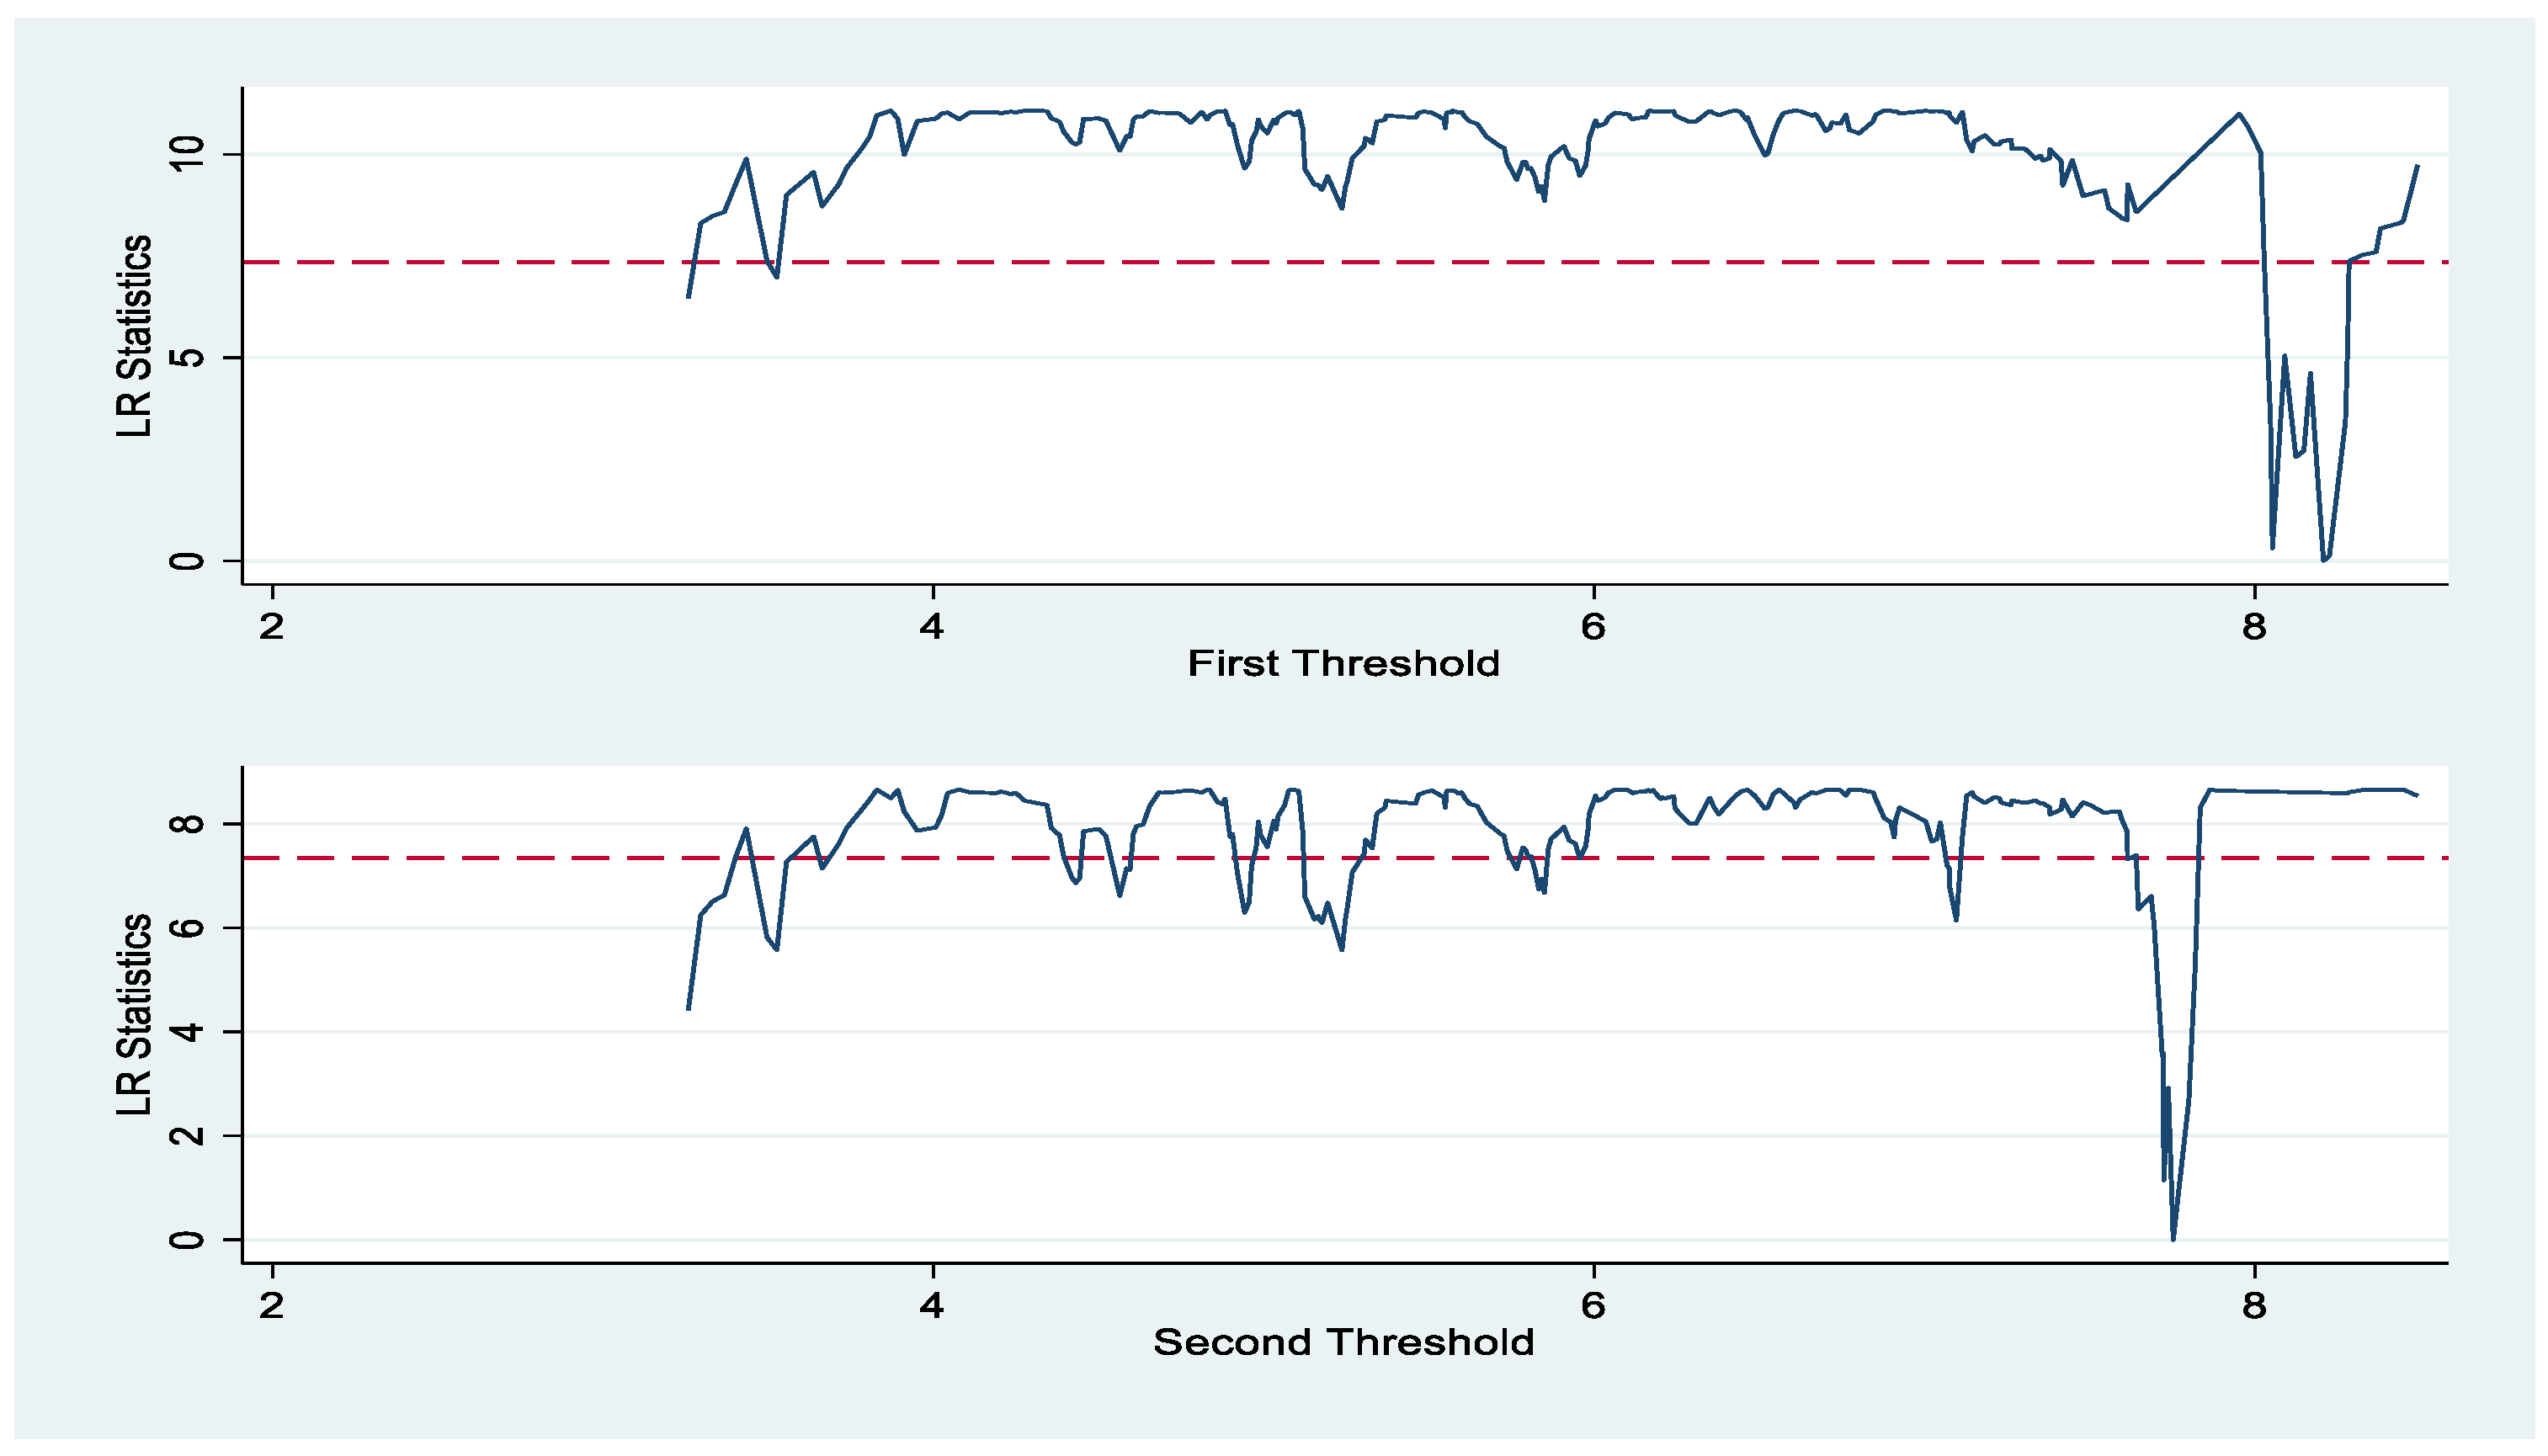
Furthermore, through the likelihood-ratio (LR) test statistics (
Figure 1), it can be seen that the model setting of a single threshold is relatively reasonable.
The regression results of the single and double threshold effect of wlnk2 are shown in
Table 10. As can be seen from the statistical results shown in the table below, when wlnk2 is less than 8.0523, the regression coefficient of wlnk2 to wlny3 is not significant at −0.022; when wlnk2 is greater than 8.0523, the regression coefficient of wlnk2 to wlny3 is significant at −0.062. This shows that when the level of green technological innovation is lower than 8.0523, its effect on inhibiting the emission of sulfur dioxide in TPAPI is not significant. While the correlation between the two is not high, green technological innovation still has a weak inhibitory effect on the emission of sulfur dioxide in TPAPI. The main reason for this is that green technological innovation did not attract investors in the early stages of investment because of doubts about new green technology. In addition, the patents held in the early stages of green technology were less focused on the prevention and control of air pollution. The types of green technological innovation, relevant talent, capital investment, and technology introduction were also limited. As a result, the inhibition effect of green technological innovation on sulfur dioxide emissions in TPAPI was weak.
When the level of green technological innovation is greater than 8.0523, its inhibition effect on sulfur dioxide emissions in TPAPI significantly increases. With the gradual increase in green technological innovation capacity and the increasing maturity of green technology means, the inhibition effect on sulfur dioxide emissions of TPAPI also becomes more effective. The achievements of green technological innovation are successfully transformed during the production process. The energy utilisation rate and production efficiency are improved, the inhibition effect of TPAPI on sulfur dioxide emissions is enhanced, and the agglomeration of TPAPI becomes more mature. Under the same circumstances, green technological innovations have led to significant reductions in sulfur dioxide emissions from TPAPI. In addition, because of the diffusion and learning effect of technology, neighboring regions have improved their level of green technological innovation and enhanced their ability to curb sulfur dioxide emissions from TPAPI.
6. Conclusions
From the main research results of this paper compared to the previous research conclusions, previous relevant studies have found that technological innovation has a significant positive impact on air pollution. This study mainly focuses on air pollution-intensive industries, which are the major sources of air pollution in China and finds that green technological innovation can significantly reduce environmental pollution emissions from air pollution-intensive industries with threshold characteristics. The specific conclusions are as follows:
The air pollution-intensive industry is an important source of sulfur dioxide emissions. Its level of agglomeration is gradually on the rise, increasing sulfur dioxide emissions in the air pollution-intensive agglomeration area. The air pollution-intensive agglomeration level has a significant positive correlation with the level of sulfur dioxide emissions. As the agglomeration level increases, so will sulfur dioxide emissions in agglomeration areas because TPAPI emit a large amount of sulfur dioxide during production processes. Green technological innovation has a single threshold effect. It can reduce energy consumption and improve the comprehensive utilization and centralized treatment efficiency of pollutants by developing the production technology of TPAPI. Increasing the green technological innovation level can also significantly reduce sulfur dioxide emissions from TPAPI.
Sulfur dioxide emissions are increasingly concentrated in a few provinces but are relatively small in the neighboring areas. Green technological innovation shows increasing spatial agglomeration in the process of change, which is mainly due to the diffusion effect of technology. Neighboring regions can effectively reduce emissions by learning from the green technological innovation within the region. Therefore, China should increase investment in the green technological innovation of agglomeration areas of air pollution-intensive enterprises to effectively reduce air pollution.
6.1. Policy Implications
6.1.1. Promote and Increase Investment in Green Technology Innovation and Implement Air Pollution Prevention and Control Measures
Green technology innovation includes product design, materials, processes, equipment, and other technical green innovations. Construct a resource saving industrial structure system, popularize resource saving production technology in key agglomeration areas of air pollution-intensive industries, establish an ecological balance relationship and operation mechanism between the regions through industrial ecological relations, and realize industrial ecology to establish the ecological relationship between the industries and the industrial departments in the national economic system. According to the ecological operation mode and ecological standards to establish industrial waste recovery, treatment and recycling systems are required. We will continue to reform and develop cleaner production processes in these areas to improve comprehensive ecological benefits.
6.1.2. Scientifically Adjust the Concentration of Air Pollution-Intensive Industries
Air pollution-intensive industrial agglomeration refers to the process whereby air pollution intensive industries are highly concentrated in a certain area and their industrial capital is constantly gathering in space. With the continuous expansion of China’s industrial scale, a centralized pollution control mechanism should be established in the agglomeration areas, and the scope of treatment facilities and supporting equipment should be arranged. In addition, production techniques and pollution control efficiency must be developed to benefit from pollution control and raise awareness of the positive environmental effects of the concentration of pollution-intensive industries. At the same time, according to the differences in pollution degree and the different levels in air environment self-purification capacity in the different regions, the gradient transfer is carried out from the area with dense air pollution to the area with high air self-purification capacity and low air pollution. Gradient transfer of air pollution-intensive industries refers to the process of transferring the air pollution-intensive industry from the weak self-cleaning ability of the air environment and the serious environmental pollution area to the strong self-cleaning ability of the air environment and the better environment area. In the restricted development zone, attention should be paid to choosing the industry with low resource consumption; medium- and low-end industries should be replaced by medium- and high-end industries in key development zones to form a benign gradient transfer and phased replacement.
6.1.3. Accelerating the Transformation and Upgrading of Industrial Structures
Regions without the advantage of resource endowment, weak industrial bases, and affected by industrial transfer policies may find it difficult to raise the level of agglomeration to the extent that can produce positive environmental effects. Therefore, it is necessary to accelerate the development of modern high-end service industries and strategic emerging industries through the transformation and upgrading of industrial structures to ensure the sustainability of positive externalities. In addition, the creation of a high level of industrial agglomeration, the elimination of traditional enterprises with high pollution and backward technology, and a reduction in environmental pollution levels can also help to achieve this result.
There are still some shortcomings in this study, which need to be further improved in later studies. This study focuses on provincial-level research, but research from the perspective of regional division and industry coverage is still insufficient, and its representativeness needs to be further improved. In the future, typical case studies can be used to make further tests and corrections.
Author Contributions
Conceptualization, J.Z. and Y.L.; methodology, J.T.; software, Z.M.; validation, J.T. and Y.L.; formal analysis, Y.L.; investigation, Z.M.; resources, J.T.; data curation, J.Z.; writing—original draft preparation, J.Z.; writing—review and editing, Y.L.; visualization, Z.M.; supervision, J.Z.; project administration, J.T.; funding acquisition, J.Z. All authors have read and agreed to the published version of the manuscript.
Funding
This research was funded by “The National Social Science Fund of China”, grant number “20BJL193”.
Data Availability Statement
Not applicable.
Acknowledgments
We gratefully acknowledge financial support from the National Social Science Found of China. Any opinions and conclusions expressed in the article are those of the authors and do not necessarily reflect the view of the National Social Science Found.
Conflicts of Interest
The authors declare no conflict of interest.
References
- Hemmelskamp, J. Environmental policy instruments and their effects on innovation. Eur. Plan Stud. 1997, 5, 177–194. [Google Scholar] [CrossRef] [Green Version]
- Klassen, R.D.; Whybark, D.C. The impact of environmental technologies on manufacturing performance. Acad. Manag. J. 1999, 42, 599–615. [Google Scholar] [CrossRef]
- Su, Y.; Zhang, C. Review and thinking of China’s green technology innovation in the past 40 years of reform and opening up. Guangdong Soc. Sci. 2018, 35, 5–12. [Google Scholar]
- Cao, K. Research on the ethics of green technology innovation. Stud. Dialectics Nat. 2019, 35, 37–43. [Google Scholar]
- Yang, F.; Xu, Q. Research on green technological innovation of enterprises. China Soft Sci. 1998, 13, 47–51. [Google Scholar]
- Koo, J. Technology spill-overs, agglomeration, and regional economic development. J. Plan. Lit. 2005, 20, 99–115. [Google Scholar] [CrossRef]
- Yao, J.; Li, H.; Shang, D. Review of green technology innovation research and practical enlightenment. Ecol. Econ. 2020, 36, 49–56+113. [Google Scholar]
- Marshall, A. Principles of Economics; Macmillan: London, UK, 1890. [Google Scholar]
- Han, J.; Fei, T.; Wu, S.; Duan, J. Research on industrial agglomeration, spatial effect and regional innovation. Public Financ. Res. 2017, 38, 90–100. [Google Scholar]
- Li, G. Research on the coupling and coordinated development of industrial agglomeration and regional innovation capacity. Stat. Decis. 2018, 34, 145–148. [Google Scholar]
- Shi, X.; Li, Y. Research on the influence of high-tech industrial agglomeration on regional technological innovation capacity—Based on the investigation of Yangtze River Economic Belt. J. Chongqing Inst. Technol. 2019, 33, 47–54. [Google Scholar]
- He, Y.; Cheng, N. Industrial Agglomeration, technological innovation and economic growth in the middle reaches of the Yangtze River: From the perspective of heterogeneous industrial agglomeration and collaborative agglomeration. Ind. Tech. Econ. 2019, 38, 41–48. [Google Scholar]
- Du, J.; Li, Y. High-tech industrial agglomeration, technological innovation and green development in the Yangtze River delta: An empirical study based on PVAR Model. Sci. Technol. Manag. Res. 2021, 41, 167–175. [Google Scholar]
- Grossman, G.M.; Krueger, A.B. Environmental Impacts of a North American Free Trade Agreement; Social Science Electronic Publishing: Rochester, NY, USA, 1991; Volume 8, pp. 223–250. [Google Scholar]
- Zhao, Z.; Mao, J.; Zhou, J. The influence of industrial agglomeration on air pollution and threshold characteristic test—From the perspective of technological innovation on air pollution control. J. Shandong Univ. 2020, 70, 123–133. [Google Scholar]
- Chen, Y.; Lu, J.; Yu, P. Has technological innovation reduced environmental pollution? —Empirical evidence from 285 cities in China. J. Xi’an Jiaotong Univ. 2019, 39, 73–84. [Google Scholar]
- Liu, Z.; Song, D.; Liu, G. The threshold effect of environmental regulation on green technology innovation ability of manufacturing industry. Commer. Res. 2018, 61, 111–119. [Google Scholar]
- Yan, X.; Cheng, C. Research on the efficiency of scientific and technological innovation and the unbalanced development of ecological environment in the Yangtze River Economic Belt—Based on the double-threshold panel model. Soft Sci. 2018, 32, 11–15. [Google Scholar]
- Lan, H.; Wang, L. Research on threshold effect of regional carbon emission performance and environmental regulation under green development—Based on SE-SBM and dual-threshold panel model. Soft Sci. 2019, 33, 73–97. [Google Scholar]
- Zhang, J. Threshold effect of technological innovation on environmental pollution in the process of industrialization—Based on empirical analysis of 283 cities in China. Macro-Econ. 2019, 35, 34–42. [Google Scholar]
- Fan, X. Analysis on the threshold effect of technological innovation in reducing environmental pollution: An empirical test based on panel data of 285 cities in China. Theory Mod. 2021, 33, 98–109. [Google Scholar]
- Guo, L.; Liu, Y.; Liu, G. An empirical study on the relationship between environmental regulation, green innovation and environmental pollution. J. Manag. 2022, 19, 892–900+927. [Google Scholar]
- Tobey, J.A. The effects of domestic environmental policies on patterns of world trade: An empirical test. Kyklos 1990, 43, 191–209. [Google Scholar] [CrossRef]
- Becker, R.; Henderson, V. Effects of air quality regulations on polluting industries. Political Econ. 2000, 18, 379–421. [Google Scholar] [CrossRef]
- Mani, M.; Wheeler, D. In search of pollution havens? Dirty industry in the world economy, 1960-1995. J. Environ. Dev. 1998, 7, 215–247. [Google Scholar] [CrossRef]
- Wang, B.; Zhao, C. Green technological innovation in China—Patent statistics and influencing factors. J. Ind. Technol. Econ. 2019, 7, 53–66. [Google Scholar]
- WIPO. World Intellectual Property Organization Open Data. 2020. Available online: https://www.wipo.int/classifications/ipc/green-inventory/home (accessed on 20 October 2015).
| Disclaimer/Publisher’s Note: The statements, opinions and data contained in all publications are solely those of the individual author(s) and contributor(s) and not of MDPI and/or the editor(s). MDPI and/or the editor(s) disclaim responsibility for any injury to people or property resulting from any ideas, methods, instructions or products referred to in the content. |
© 2022 by the authors. Licensee MDPI, Basel, Switzerland. This article is an open access article distributed under the terms and conditions of the Creative Commons Attribution (CC BY) license (https://creativecommons.org/licenses/by/4.0/).


