3.1. Chemical Composition
The chemical compositions of the essential oils of
S. officinalis obtained in 2019, 2020, and 2021 are presented in
Table 3, while the raw data are included in
Supplement Figure S1a–c. According to the obtained results, the main compounds in
S. officinalis essential oil were
cis-thujone with 23.5% on average for three years (content ranged between 19.9 and 29.0%), camphor with 17.7% (15.8–19.6%),
trans-thujone 12.9% (12.3–13.3%) and 1,8-cineole 10.0% (8.8–11.3%). The
cis-thujone and
trans-thujone, and their relationship, were often familiar as two compounds depicting chemotypes of
S. officinalis, as well as camphor combined with other compounds, but the obtained results suggest a mixture of the mentioned isomers and camphor as the most dominant constituent of the same samples in all three tested growing years. A much closer similarity between essential oil obtained in 2019 and 2021 can also be observed. This similarity might be explained based on a relation of hydrocarbons and oxygenated compounds in the essential oil, with a higher similarity, found when oxygenated compounds are the main component in the oil sample. It is worth emphasizing that the main constituent,
cis-thujone, represents a monoterpene ketone that is usually found in different plants such as
Salvia officinalis,
S. sclarea,
Tanacetum vulgare,
Thuja occidentalis etc. Although ketones are generally non-toxic, thujone is the most toxic one, and its presence in food and beverages has been managed by different regulations at the continent level [
41].
To the authors’ knowledge, many relevant scientific papers deal with geographically different
S. officinalis samples, but not with growing-year-dependencies. Comparing the average value of the chemical composition of the samples in this work with other
S. officinalis samples, it can be noted that the main constituents are not correlated with samples from different parts of the Balkan Peninsula and other parts of southeastern Europe summarized [
42]. The main similarity is the ever-present camphor and some isomers of thujone but in completely different concentrations. Other constituents, especially in minor quantities, can be completely different at the geographical region level. Each
S. officinalis essential oil sample can be described through diverse chemotypes, but they mutually correspond only partly with the findings in this study. Russo et al. [
43] emphasized the fact that inconsistency in EOs constituents of
S. officinalis is contingent on environmental factors such as altitude, water availability, and pedoclimatic conditions.
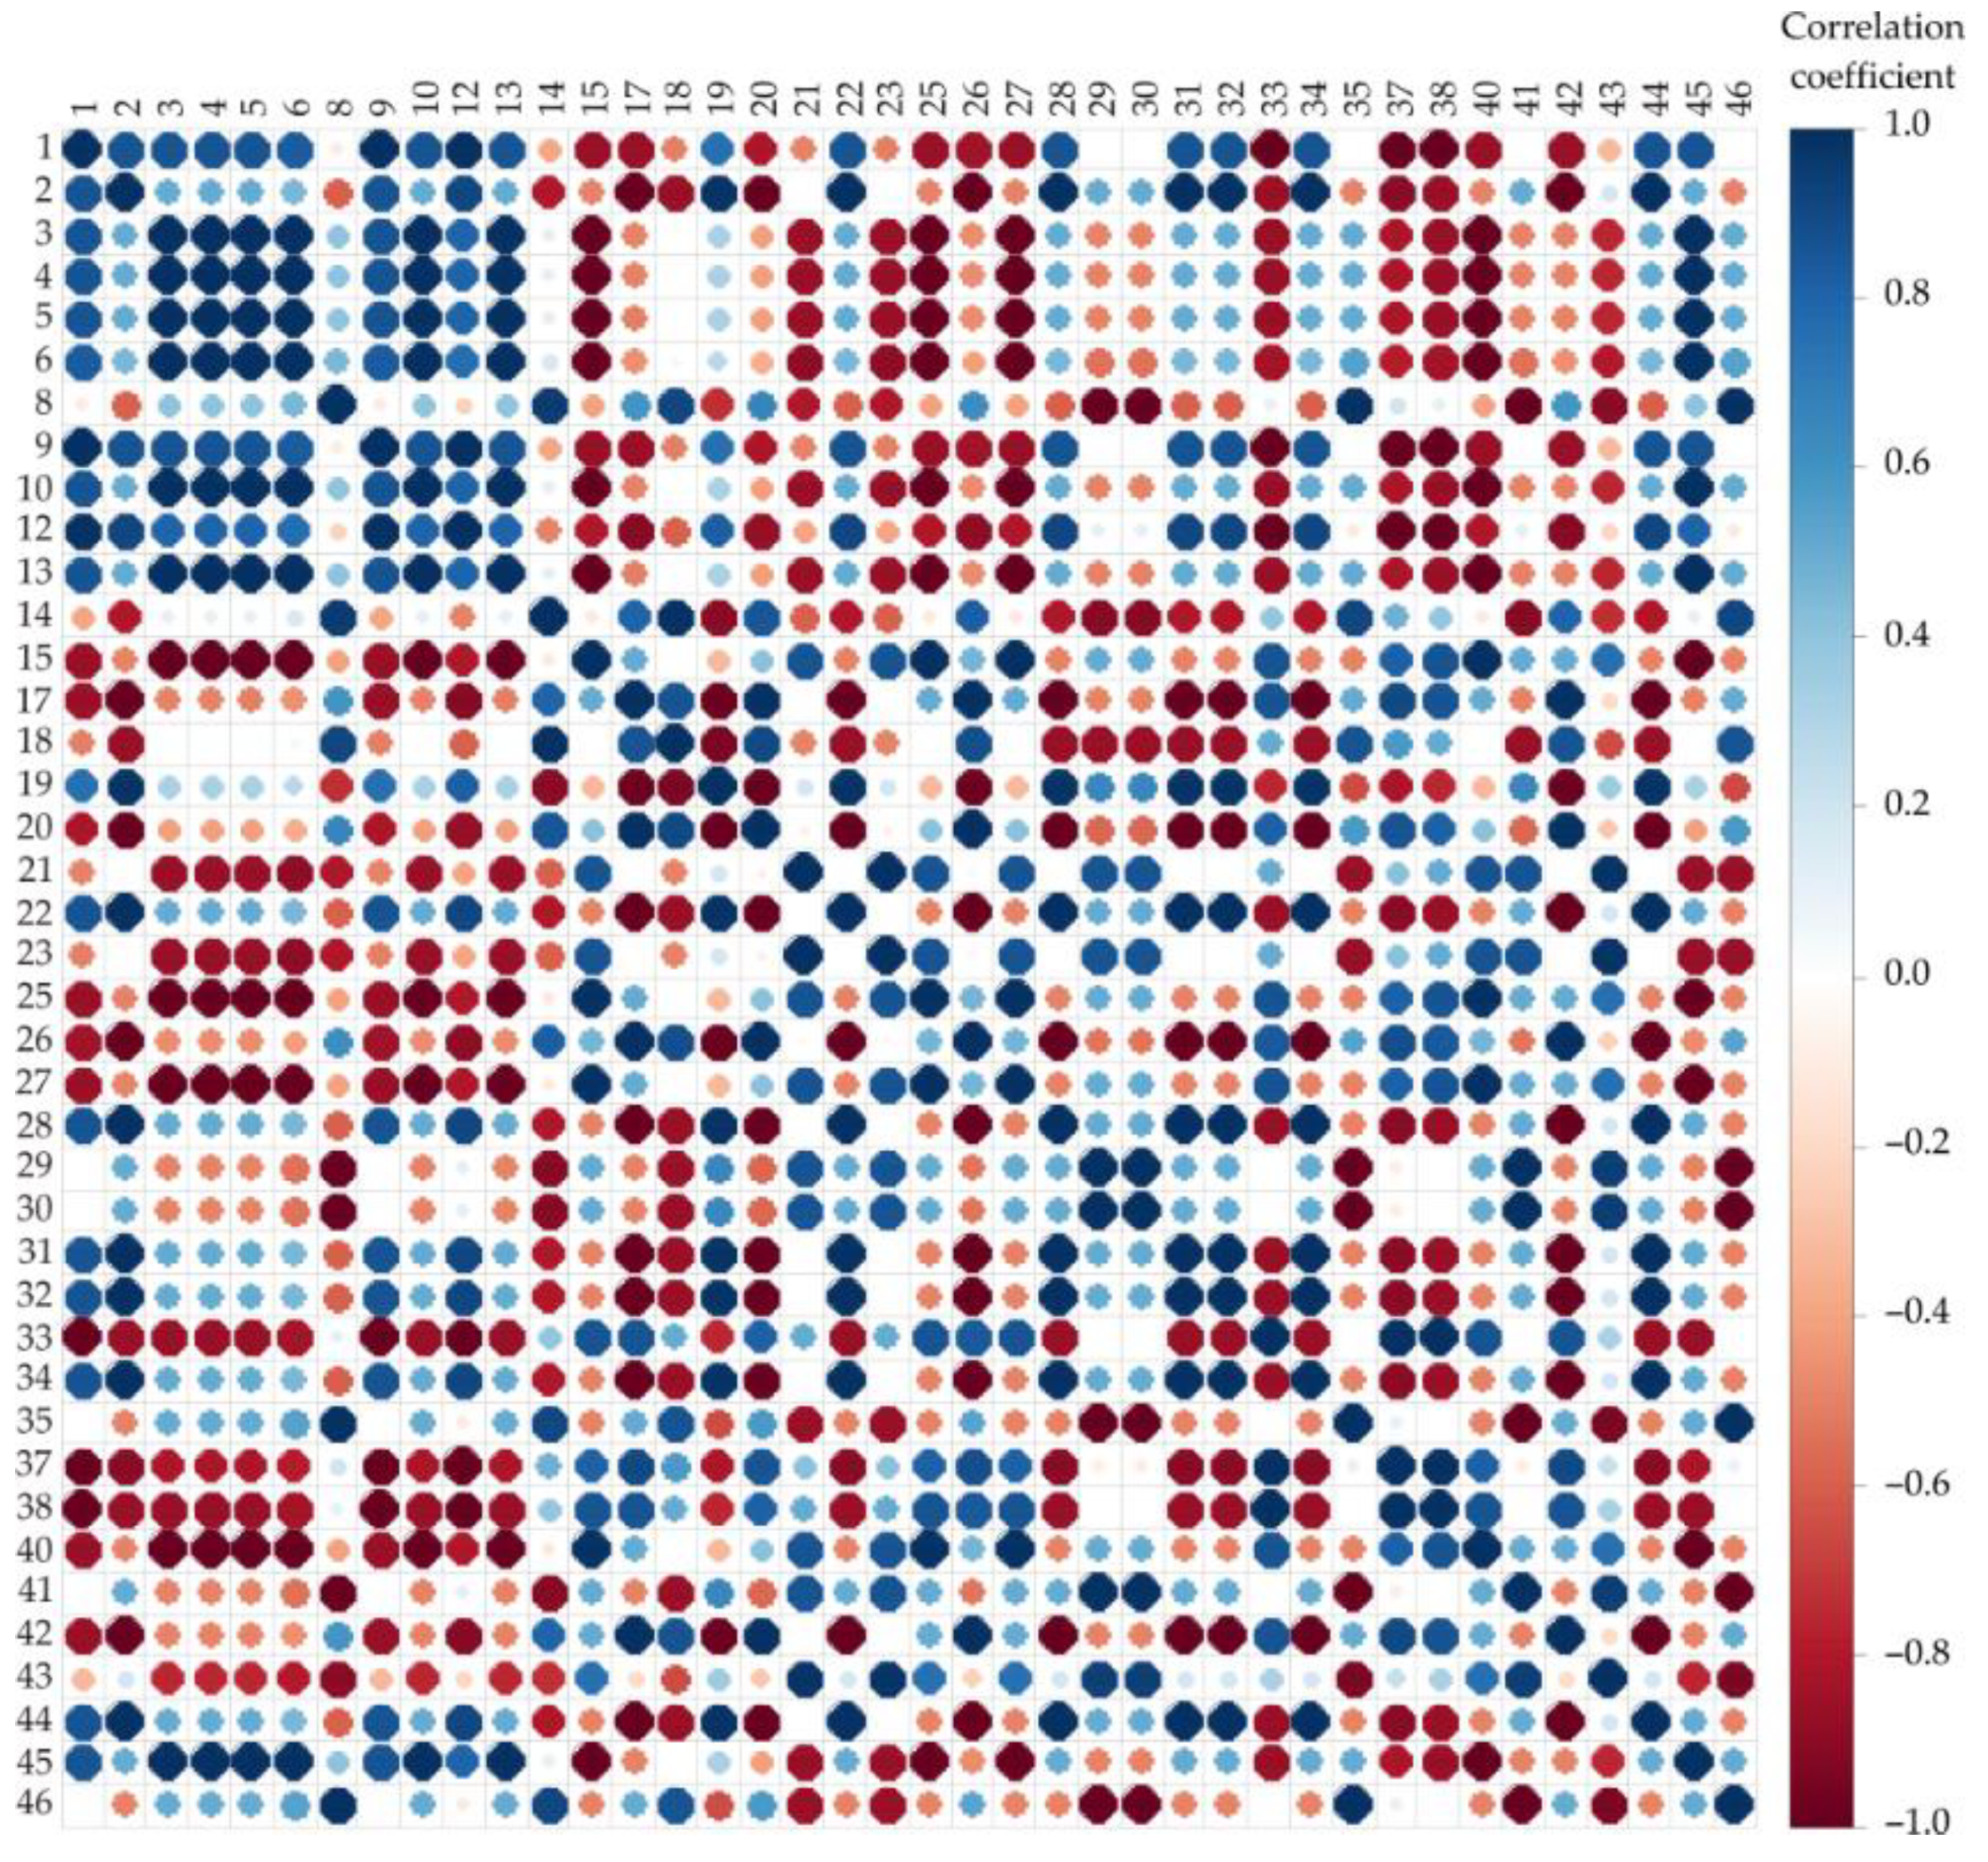
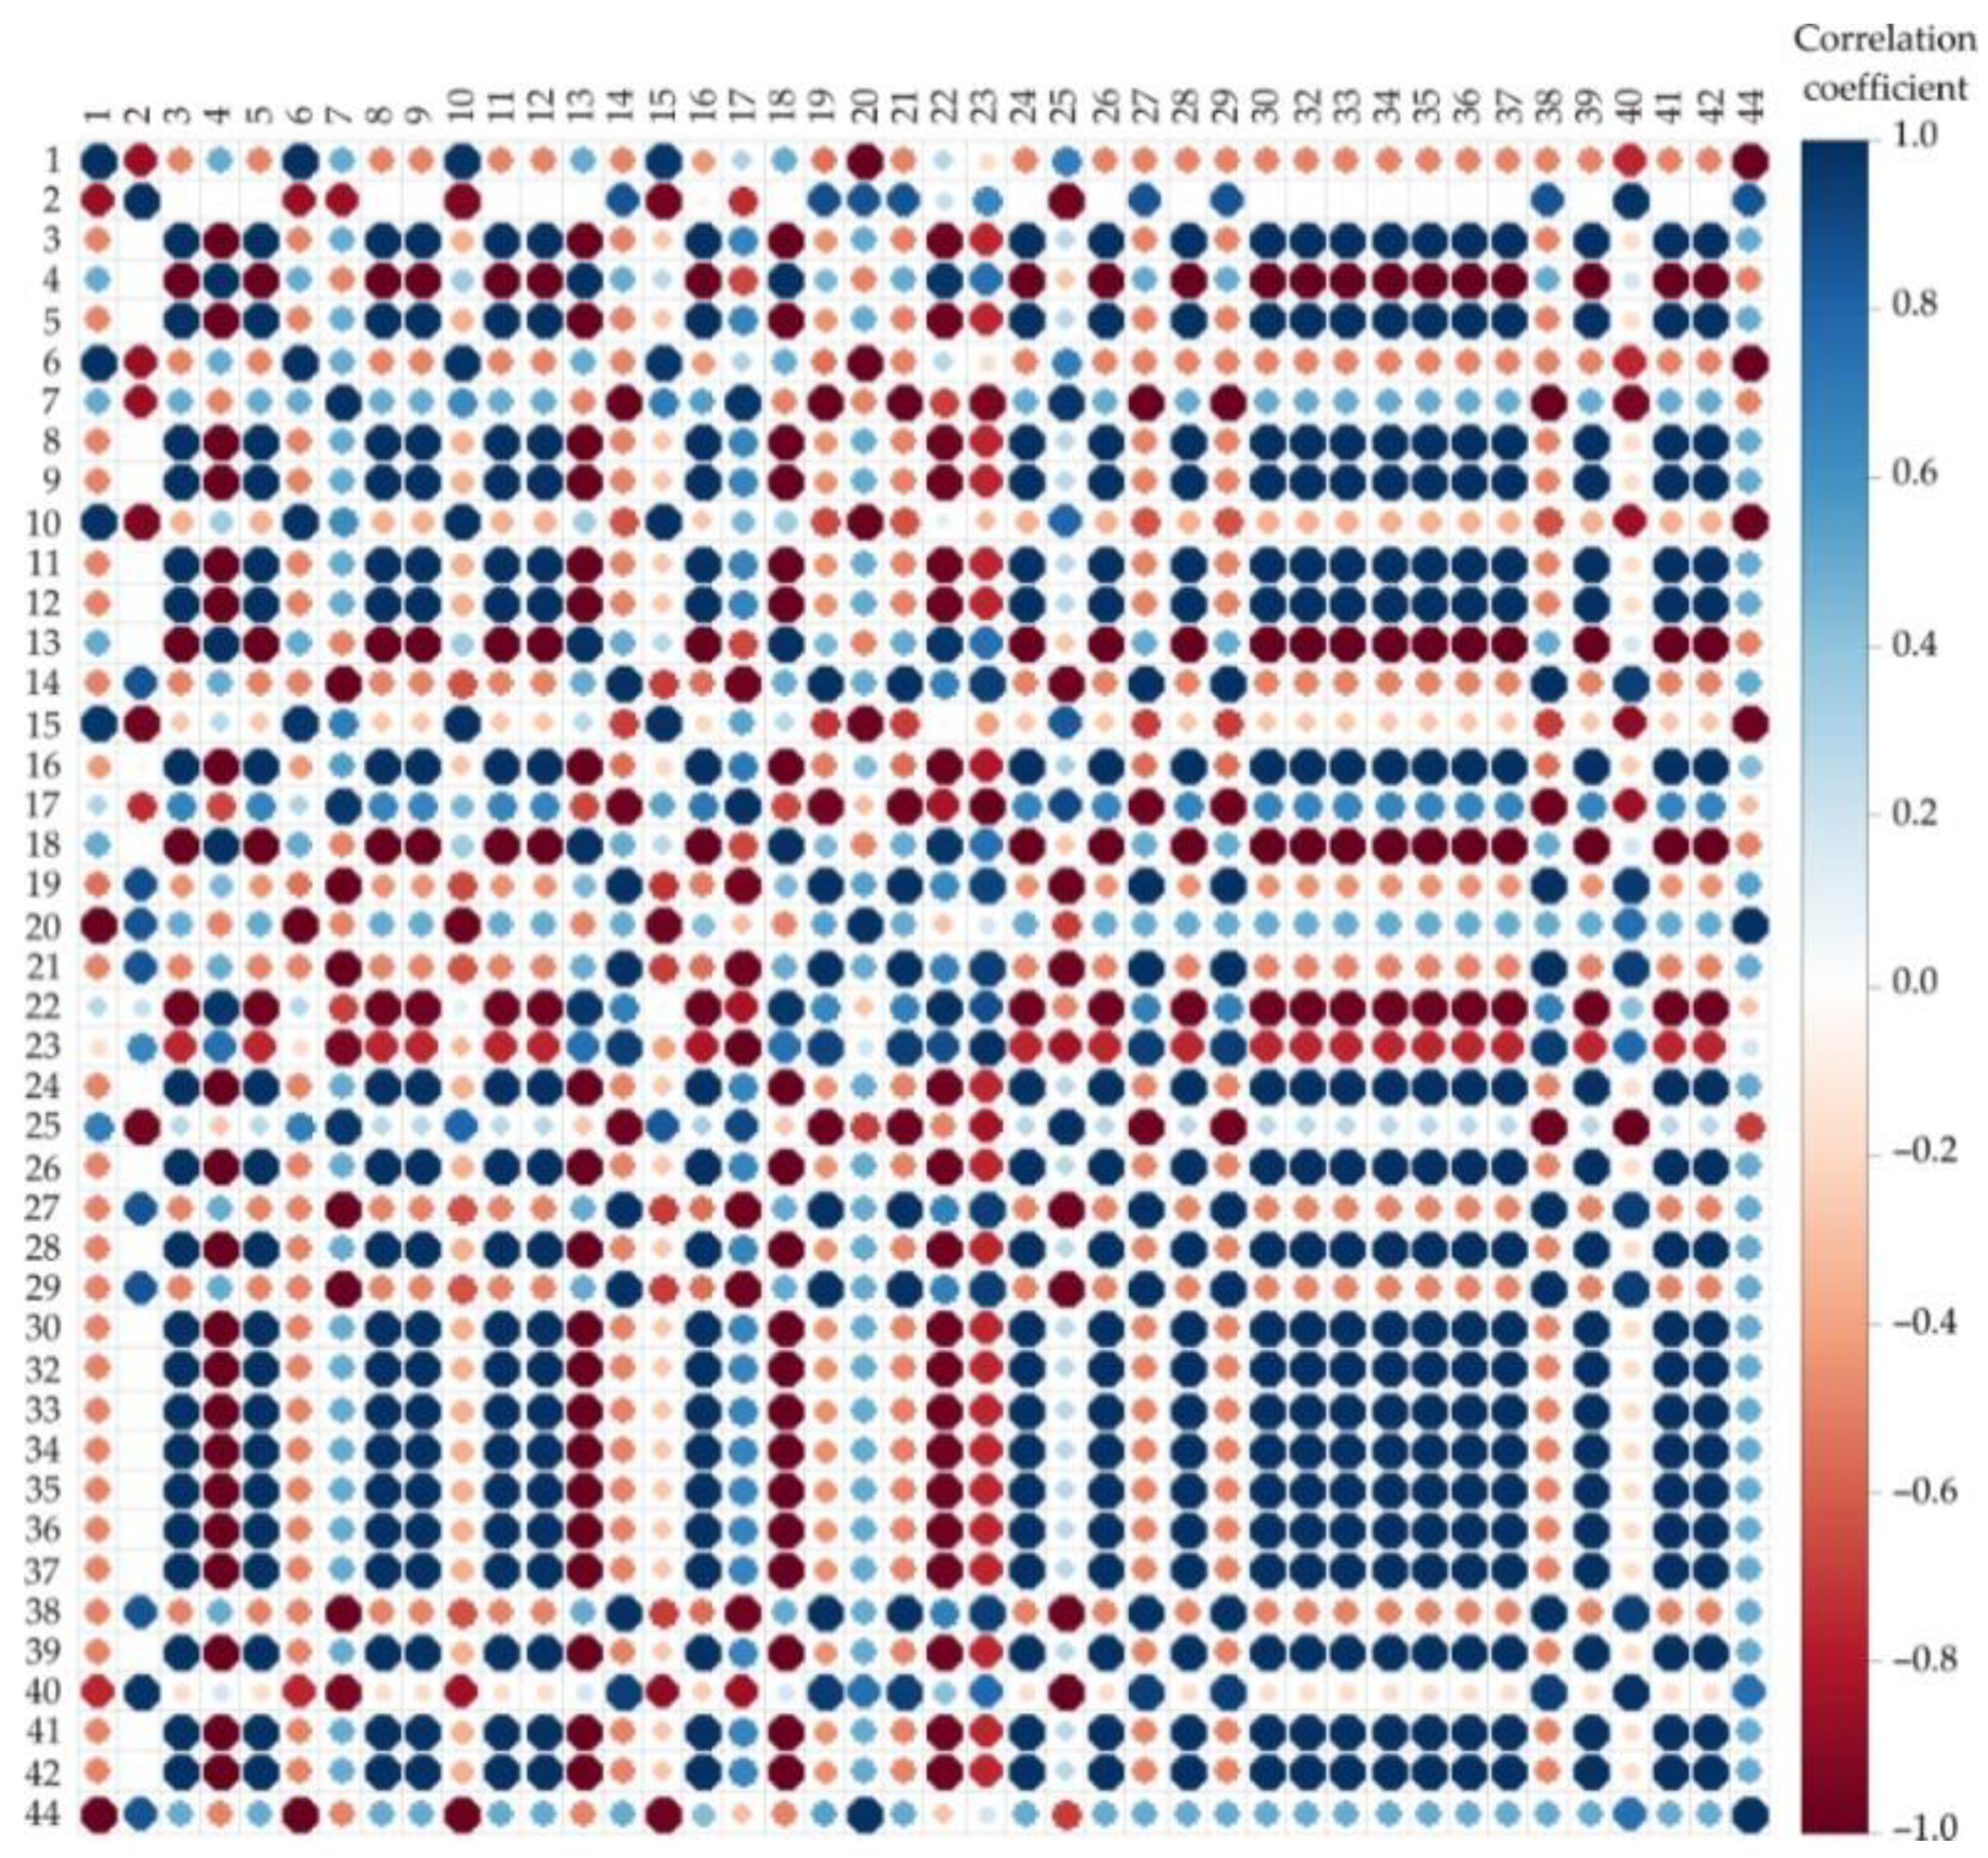
For easier understanding and presenting the differences and similarities of the tested essential oil samples, the calculated correlations are illustrated in
Figure 1 using the “corrplot” function, using the “circle” method, from R Studio 1.4.1106 program. The size and the circle’s color rely on the correlation coefficients; if the color is blue, the positive correlation was conducted; on the contrary, the red color symbolizes the negative correlation. Furthermore, the circle‘s dimensions are increased with the correlation coefficient’s absolute value.
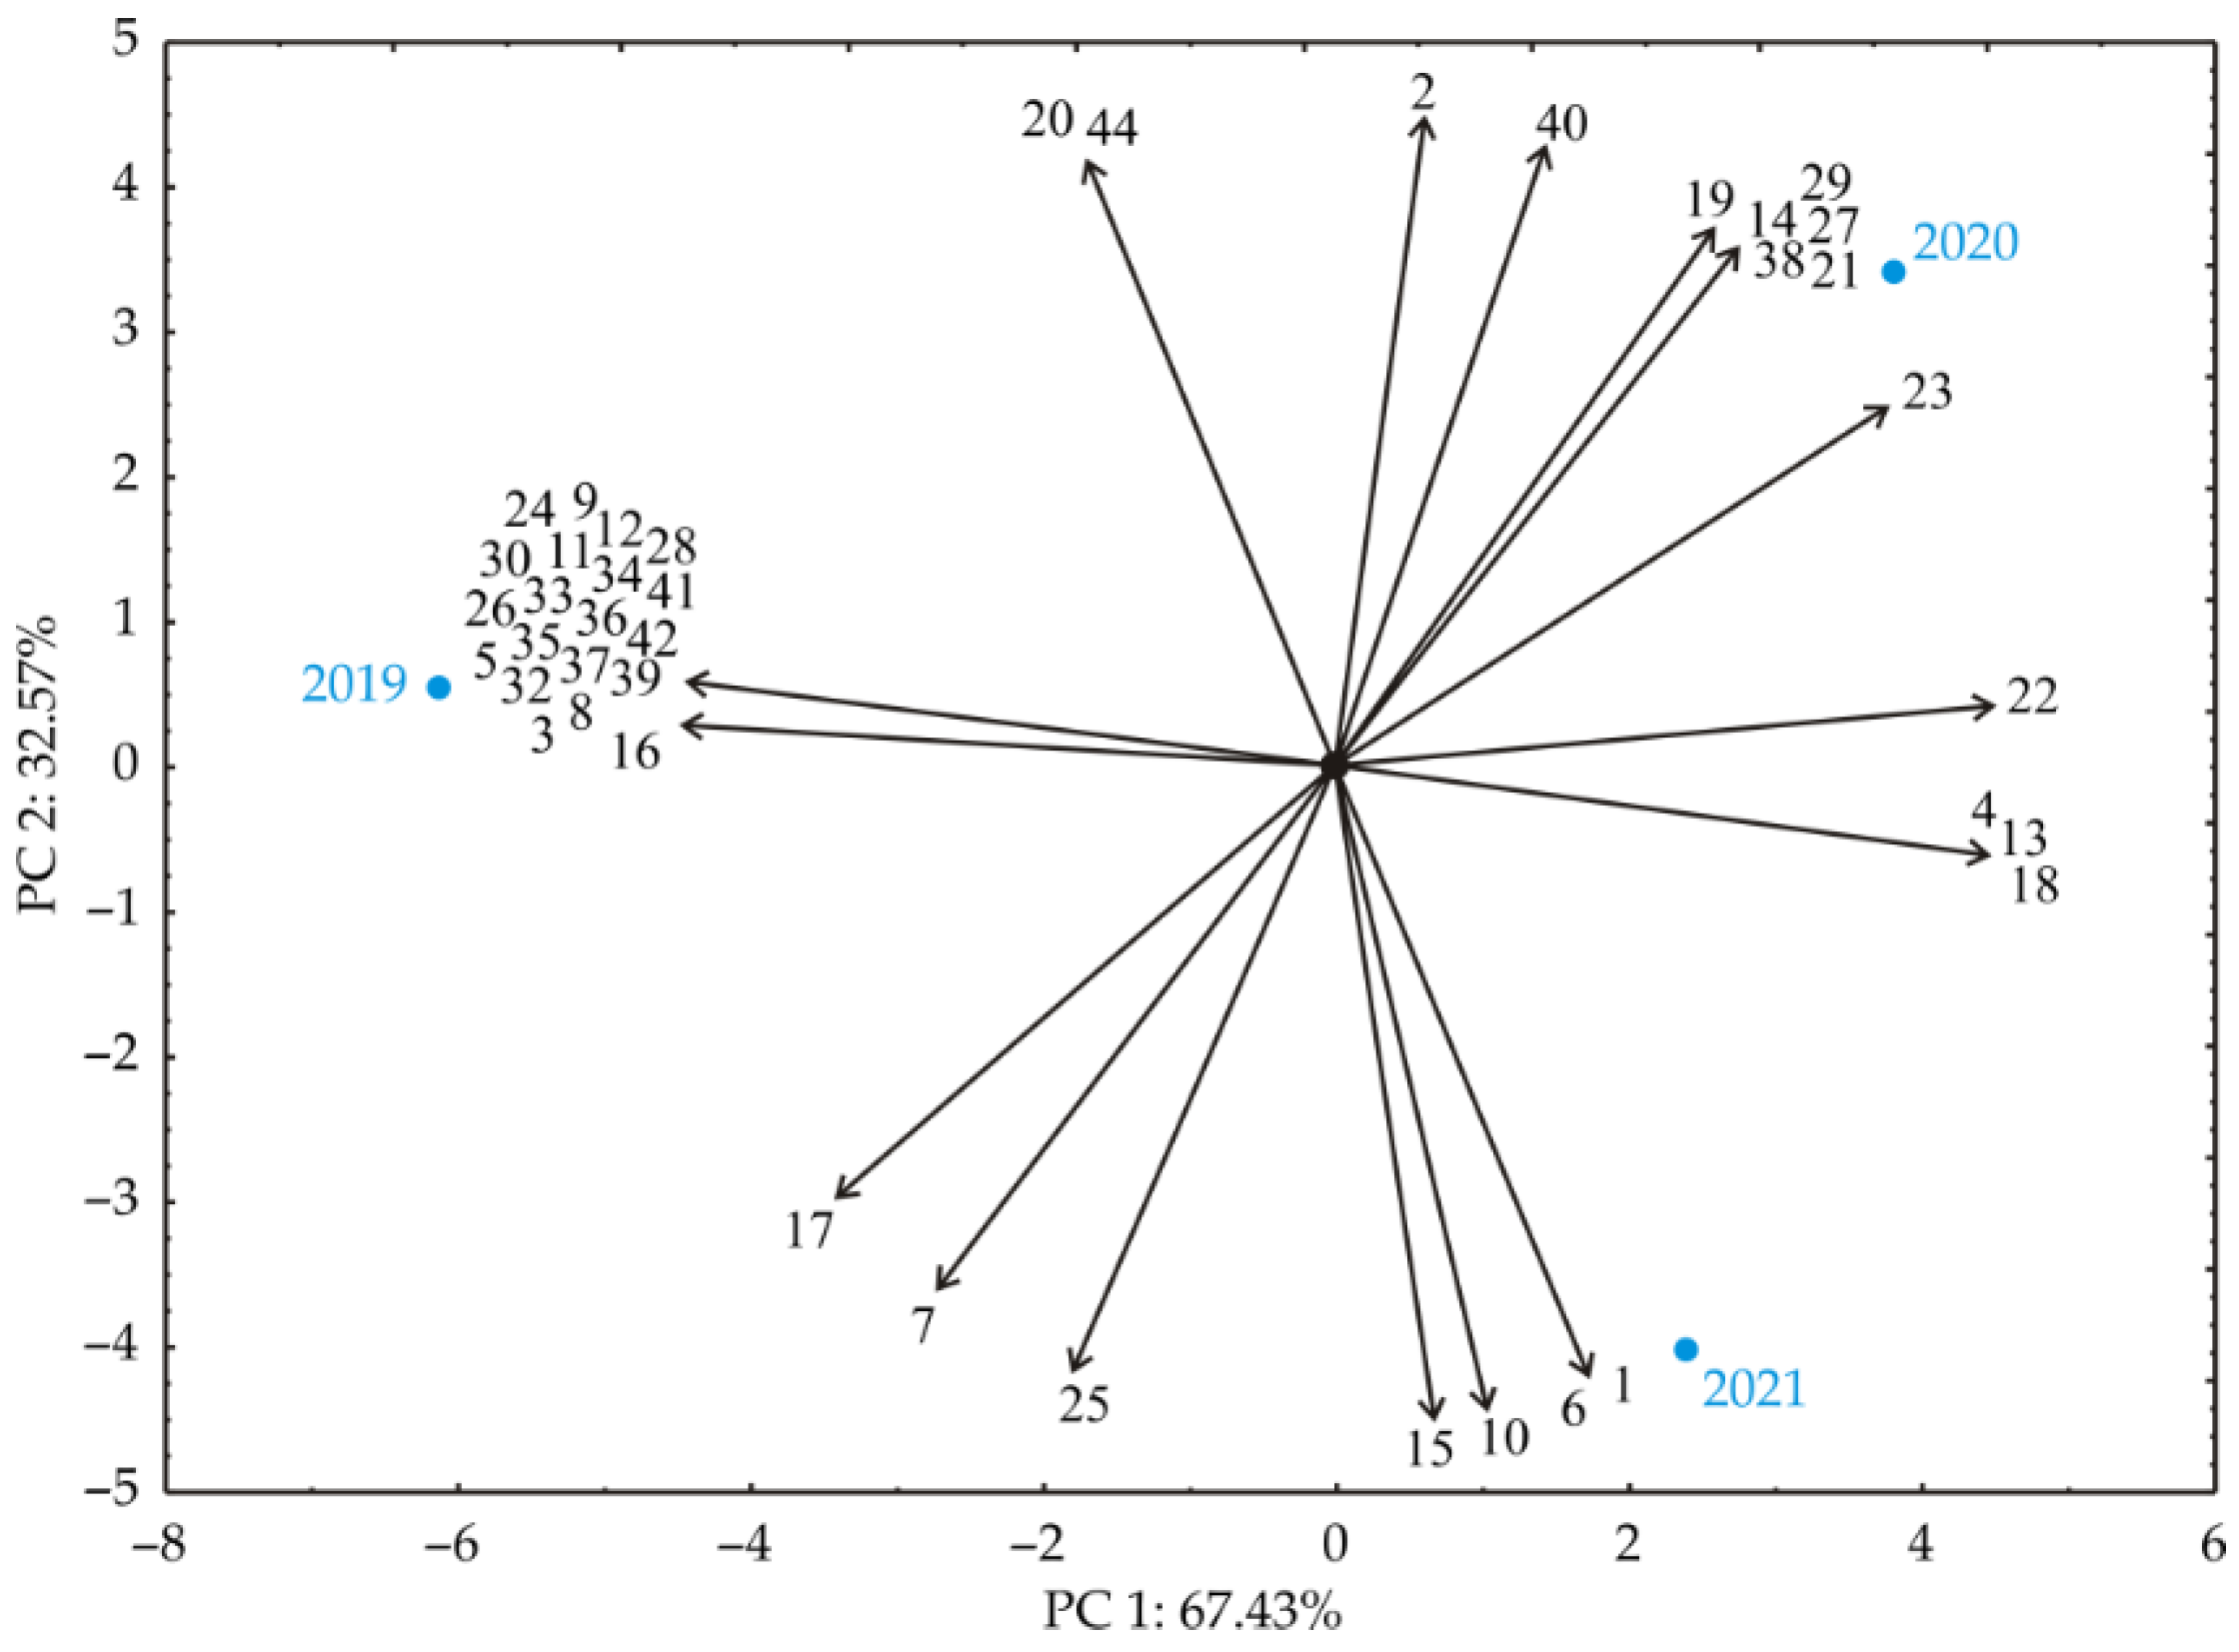
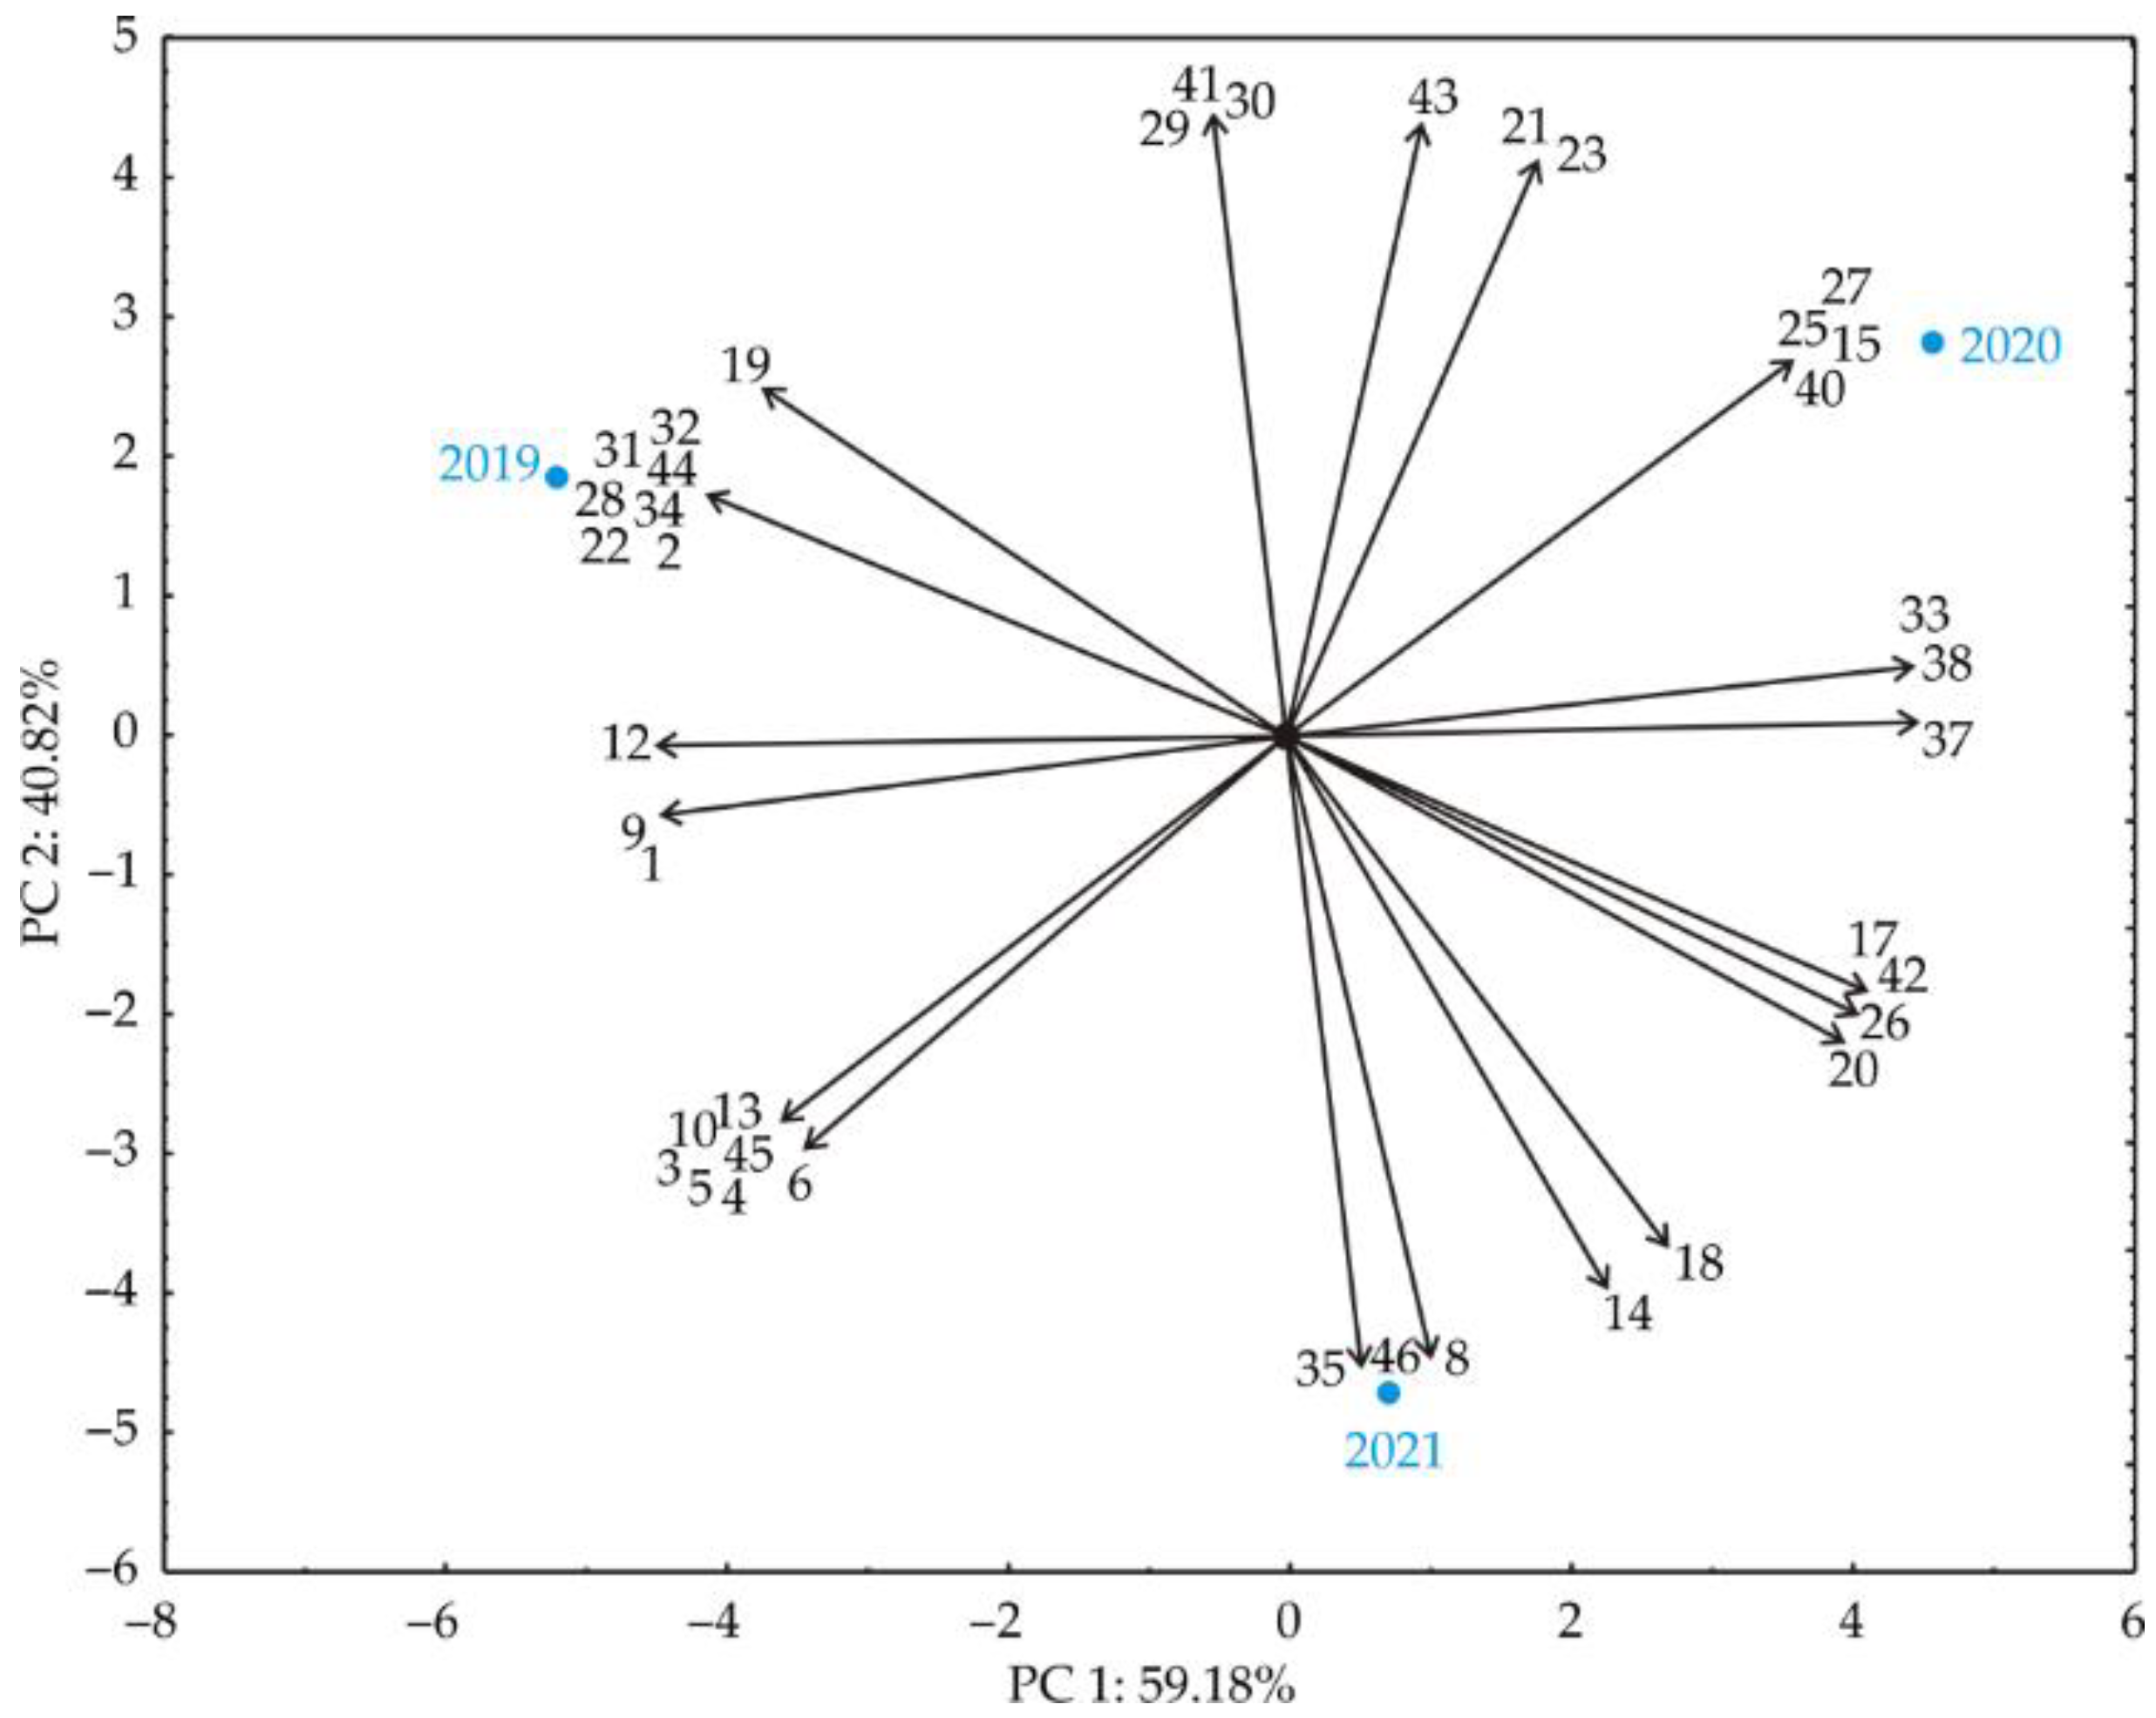
Thoroughly illustrating the structure of the experimental data would deliver a more profound explanation of relations between diverse samples of
S. officinalis from 2019, 2020, and 2021; PCA was used, and the received results are shown in
Figure 2. The PCA of the relations between volatile compounds of
S. officinalis essential oil explained that the first two principal components summarized 100% of the total variance in the 46 parameters (volatile compounds). The first PC explained 67.43% and the second 32.57% of the total variance between the experimental data. The parting within samples could be seen from the PCA figure, where the volatile compounds of
S. officinalis essential oil during 2019 are grouped on the left, 2020 on the top, and 2021 on the bottom side of the graphic.
Given that the samples from different geographical areas differ significantly, a comparison of samples from this work with samples from the same geographical area, more precisely from the Republic of Serbia, is given in
Table 4, as well as their compatibility with the ISO 9909 standard [
44], limited amounts of toxic thujones, and other compounds.
Additionally, as can be seen from
Table 4, α-pinene content in
S. officinalis samples from Serbia ranges between 0.0 and 5.1%. However, the ISO 9909 standard specifies content of this compound from 1.0 to 6.5%. Further, camphene content ranged between 0.0 and 8.5%, while recommend values according to the ISO 9909 are between 1.5 and 7.0%. Limonene content in
S. officinalis from Serbia ranged from 0.0 to 8.3%, while the percentages limited by the ISO 9909 standard are between 0.5 and 3.0%. The 1,8-cineole ranges between 5.8 and 16.7%, while limits are within 5.5 and 13.0%. The mixture of linalool and linalyl acetate in Serbian samples is between 0.0 and 4.3%, while the limit value is 1.0%. Cis-thujone varied between 19.1 and 37.5%, while the ISO 9909 standard limits this compound between 18.0 and 43.0%. However, trans-thujone varied between 1.7 and 13.3%, while between 3.0 and 8.5% is allowed. Camphor content is between 2.5 and 32.7%, while the ISO 9909 standard recommended between 4.5 and 24.5%. Bornyl acetate content in
S. officinalis samples from Serbia is between 0.3 and 4.9%, while recommended values are below 2.5%. The last limited compound according to the ISO 9909 standard is α-humulene (≤12.5%), whose values ranged between 0.0 and 12.7%. As can be seen from the table, no one sample of
S. officinalis essential oil satisfied ISO 9909 standard criteria for all ten compounds. According to the results, it can be seen that the tested samples (TS 19, TS 20, and TS 21) stand out with a higher amount of trans-thujone than all other samples and the recommended standard value. For all other constituents, it can be concluded that Serbian samples are quite different, and defining the chemical composition each time is necessary and needs to be part of a standardized protocol for the further use of essential oil of this plant.
The same methodology for chemical characterization was used for hydrolate of
S. officinalis from all tested growing years. The hydrolate represents a by-product of the essential oil production process through a distillation process and lagging in large quantities. Therefore, the potential utilization of this water rich in phytochemicals can ensure a greener pathway in essential oil production. Based on the results shown in
Table 5 (the raw data were included in
Supplement Figure S1d–f), the main compounds in
S. officinalis hydrolate were camphor with 44.9% on average for three years (content ranged between 42.4 and 49.6%), followed by
cis-thujone with 15.7% (13.4–19.8%) and 1,8-cineole with 15.5% (12.3–20.5%). It can be observed that camphor is the dominant constituent of hydrolates, followed by
cis-thujone, while the opposite situation was determined in the case of tested essential oils (
Table 3).
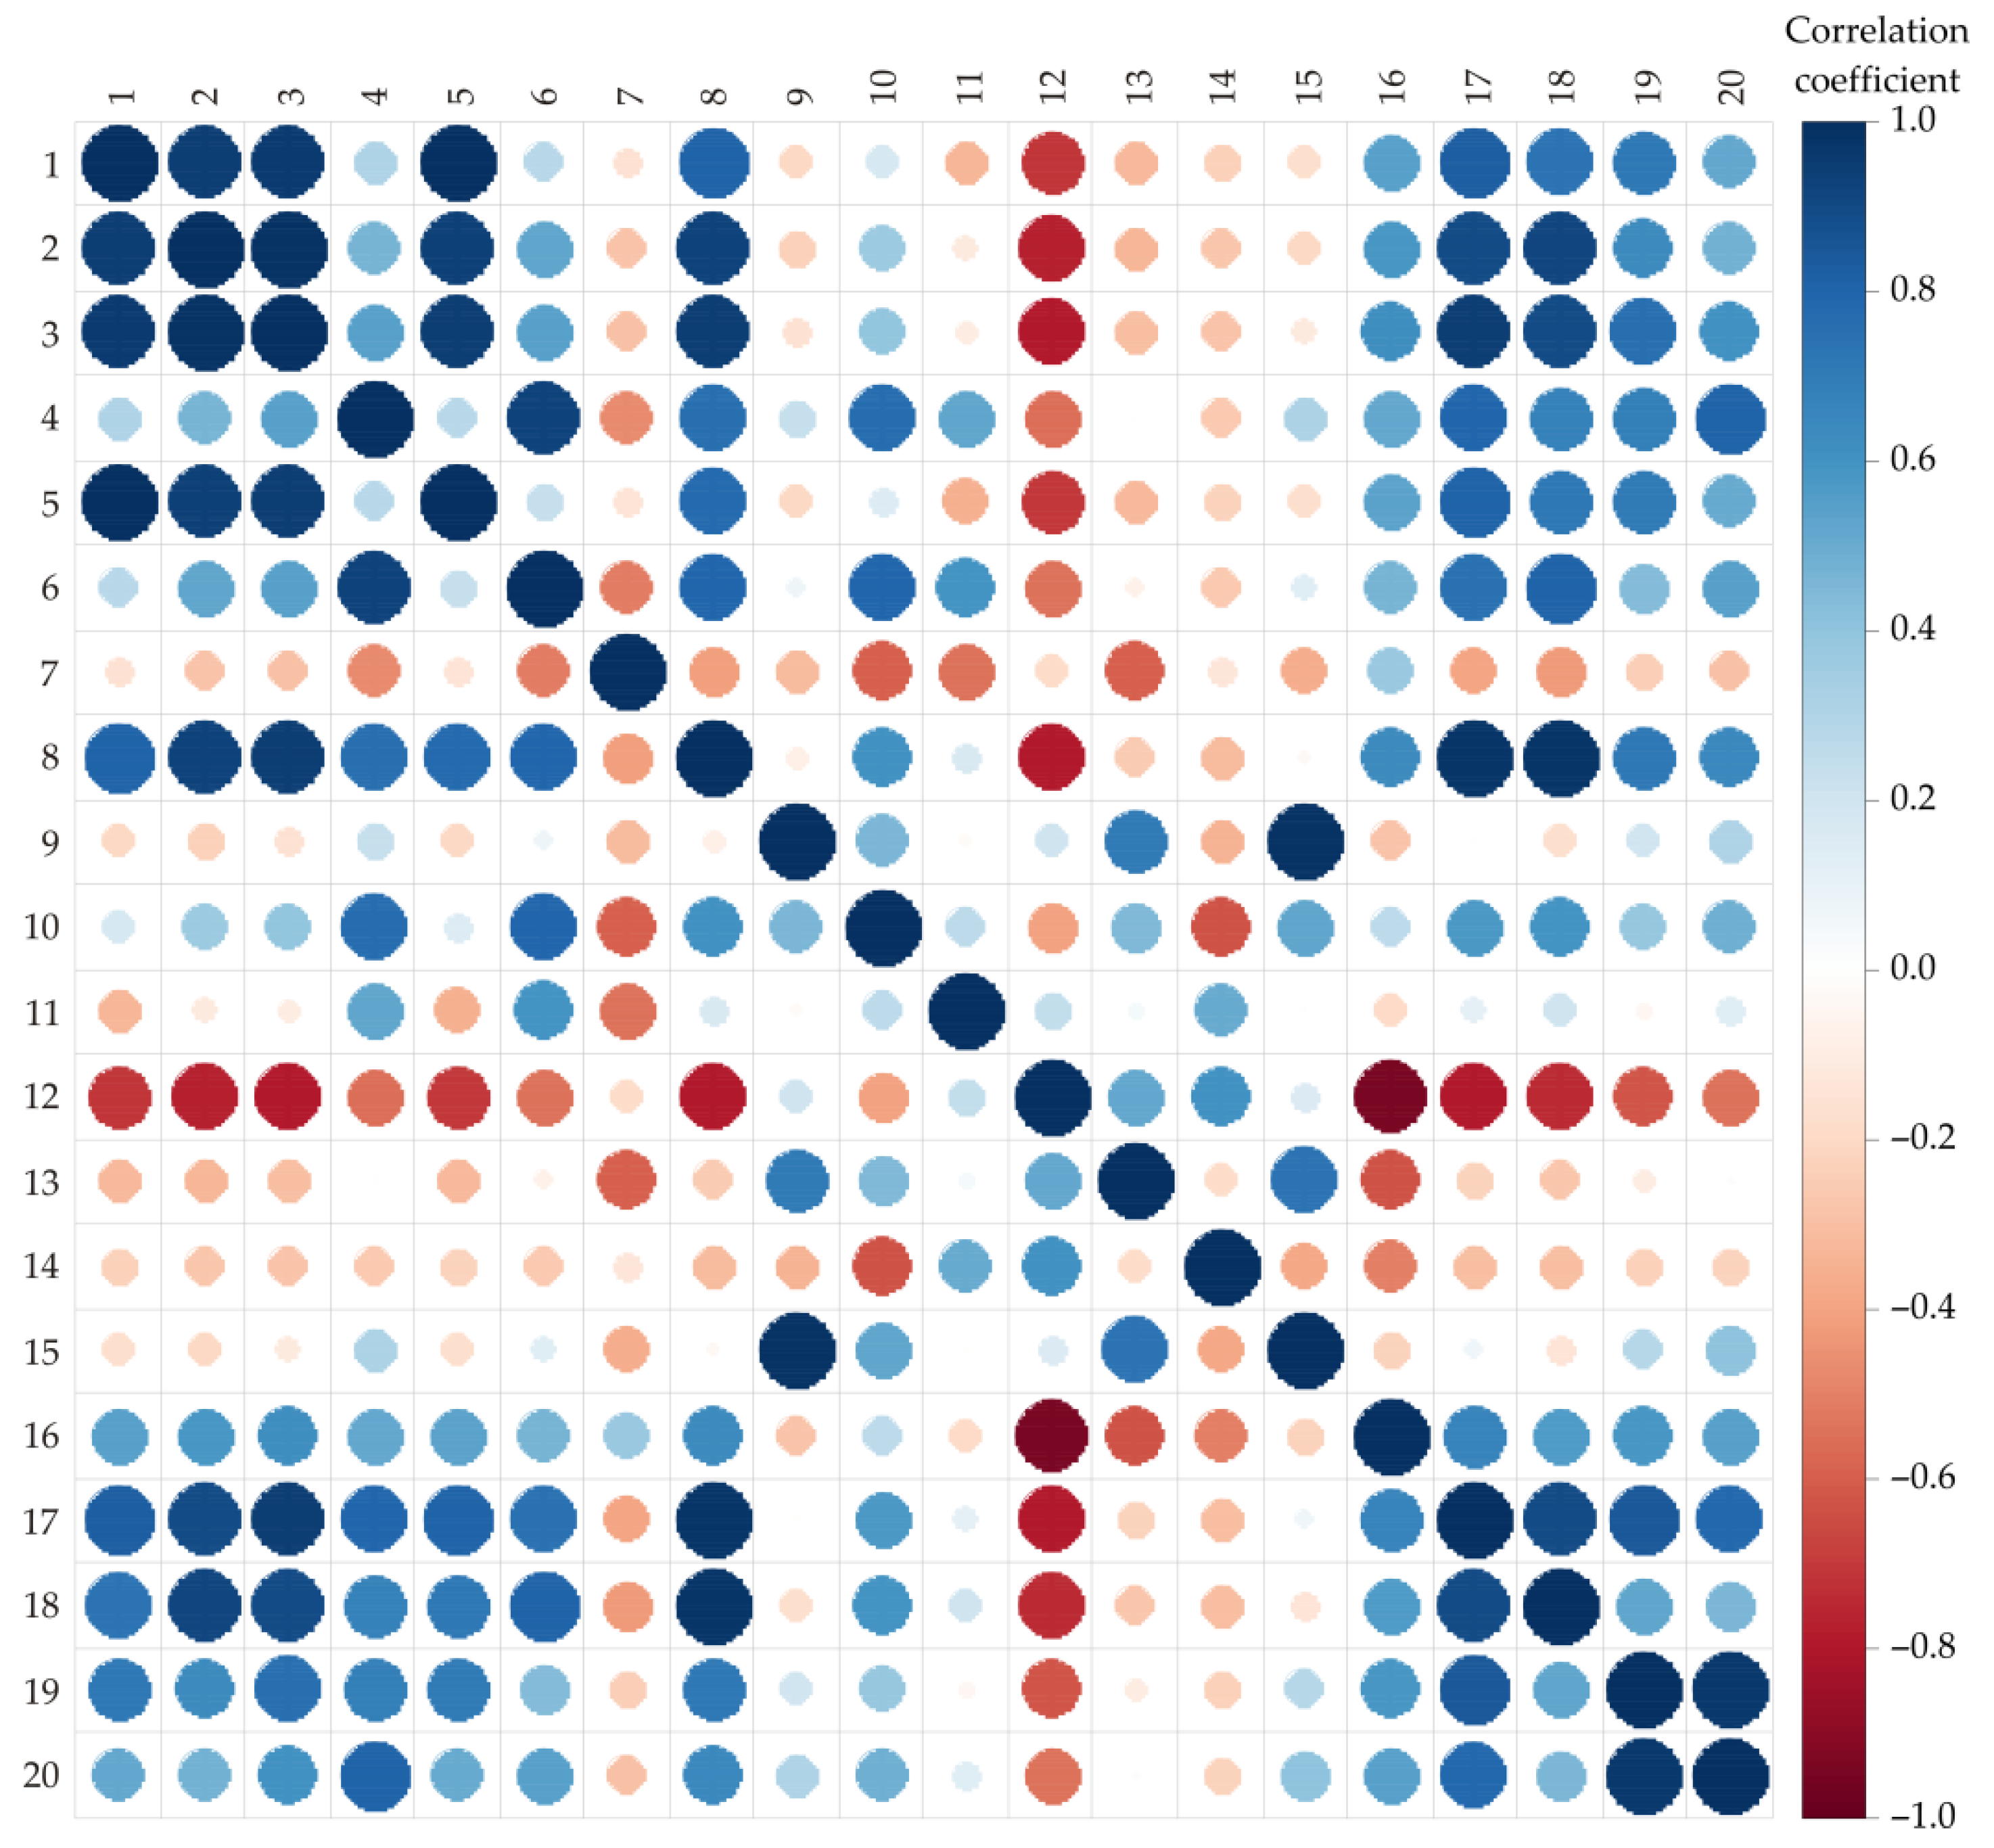
For easier understanding and presenting the differences and similarities of the tested hydrolate samples, the correlation analysis was performed to analyze the similarities between volatile compounds of
S. officinalis hydrolate, and the results are displayed in
Figure 3.
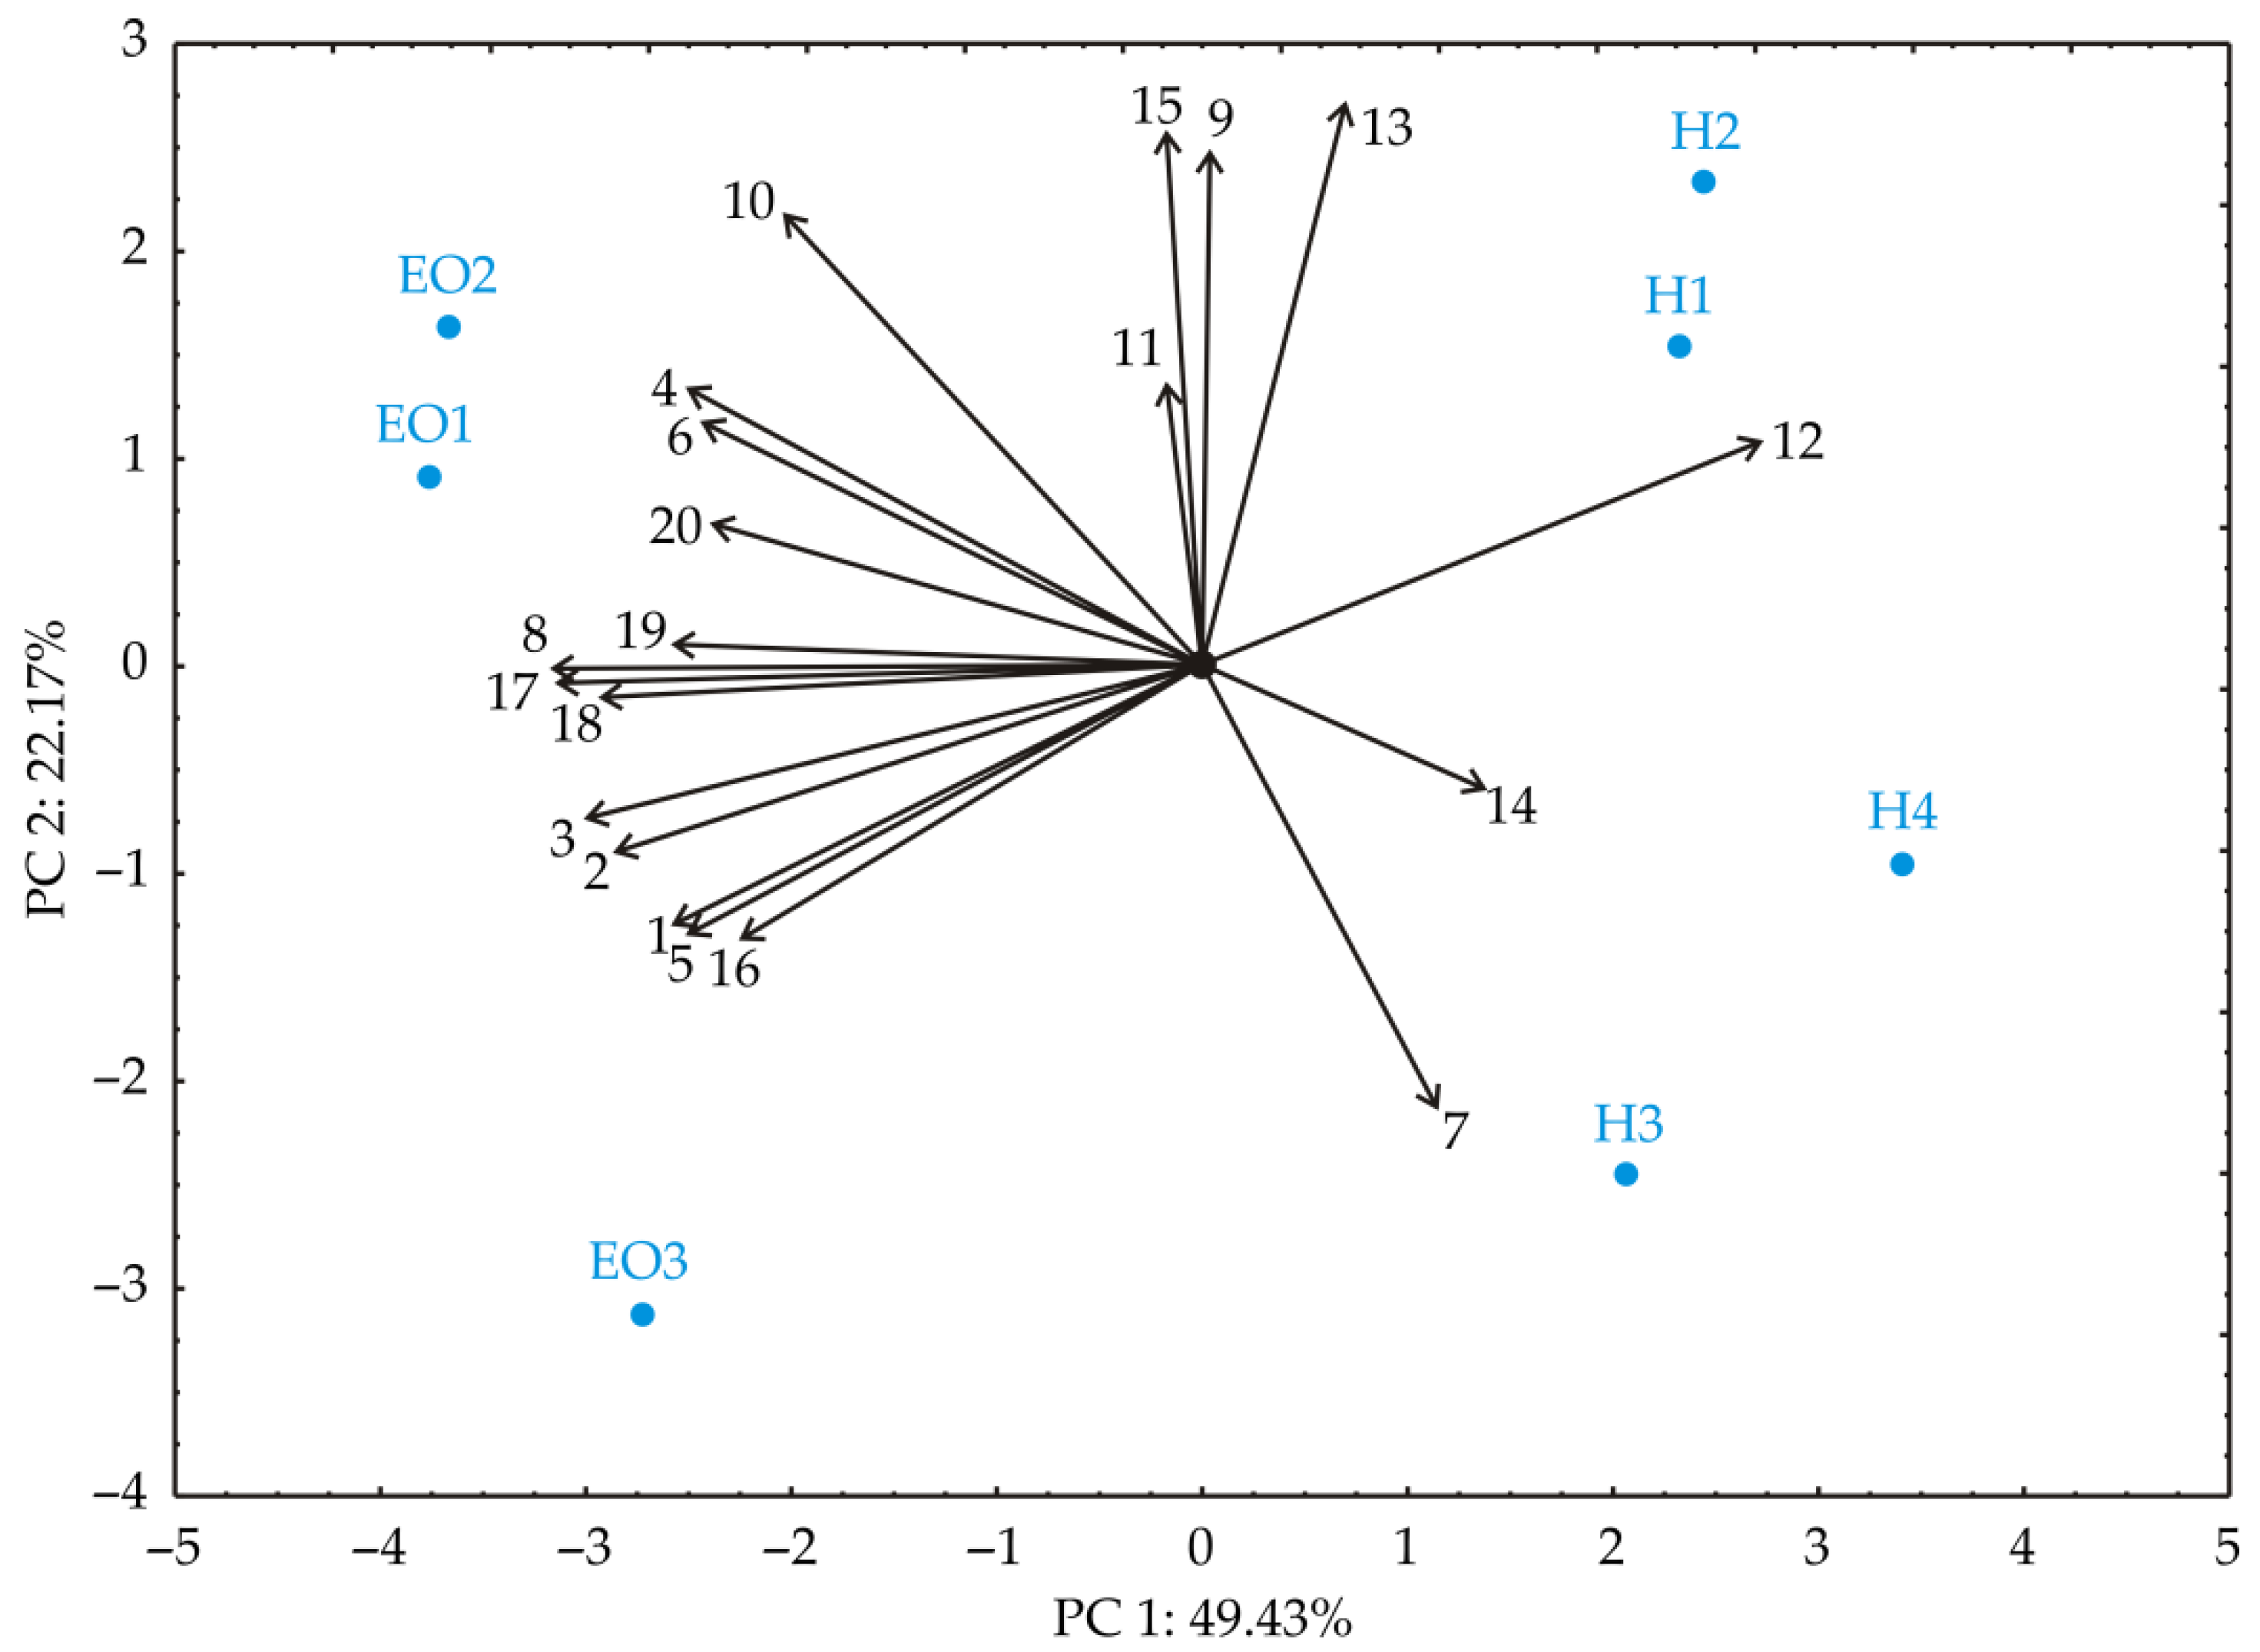
The PCA of the relations between the volatile compounds of
S. officinalis hydrolate explained that the first two principal components summarized 100% of the total variance in the 44 parameters (volatile compounds). The first PC explained 59.18% and the second 40.82% of the total variance between the experimental data. The parting within samples could be seen from the PCA
Figure 4, where the volatile compounds of
S. officinalis hydrolate during 2019 are assembled on the left, 2020 on the right, and 2021 on the bottom side of the graphic.
There are only two previous studies including a comparative analysis of
S. officinalis essential oil and corresponding hydrolate [
45,
46], while one focuses only on hydrolate [
47]. The hydrolate composition was rather different from the essential oil [
46]. The main compounds in both, as in our study, are 1,8-cineole (10.0–30.4% in EO and 15.5–61.4% in H),
cis-thujone (9.7–23.5% in EO and 8.4–15.7% in H) and camphor (17.1–19.9% in EO and 22.5–44.9% in H) (
Table 6). As can be seen, the content of the first two compounds (1,8-cineole and
cis-thujone) was higher in essential oil than in hydrolate, while the content of camphor was higher in hydrolate in comparison to essential oil. The highest content of camphor in hydrolate in comparison to essential oil could be explained by the fact that camphor is highly soluble in distillation water [
46].
According to this study and the literature, the correlation analysis results about the similarities between volatile compounds of essential oil and hydrolate composition were graphically presented in
Figure 5.
According to this study and the literature, the PCA of the relations between volatile compounds of essential oil and hydrolate composition (
Figure 6) explained that the first two principal components summarized 71.6% of the total variance in the 20 parameters (volatile compounds). The first PC explained 49.43% and the second 22.17% of the total variance between the experimental data. The parting within samples could be seen from the PCA figure, where the volatile compounds of
S. officinalis essential oil are arranged on the left side, while the volatile compounds of
S. officinalis hydrolate are arranged on the side of the figure.
3.2. Antibiotic Susceptibility Testing of Wound-Associated Microorganisms
As mentioned, antimicrobial resistance is a foremost threat to human health. Different bacteria and fungi, causing infections in human and animal populations, have developed resistance to each new antibiotic coming to market [
2]. Therefore, testing all clinical-relevant isolates on different well-known antibiotics, but also finding effective alternatives for the antibiotic need to be imperative to this and the next human generation. In this study, antibiotic susceptibility patterns for the analyzed eight respiratory-associated bacteria are shown in
Table 7. Antibiotics included in the testing are ampicillin (AMP), amoxicillin-clavulanic acid (AMC), piperacillin-tazobactam (TZP), cefuroxime (axetil or sodium) (CXM), cefotaxime (CTX), ceftriaxone (CRO), ceftazidime (CAZ), cefepime (FEP), gentamicin (GEN), amikacin (AMK), tobramycin (TOB), ciprofloxacin (CIP), levofloxacin (LVX), cotrimoxazole (CMX), ertapenem (ERT), imipenem (IMI) meropenem (MEM), erythromycin (ERY), clindamycin (CLY), tetracycline (TET), linezolid (LZD), vancomycin (VAN), tigecycline (TGC). It can be seen that
S. aureus strains are most sensitive to the greatest number of the tested antibiotics, while
P. aeruginosa,
E. coli, and
Klebsiella representatives are resistant to some of the most commonly used antibiotics in clinical respiratory infections.
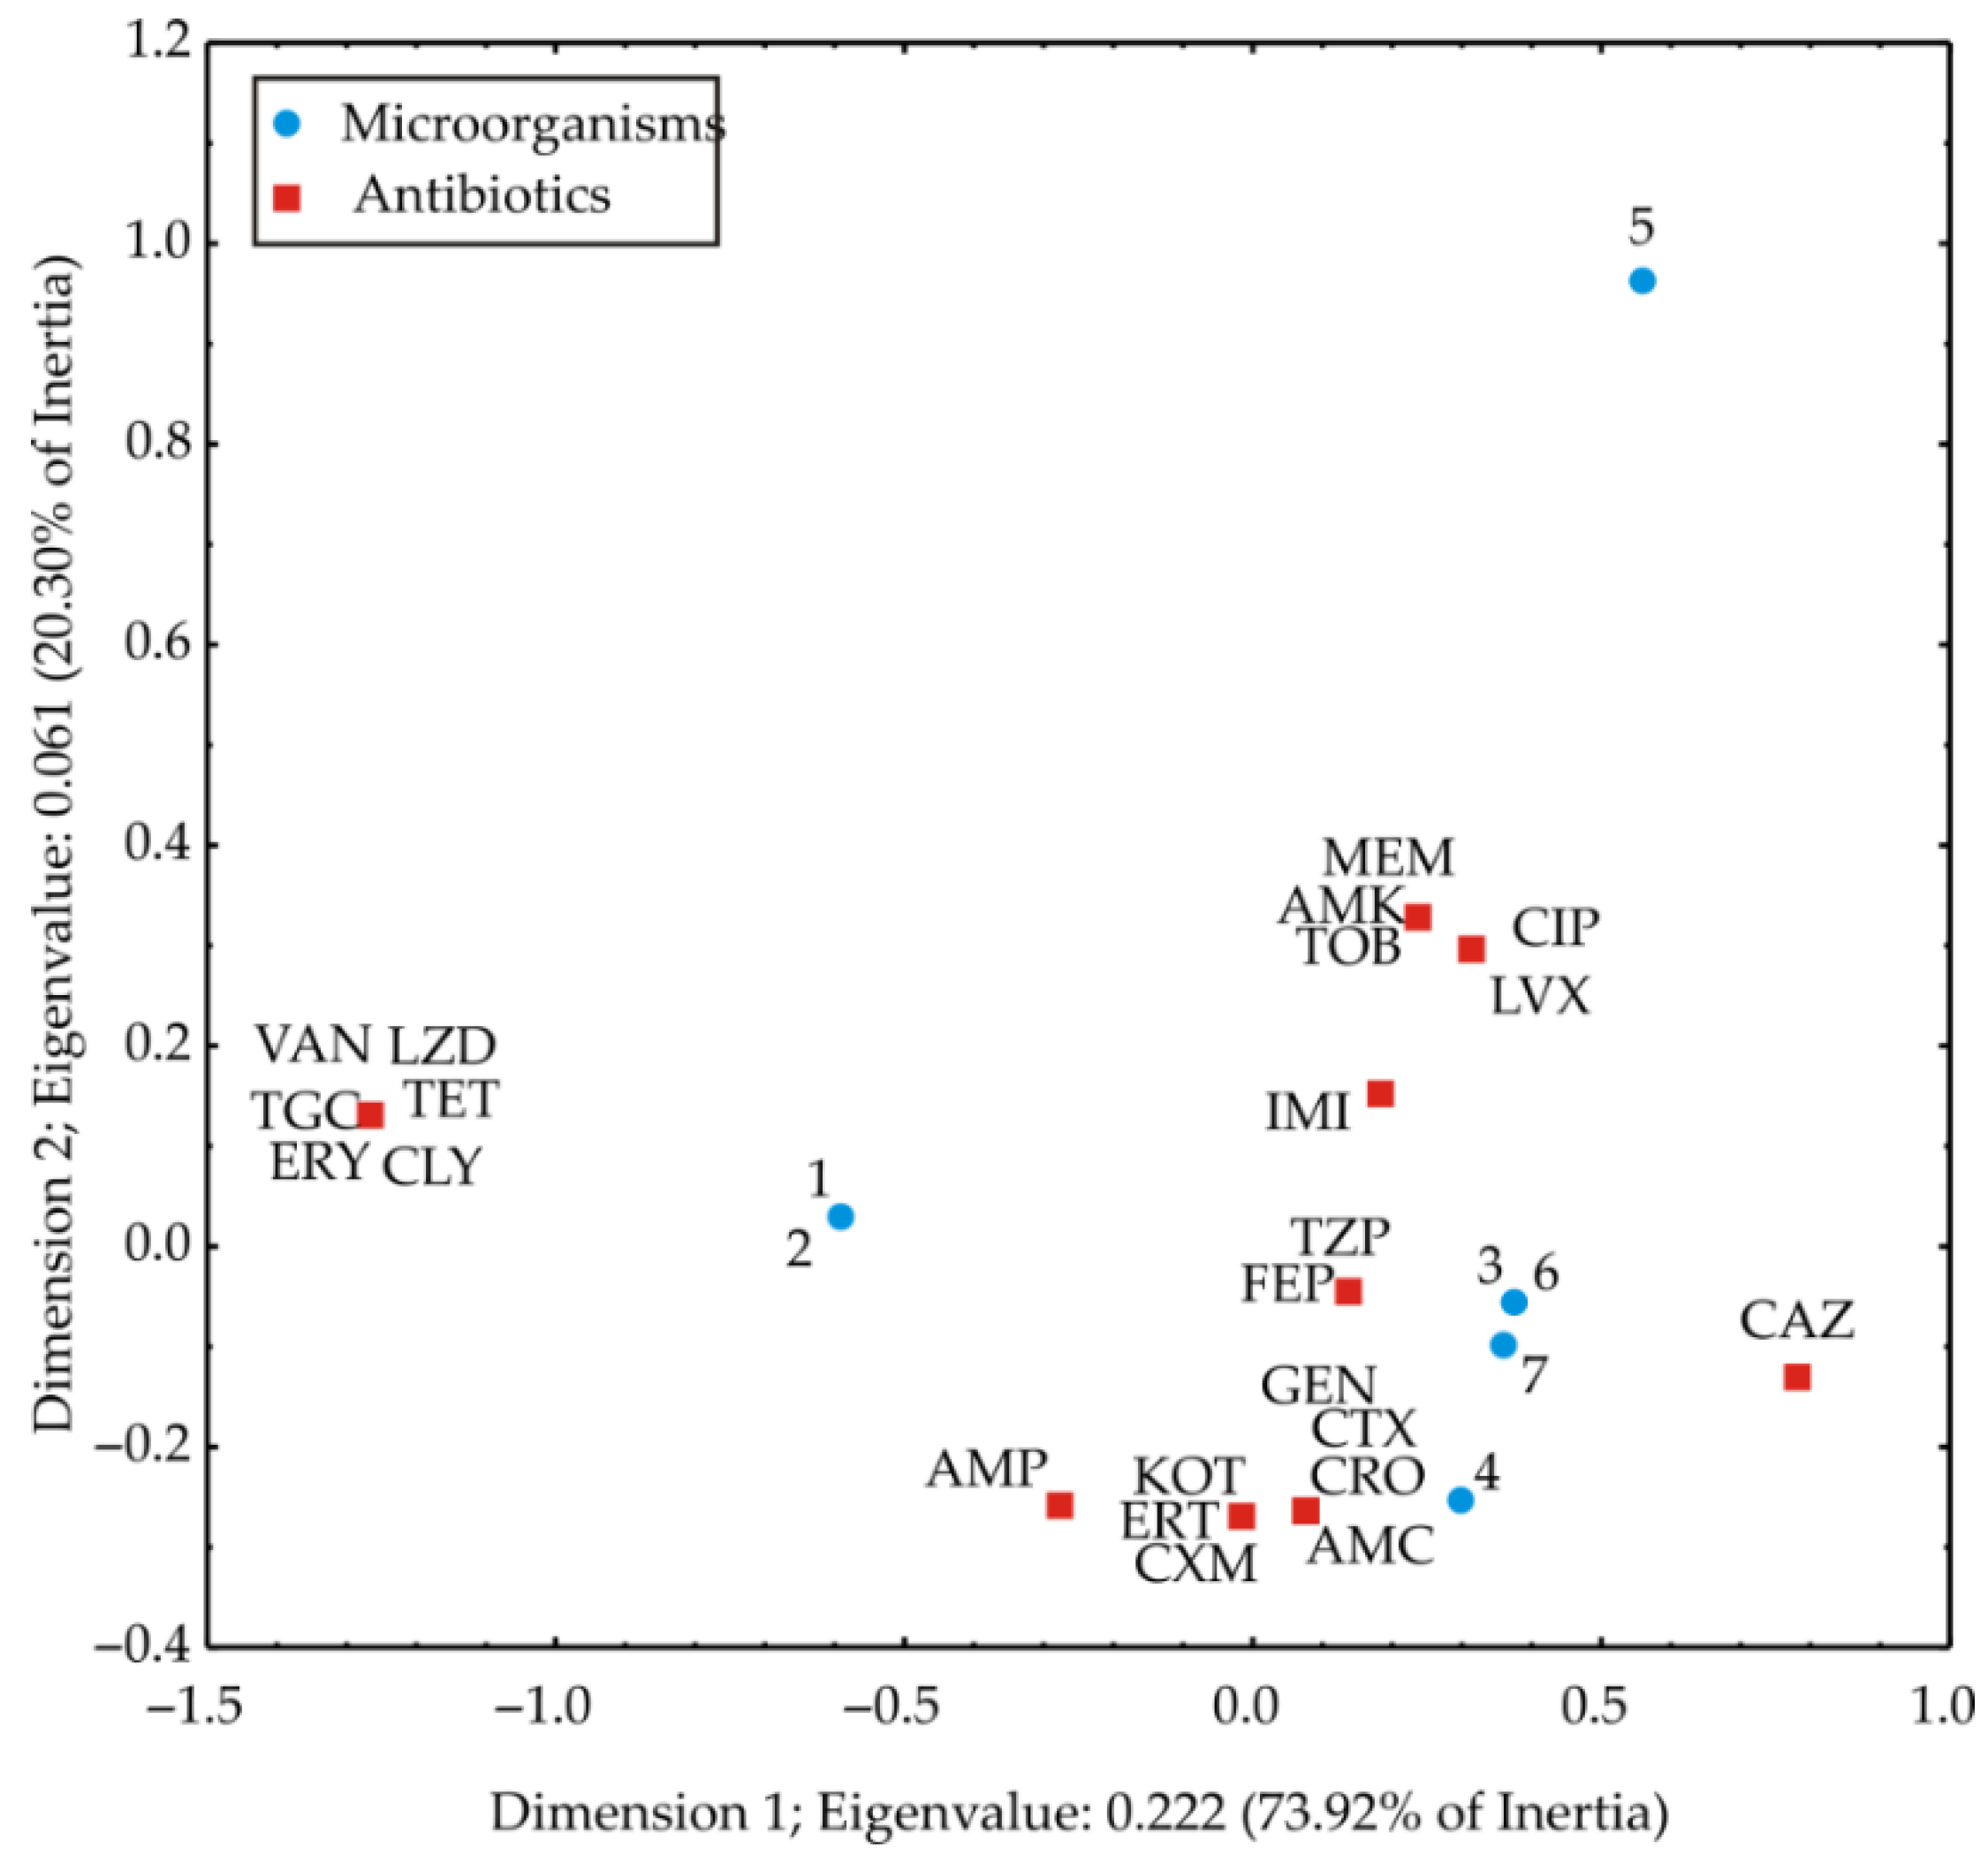
The graphical presentation of correspondence analysis for the experimental results of antibiotic susceptibility test presented in
Table 7 is illustrated in
Figure 7. Microorganisms are numbered according to
Table 7 (
C. albicans was omitted because is not a bacterial strain). Significant correspondence was detected among the considered categories (total inertia was 0.301; χ
2 was 101.13; df = 132;
p < 0.00097). The first two dimensions account for 94.22% of the total inertia, using a considerably satisfactory quota of the raw information. From
Figure 7, it can be seen that the most effective antibiotics on
S. aureus H2846 and
S. aureus 8684 were vancomycin, linezolid, tigecycline, tetracycline, erythromycin and clindamycin.
E. coli 8965 was the most sensitive to ceftriaxone, amoxicillin-clavulanic acid, cefotaxime, cotrimoxazole, ertapenem, cotrimoxazole, gentamicin and ampicillin.
E. cloacae 8923,
K. oxytoca 8929 and
K. pneumoniae H2807 were most sensitive to piperacillin-tazobactam, cefepime, gentamicin, cefotaxime, imipenem, and ceftazidime. Finally,
P. aeruginosa 8762 was the most sensitive to meropenem, amikacin, and tobramycin.
3.3. Antimicrobial Activity
As a preliminary approach and primary step in the antimicrobial profiling of the tested samples, minimal inhibitory and biocidal concentration was determined. The obtained minimal inhibitory concentration (MIC) and minimal bactericidal/fungicidal concentration (MBC/MFC) values of the investigated EOs and hydrolates are summarized in
Table 8. As can be seen,
S. officinalis oil showed the greatest effectiveness compared to hydrolates. Generally, EOs of
S. officinalis showed remarkable antimicrobial activity against seven of eight tested microorganisms. MIC and MBC of sensitive bacteria ranged between 28.40 and 227.25 μL mL
−1 while for
C. albicans MIC/MFC ranged from 28.40/56.81 to 56.81–113.63 μL mL
−1.
S. officinalis oil from 2019 and 2020 showed equal MIC against gram-positive bacteria (
S. aureus H2846 and
S. aureus 8684) and gram-negative bacteria (
E. coli,
E. cloacae,
K. pneumonia, and
K. oxytoca) MIC = 56.81 μL mL
−1 with the exception of strain
P. aeruginosa (MIC/MBC= >454.50 μL mL
−1). A high level of intrinsic resistance of
P. aeruginosa to most antibiotics through restricted outer membrane permeability, efflux systems that pump antibiotics out of the cell, and production of antibiotic-inactivating enzymes such as β-lactamases, has been shown through many studies [
48].
Further, the strongest activity shows essential oil distilled from plants grown in 2021, against
K. oxytoca (the lowest concentrations for MIC and MBC, 14.20 and 28.4 μL mL
−1, respectively). According to
Table 3, this sample has the highest concentration of oxygenated monoterpenes (among them 1,8-cineole, linalool,
trans-thujone, and borneol), and their synergistic activity could be responsible for the effect. On the other side, hydrolates were inactive against all tested pathogens with MIC/MBC higher than 606 μL mL
−1 (
Table 8).
Antibacterial activity of
S. officinalis can be attributed primarily to the presence of camphor,
cis-Thujone,
trans- Thujone, and 1,8-cineole but not to other compounds with lower amounts [
26]. In other research, the presence of the components 1,8-cineole, thujone, and camphor has also been related to the antimicrobial activity of sage essential oil [
32,
49]. Results obtained in this study were confirmed by Delamare et al. [
32] who showed that the antimicrobial activities of
S. officinalis against
E. coli,
P. aeruginosa,
B. subtilis, and
S. aureus were attributed to high concentrations of thujone, 1,8-cineole and camphor [
45]. In the same way, Hammer et al. demonstrated that camphor and 1,8-cineole were the main components responsible for the antibacterial activity against
B. subtilis,
E. coli, and
S. aureus [
50]. Dorman and Deans [
51] stated that the minor components of essential oil, such as borneol, possess antimicrobial activities.


 ,
, 


