
Thermal Stability Evaluation of T152 Emulsifier on the Modification Influence of Fireworks Propellant


Abstract
:1. Introduction
2. Experimental and Methods
2.1. Sample
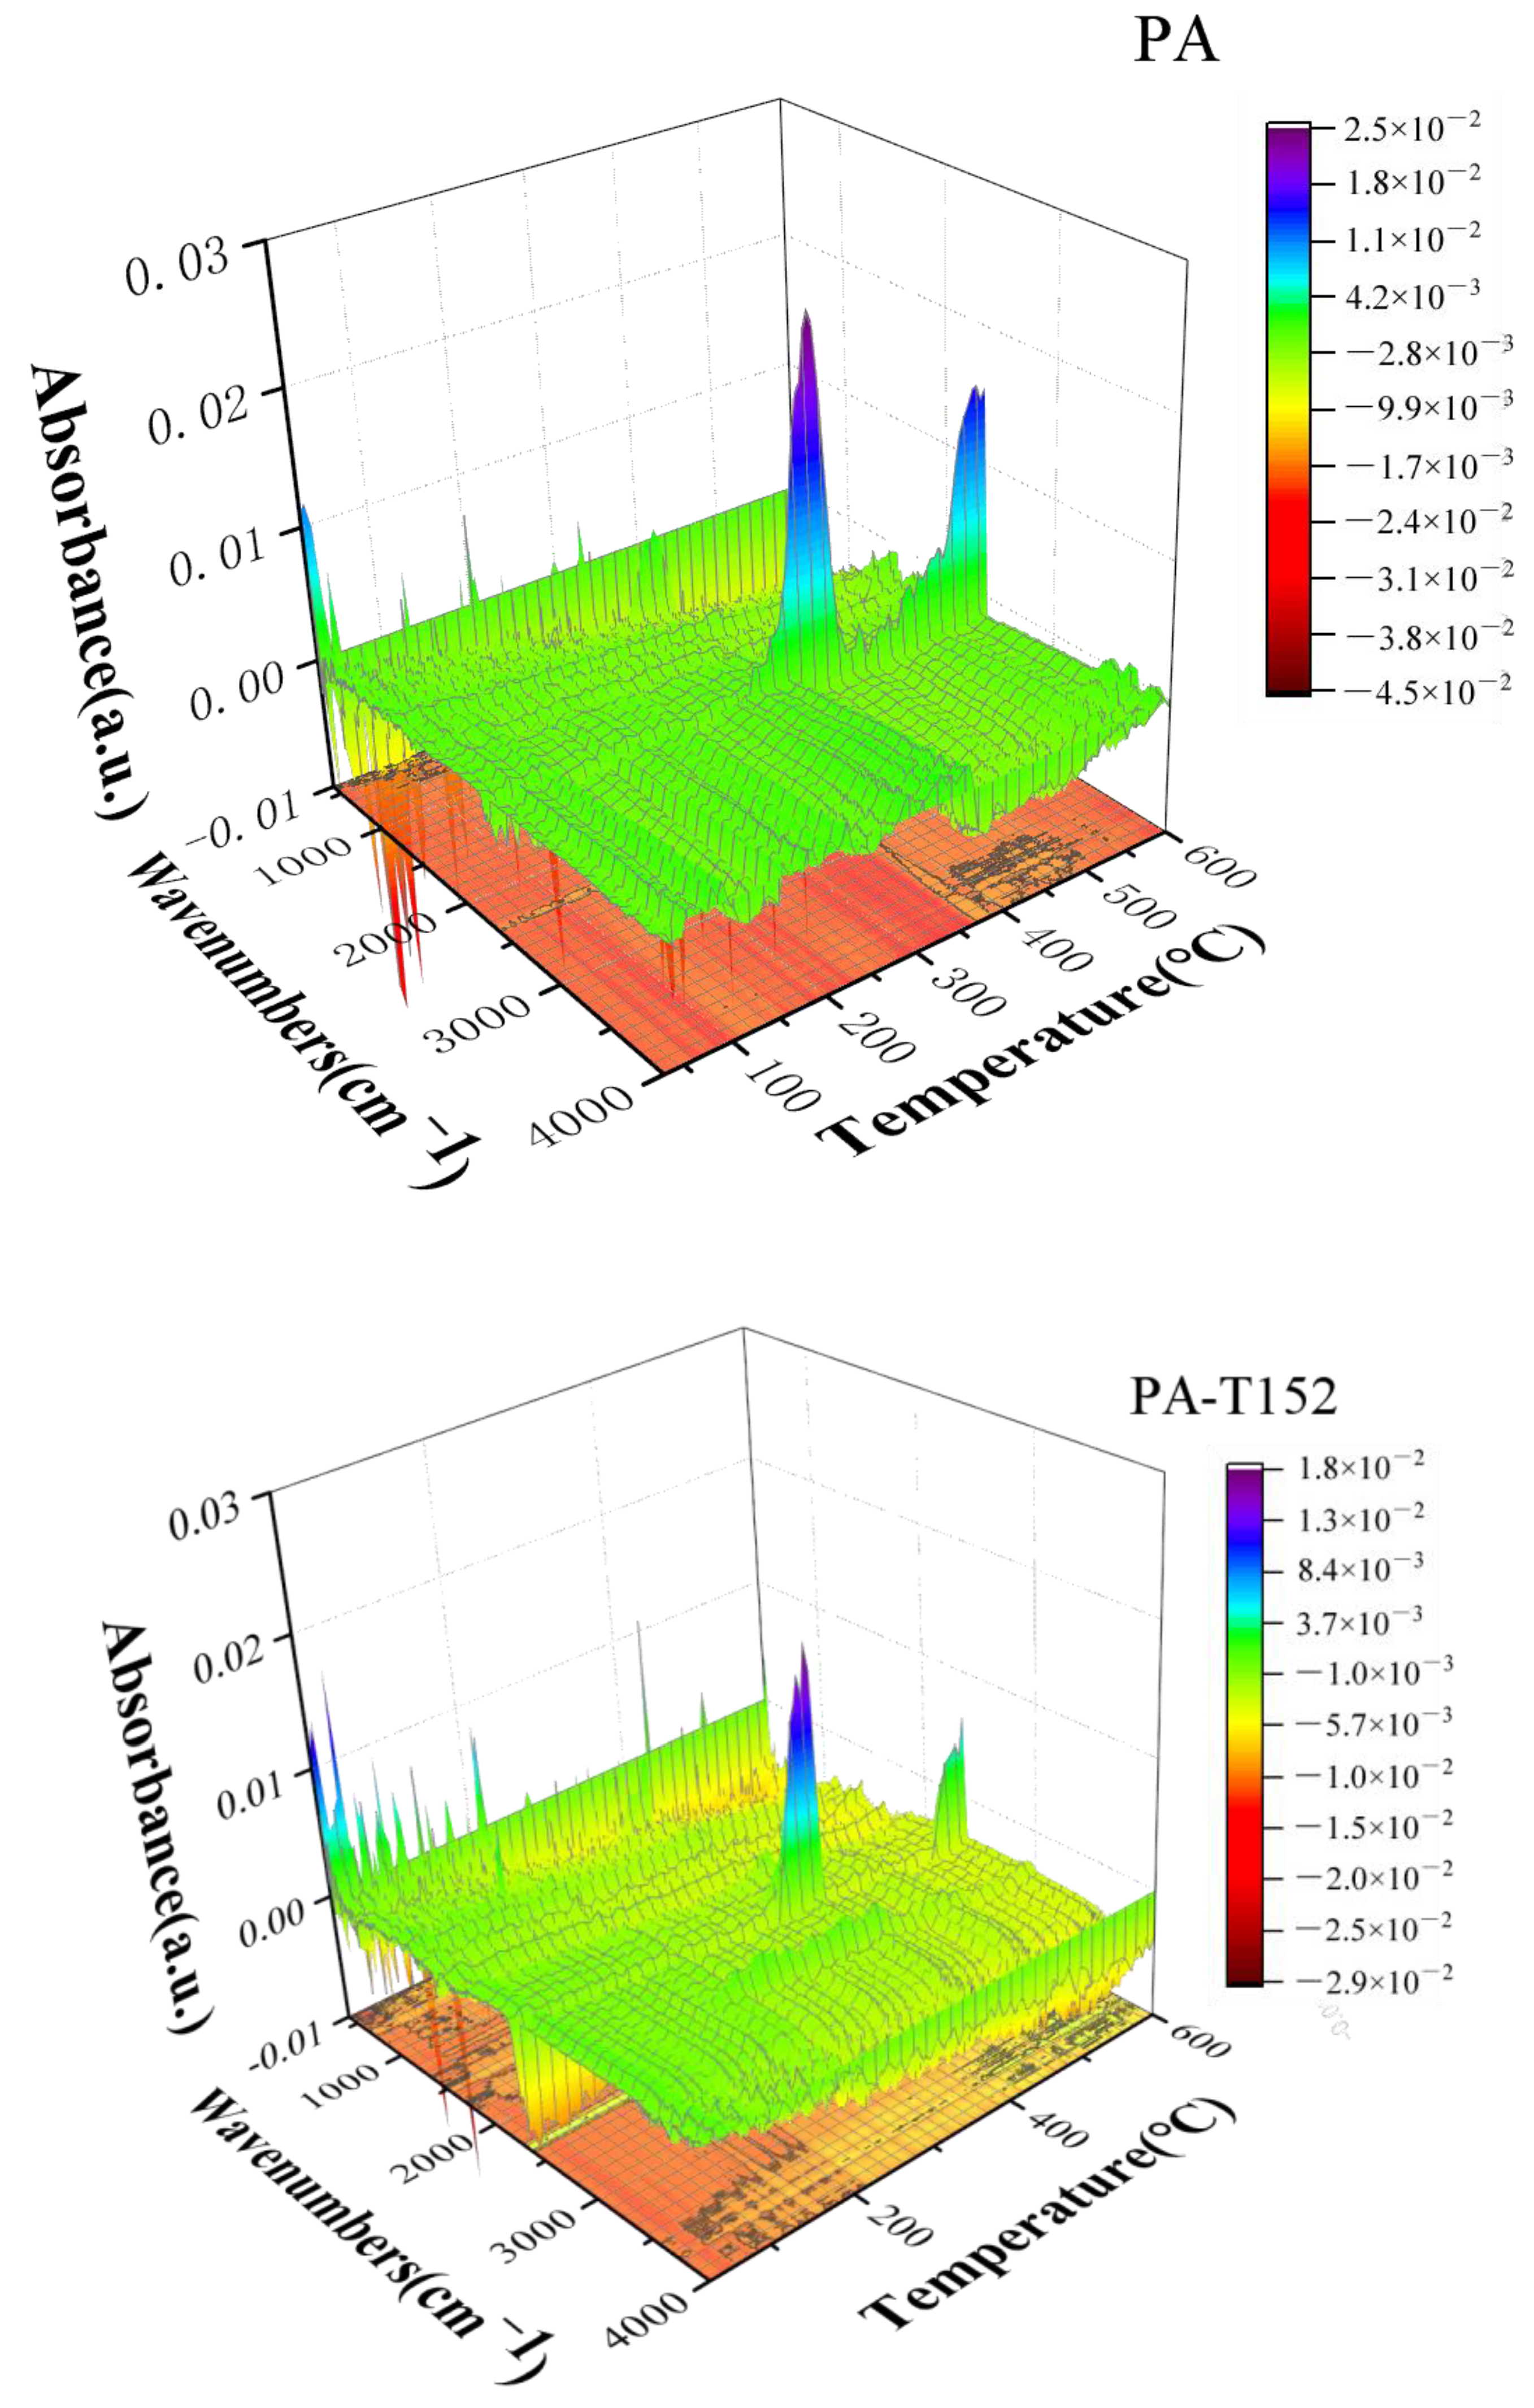
2.2. Thermogravimetric Fourier-Transform Infrared Spectrometry (TG-FTIR)
2.3. Differential Scanning Calorimetry (DSC)
2.4. Thermokinetic Analysis Methods
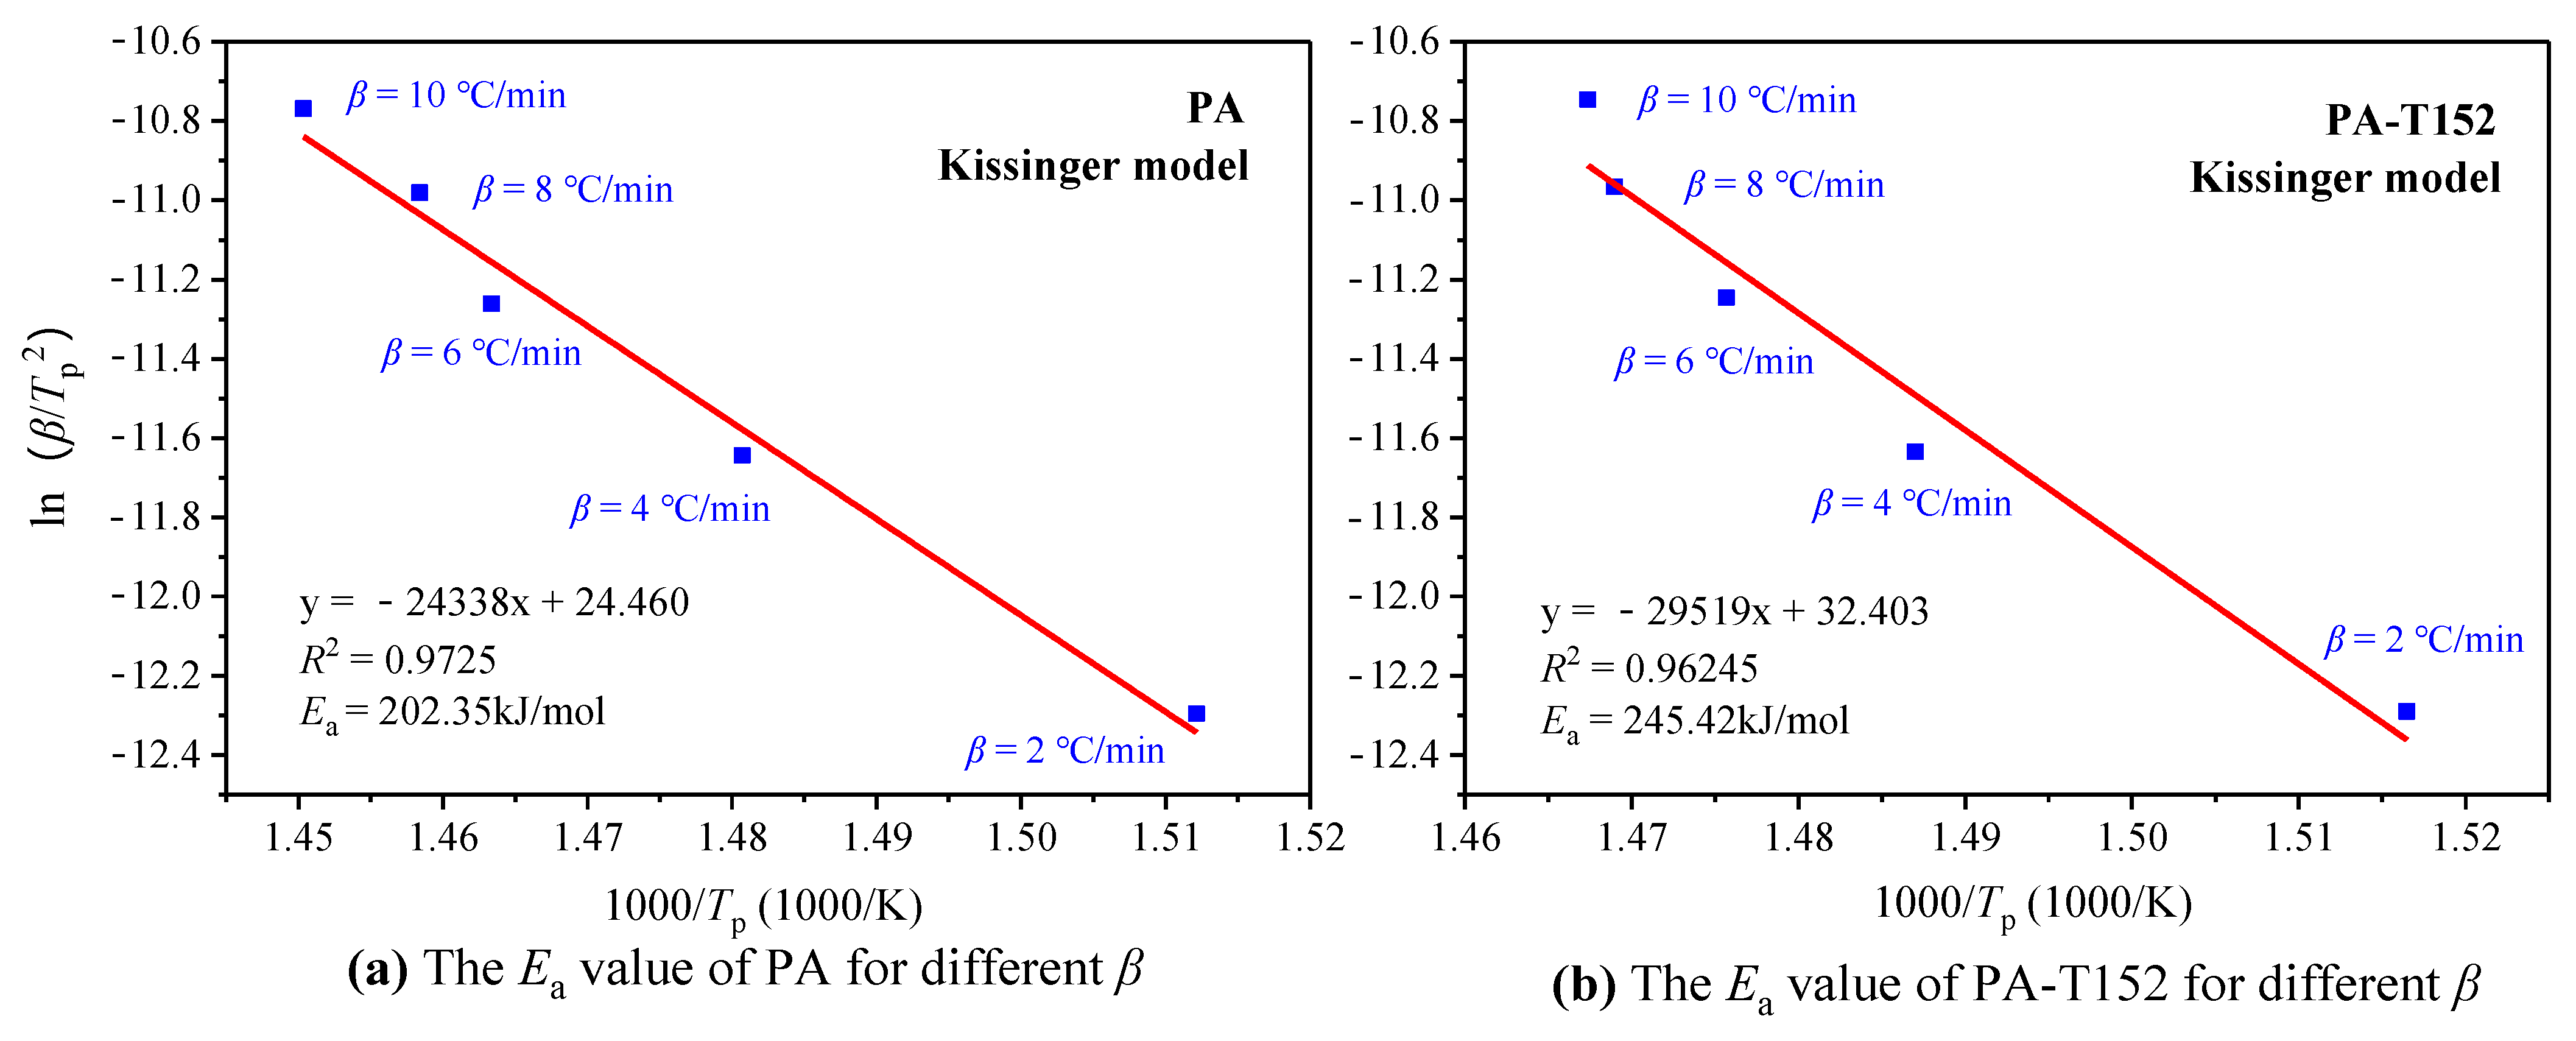
2.4.1. Kissinger Method
2.4.2. Friedman Method
2.4.3. KAS Method
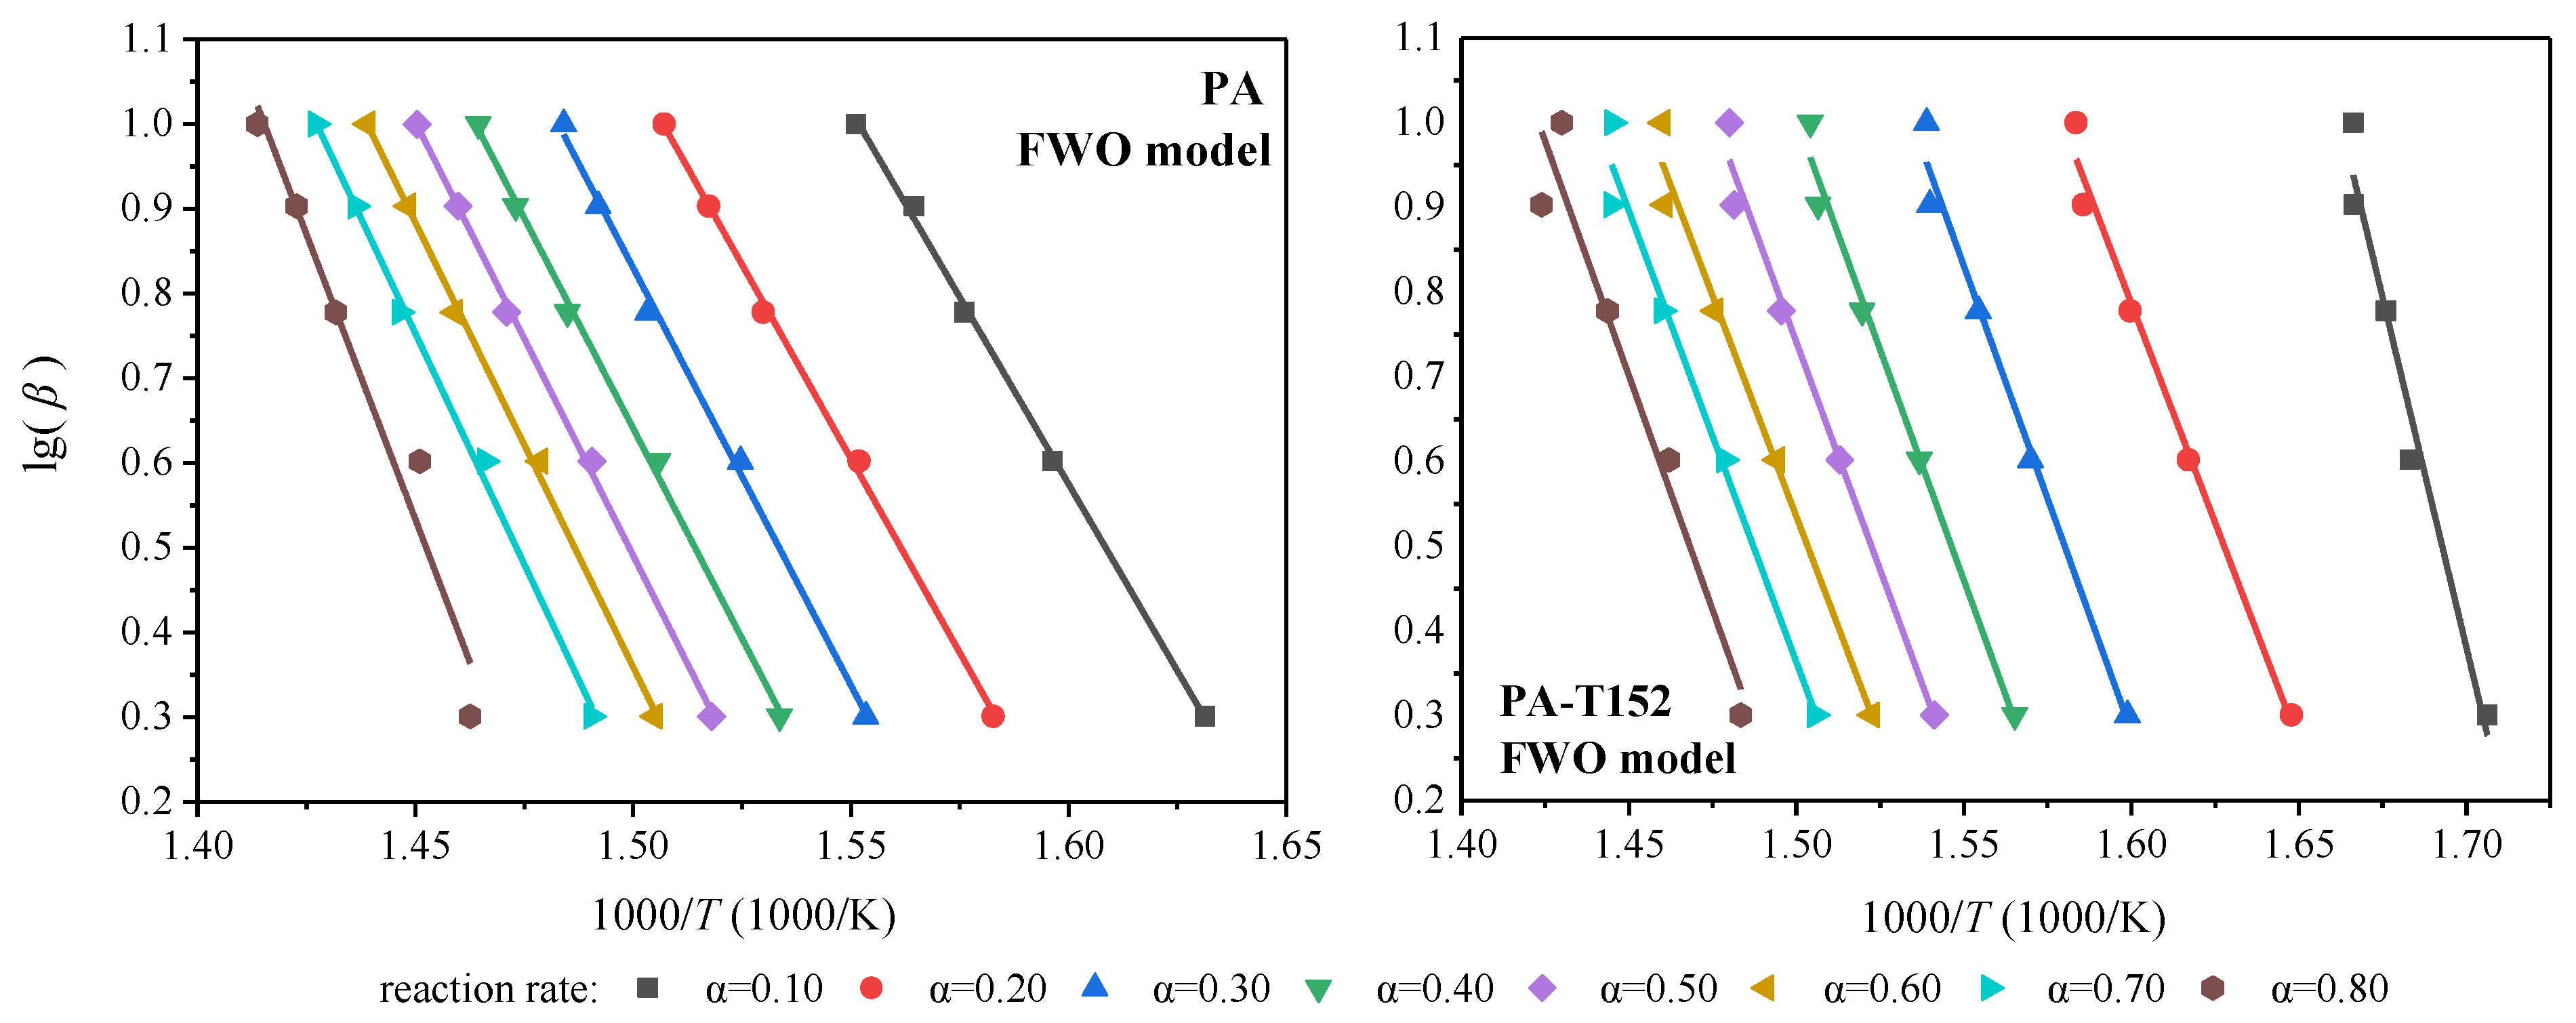
2.4.4. FWO Method
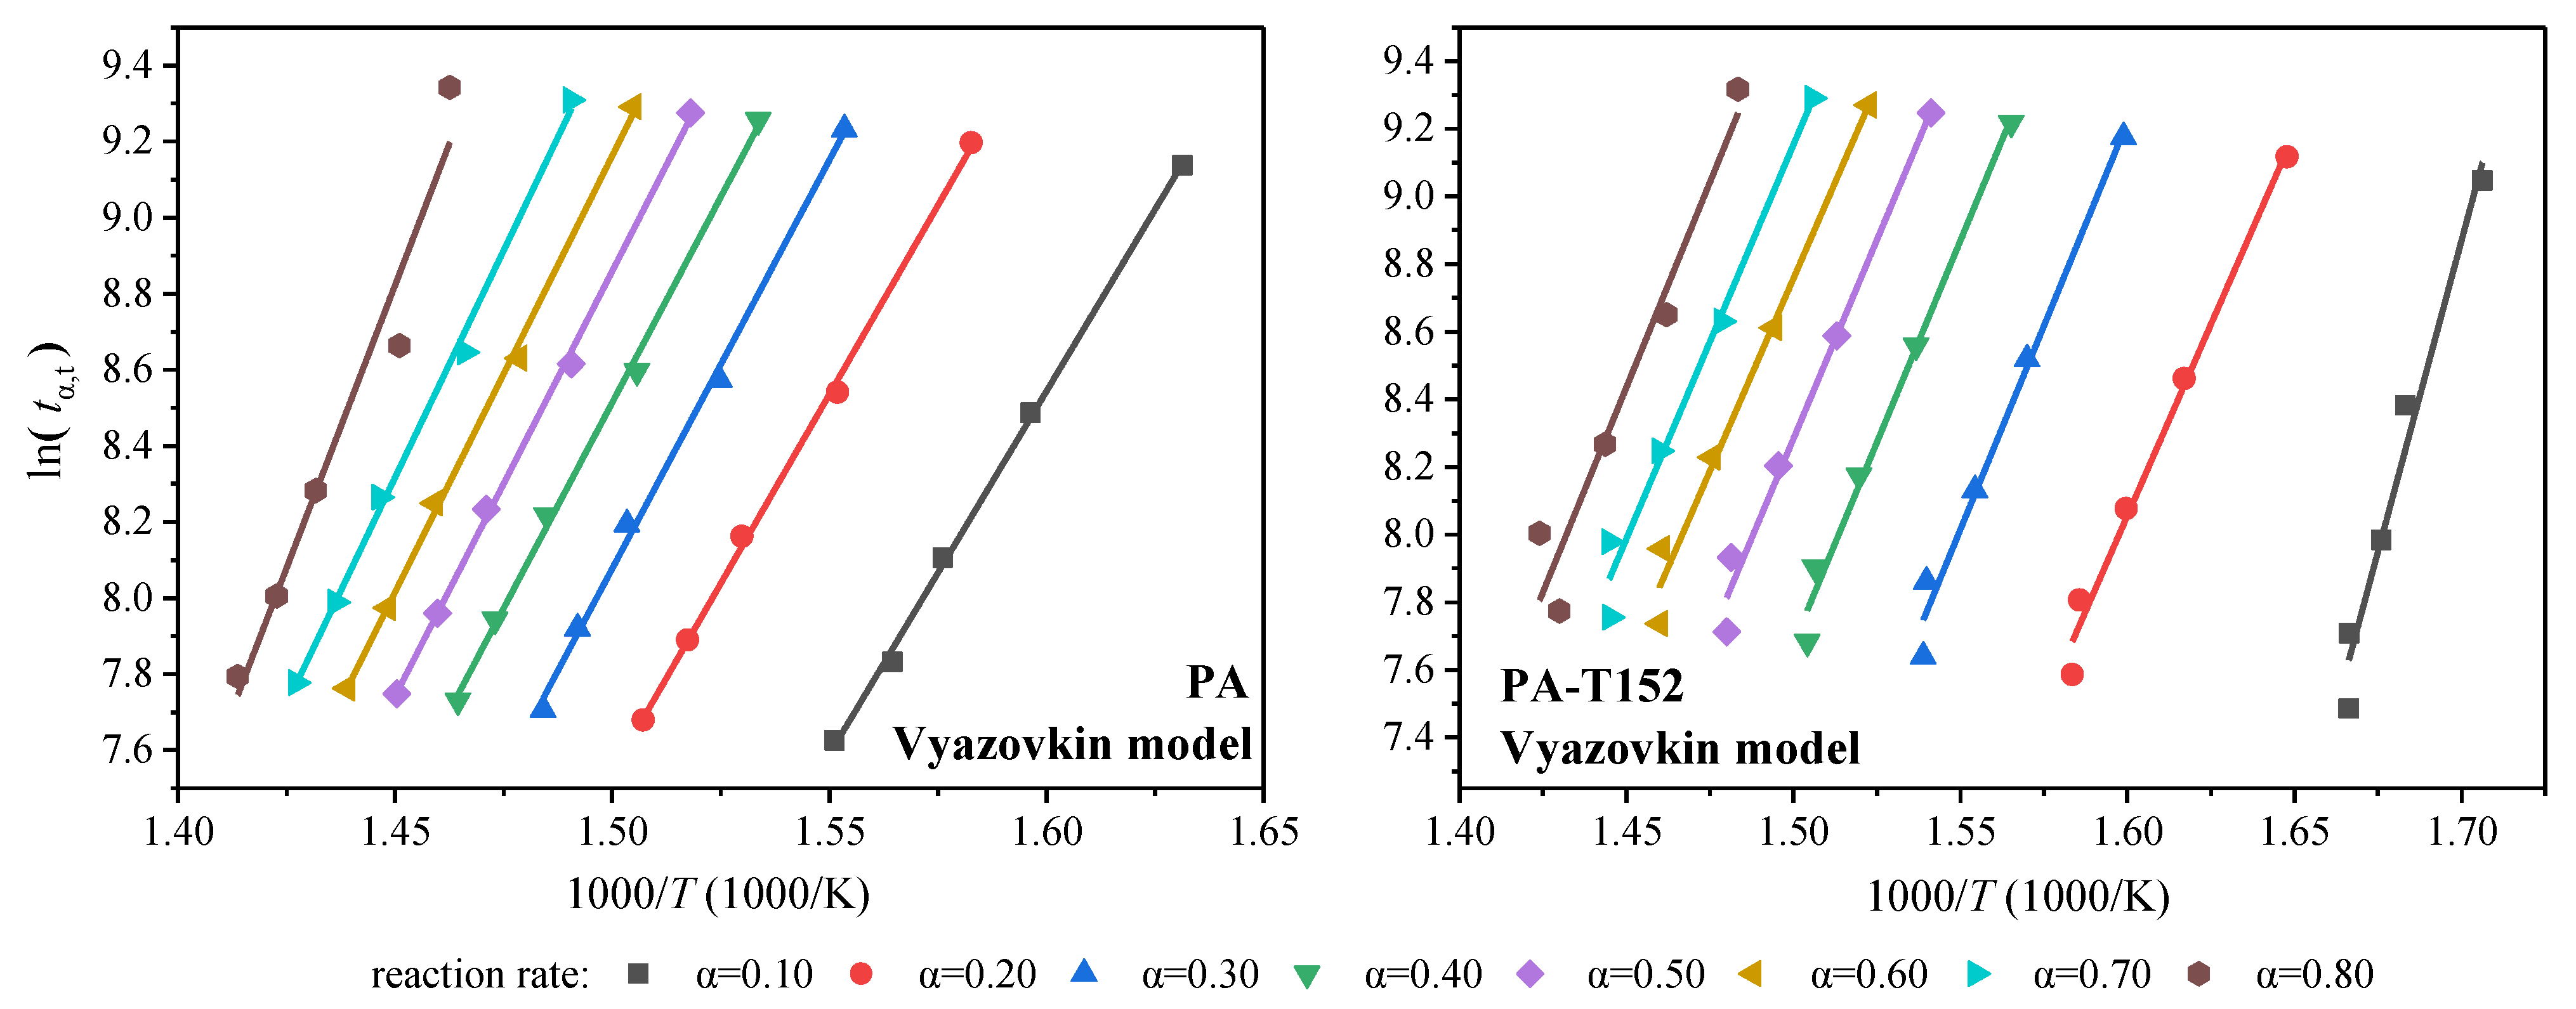
2.4.5. Vyazovkin Method
2.4.6. Starink Method
3. Results and Discussion
3.1. Thermal Parameters of PA and PA-T152
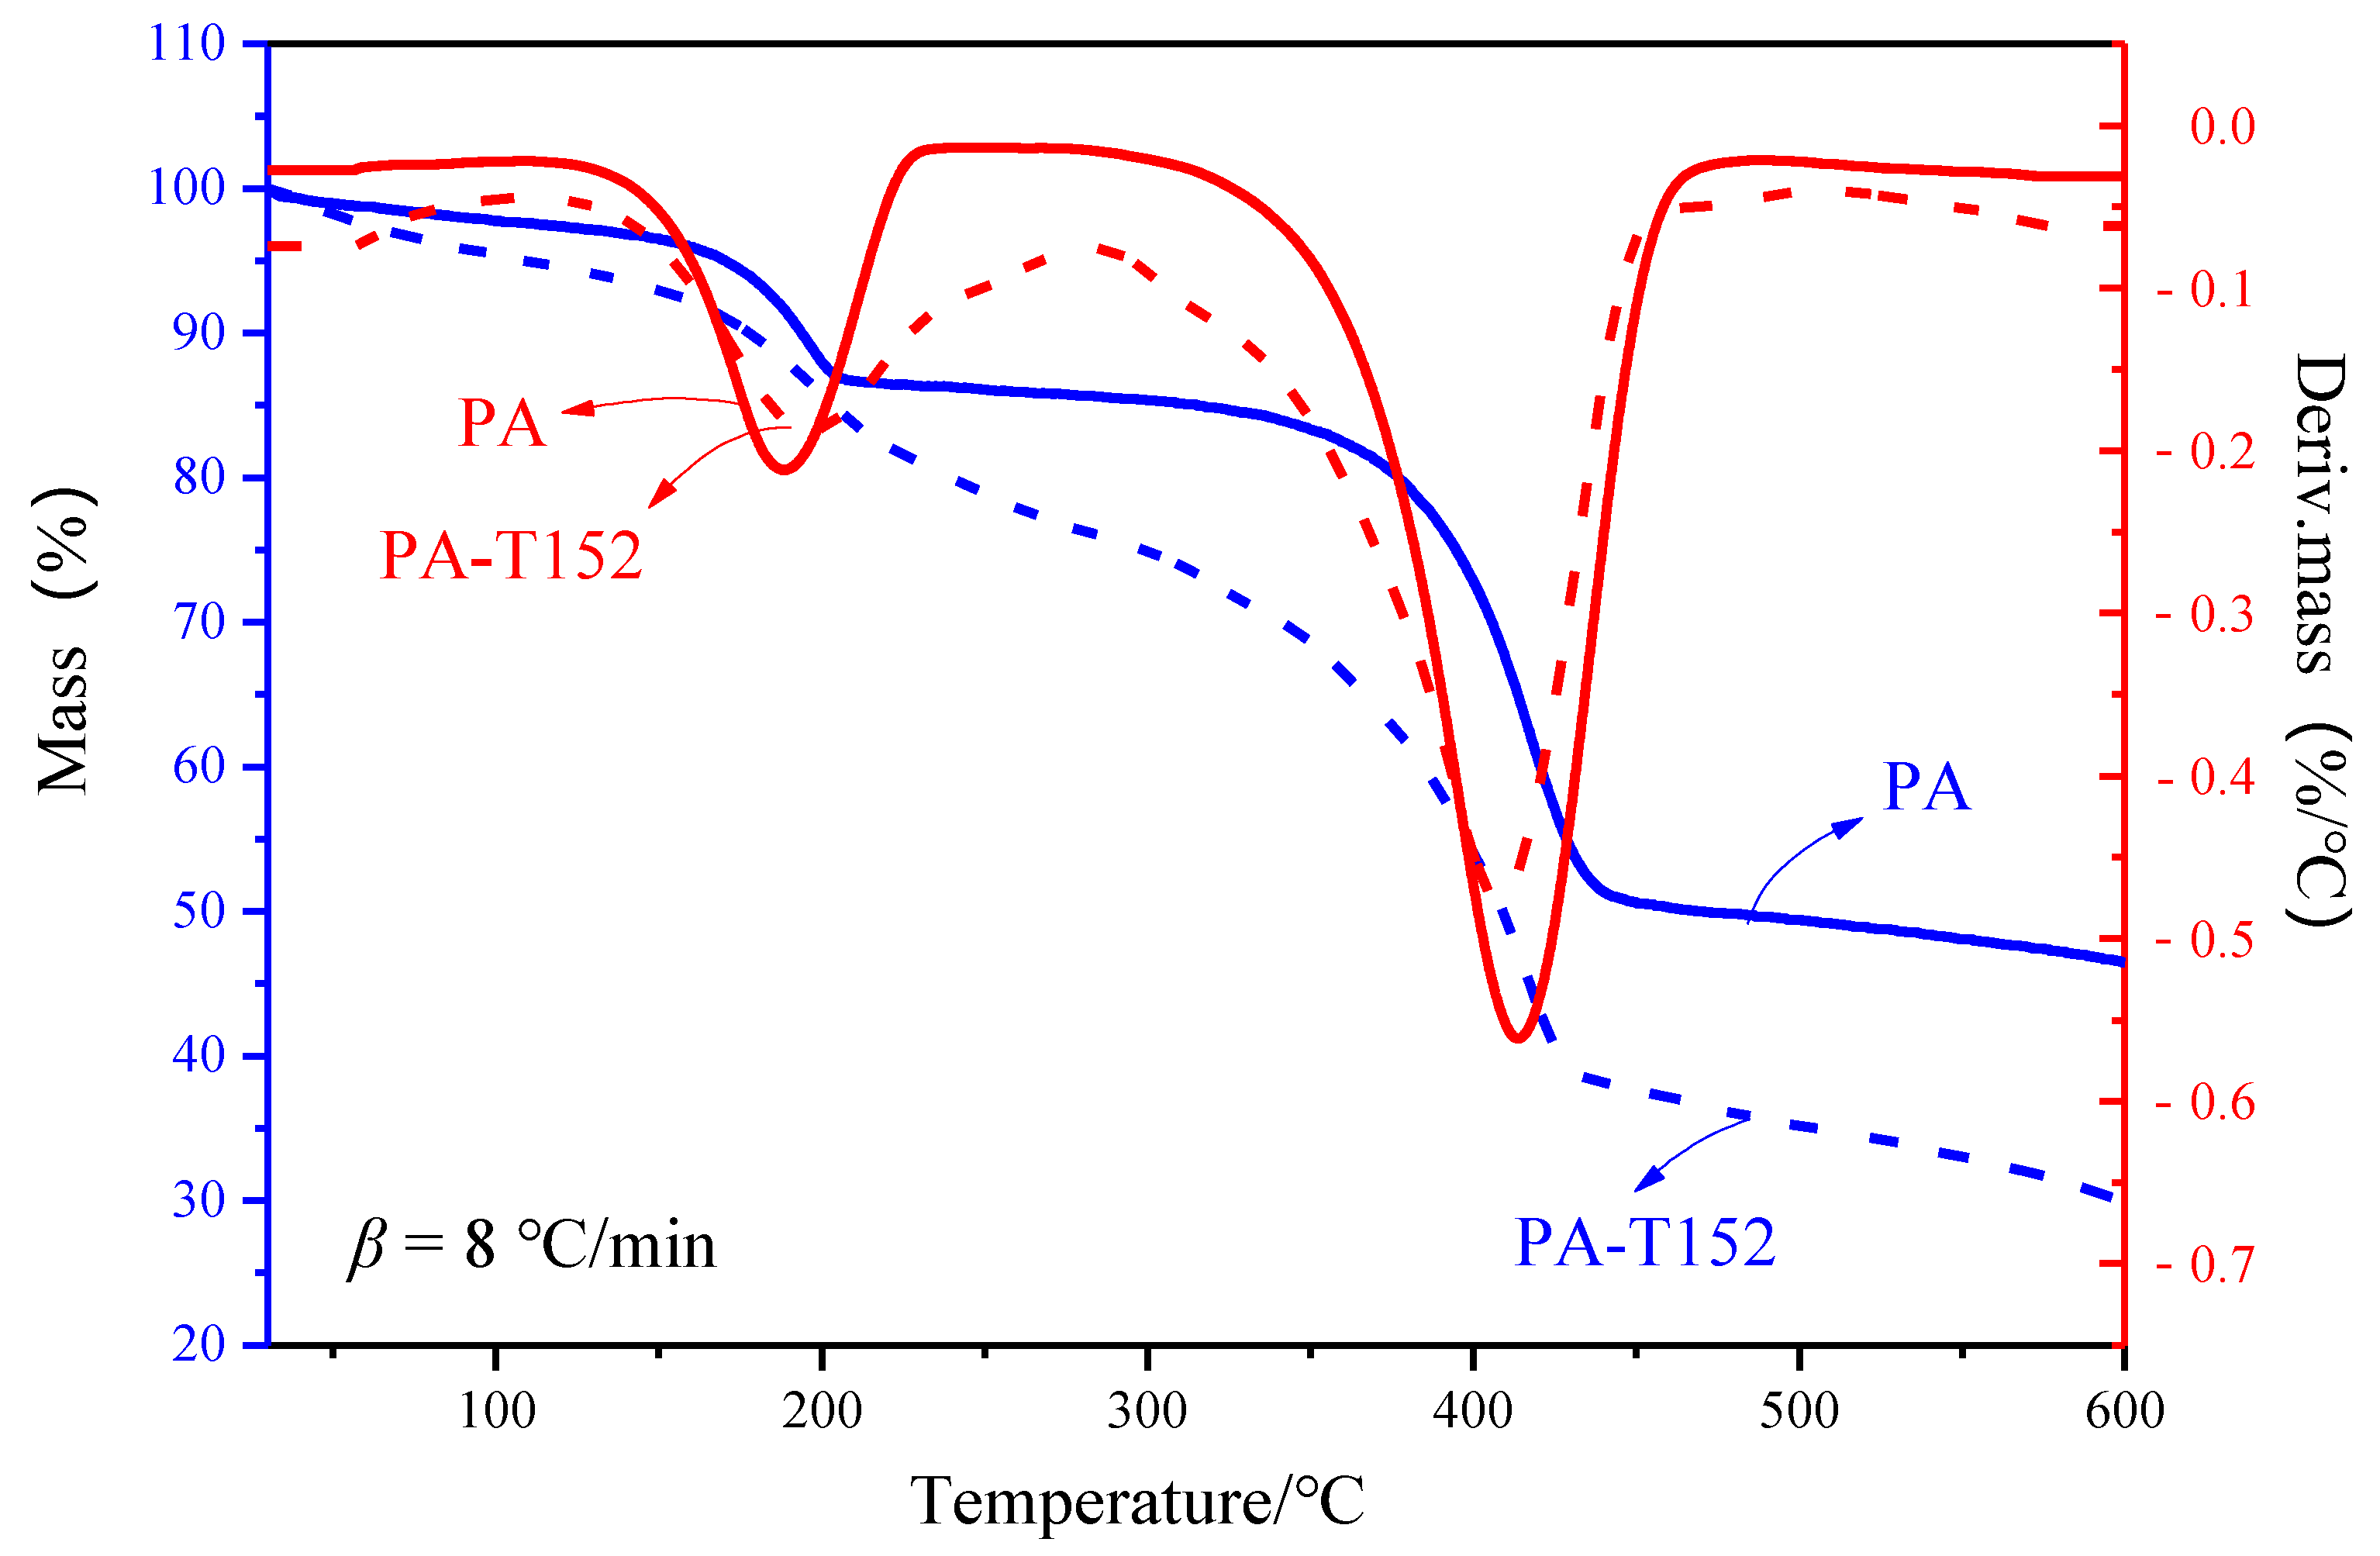
3.1.1. Thermogravimetric Analysis Results
3.1.2. Heat Flow Analysis Results
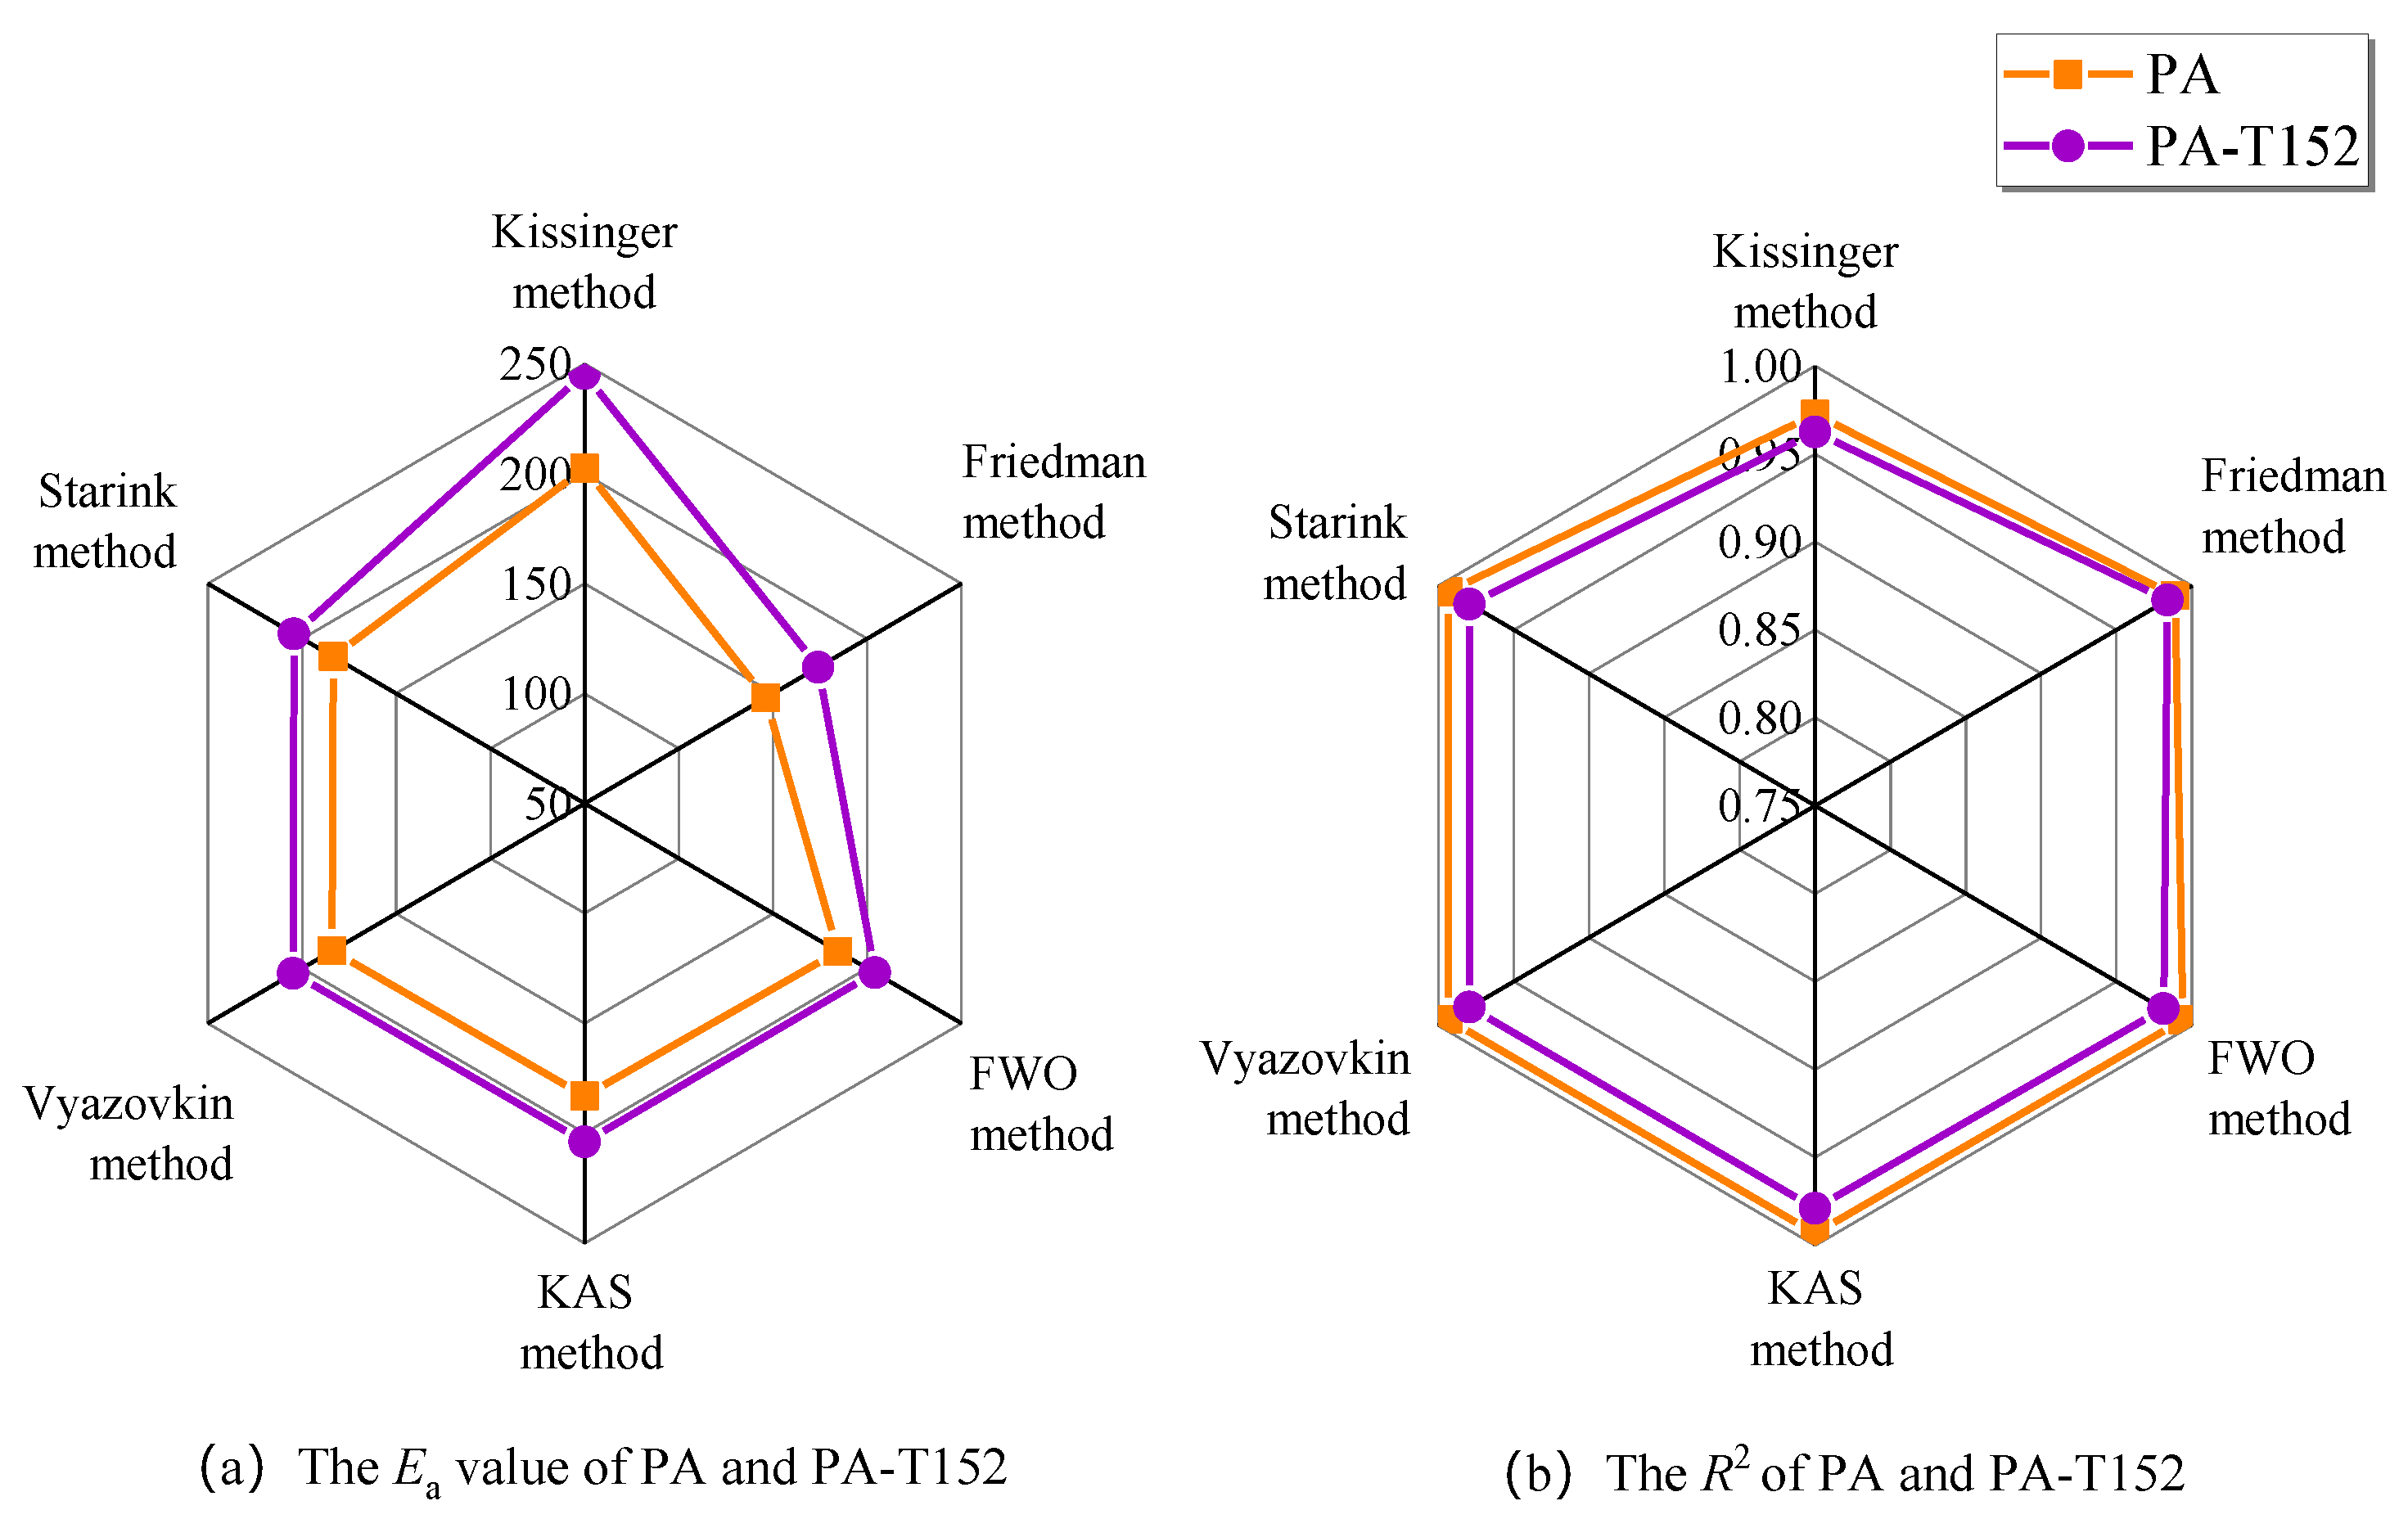
3.2. Calculation by Thermokinetic Equations
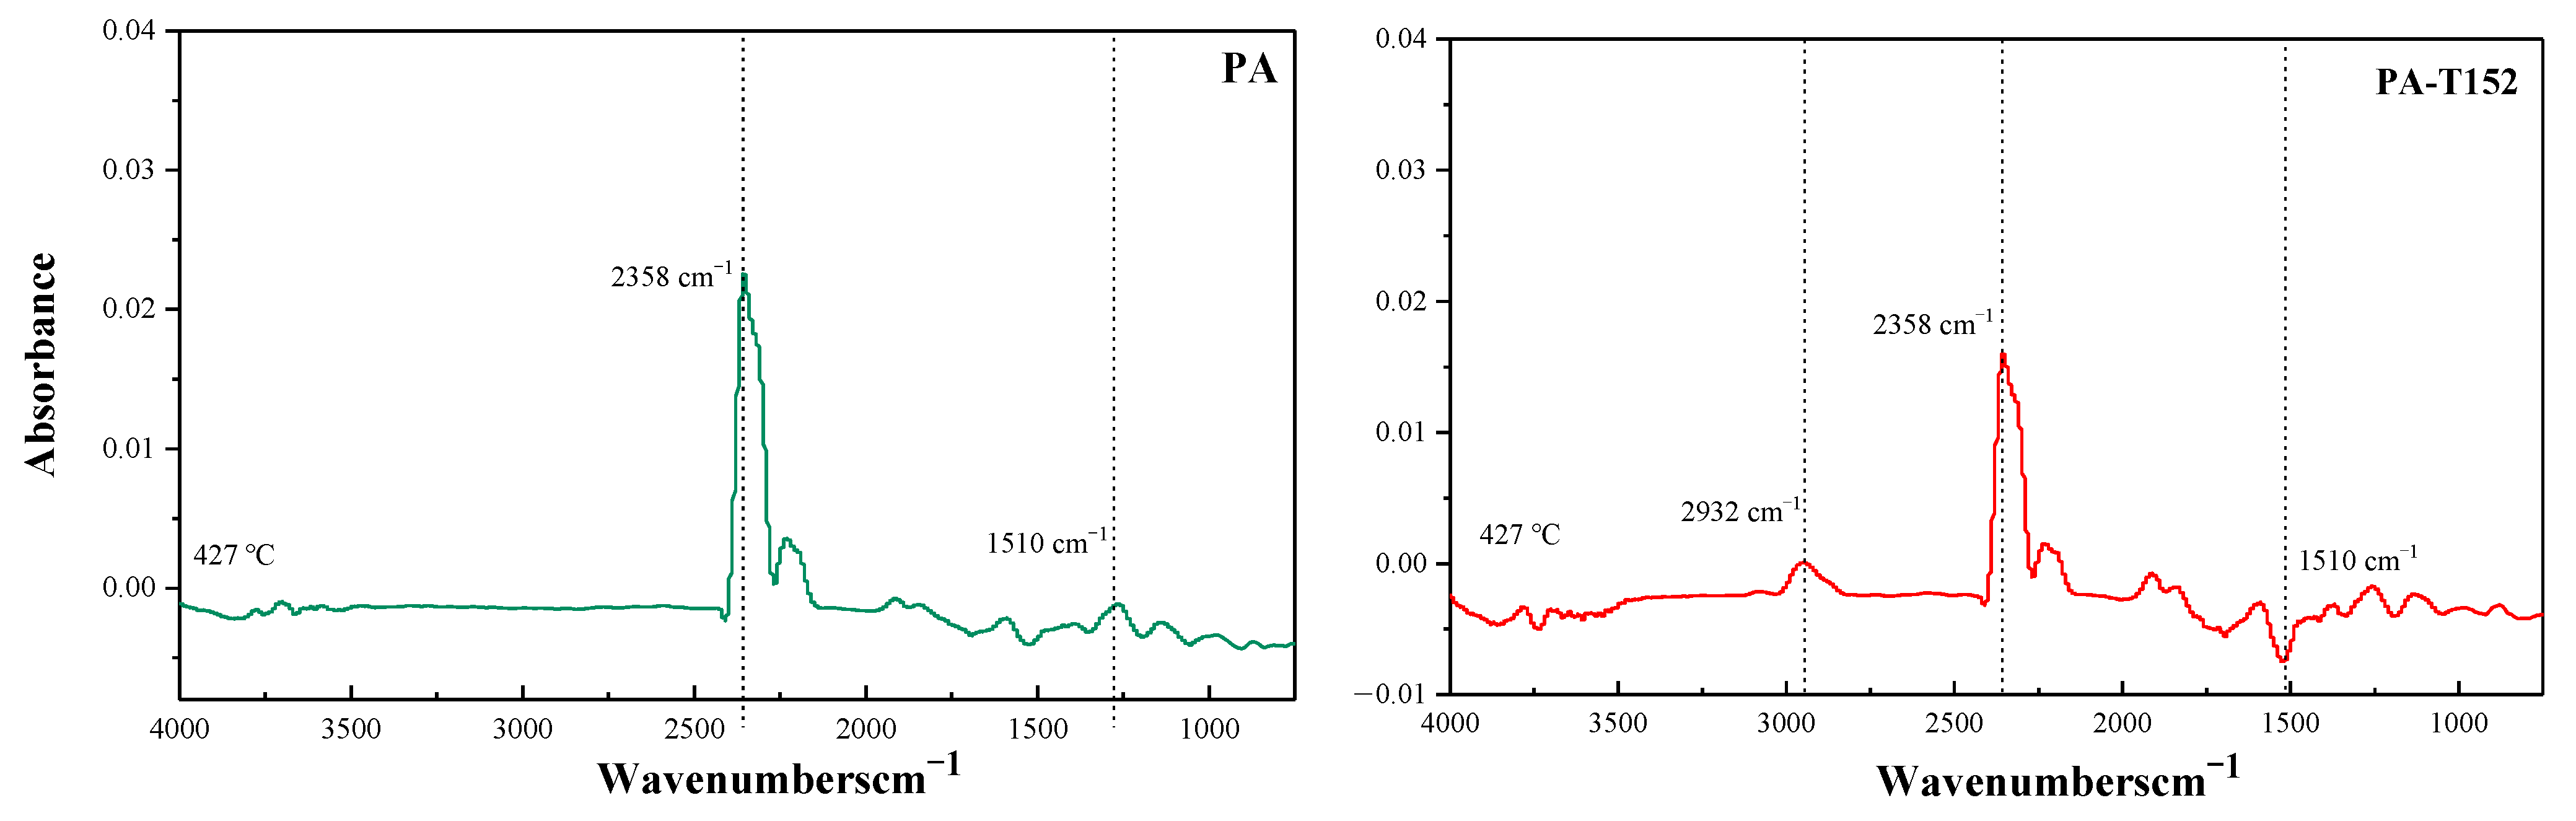
3.3. FTIR Analysis
4. Conclusions
Author Contributions
Funding
Institutional Review Board Statement
Informed Consent Statement
Data Availability Statement
Conflicts of Interest
References
- Pang, N.; Gao, J.; Zhao, P.; Wang, Y.; Xu, Z.; Chai, F. The impact of fireworks control on air quality in four Northern Chinese cities during the Spring Festival. Atmos. Environ. 2021, 244, 117958. [Google Scholar] [CrossRef]
- Ajith, S.; Sivapragasam, C.; Arumugaprabu, V. A review on hazards and their consequences in firework industries. SN Appl. Sci. 2018, 1, 120. [Google Scholar] [CrossRef]
- Sun, Y.; Han, Z.; Du, Z.; Zengyi, L.; Cong, X. Preparation and performance of environmental friendly Sulphur-Free propellant for fireworks. Appl. Therm. Eng. 2017, 126, 987–996. [Google Scholar] [CrossRef]
- Lin, W.-C.; Chen, W.-C.; Shu, C.-M. Thermal stability evaluation of multiple tubes of fireworks by calorimetry approaches. J. Therm. Anal. Calorim. 2019, 138, 2883–2890. [Google Scholar] [CrossRef]
- Wu, H.; Jiang, J.-C.; Huang, A.-C.; Tang, Y.; Liu, Y.-C.; Zhai, J.; Shu, C.-M.; Xing, Z.-X. Effect of emulsifiers on the thermal stability of firework propellants. J. Therm. Anal. Calorim. 2022, 1–9. [Google Scholar] [CrossRef]
- Zhao, J.; Cheng, Y.-C.; Hou, H.-Y.; Chen, W. Applications of intrinsic safety characteristic parameters of propellant dust: Commercial multi-tube pyrotechnic hazard assessment. J. Loss Prev. Process Ind. 2021, 69, 104381. [Google Scholar] [CrossRef]
- Ye, W.-X. Investigation and Identification of Fire Caused by Setting off Fireworks. Procedia Eng. 2016, 135, 427–430. [Google Scholar] [CrossRef]
- Wang, X.; Zhou, L.; Zhu, S.-Q.; Zheng, H.; Ma, Y.; Liu, Y.; Jia, C.; Zhou, C.-L.; Bie, L.; Zhang, G. Modes of Occurrence of Chromium and Their Thermal Stability in Low-Rank Coal Pyrolysis. Processes 2021, 10, 15. [Google Scholar] [CrossRef]
- Cao, C.-R.; Chen, W.-C.; Shu, C.-M. Prediction and assessment of fly-up type of fireworks by thermokinetics model. J. Therm. Anal. Calorim. 2020, 142, 927–936. [Google Scholar] [CrossRef]
- Tafu, N.N.; Jideani, V.A. Characterization of Novel Solid Dispersions of Moringa oleifera Leaf Powder Using Thermo-Analytical Techniques. Processes 2021, 9, 2230. [Google Scholar] [CrossRef]
- Ren, S.-J.; Wang, C.-P.; Xiao, Y.; Deng, J.; Tian, Y.; Song, J.; Cheng, X.-J.; Sun, G. Thermal properties of coal during low temperature oxidation using a grey correlation method. Fuel 2020, 260, 116287. [Google Scholar] [CrossRef]
- Zheng, H.; Mao, L.; Yang, J.; Zhang, C.; Miao, S.; Gao, Y. Effect of Oil Content and Emulsifier Type on the Properties and Antioxidant Activity of Sea Buckthorn Oil-in-Water Emulsions. J. Food Qual. 2020, 2020, 1–8. [Google Scholar] [CrossRef]
- Drapala, K.P.; Auty, M.A.E.; Mulvihill, D.M.; O’Mahony, J.A. Influence of emulsifier type on the spray-drying properties of model infant formula emulsions. Food Hydrocoll. 2017, 69, 56–66. [Google Scholar] [CrossRef]
- Ouqi, N. Synthesis of Alkylol Amine Emulsifiers and Their Application in Emulsion Explosive. Explos. Mater. 2013, 4, 6–9. [Google Scholar]
- Zhao, Z.; Yue, J.; Ji, X.; Nian, M.; Kang, K.; Qiao, H.; Zheng, X. Research progress in biological activities of succinimide derivatives. Bioorg. Chem. 2020, 108, 104557. [Google Scholar] [CrossRef]
- Ruffell, J.; Farmer, T.J.; Macquarrie, D.J.; Stark, M.S. The Autoxidation of Alkenyl Succinimides—Mimics for Polyisobutenyl Succinimide Dispersants. Ind. Eng. Chem. Res. 2019, 58, 19649–19660. [Google Scholar] [CrossRef]
- Huang, A.-C.; Huang, C.-F.; Xing, Z.-X.; Jiang, J.-C.; Shu, C.-M. Thermal hazard assessment of the thermal stability of acne cosmeceutical therapy using advanced calorimetry technology. Process Saf. Environ. Prot. 2019, 131, 197–204. [Google Scholar] [CrossRef]
- Kaljuvee, T.; Štubňa, I.; Húlan, T.; Uibu, M.; Einard, M.; Traksmaa, R.; Viljus, M.; Jefimova, J.; Trikkel, A.J.P. Thermal Behavior of Ceramic Bodies Based on Estonian Clay from the Arumetsa Deposit with Oil Shale Ash and Clinker Dust Additives. Processes 2021, 10, 46. [Google Scholar] [CrossRef]
- Martinez-Gómez, C.; Rangel-Vázquez, I.; Zarraga, R.; del Ángel, G.; Ruíz-Camacho, B.; Tzompantzi, F.; Vidal-Robles, E.; Pérez-Larios, A. Photodegradation and Mineralization of Phenol Using TiO2Coated γ-Al2O3: Effect of Thermic Treatment. Processes 2022, 10, 1186. [Google Scholar] [CrossRef]
- Anucha, C.B.; Bacaksız, E.; Stathopoulos, V.N.; Pandis, P.K.; Argirusis, C.; Andreouli, C.; Tatoudi, Z.; Altin, I. Molybdenum Modified Sol–Gel Synthesized TiO2 for the Photocatalytic Degradation of Carbamazepine under UV Irradiation. Processes 2022, 10, 1113. [Google Scholar] [CrossRef]
- Zhou, H.-L.; Jiang, J.-C.; Huang, A.-C.; Tang, Y.; Zhang, Y.; Huang, C.-F.; Liu, S.; Shu, C.-M. Calorimetric evaluation of thermal stability and runaway hazard based on thermokinetic parameters of O,O–dimethyl phosphoramidothioate. J. Loss Prev. Process Ind. 2022, 75, 104697. [Google Scholar] [CrossRef]
- Yang, Y.-P.; Huang, A.-C.; Tang, Y.; Liu, Y.-C.; Wu, Z.-h.; Zhou, H.-L.; Li, Z.-P.; Shu, C.-M.; Jiang, J.-C.; Xing, Z.-X. Thermal Stability Analysis of Lithium-Ion Battery Electrolytes Based on Lithium Bis(trifluoromethanesulfonyl)imide-Lithium Difluoro(oxalato)Borate Dual-Salt. Polymers 2021, 13, 707. [Google Scholar] [CrossRef] [PubMed]
- Li, Z.-P.; Jiang, J.-C.; Huang, A.-C.; Tang, Y.; Miao, C.-F.; Zhai, J.; Huang, C.-F.; Xing, Z.-X.; Shu, C.-M. Thermal hazard evaluation on spontaneous combustion characteristics of nitrocellulose solution under different atmospheric conditions. Sci. Rep. 2021, 11, 24053. [Google Scholar] [CrossRef] [PubMed]
- Jia, G. Combustion Characteristics and Kinetic Analysis of Biomass Pellet Fuel Using Thermogravimetric Analysis. Processes 2021, 9, 868. [Google Scholar] [CrossRef]
- Yang, N.; Jiang, J.-C.; Huang, A.-C.; Tang, Y.; Li, Z.-P.; Cui, J.; Shu, C.-M.; Xing, Z. Thermokinetic model-based experimental and numerical investigation of the thermal hazards of nitrification waste. J. Loss Prev. Process Ind. 2022, 79, 104836. [Google Scholar] [CrossRef]
- Huang, A.-C.; Li, Z.-P.; Liu, Y.-C.; Tang, Y.; Huang, C.-F.; Shu, C.-M.; Xing, Z.-X.; Jiang, J.-C. Essential hazard and process safety assessment of para-toluene sulfonic acid through calorimetry and advanced thermokinetics. J. Loss Prev. Process Ind. 2021, 72, 104558. [Google Scholar] [CrossRef]
- Liu, Y.-C.; Jiang, J.-C.; Huang, A.-C.; Tang, Y.; Yang, Y.-P.; Zhou, H.-L.; Zhai, J.; Xing, Z.; Huang, C.-F.; Shu, C.-M. Hazard assessment of the thermal stability of nitrification by-products by using an advanced kinetic model. Process Saf. Environ. Prot. 2022, 160, 91–101. [Google Scholar] [CrossRef]
- Friedman, H.L. Kinetics of thermal degradation of char-forming plastics from thermogravimetry. Application to a phenolic plastic. J. Polym. Sci. Part C Polym. Lett. 2007, 6, 183–195. [Google Scholar] [CrossRef]
- Yao, C.; Liu, Y.-C.; Wu, J.; Tang, Y.; Zhai, J.; Shu, C.-M.; Jiang, J.-C.; Xing, Z.-X.; Huang, C.-F.; Huang, A.-C. Thermal Stability Determination of Propylene Glycol Sodium Alginate and Ammonium Sulfate with Calorimetry Technology. Processes 2022, 10, 1177. [Google Scholar] [CrossRef]
- Xie, L.; Jiang, J.-C.; Huang, A.-C.; Tang, Y.; Liu, Y.-C.; Zhou, H.-L.; Xing, Z. Calorimetric Evaluation of Thermal Stability of Organic Liquid Hydrogen Storage Materials and Metal Oxide Additives. Energies 2022, 15, 2236. [Google Scholar] [CrossRef]
- Huang, A.-C.; Liao, F.C.; Huang, C.-F.; Tang, Y.; Zhang, Y.; Shu, C.-M.; Xing, Z.-X.; Jiang, J.-C.; Hsieh, W.-Y. Calorimetric approach to establishing thermokinetics for cosmeceutical benzoyl peroxides containing metal ions. J. Therm. Anal. Calorim. 2021, 144, 373–382. [Google Scholar] [CrossRef]
- Vyazovkin, S. Kissinger Method in Kinetics of Materials: Things to Beware and Be Aware of. Molecules 2020, 25, 2813. [Google Scholar] [CrossRef] [PubMed]
- Chen, F.; Dong, X.; Tang, Y.; Huang, A.-C.; Zhang, M.; Kang, Q.; Shu, Z.-J.; Xing, Z. Thermal Characteristic Analysis of Sodium in Diluted Oxygen via Thermogravimetric Approach. Processes 2022, 10, 704. [Google Scholar] [CrossRef]
- Zhang, C.; Jiang, J.-C.; Huang, A.-C.; Tang, Y.; Xie, L.; Zhai, J.; Xing, Z. A novel multifunctional additive strategy improves the cycling stability and thermal stability of SiO/C anode Li-ion batteries. Process Saf. Environ. Prot. 2022, 164, 555–565. [Google Scholar] [CrossRef]
- Chen, Y.; Wang, L.; Zhao, M.; Ma, H.; Chen, D.; Zhang, Y.; Zhou, J. Comparative Study on the Pyrolysis Behaviors of Pine Cone and Pretreated Pine Cone by Using TGA–FTIR and Pyrolysis-GC/MS. ACS Omega 2021, 6, 3490–3498. [Google Scholar] [CrossRef] [PubMed]
- Guo, Y.; Zhao, N.; Zhang, T.; Gong, H.; Ma, H.-X.; An, T.; Zhao, F.; Hu, R.-Z. Compatibility and thermal decomposition mechanism of nitrocellulose/Cr2O3 nanoparticles studied using DSC and TG-FTIR. RSC Adv. 2019, 9, 3927–3937. [Google Scholar] [CrossRef]
- Wu, D.; Zhang, W.; Fu, B.; Hu, G. Chemical structure and gas products of different rank coals during pyrolysis. J. Therm. Anal. Calorim. 2018, 136, 2017–2031. [Google Scholar] [CrossRef]


| Sample β (°C/min) | Mass (mg) | PA | PA-T152 | ||||
|---|---|---|---|---|---|---|---|
| T0,s1 (°C) | T0,s2 (°C) | Maximum DTG (%/°C) | T0,s1 (°C) | T0,s2 (°C) | Maximum DTG (%/°C) | ||
| 2.0 | 1.80 ± 0.5 | 82.8 | 233.8 | 0.66 | 90.1 | 251.7 | 0.61 |
| 4.0 | 94.9 | 241.1 | 0.65 | 110.7 | 274.6 | 0.59 | |
| 6.0 | 95.2 | 261.2 | 0.60 | 118.1 | 280.4 | 0.56 | |
| 8.0 | 96.8 | 268.3 | 0.56 | 119.1 | 285.4 | 0.48 | |
| 10.0 | 100.7 | 269.2 | 0.47 | 114.4 | 287.2 | 0.44 | |
| Sample | PA | ||||||
|---|---|---|---|---|---|---|---|
| Endothermic | Exothermic | ||||||
| β (°C/min) | Mass (mg) | T0 (°C) | Tp (°C) | T0 (°C) | Tp1 (°C) | Tp2 (°C) | ∆H (/J g) |
| 2.0 | 1.80 ± 0.5 | 130–132 | 132–134 | 269–271 | 313–315 | 357–359 | 5284–5286 |
| 4.0 | 128–130 | 131–133 | 280–282 | 317–319 | 371–373 | 3712–3714 | |
| 6.0 | 130–132 | 132–134 | 283–285 | 327–329 | 378–380 | 2880–2882 | |
| 8.0 | 130–132 | 133–135 | 286–288 | 333–335 | 385–387 | 2429–3431 | |
| 10.0 | 128–130 | 132–133 | 299–301 | 332–334 | 390–392 | 2302–2304 | |
| Sample | PA | |||||
|---|---|---|---|---|---|---|
| Ea (kJ/mol) | R2 | |||||
| α | Friedman | KAS | Starink | Friedman | KAS | Starink |
| 0.1 | 109.15 | 155.04 | 155.48 | 0.9934 | 0.9987 | 0.9987 |
| 0.2 | 122.07 | 161.02 | 161.48 | 0.9961 | 0.9986 | 0.9986 |
| 0.3 | 137.10 | 173.84 | 174.26 | 0.9970 | 0.9972 | 0.9972 |
| 0.4 | 140.29 | 174.90 | 175.33 | 0.9964 | 0.9978 | 0.9979 |
| 0.5 | 145.82 | 180.75 | 181.17 | 0.9962 | 0.9987 | 0.9987 |
| 0.6 | 151.14 | 185.46 | 185.87 | 0.9953 | 0.9983 | 0.9983 |
| 0.7 | 159.04 | 192.84 | 193.24 | 0.9931 | 0.9967 | 0.9967 |
| 0.8 | 203.88 | 240.66 | 240.90 | 0.9433 | 0.9595 | 0.9599 |
| Average | 146.06 | 183.06 | 183.47 | 0.9889 | 0.9932 | 0.9933 |
| Sample | PA-T152 | |||||
|---|---|---|---|---|---|---|
| Ea (kJ/mol) | R2 | |||||
| α | Friedman | KAS | Starink | Friedman | KAS | Starink |
| 0.1 | 234.15 | 299.48 | 299.33 | 0.9631 | 0.9706 | 0.9708 |
| 0.2 | 145.85 | 183.71 | 184.04 | 0.9931 | 0.9886 | 0.9887 |
| 0.3 | 165.09 | 195.40 | 195.72 | 0.9892 | 0.9857 | 0.9859 |
| 0.4 | 167.26 | 193.35 | 193.69 | 0.9954 | 0.9896 | 0.9897 |
| 0.5 | 167.86 | 190.51 | 190.88 | 0.9935 | 0.9872 | 0.9873 |
| 0.6 | 163.75 | 184.23 | 184.64 | 0.9928 | 0.9850 | 0.9851 |
| 0.7 | 168.94 | 188.49 | 188.89 | 0.9907 | 0.9810 | 0.9812 |
| 0.8 | 178.74 | 196.05 | 196.44 | 0.9530 | 0.9443 | 0.9449 |
| Average | 173.95 | 203.90 | 204.20 | 0.9838 | 0.9790 | 0.9792 |
Publisher’s Note: MDPI stays neutral with regard to jurisdictional claims in published maps and institutional affiliations. |
© 2022 by the authors. Licensee MDPI, Basel, Switzerland. This article is an open access article distributed under the terms and conditions of the Creative Commons Attribution (CC BY) license (https://creativecommons.org/licenses/by/4.0/).
Share and Cite
Wu, H.; Yang, N.; Tang, Y.; Jiang, J.-C.; Huang, A.-C. Thermal Stability Evaluation of T152 Emulsifier on the Modification Influence of Fireworks Propellant. Processes 2022, 10, 1606. https://doi.org/10.3390/pr10081606
Wu H, Yang N, Tang Y, Jiang J-C, Huang A-C. Thermal Stability Evaluation of T152 Emulsifier on the Modification Influence of Fireworks Propellant. Processes. 2022; 10(8):1606. https://doi.org/10.3390/pr10081606
Chicago/Turabian StyleWu, He, Na Yang, Yan Tang, Jun-Cheng Jiang, and An-Chi Huang. 2022. "Thermal Stability Evaluation of T152 Emulsifier on the Modification Influence of Fireworks Propellant" Processes 10, no. 8: 1606. https://doi.org/10.3390/pr10081606