Article

Active Flow Control of a Flame-Holder Wake Using Nanosecond-Pulsed Surface-Dielectric-Barrier Discharge in a Low-Pressure Environment

1
Institute of Aeroengine, School of Mechanical Engineering, Xi’an Jiaotong University, Xi’an 710049, China
2
Aeronautics Engineering College, Air Force Engineering University, Xi’an 710038, China
*
Author to whom correspondence should be addressed.
Processes 2022, 10(8), 1519; https://doi.org/10.3390/pr10081519
Submission received: 12 June 2022 / Revised: 30 June 2022 / Accepted: 25 July 2022 / Published: 2 August 2022
(This article belongs to the Special Issue Plasma Combustion and Flow Control Processes)

Abstract

:
Flame holders are widely used in ramjet combustors. We propose using surface nanosecond-pulsed surface-dielectric-barrier-discharge (NS-DBD) to manipulate the flame-holder flow field experimentally. The electrical characteristics, induced flow performance, and temperature distribution of NS-DBD were investigated via the electrical and optical measurement system. In the filamentary discharge mode, the discharge energy rose with decrease of the ambient pressure. The discharge pattern of NS-DBD changed from filamentous to uniform around 5 kPa. Starting-vortex intensity and jet-flow angle relative to the wall increased at low pressure. The recirculation zone was asymmetrical at pressures above 60 kPa. The recirculation zone’s area and length were smaller at lower pressures, but when the actuator was operating, the recirculation zone was nearly 11.8% longer. The vorticity increased with pressure. When the pulse width was 300 ns, the actuator had the greatest effect, and the low velocity region (LVR) area and the fuel–air-mixture residence time (FMRT) could be increased by 31.8% and 20.5%, respectively. The actuator had a smaller widening effect on the LVR area at lower pressure. Rising-edge time should increase with pressure to optimize LVR increase; it should be above 300 ns to optimize FMRT increase. We conclude that NS-DBD is a viable method of controlling flame-holder airflow at low pressure.

1. Introduction

A flame holder is a flame-stabilizing device with high combustion efficiency and low flow resistance widely used in ramjet combustors. The stability and combustion efficiency depend not only on the equivalence ratio but also on the characteristics of the flow field behind the blunt body. Plasma flow control based on plasma aerodynamic actuation has been suggested as an active method of regulating and improving the flow characteristics of flame holders. This technology’s fast response and lack of moving parts give it enormous potential for improving the aerodynamics of internal flow in engines. Existing plasma-actuation methods include arc-discharge actuation, dielectric-barrier–discharge actuation (DBDA), radio-frequency-discharge actuation, and plasma-synthetic-jet actuation based on Joule heating or body force [1,2]. Opaits et al. [3] found that the inflow velocity can be increased to 75 m/s and the airfoil-stall angle of attack increased from 15° to 21° by DBDA. De Giorgi et al. [4] showed that multiple dielectric barrier discharge (multi-DBD PAs) plasma actuators can control and reduce unsteady loads on an oscillating airfoil in recent research. Thus, DBD plasma actuators would seem to be a promising technique for regulating the trailing-edge flow field of V-shaped flame holders.
Over the last decade, the use of surface-DBD-based plasma actuators as active flow-control mechanisms has attracted significant interest in the aerodynamic community [5,6]. Initially, DBDs driven by ac signals (ac-DBD) that induced wall-jet flow were the most widely used plasma aerodynamic actuators. In recent years, nanosecond-pulse-discharge plasma aerodynamic actuation, where the frequency of interest is several kilohertz, has been investigated for separation control [7,8,9,10,11]. The mechanism of nanosecond-pulse plasma aerodynamic actuation is induction of a shock wave and starting vortex by fast heating [8]. Durasiewicz [12] also found that nanosecond-pulsed dielectric-barrier discharge (NS-DBD) has stronger capabilities than the ac-DBD for flow control and flow-field disturbance, suggesting the potential to improve flame-holder characteristics.
Wu et al. [13] found through particle-image velocimetry (PIV) and shock-wave-characteristic measurement that the horizontal body force was much smaller than the vertical in NS-DBD. Moreover, the flow-field induced by NS-DBD was directed upward and the velocity was very low (<1 m/s). Starikovskii [9] investigated the relationship between discharge frequency and induced velocity, finding that the latter did not exceed 0.3 m/s in the frequency range 0.1–10 kHz. Takashima [10] found that the single-discharge energy increased with frequency and had an approximately exponential relation with the actuation peak voltage. Little [14] compared the discharge energy and power of millisecond-pulsed DBD and NS-DBD; the latter had lower average actuator power and stronger flow-separation-control capability. The process of heat production actuated by NS-DBD could be the gas-heating of the air near the wall and heating of the dielectric-layer material; there was also convective heat transfer between the dielectric layer and the heated air [15].
Zhu et al. [16] simulated NS-DBD with different rising times; the heating region was similar to the extension area of plasma–discharge filaments, and the energy and efficiency of rapid heating decreased as the pulse’s rising-edge time increased. The flow-field characteristics induced by NS-DBD have also been studied extensively through PIV and high-speed-schlieren technology; a shock wave with a semicircular structure was observed from longitudinal observation while many circular structures corresponding to discharge channels were observed from horizontal observation [10]. By changing the pulse width and the applied voltage, Jia et al. [17] found the optimal NS-DBD actuation frequency corresponds to a Strouhal number of approximately F+ = 0.5.
However, most of these studies were carried out at atmospheric pressure. The electrical, thermal, and flow field characteristics of NS-DBD have rarely been investigated systematically in a low-pressure environment.
The parameters influencing the performance and flow-field characteristics of V-shaped flame holders have also been studied. Aosokawa [18] explored the recirculation zone and flow oscillations of a V-shaped flame holder with a rectangular section, finding that the area of the recirculation zone and the oscillation frequency could be reduced. Yue [19] investigated the stabilizing flame mechanism by using PIV, discussing the important role of the alternate generation and shedding of vortices in the process of flame stabilization in the near-wake structure. Wang [20] investigated the influence of pressure on the V-shaped recirculation zone; it was found that the flow rate and range of the recirculation zone decreased with decreasing pressure. However, there are few studies of the application of plasma in improving the flow field of V-shaped flame holders.
In this study, to improve the performance of V-shaped flame holder at low pressure, an NS-DBD actuator was deployed on the flame-holder wake. The influence of different pressures on the performance and induced flow-field structures of the NS-DBD was experimentally investigated. Then, optimal values of pulse width, excitation frequency, and rising-edge time for improving the flow field of the flame holder were determined. NS-DBD shows great performance on controlling the flow field, especially under low pressure.

2. Experimental Setup

2.1. Actuator and Nanosecond-Pulse Power Supply

As shown in Figure 1, the DBD actuator consisted of an exposed and a covered electrode that served as anode and cathode, respectively. The anode was 0.027 mm thick and 5 mm wide; the cathode had the same thickness with a width of 12 mm. There was a 40 mm dielectric layer between them. At the bottom of the actuator was the basement, a square alumina-ceramic sheet 50 mm long, 60 mm wide, and 4 mm thick. Three layers of Kapton tape with a thickness of 0.006 per layer were applied to the dielectric medium. The output voltage waveform of the nanosecond-pulse power supply is shown in Figure 2. The specific parameters of the power supply were as follows: the output voltage range was 0–20 kV, the pulse frequency was continuously adjustable from 0.001 to 20 kHz, and the pulse-width range was 0–1 ms, with a rising edge and falling edge extent of 50–800 ns.

2.2. Model of Flame Holder

A flame-holder model with upper and lower surfaces of 102 mm (L) × 29 mm (W) was employed in the experiment; the extension lines of the upper and lower surfaces formed a “V” shape. The maximum distance between the upper and lower surfaces was 44 mm. A dielectric-barrier discharge actuator was installed on the upper surface of the flame holder as depicted in Figure 3. The distance between the edge of the covered electrode and the tail of the flame holder was 2 mm.

2.3. Measurements

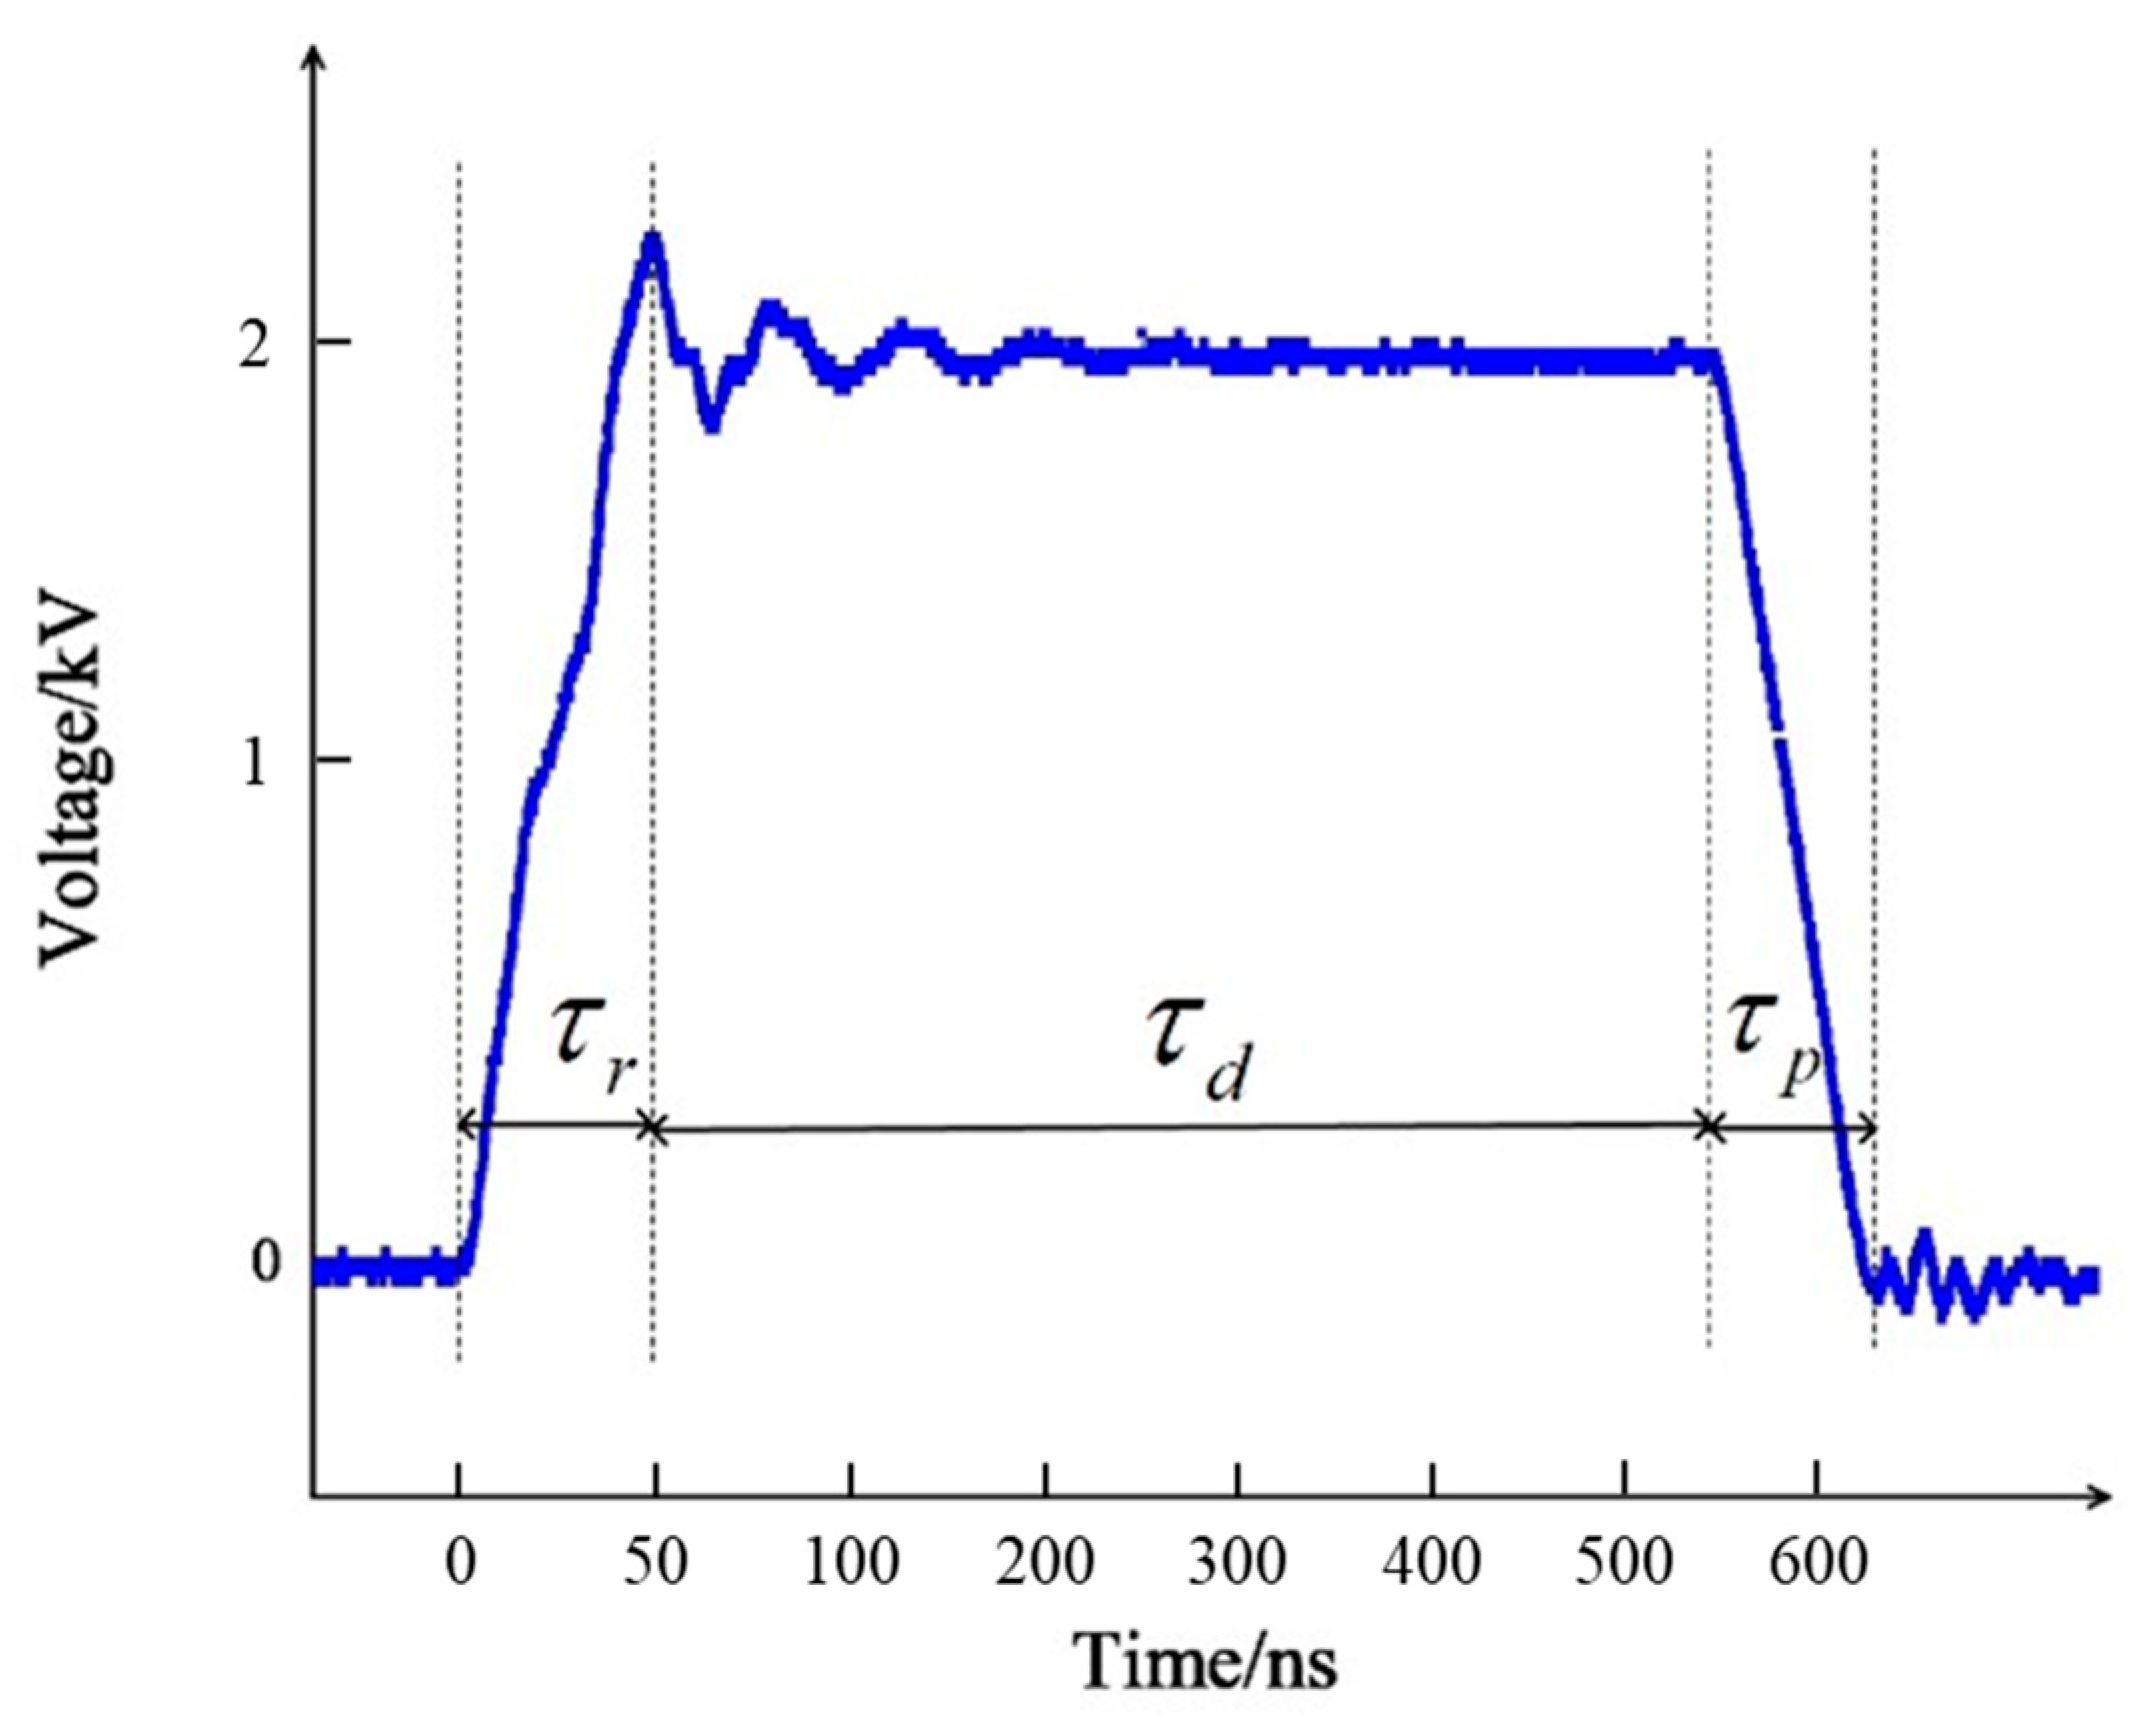
2.3.1. Electrical Measurements

A high-voltage probe (P6015A, Tektronix, Beaverton, OR, US) connected to the exposed electrode was applied to measure the discharge voltage (U1(t)). The discharge current (I1(t)) was measured with a current probe (TCP0030A, Tektronix, Beaverton, OR, USA) connected to the covered electrode. An oscilloscope (DPO4014, Tektronix, Beaverton, OR, USA) with a sampling rate of 10 kHz was used to record the voltage and current. The single-pulse discharge energy (E1) generated by the DBD was obtained by multiplying the discharge voltage with the discharge current and integrating the product over time (from t = 0 to t1):
E 1 = 0 t 1 U 1 ( t ) I 1 ( t ) d t

2.3.2. PIV Measurement System

In order to investigate the change of the recirculation zone at the trailing edge of the flame holder before and after actuator operation, the PIV system illustrated in Figure 4 was employed. It consisted of a 532-mm-wavelength laser and a Lavision Imager camera. The laser was an integrated double-head Nd:YAG laser with a maximum single-pulse energy of 500 mJ. The maximum acquisition frequency of the Lavision Imager camera was 10 Hz. Tracer particles were produced by pressure atomization of olive oil. By means of the phase-locked PIV method, the particle velocity and the variation of the recirculation zone caused by discharge disturbance were accurately obtained. Davis 7.2 software, LaVision GmbH, Göttingen, Germany was used to record and handle the particle images. A 32 × 32 interrogation window and 50% overlap ratio were employed. The PIV system’s shooting frequency was 10 Hz, and the experimental results were obtained by averaging 200 images. Over the course of the experiment, the PIV and discharge systems used separate power supplies, which prevented the camera from freezing due to electromagnetic interference during the discharge process.

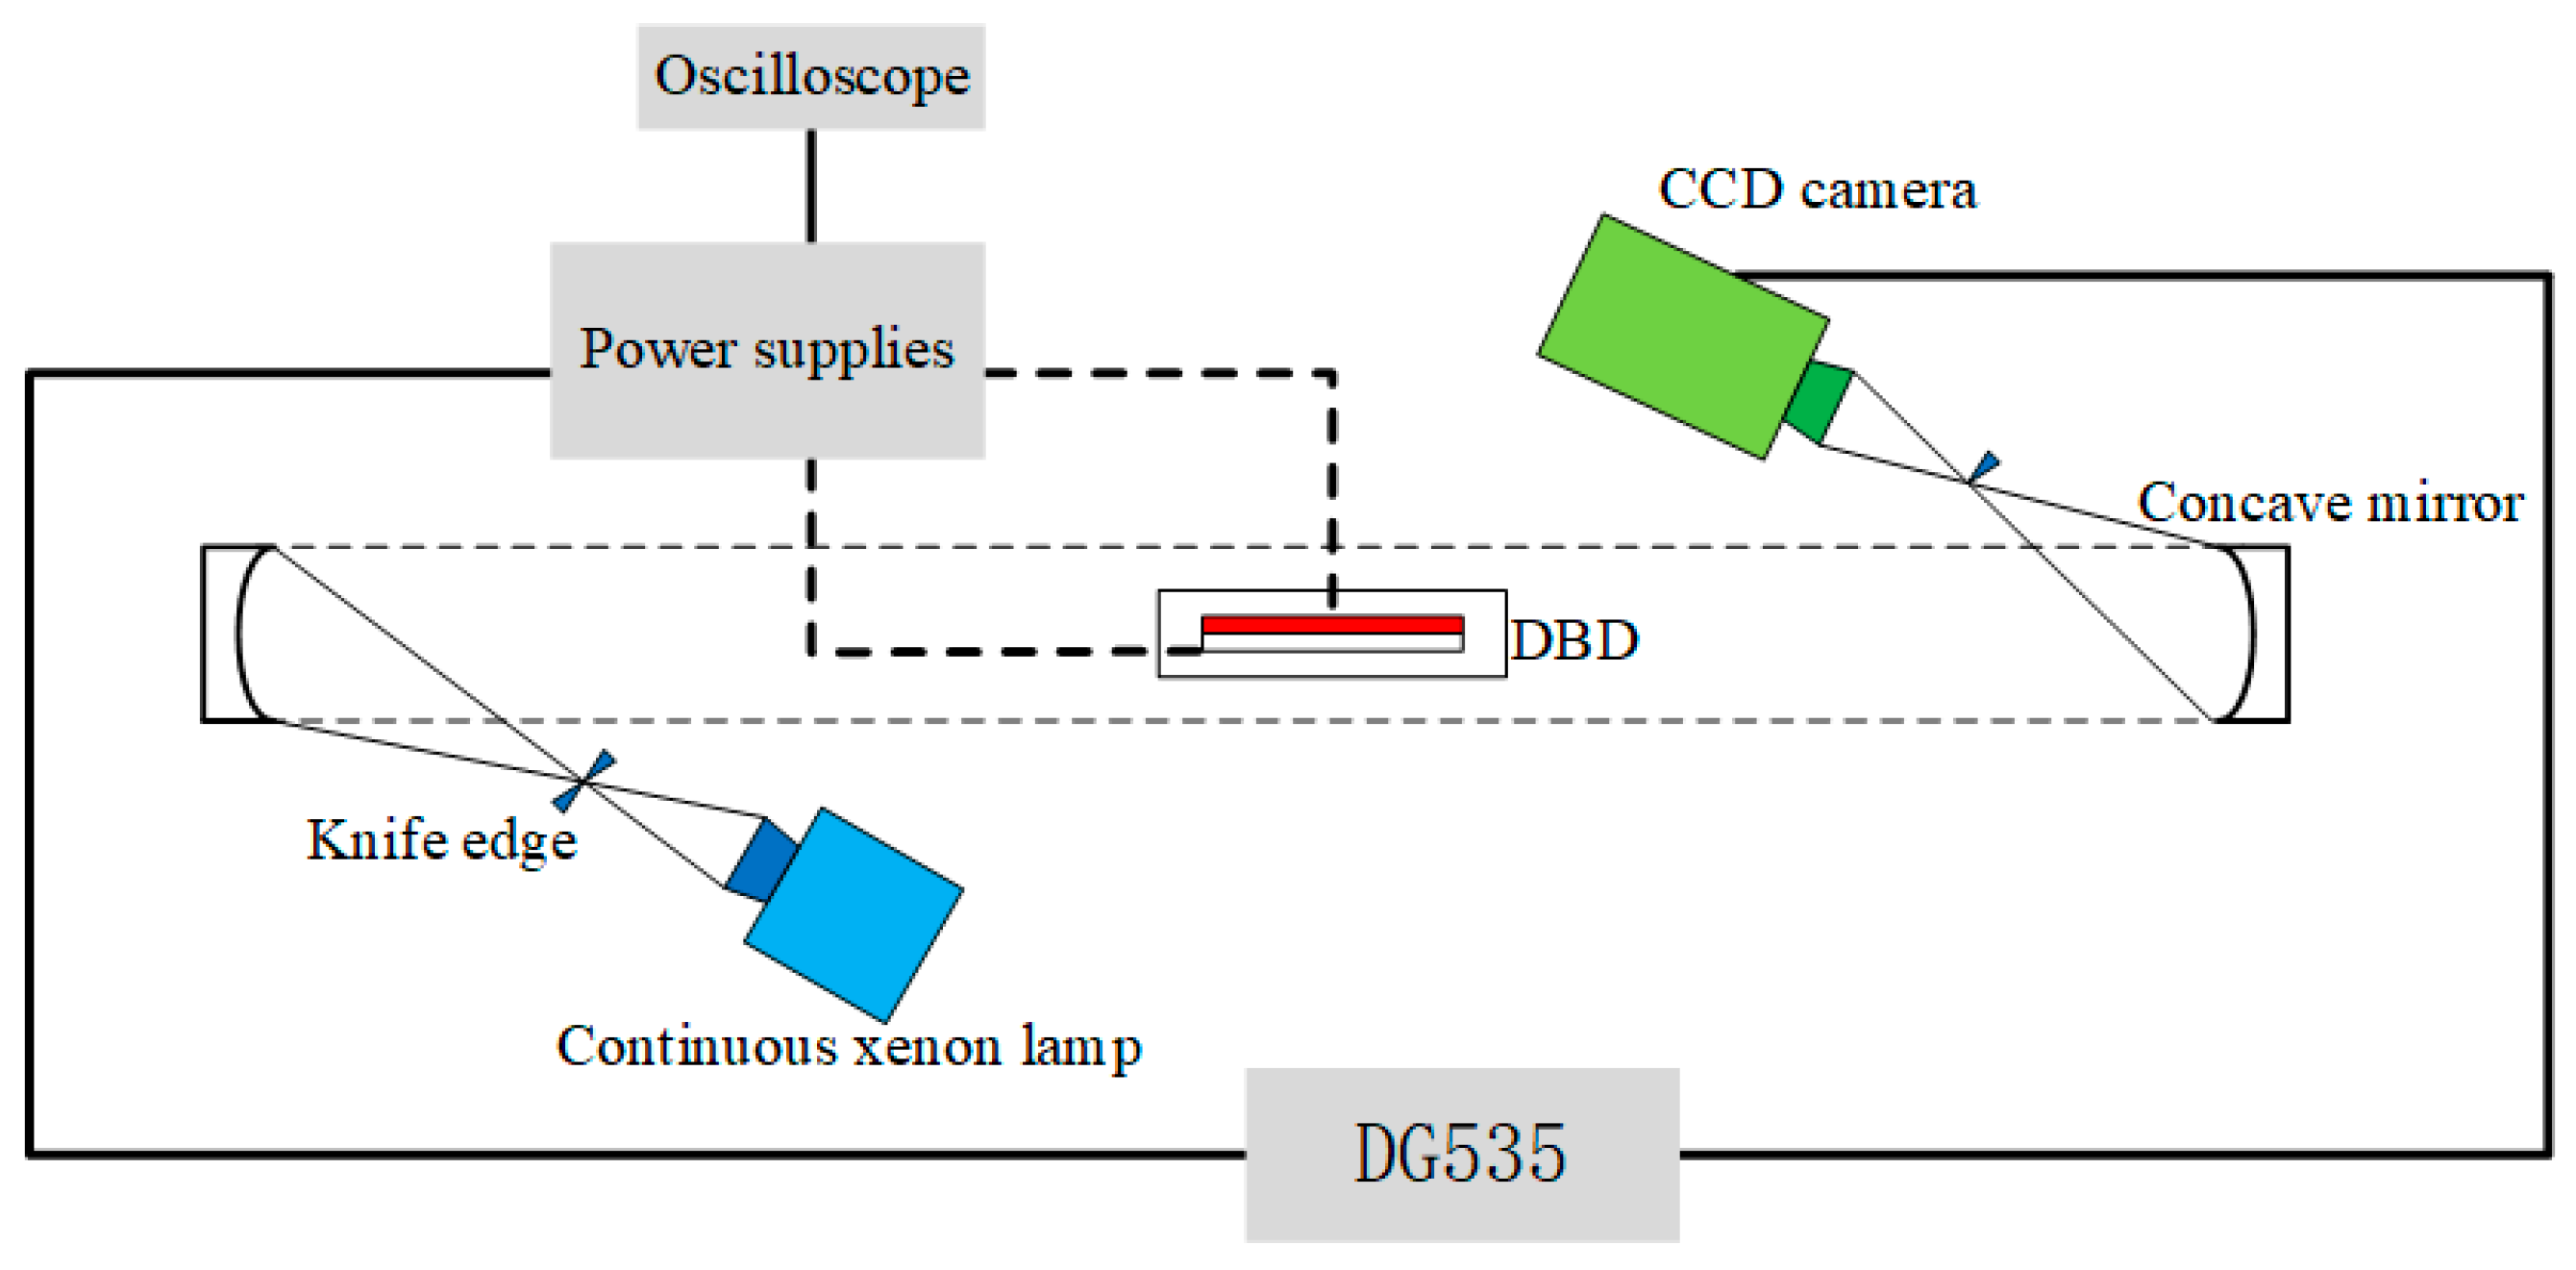
2.3.3. Schlieren Imaging System

As shown in Figure 5, a high-speed Schlieren imaging system was used to investigate NS-DBD topology. The Schlieren optical system included a high-speed CCD camera (Phantom-v5012, Phantom, Wayne, NJ, USA) employed to capture the images, a continuous bi-xenon head-lamp that served as a light source, and two concave mirrors with 3 m focal lengths.
The NS-DBD was placed in a sealed vacuum chamber connected to a vacuum pump that could create a low-pressure environment in the range 1–70 kPa. Two optical glasses for passing light were installed on the side of the vacuum chamber. The image resolution of the high-speed camera was 1024 × 208 pixels, but for the visualization images shown in this article, it was cut to 502 × 202 pixels to obtain a clearer flow field with 1.2 μs exposure time and 100 kHz frame rate. Two knife edges were included in the experimental system: one to cut half the light intensity in the longitudinal direction, and the other placed in front of the camera to improve image sensitivity. The discharge was initiated by triggering a function generator with an output signal of 5 V and a pulse width of 10 μs. The Stanford Research DG535 digital delay and pulse generator synchronized the high-speed camera and the discharge, which detected an abrupt current rise due to discharge and then generated a 5-V TTL signal to trigger the CCD camera.

3. Results and Discussion

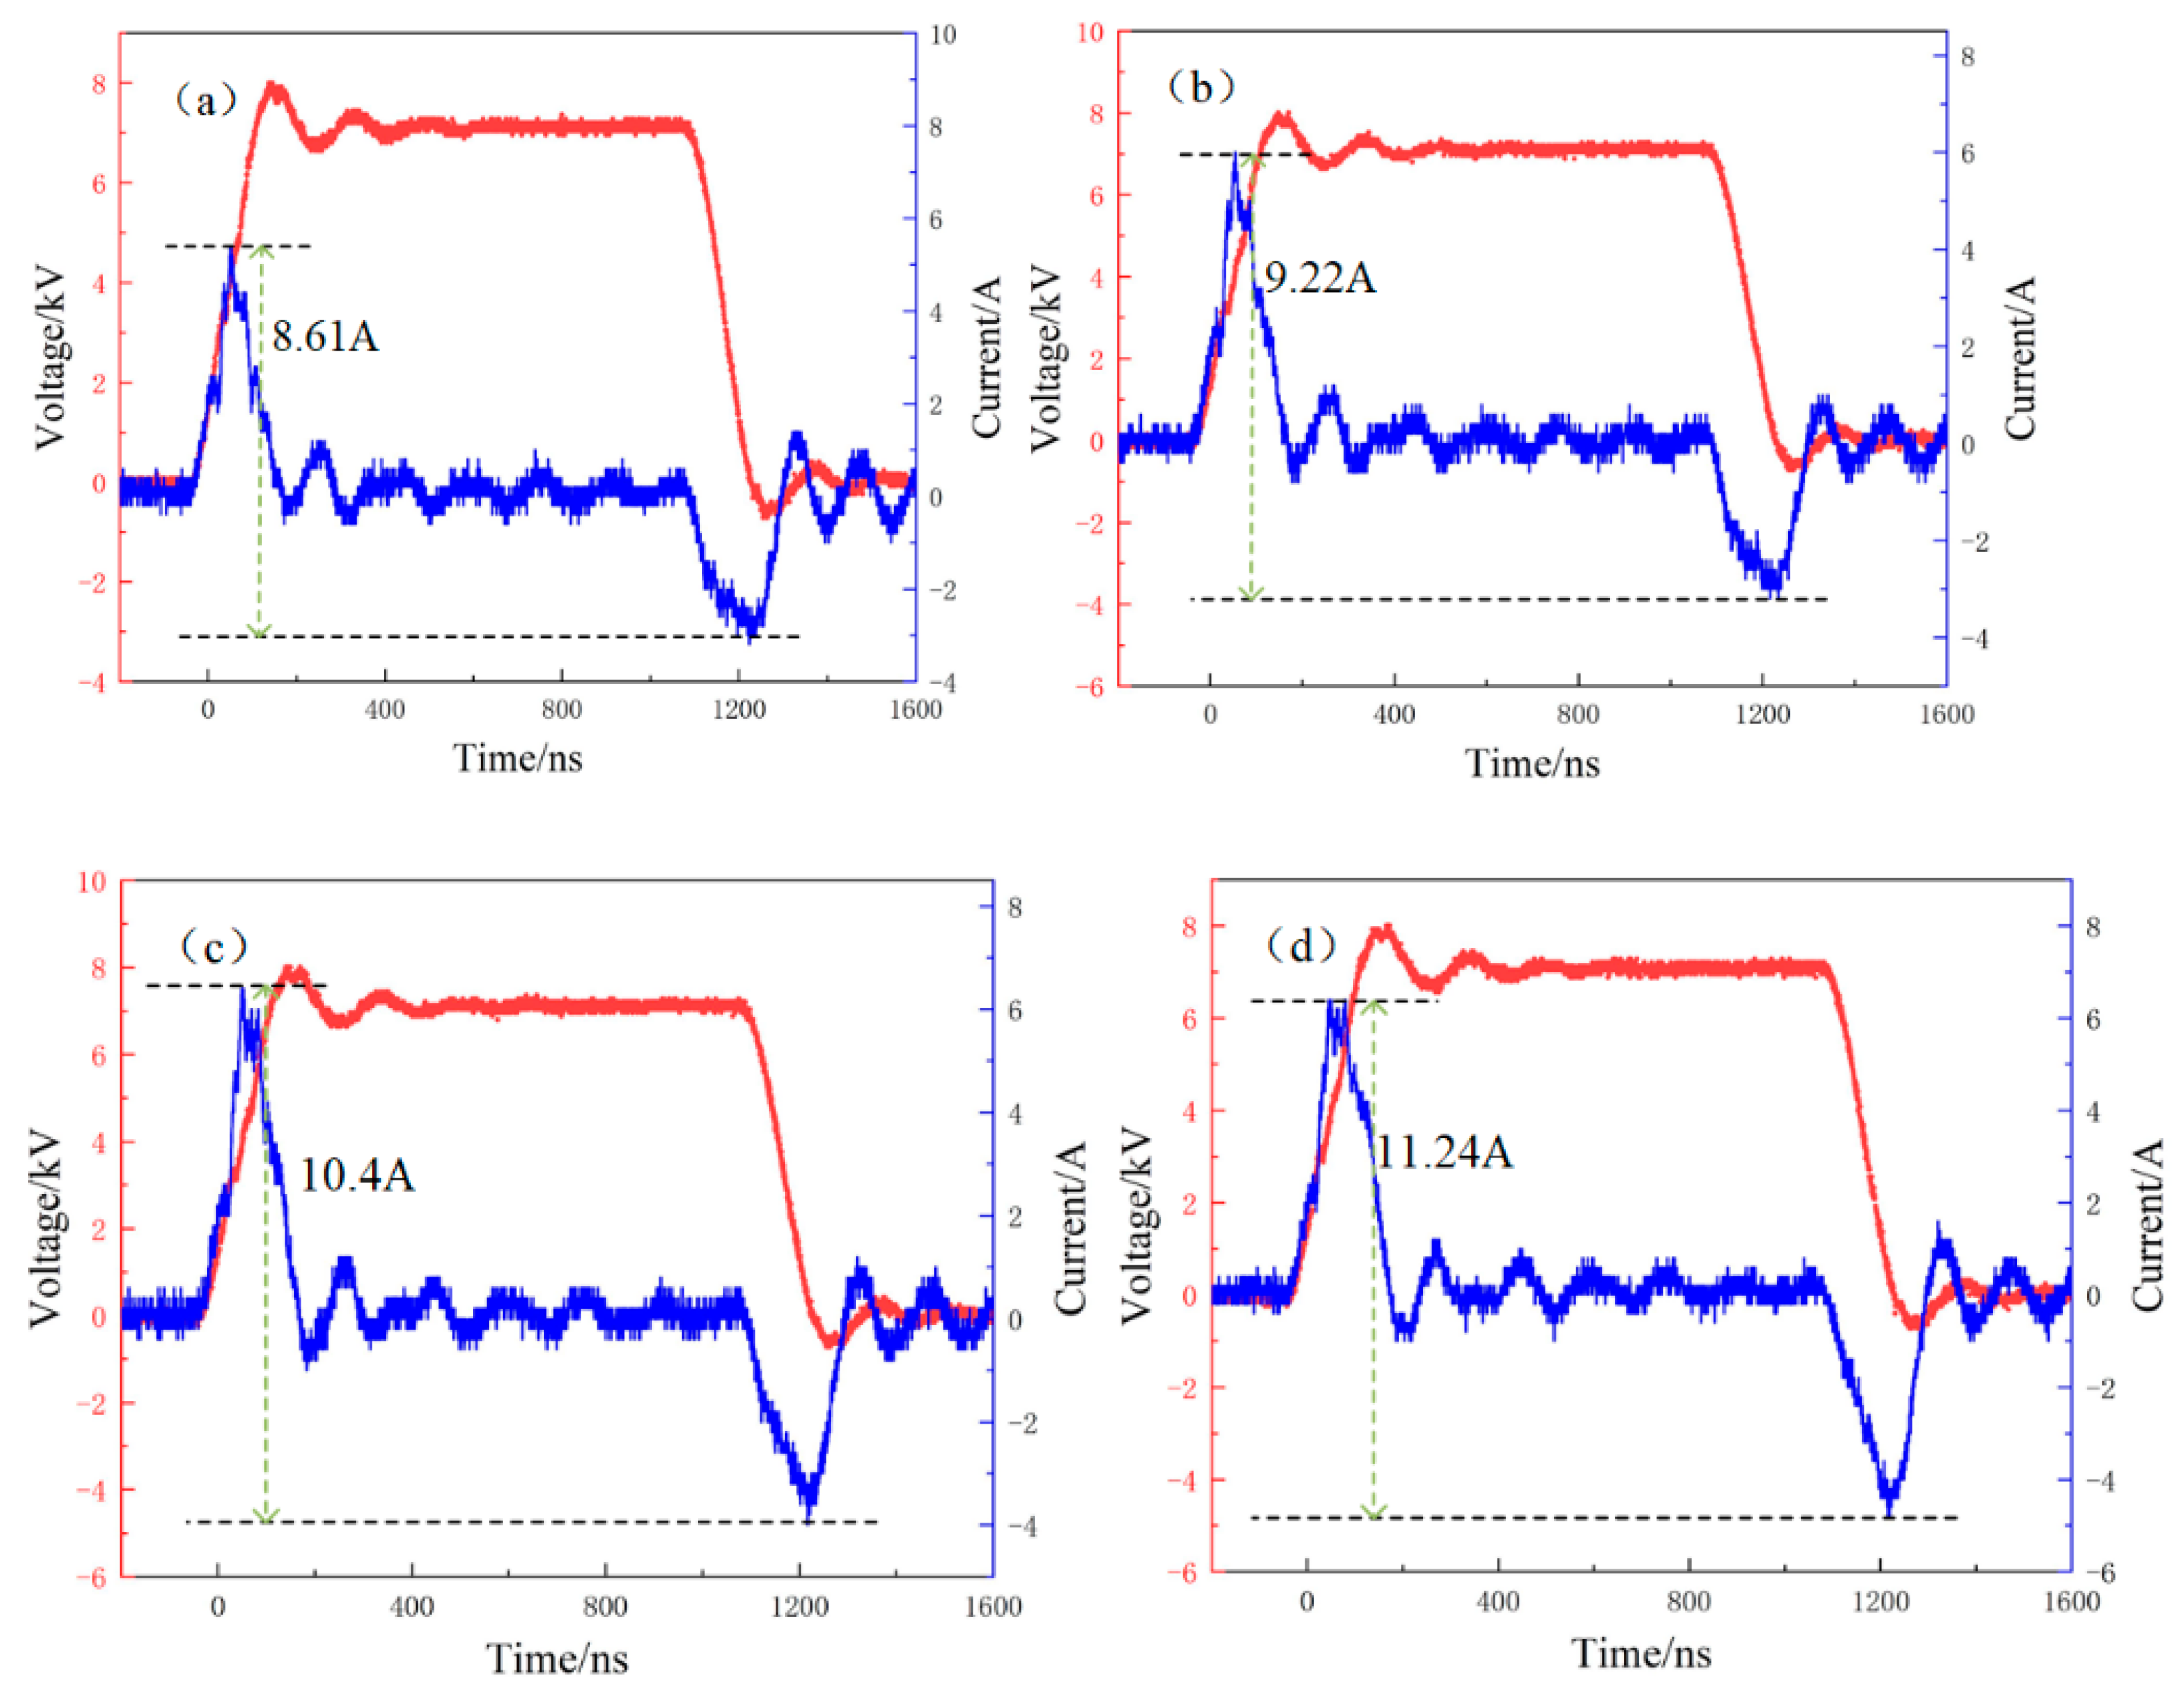
3.1. Electrical Characteristics

To investigate the characteristics of an NS-DBD actuator, the discharge energy, discharge images, and discharge waveform were measured experimentally. The influence of air pressure on the discharge morphology of the NS-DBD used in the experiment is shown in Figure 6. When the air pressure was above 5 kPa, the discharge area was confined to the surface of the covered electrode (cathode); below 5 kPa, it could extend to the surface of the exposed electrode (anode). In addition, as the air pressure decreased, the discharge became significantly more uniform. Discharge filaments gradually began to appear at the pressure of 5 kPa because of the combined effect of electron avalanches and low air pressure. The electron-avalanche number ne is given by
n e = exp ( α d )
where n e , α and d denote the electron avalanche number, the average number of ionizing collisions, and the distance of electron movement in the direction of the electric field, respectively. When the air pressure was above 5 kPa, filaments formed easily because frequent particle collisions caused the number of electrons to grow rapidly. However, the pressure also strongly affected the gas-breakdown process. Following Paschen’s law, the breakdown voltage decreased with decreasing air pressure.
The discharge waveforms of NS-DBD at 3 kPa and 7 kPa are compared in Figure 7. Only one current pulse was present in the current waveform at 3 kPa, and the discharge was uniform; several current pulses of nanosecond duration were present at 7 kPa, and the discharge was filamentous [21]. Therefore, NS-DBD has a filamentous discharge pattern in the typical pressure environment of the flame holder (40–70 kPa).
At each air pressure, the test was repeated three times to reduce the uncertainty. As can be seen from Figure 8, the images were captured about two seconds after the discharge for air pressures in the range 40–70 kPa. The discharge did not appear uniform: several plasma filaments were evident, and the plasma–discharge area had a distinct purple glow. At 40 kPa, a few small filaments became evident. At 60 kPa, the discharge filaments covered the whole electrode length and were generally wider. At 70 kPa, the horizontal separation of the filaments increased, the lengths of the filaments also decreased. The non-uniformity is also observed in previous research, which is probably ascribable to differences in the local dielectric-layer temperature before the discharge [22].
As shown in Figure 9, the rate of energy rises and the monopulse energy increased with the decrease of air pressure. The monopulse energy of NS-DBD was 5.58 mJ at 70 kPa but 7.34 mJ at 40 kPa, an increase of nearly 30.4%.
The discharge waveforms of NS-DBD at different air pressures are compared in Figure 10. A damped sinusoidal pattern superimposed on the voltage and current waveforms of the pulse could be observed across the entire pressure range 40–70 kPa. The current rose to its peak value after breakdown, whereas the voltage rapidly oscillated. The current clearly increased when the air pressure decreased; this corresponds to the change in monopulse energy. The peak-to-peak current was 8.61 A at 40 kPa but 11.24 A at 70 kPa, an increase of nearly 30.5%. Several current pulses appeared, corresponding to the filamentous-discharge characteristic described previously; the air gap between the exposed and covered electrodes broke down continually, and the charge was deposited on the surface of the dielectric layer [23].

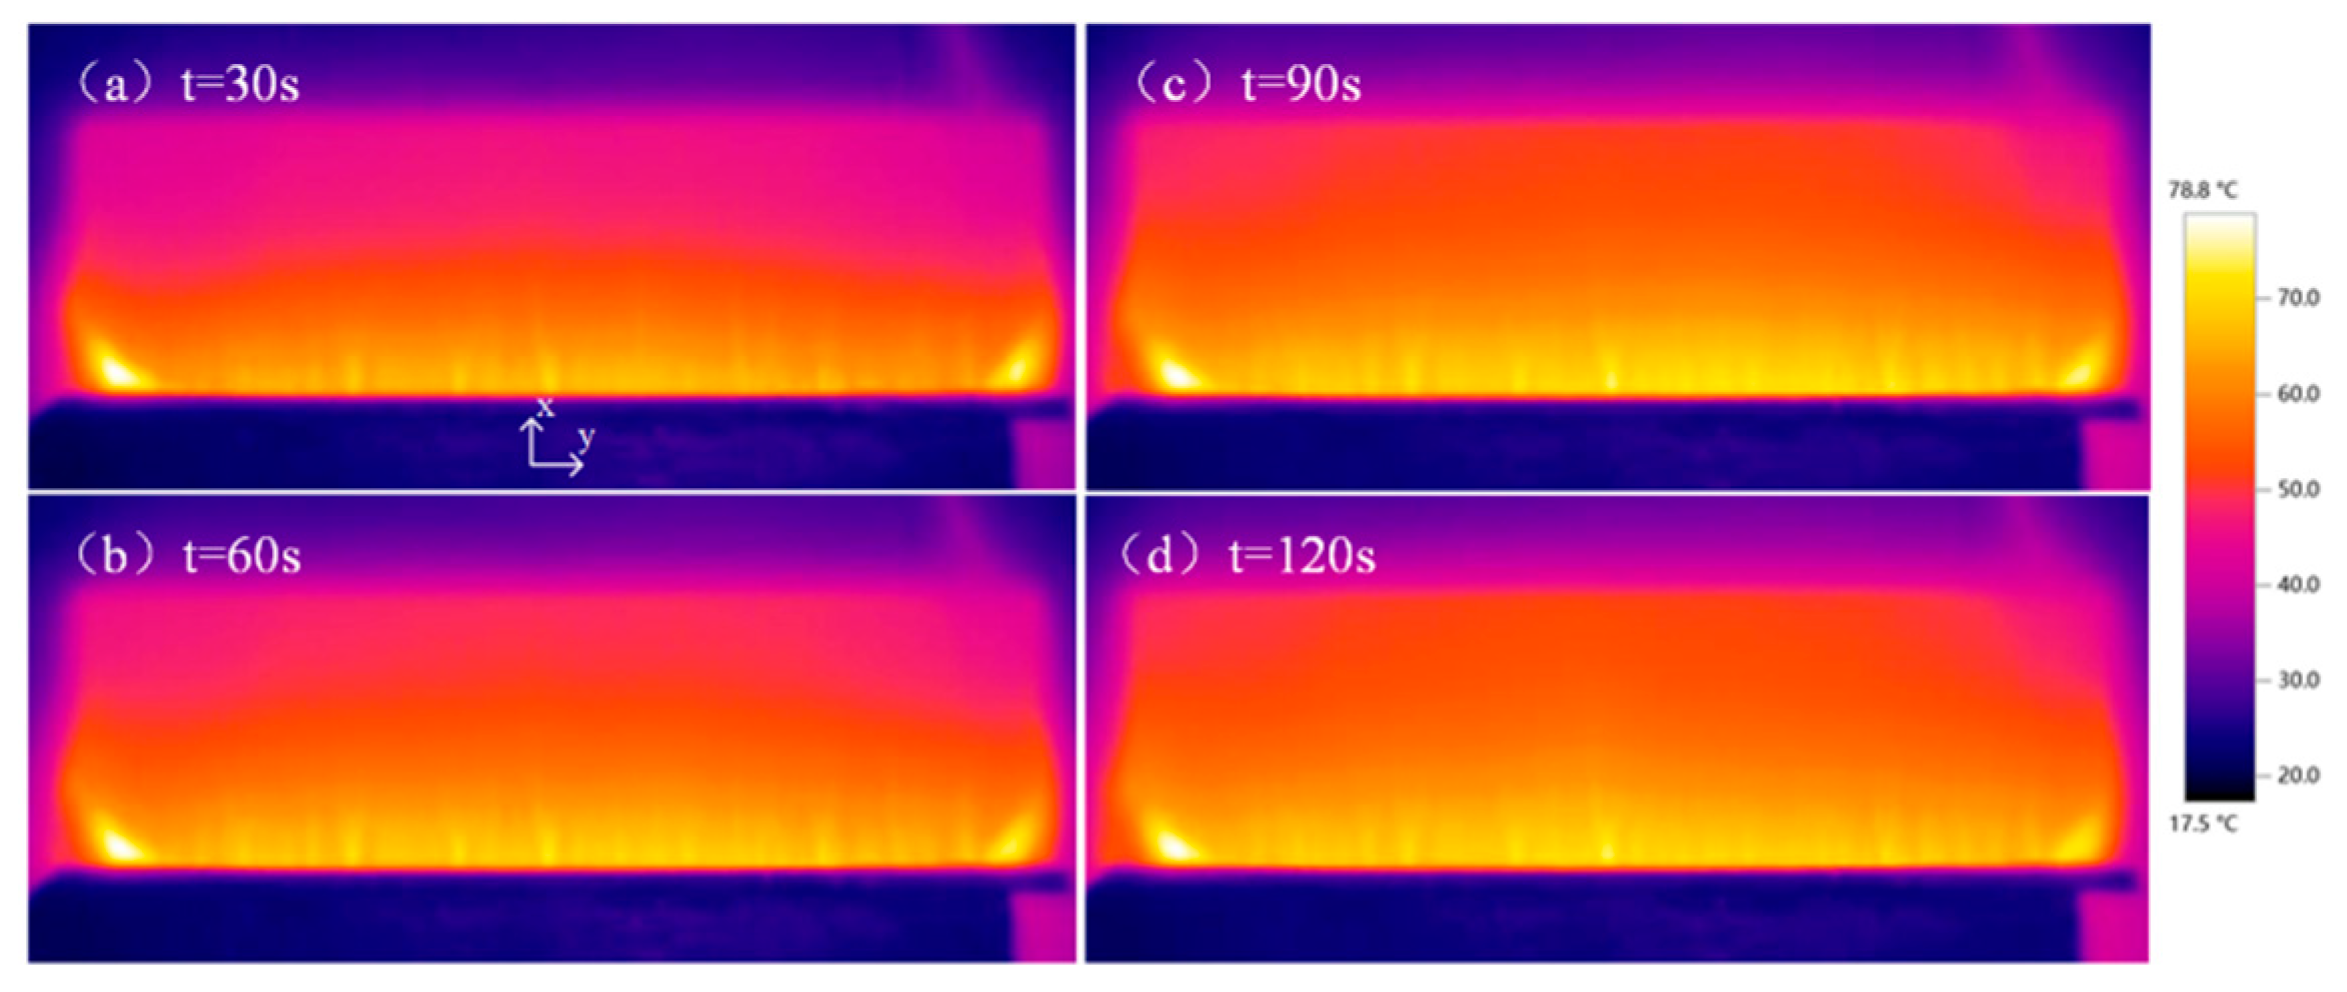
3.2. Thermal Characteristics of NS-DBD

Joussot et al. [24] investigated the temperature distribution on the dielectric surface for a thin dielectric (0.6 mm) DBD actuator. In the present work, by contrast, the thermal characteristics of thin dielectric (0.18 mm) were studied at low pressure.
Figure 11 shows the time sequence of the heating process during an NS-DBD plasma actuation at 40 kPa. The initial ambient temperature was 25 °C. After the plasma actuator was turned on, the temperature of the dielectric-layer surface rose. At 30 s, the higher temperature region was generally near the exposed electrode; the temperature peaked at the edges of exposed electrodes and decreased in the streamwise (x) direction. Joussot et al. [24] and Tirumala et al. [25] observed the same phenomenon in still air at atmospheric pressure; they suggested that, near the edge of the exposed electrode, energy transfer through ion–surface collisions played an important role. The temperature difference between the gas near the exposed electrodes and that at the far end of the covered electrodes resulted in convective heat transfer. The plasma transferred most of the thermal energy to the gas, which then heated the dielectric downstream from the covered electrodes through convection. Therefore, the high-temperature area expanded continuously in the streamwise direction after two minutes. Moreover, fast energy deposition into the air led to development of heated gas close to the discharge area, and each pulse contributed to expansion of the heated volume [26]. The expanding heated gas after the nanosecond pulses allowed the heat to dissipate over the large high-temperature area—higher or lower than thick.
Figure 12 shows the streamwise (at y = 1 mm) and spanwise (at x = 20 mm) variation in temperature rise. In the spanwise (y) direction, temperature peaks occurred near the discharge filaments. The general trend of temperature change was first upward and then downward, with a maximum temperature of 54.5 °C near the center of the discharge area; the minimum temperature produced on both sides of the discharge area was 37.6 °C.
In the streamwise (x) direction, the temperature decreased gradually with distance from the exposed electrode. The external electric-field distribution on the surface of NS-DBD can be used to explain this phenomenon. The electric field decreased continuously along the direction in which the filaments extend on the upper surface of the covered electrode [21]. Obviously, the heating rate and maximum temperature value decreased with the increasing air pressure (Figure 13). The heating rate decreased from 0.167 °C/s to 0.077 °C/s over the pressure range 40–70 kPa, a decrease of about 117.4%. The maximum temperature value was 65.7 °C at 70 kPa but 78.8 °C at 40 kPa, an increase of nearly 20%. The main reason was that the ultrafast gas heating caused by the nanosecond-pulsed discharge was mainly due to the high power density and energy [27]. The change in temperature with applied air pressure depended on a complex interplay of multiple factors. The total heat energy deposited in the discharge area was dependent on the electrical parameters. Because convection contributed to the heating of the dielectric-layer surface, the ionic-wind velocity played an essential role through the forced convection coefficient, which is dependent on the applied voltage [28]. In addition, the variation in air pressure changed the breakdown voltage, as before.

3.3. Schlieren Visualization

To observe the shock wave and vortexes, which were induced by the NS-DBD actuator, Schlieren visualization was used to investigate the disturbance in the flow field caused by the NS-DBD in the low-pressure environment (Figure 14, Figure 15, Figure 16 and Figure 17). Schlieren images with different gray peaks above the NS-DBD were observed: they corresponded to the change in density gradient generated by the discharge. A density gradient was produced in the static flow, probably by the heated air and body force generated by the filamentous discharge. There were two distinct density-gradient components: one that spread in a semi-circular arc above the actuator, the other a jetting flow on the surface. The average velocity of the induced wave and jet-flow velocity were calculated from the corresponding times. (Note that, because there was a delay between the discharge and the formation of the density-gradient disturbances, the moment the camera was triggered could not be taken as the initial time in this calculation without correction).
Schlieren images of induced wave propagation induced by NS-DBD at 50 kPa are shown in Figure 14. The vertical axis Y is the direction of induced-wave extension. Each pulse of the nanosecond power supply created a semicircular shock wave with a tiny tail, as described in the literature [29]. However, the tail of the shock wave was smaller in the low-pressure environment, primarily because the different working conditions made the discharge energy lower than at normal pressure. The shock-wave-generating thermal effect of the instantaneous pulses was reflected in the rapid heating of gases in the filamentary-discharge area of the NS-DBD during single-pulse excitation. From the initial formation of the shock wave to the moment of the first frame, the propagation velocity of the shock wave was 349.267 m/s. The velocities in the next two frames were 322.633 m/s and 311.167 m/s, respectively. Therefore, the intensity of the shock wave induced by NS-DBD under low pressure was weak, and its velocity was close to that of sound from the beginning. (This contrasts with the atmospheric-pressure case, where the shock wave propagates at supersonic speed in its initial phase and then decays into a sonic wave [30]). The low velocity was the result of the uniform distribution of NS-DBD filaments, which made the energy density of the excitation region near the wall decrease.
Figure 15 shows the jet-flow morphology induced by NS-DBD at 70 kPa. The gradual accumulation of heat led to the generation of a shock wave and induction of an anticlockwise starting vortex with constant discharge. The starting vortex propagated along the extension direction of the discharge filament on the surface of NS-DBD. From 50,000 to 75,000 μs after the initial time, the average velocity of the starting vortex was 0.38 m/s. The jet-flow velocity induced by the NS-DBD under low pressure was higher than that at normal pressure, but both had magnitude 0.1 m/s.
The Schlieren images in Figure 16 depict the evolution of the flow field induced by NS-DBD at different air pressures. There were some differences in the Schlieren images under different pressures. In every case, a shock wave that propagated faster upward than the anticlockwise vortex was observed. It was found that both the intensity of the starting vortex induced by NS-DBD and the angle of the jet-flow direction to the wall surface increased with the decrease of pressure, which indicates that NS-DBD can produce oblivious aerodynamic affect under low pressure due to the more energy deposited under low pressure as mentioned in Figure 9. In the course of propagation, the intensity of the shock wave and jet flow dwindled as their energy was dispersed because of viscous dissipation and the changes in the size of the shock wave and the shape of the jet flow. The breakdown voltage became lower as the pressure decreased, which reduced the energy required for breakdown between the exposed and covered electrodes. Therefore, during the period of rapidly rising voltage, the time during which the body force induced by DBD was significant became shorter, leaving insufficient response time for the flow field if the rising-edge time and voltage were constant. As a result, the positive body force diminished. Meanwhile, as the reverse body force was constant, an oblique upward jet was produced.
Though some general similarities exist for all pressures, a number of differences can be recognized. The structure of the wall-jet flow was not a vortex but had a “mushroom-cloud” shape in the pressure range 40–50 kPa because the heating rate was enhanced by the decrease in pressure, as shown in Figure 13.
Schlieren images of the induced flow field in the low-pressure environment at different voltages are shown in Figure 17. When the voltage decreased to 8 kV, a starting vortex was not observed in the region of interest, indicating that the intensity of the vortex decreased with decreasing voltage. Because the heating energy increased with increasing voltage, the shock wave remained constant, and the accompanying vortex seemed to be more intense.

3.4. Flow-Field Control of Flame-Holder Trailing Edge

In this study, PIV (an optical method of studying the variation of a flow field) was used to investigate the flow field characteristics of a flame holder and the recirculation zone of the flame-holder wake. The recirculation zone, where the velocity is lower, is the region where stable ignition sources are most likely to be established; it can also continuously absorb the main stream of fresh air, promoting flame propagation in the combustion chamber. Therefore, it is important to study changes of recirculation-zone properties and fuel–air mixture residence time before and after plasma actuator excitation.
The variation of the recirculation zone of the flame-holder wake and the change of vorticity with or without the actuator at different pressures are displayed in Figure 18. Although the flame holder itself had a symmetric shape, the velocity field and the recirculation zone were not all symmetrical. When the pressure was higher than 60 kPa, the structure of the recirculation zone was asymmetrical, perhaps because of the change of the Karman vortex street behind the flame holder. The influence of pressure on the structure and size of the circulation zone was significant. The recirculation-zone area decreased with decrease of pressure, consistent with the trend in previous research [20]. The length of the recirculation zone, defined as the distance from the backside of the flame holder to the farthest recirculation-zone boundary, was positively correlated with the pressure. When the actuator was operating, the length of the recirculation zone could significantly increase. The length of the recirculation zone without the actuator was 38.76 mm; with the actuator, it was 43.32 mm, nearly 11.8% higher. The regulating effect of the actuator on the flow field of the flame-holder wake decreased with the increase of pressure. A noticeable difference in the vorticity depending on whether the actuator was working can be seen in Figure 18. The vorticity increased with pressure; this implies that NS-DBD has a strong flow control effect on the flame-holder wake.
The time-averaged flow structures and vorticity contours at 40 kPa for different pulse widths are shown in Figure 19. The length of the recirculation zone increased with the pulse width. In addition, the vortex kernel in the recirculation zone was farther away from the flame holder when the pulse width was large. The main reason for this is that wider pulses have higher input energies, enhancing both the electric field generated by the actuator and the disturbance effect on the flow field. In addition, the vorticity also gradually increased with pulse width, and higher vorticity can cause the mainstream of fresh air to be continuously drawn in, promoting combustion.
The presence of a recirculation zone at the trailing edge of the flame holder stabilizes the flame, as the flow velocity in the zone was very low; this low-velocity region (LVR) is therefore of great significance. In addition, the residence time of the fuel–air mixture in the recirculation zone (i.e., the ratio of the recirculation zone’s length to the velocity at its edge) determines whether a stable flame can be established. Figure 20 shows LVR areas and fuel-air-mixture residence times (FMRTs) for a range of pulse widths. When the pulse width was 300 ns, the actuator produced the greatest increases of LVR area (31.8%) and FMRT (20.5%). The widening effect of the actuator on the LVR area decreased with the decrease of pressure: the LVR area could be increased by 24.4% at 80 kPa but only by 9.7% at 40 kPa. The main reason is that the jet intensity of the actuator was larger at lower pressure, increasing the acceleration effect on the boundary layer and airflow. The FMRT increased at longer pulse widths because of the increase of the length of the circulation zone.
Figure 21 compares flow structures and vorticity contours at two discharge frequencies. The effect of the actuator on widening the length of the recirculation zone was very limited at low discharge frequency, and the vorticity barely increased. Specifically, the length of the recirculation zone could be increased by 6.4% at 100 Hz; this only rose to 12.1% at 1000 Hz. The matching between the Karman-vortex-shedding frequency at the trailing edge of the flame holder and the discharge frequency of the actuator can explain this phenomenon. At the same time, the effect of the actuator was weak at low frequency, and a vortex behind the flame holder will fall off before the actuator disturbs the flow field.
Figure 22 compares LVR area and FMRT at different discharge frequencies. At 300 Hz, the actuator had the greatest effect on increasing the LVR area when the pressure was higher than 40 kPa. At a pressure of less than 40 kPa, the optimal discharge frequency for increasing LVR area was 500 Hz. Moreover, the influence of discharge frequency on the LVR area was different from that of pulse width: the widening effect of the actuator increased with the decrease of pressure. The LVR area could be increased by 16.9% at 80 kPa but by 40.8% at 40 kPa.
In addition, there was some correspondence between the discharge frequency and the pressure in terms of increasing the FMRT. When the pressure was 80 kPa, the optimal discharge frequency for increasing the FMRT was 300 Hz, and the FMRT could be increased by about 11.1%. At 40 kPa, the optimal discharge frequency was 500 Hz, and the FMRT could be increased by about 17.2%. On the whole, the optimal discharge frequency for increasing the FMRT increased as pressure decreased.
The time-averaged flow structures and the contours of vorticity at 40 kPa with different rising-edge times are shown in Figure 23. The length of the circulation zone increased by only 2% when the rising-edge time increased from 100 ns to 500 ns: the influence of rising-edge time on the length of the circulation zone is clearly very limited. Moreover, with the increase of rising-edge time, the vorticity and area of vorticity remained almost unchanged. Figure 24 compares the LVR and FMRT for a range of rising-edge times. There was a positive correlation between the rising-edge time and the optimal pressure for increasing the LVR area. At a pressure of 80 kPa, the optimal rising-edge time with the best effect on increasing the LVR area was 500 ns, and the LVR area could be increased by 17.4%; at 40 kPa, these became 50 ns and 46.2%, respectively. The reason is that the jet generated by the actuator was almost vertical, and the horizontal velocity was small. In addition, the intensity of the jet increased with the decrease of rising-edge time. Therefore, the LVR-area increase could be larger when pressure and rising-edge time were low. Moreover, the FMRT could be better increased when the rising-edge time was higher than 300 ns (Figure 24): the change of the rising-edge time strengthened the flow field disturbance, decreasing the boundary velocity in the recirculation zone.

4. Conclusions

In this present work, the characteristics of V-shaped flame holder with an NS-DBD actuator were investigated in a low-pressure environment.
The thermal distribution and electrical characteristics of the actuators varied significantly with pressure. Schlieren visualization showed that the shock wave propagated at supersonic speeds from the moment it was induced, and that both the intensity of the starting vortex and the angle between the jet flow direction and the wall surface increased with the decrease of pressure.
The effect of the NS-DBD on the trailing edge of the flame holder was evaluated through PIV. When the actuator was operating, the length of the recirculation zone was 43.32 mm, nearly 11.8% longer than without the actuator. When the pulse width was 300 ns, the actuator had the greatest effect on increasing the LVR area and the FMRT: 31.8% and 20.5%, respectively. In addition, the widening effect of the actuator on the LVR area decreased at low pressure. When the pressure was higher than 40 kPa, the actuator had the greatest effect on increasing the LVR area when the discharge frequency was 300 Hz, but at lower pressures, the optimal discharge frequency was 500 Hz. The optimal frequency for increasing the FMRT was also higher at low pressure. Increase of LVR area is optimized when the rising-edge time increases with pressure. Increase of FMRT is optimized when the rising-edge time is higher than 300 ns.
These results show that NS-DBD is capable of improving the performance of V-shaped flame holder under low air pressure.

Author Contributions

Conceptualization, W.C. and D.L.; methodology, W.C. and D.L.; validation, W.C., D.L., M.J. and M.L.; investigation, W.C., D.L., M.J. and M.L.; resources, W.C., D.L., M.J. and M.L.; data curation, W.C., D.L., M.J. and M.L.; writing—original draft preparation, W.C., D.L.; writing—review and editing, M.J. and M.L.; supervision, M.J. and M.L.; project administration, M.J. and M.L.; funding acquisition, M.J. and M.L. All authors have read and agreed to the published version of the manuscript.

Funding

This work was supported by the National Natural Science Foundation of China (Nos. 91941105, 91941301) and National Major Special Research Program (No. J2019-III-0013-0056).

Institutional Review Board Statement

Not applicable.

Informed Consent Statement

Not applicable.

Data Availability Statement

Not applicable.

Conflicts of Interest

The authors declare no conflict of interest.

References

  1. Corke, T.C.; Enloe, C.L.; Wilkinson, S.P. Dielectric Barrier Discharge Plasma Actuators for Flow Control. Annu. Rev. Fluid Mech. 2010, 42, 505–529. [Google Scholar] [CrossRef]
  2. Grossman, K.; Bohdan, C.; VanWie, D. Sparkjet Actuators for Flow Control. In Proceedings of the 41st Aerospace Sciences Meeting and Exhibit, Reno, NV, USA, 6–9 January 2003; American Institute of Aeronautics and Astronautics: Reston, VA, USA, 2003. [Google Scholar]
  3. Opaits, D.; Roupassov, D.; Starikovskaia, S.; Starikovskii, A.; Zavialov, I.; Saddoughi, S. Plasma Control of Boundary Layer Using Low-Temperature Non-Equilibrium Plasma of Gas Discharge. In Proceedings of the 43rd AIAA Aerospace Sciences Meeting and Exhibit, Reno, NV, USA, 10–13 January 2005; American Institute of Aeronautics and Astronautics: Reston, VA, USA, 2005. [Google Scholar]
  4. De Giorgi, M.G.; Motta, V.; Suma, A. Influence of Actuation Parameters of Multi-DBD Plasma Actuators on the Static and Dynamic Behaviour of an Airfoil in Unsteady Flow. Aerosp. Sci. Technol. 2020, 96, 105587. [Google Scholar] [CrossRef]
  5. Benard, N.; Moreau, E. EHD Force and Electric Wind Produced by Plasma Actuators Used for Airflow Control. In Proceedings of the 6th AIAA Flow Control Conference, New Orleans, LA, USA, 25–28 June 2012; American Institute of Aeronautics and Astronautics: Reston, VA, USA, 2012. [Google Scholar]
  6. Thomas, F.O.; Corke, T.C.; Iqbal, M.; Kozlov, A.; Schatzman, D. Optimization of Dielectric Barrier Discharge Plasma Actuators for Active Aerodynamic Flow Control. AIAA J. 2009, 47, 2169–2178. [Google Scholar] [CrossRef] [Green Version]
  7. Wu, Y.; Li, Y.-H.; Jia, M.; Liang, H.; Song, H.-M. Experimental Investigation of Nanosecond Discharge Plasma Aerodynamic Actuation. Chin. Phys. B 2012, 21, 045202. [Google Scholar] [CrossRef]
  8. Little, J.; Takashima, K.; Nishihara, M.; Adamovich, I.; Samimy, M. Separation Control with Nanosecond-Pulse-Driven Dielectric Barrier Discharge Plasma Actuators. AIAA J. 2012, 50, 350–365. [Google Scholar] [CrossRef]
  9. Starikovskii, A.Y.; Nikipelov, A.A.; Nudnova, M.M.; Roupassov, D. V SDBD Plasma Actuator with Nanosecond Pulse-Periodic Discharge. Plasma Sources Sci. Technol. 2009, 18, 034015. [Google Scholar] [CrossRef]
  10. Takashima (Udagawa), K.; Zuzeek, Y.; Lempert, W.R.; Adamovich, I. V Characterization of a Surface Dielectric Barrier Discharge Plasma Sustained by Repetitive Nanosecond Pulses. Plasma Sources Sci. Technol. 2011, 20, 055009. [Google Scholar] [CrossRef]
  11. Wu, Y.; Li, Y.; Jia, M.; Song, H.; Liang, H. Optical Emission Characteristics of Surface Nanosecond Pulsed Dielectric Barrier Discharge Plasma. J. Appl. Phys. 2013, 113, 033303. [Google Scholar] [CrossRef]
  12. Durasiewicz, C.; Singh, A.; Little, J.C. A Comparative Flow Physics Study of Ns-DBD vs Ac-DBD Plasma Actuators for Transient Separation Control on a NACA 0012 Airfoil. In Proceedings of the 2018 AIAA Aerospace Sciences Meeting, Kissimmee, FL, USA, 8–12 January 2018; American Institute of Aeronautics and Astronautics: Reston, VA, USA, 2018. [Google Scholar]
  13. Wu, Y. Nanosecond Pulsed Discharge Plasma Actuation: Characteristics and Flow Control Performance. In Proceedings of the 45th AIAA Plasmadynamics and Lasers Conference, Atlanta, GA, USA, 16–20 June 2014; American Institute of Aeronautics and Astronautics: Reston, VA, USA, 2014. [Google Scholar]
  14. Van den Broecke, J. De-Icing Using Ns-DBD Plasma Actuators; Delft University of Technology: Delft, The Netherlands, 2016. [Google Scholar]
  15. Zhu, Y.; Wu, Y.; Wei, B.; Xu, H.; Liang, H.; Jia, M.; Song, H.; Li, Y. Nanosecond-Pulsed Dielectric Barrier Discharge-Based Plasma-Assisted Anti-Icing: Modeling and Mechanism Analysis. J. Phys. D Appl. Phys. 2020, 53, 145205. [Google Scholar] [CrossRef]
  16. Zhu, Y.; Wu, Y.; Cui, W.; Li, Y.; Jia, M. Modelling of Plasma Aerodynamic Actuation Driven by Nanosecond SDBD Discharge. J. Phys. D Appl. Phys. 2013, 46, 355205. [Google Scholar] [CrossRef]
  17. Jia, Y.; Liang, H.; Zong, H.; Hua, W.; Lin, Z. Flow Separation Control in S-Shaped ∼inlet with a Nanosecond Pulsed Surface Dielectric Barrier Discharge Plasma Actuator. J. Phys. D Appl. Phys. 2022, 55, 055201. [Google Scholar] [CrossRef]
  18. Hosokawa, S.; Ikeda, Y.; Minato, M.; Nakajima, T. Flow Measurements behind V-Gutter under Non-Combusting Condition. In Proceedings of the 31st Aerospace Sciences Meeting, Reno, NV, USA, 11–14 January 1993; American Institute of Aeronautics and Astronautics: Reston, VA, USA, 1993. [Google Scholar]
  19. Yue, L.; Yang, M. Discussion on the Instantaneous Viewpoint About the Flame Stability Mechanism of Flameholder. J. Aerosp. Power 2001, 16, 340–344. [Google Scholar]
  20. Li, G.; Wang, J. V-shaped flame stabilizes at low pressure. J. Aviat. 1996, 11, 48–52. [Google Scholar]
  21. Tepper, J.; Lindmayer, M.; Jüttner, B. Optical and Electrical Measurements of Homogeneous Barrier Discharges at Atmospheric Pressure. In Proceedings of the 13th International Conference on Gas Discharges and their Applications, Glasgow, Scotland, 3–8 September 2000; pp. 303–306. [Google Scholar]
  22. Biganzoli, I.; Barni, R.; Gurioli, A.; Pertile, R.; Riccardi, C. Experimental Investigation of Filamentary and Non-Filamentary Regimes in a Surface Dielectric Barrier Plasma Actuator. J. Phys. Conf. Ser. 2014, 550, 012038. [Google Scholar] [CrossRef]
  23. Yang, Z.; Jiang, H.; Zhang, C.; Che, X.; Yan, P.; Shao, T. Comparison of Discharge Characteristics in Surface Dielectric Barrier Discharge Driven by Nanosecond and Microsecond Pulsed Powers. High Volt. Eng. 2014, 40, 3091–3097. [Google Scholar]
  24. Joussot, R.; Boucinha, V.; Weber-Rozenbaum, R.; Rabat, H.; Leroy-Chesneau, A.; Hong, D. Thermal Characterization of a DBD Plasma Actuator: Dielectric Temperature Measurements Using Infrared Thermography. In Proceedings of the 40th Fluid Dynamics Conference and Exhibit, Chicago, IL, USA, 28 June–1 July 2010; American Institute of Aeronautics and Astronautics: Reston, VA, USA, 2010. [Google Scholar]
  25. Tirumala, R.; Benard, N.; Moreau, E.; Fenot, M.; Lalizel, G.; Dorignac, E. Temperature Characterization of Dielectric Barrier Discharge Actuators: Influence of Electrical and Geometric Parameters. J. Phys. D Appl. Phys. 2014, 47, 255203. [Google Scholar] [CrossRef]
  26. Correale, G.; Michelis, T.; Ragni, D.; Kotsonis, M.; Scarano, F. Nanosecond-Pulsed Plasma Actuation in Quiescent Air and Laminar Boundary Layer. J. Phys. D Appl. Phys. 2014, 47, 105201. [Google Scholar] [CrossRef]
  27. Zhu, Y.; Wu, Y.; Cui, W.; Li, Y.; Jia, M. Numerical Investigation of Energy Transfer for Fast Gas Heating in an Atmospheric Nanosecond-Pulsed DBD under Different Negative Slopes. J. Phys. D Appl. Phys. 2013, 46, 495205. [Google Scholar] [CrossRef]
  28. Jiang, H.; Shao, T.; Zhang, C.; Yan, P. Distribution Characteristics of Nanosecond-Pulsed Surface Dielectric Barrier Discharge at Different Electrode Gaps. Trans. China Electrotech. Soc. 2017, 32, 33–42. [Google Scholar]
  29. Chen, J.; Liang, H.; Wei, B.; Zhao, G.Y.; Su, Z. Discharge Characteristics of Surface Dielectric Barrier Discharge Driven by Parameterized Nanosecond Pulsed Power Supply. High Volt. Eng. 2019, 45, 3365–3374. [Google Scholar]
  30. Zhao, G.Y.; Liang, H.; Li, Y.H.; Hua, W.Z.; Han, M.H.; Wu, Y. Study of Electrical Characterization and Induced Flow by Nanosecond Pulsed Dielectric Barrier Discharge Actuator. Sci. Sin. Technol. 2015, 45, 1195–1206. [Google Scholar]
Figure 1. Structural diagram of the actuator.
Processes 10 01519 g001
Figure 2. A positive nanosecond voltage pulse with rise time τ r , fallen time τ p and pulse width τ d .
Processes 10 01519 g002
Figure 3. Schematic diagram of the flame-holder model.
Processes 10 01519 g003
Figure 4. Particle-image-velocimetry system.
Processes 10 01519 g004
Figure 5. Schlieren imaging system.
Processes 10 01519 g005
Figure 6. Emergence of filamentous discharge with increasing air pressure (a) 1 kPa, (b) 3 kPa, (c) 5 kPa, (d) 7 kPa.
Processes 10 01519 g006
Figure 7. Discharge waveforms of nanosecond-pulsed dielectric-barrier discharge at pressures of (a) 3 kPa and (b) 7 kPa.
Processes 10 01519 g007
Figure 8. Discharge images of nanosecond-pulsed dielectric-barrier discharge at different pressures (a) 40 kPa, (b) 50 kPa, (c) 60 kPa, (d) 70 kPa.
Processes 10 01519 g008
Figure 9. One pulse energy at different air pressure levels.
Processes 10 01519 g009
Figure 10. Current (blue line) and voltage (red line) discharge waveforms of nanosecond-pulsed dielectric-barrier discharge at pressures of (a) 70 kPa, (b) 60 kPa, (c) 50 kPa, and (d) 40 kPa.
Processes 10 01519 g010
Figure 11. Comparison of the temperature distribution at different times.
Processes 10 01519 g011
Figure 12. The temperature–variation curve at pressure 50 kPa in the (a) horizontal and (b) vertical directions.
Processes 10 01519 g012
Figure 13. Comparison of heating rate and maximum temperature at different air pressures.
Processes 10 01519 g013
Figure 14. Visualization of the propagating induced wave.
Processes 10 01519 g014
Figure 15. Visualization of the propagating jet flow.
Processes 10 01519 g015
Figure 16. Schlieren images of induced flow field at different pressures.
Processes 10 01519 g016
Figure 17. Schlieren images of induced flow field at different voltages.
Processes 10 01519 g017
Figure 18. Time-averaged flow structures (left) and vorticity contours (right) of the flame-holder wake at different pressures with plasma on or off, (a,b) 40 kPa with plasma off, (c,d) 40 kPa with plasma on, (e,f) 60 kPa with plasma off, (g,h) 60 kPa with plasma on, (i,j) 80 kPa with plasma off, (k,l) 80 kPa with plasma on.
Processes 10 01519 g018aProcesses 10 01519 g018b
Figure 19. Time-averaged flow structures (left) and vorticity contours (right) of the flame-holder wake for different pulse widths, (a,b) 1000 ns pulse width, (c,d) 7000 ns pulse width.
Processes 10 01519 g019
Figure 20. Low-velocity-region areas (left) and fuel-air-mixture residence times (right) for different pressures and pulse widths.
Processes 10 01519 g020
Figure 21. Time-averaged flow structures (left) and vorticity contours (right) of of the flame-holder wake at different discharge frequencies, (a,b) 100 Hz discharge frequency, (c,d) 1000 Hz discharge frequency.
Processes 10 01519 g021
Figure 22. Low-velocity-region areas (left) and fuel-air-mixture residence times (right) for different pressures and discharge frequencies.
Processes 10 01519 g022
Figure 23. Time-averaged flow structures (left) and vorticity contours (right) of the flame-holder wake with different rising-edge times, (a,b) 100 ns rising-edge, (c,d) 500 ns rising-edge.
Processes 10 01519 g023
Figure 24. Low-velocity-region areas (left) and fuel-air-mixture residence times (right) for different pressures and rising-edge times.
Processes 10 01519 g024
Publisher’s Note: MDPI stays neutral with regard to jurisdictional claims in published maps and institutional affiliations.

