Article

Numerical Study on Transportation of Cemented Paste Backfill Slurry in Bend Pipe

by
Huizhen Dong
1,
Nuraini Abdul Aziz
1,
Helmi Zulhaidi Mohd Shafri
2 and
Kamarul Arifin Bin Ahmad
3,*
1
Department of Mechanical Engineering, Faculty of Engineering, University Putra Malaysia, Serdang 43400, Malaysia
2
Department of Civil Engineering, Faculty of Engineering, University Putra Malaysia, Serdang 43400, Malaysia
3
Department of Aerospace Engineering, Faculty of Engineering, University Putra Malaysia, Serdang 43400, Malaysia
*
Author to whom correspondence should be addressed.
Processes 2022, 10(8), 1454; https://doi.org/10.3390/pr10081454
Submission received: 24 June 2022 / Revised: 19 July 2022 / Accepted: 21 July 2022 / Published: 25 July 2022

Abstract

:
With the development of coal mining, the use of elbows has diversified the forms of underground backfill pipelines, which has inevitably complicated the transportation characteristics of filling slurry in the pipeline, thus affecting the entire backfilling system. The objective of this study is to numerically investigate the running state of cemented paste backfilling (CPB) slurry and coarse particles at different velocities by transporting in bend pipes. To better understand the transportation state of CPB slurry in pipeline, a computational fluid dynamics (CFD) model—mixture model was developed to study the transportation of CPB slurry. The volume distribution of coarse particles in slurry under different pipe types and different flow rates, as well as the velocity profiles of slurry at different positions, were simulated and analyzed, and the pressure losses under different pipe types were compared. The results show that the distribution of coarse particles varies with the tube type, and the effect of coarse particles on the position of tube wall changes with the increase in velocity. The high-speed zone of CPB slurry will move toward the outer wall of the elbow with the increase in velocity. The pressure loss of CPB slurry in the vertical–horizontal pipeline is larger than that in the horizontal–vertical pipeline, and the difference is larger in the bend section. This study provides a theoretical and meaningful reference for CPB slurry backfilling operations in different bends.

1. Introduction

Backfilling goaf in the mining area can effectively prevent surrounding rock burst and control gorcock activities. This kind of green and sustainable development method is favored by the global mining industry. With the continuous mining of mineral resources, deep mining has become an inevitable path to obtain mineral resources [1]. Deep mining ultimately leads to the complexity of the backfilling line. In this process, it is inevitable to consider the use of elbow. Connecting the elbow provides the layout of the backfilling pipe with flexibility. However, the use of elbow makes the slurry direction change suddenly during transportation, which increases the complexity of slurry flow in the pipeline. Therefore, it is of critical importance to study the motion state of CPB slurry in the bend to reveal its influence on the pipe.
Because of the convenience and intuitiveness of computer software, computational fluid dynamics (CFD) is largely favored by researchers. Yang et al. [2] conducted numerical simulation on the flow of cemented coal gangue-fly ash backfill slurry in a straight pipe and a bend pipe and found that the slurry resistance loss in the bend pipe was much larger than that in the straight pipe. Zhang et al. [3] studied the high concentration of cement tailing backfill slurry and found that when the slurry solid content reaches over 70%, it conforms to the Bingham model. The resistance loss of slurry is positively correlated with concentration and flow rate. However, these simulations regard the slurry flow as a whole and uniform fluid, which is a single-phased one. For backfill slurry without settlement characteristics, the above research can meet the requirements of backfill pumping capacity, flow optimization ratio, and pipeline system design. However, for slurry composed of particles of different sizes, the solid concentration in the transportation process is not uniform in the cross section, resulting in relevancy between the particle and the pipe wall [4,5]. The literature [6] also claims that the wear rate and the position of severe wear are directly related to the movement of solid particles. Hence, for backfilling slurry with subsidence risk, the multiphase flow model can better capture the flow information of each phase in the pipeline.
While existing pipeline numerical simulations mostly focus on gas–solid and solid–liquid flow elbow, CPB belongs to the category of solid–liquid two-phase flow. Singh et al. [7,8,9] numerically studied the influence of particles in different slurries on 90° elbow. Their results show that the head loss increases with the slurry velocity and concentration. The wall wear rate increases greatly with the increase of velocity, solid concentration, and particle size. The wear of the outer wall of the bend is greater than that of other parts, and with the increase of velocity, the settlement wear at the bottom of the pipe will shift to the outer wall of the pipe. Zhou et al. [10] used a computational fluid dynamics–discrete element method (CFD-DEM) to study the hydraulic bend transporting coarse particles with a Cv of 5% and explained that the pressure loss and erosion rate of slurry are different under different velocities and pipe shapes. Moreover, other researchers have carried out studies on different elbow angles. Xie et al. [11] simulated different bending angles using the Euler–Lagrange method and found that the erosion degree of pipe decreases with the increase of pipe diameter and bending angle. Chen et al. [12] established a 3D network simulation of CPB slurry flow in an L-shaped pipe using COMSOL Multiphysics software. Their results show that the increase of inlet velocity and the decrease of particle size are beneficial to the slurry uniformity in the pipeline. Through the summary of the above literature, it was found that both study on the gas–solid two-phase flow and solid–liquid two-phase flow are primarily focused on pipeline studies with particle size less than 1 mm with low concentration. However, coarse aggregate (>5 mm) is unavoidable for the CPB slurry, which improves the strength, durability, and deformation performance of the backfilling body [13]. For the solid–liquid two-phase flow such as paste backfilling slurry, the flow law is mainly affected by the solid content and flow rate [14]. Wang et al. [1] used COMSOL software to study the sedimentation of particles in backfill slurry and found that the sedimentation rate of particles was positively correlated with particle size but negatively correlated with slurry concentration and flow rate. In addition, Nguyen et al. [15] showed that the effect of particles on the pipe wall depends on the particle size. The wear surface changes from W shape to U shape with the increase of particle size. Therefore, it is not appropriate to apply the results of fine particle size to large particles. It can be concluded that the study of particles in the filling engineering is of vital importance for the slurry transportation process. In addition, owing to the difference in the characteristics of backfilling materials, the resistance loss of different backfilling materials varies with the velocity. These above factors are closely related to pipeline wear [8]. Overall, the motion state and volume distribution of large particle size in the flow and velocity distribution of CPB slurry directly affect the wall surface situation of the pipe, which needs to be further studied and understood. Furthermore, most studies on CPB slurry transportation in pipelines are limited to one of the pipe types, and comparative studies for different type pipes are not carried out as in this paper, which can provide comprehensive thinking and consideration for researchers or practitioners.
The CFD approach is introduced in this study, and the flow states of CPB slurry in 3D horizontal–vertical pipeline and 3D vertical–horizontal pipeline were numerically studied using the mixture model in Fluent software. The volume fraction distribution of coarse particles in bend, horizontal, and vertical sections of pipes and CPB slurry cross-section velocity distribution in the two-pipe types were obtained. Finally, the pressure losses of the two types of tubes were compared. Through more direct observation and analysis of CPB slurry flow state under two-pipe types, a deeper understanding on the influence of CPB slurry and particles on the pipeline during transportation can be obtained, which can’t be easily observed in experiments or tests. This study provides a theoretical basis for deep backfilling in coal mines, but also proposes the possibility of backfilling pipeline optimization.

2. Governing Equation

As stated earlier, CPB belongs to the study of solid–liquid two-phase flow. Two models, namely the Eulerian–Lagrange model and the Eulerian–Eulerian model, are among the most prevalent numerical research methods of solid–liquid two-phase flow. The Eulerian–Lagrange method uses the Eulerian method to solve the fluid continuous phase theory, and Lagrange’s law is used to directly track and solve the motion of each individual particle. Since this model considers each particle as a completely discrete system, it takes a lot of computing power to analyze the position, velocity, stress, and diffusivity of each particle during particle tracking [16]. Therefore, this method is suitable for the discrete phase with low volume fraction in the fluid [17]. In contrast to the Eulerian–Lagrange method, the solid–liquid phase is regarded as a continuous phase that penetrates each other and has the same governing equation in the Eulerian–Eulerian model, which is more suitable for fluid study with a volume fraction of the discrete phase over 5% [18,19,20]. Obviously, the discrete phase volume fraction in the CPB that we studied is much larger than the above requirements. In addition, the mixture model, which belongs to the Eulerian–Eulerian model, is a simplified two-phase (multiphase) flow model which can simulate multiphase flow by solving the momentum, continuity, and energy of the mixed phase, the volume fraction equation of the second phase, and the algebraic expression of the relative velocity (if any). As per the ANSYS Fluent User’s Guide, the mixture model is more appropriate for the simulation with poor comprehension of law of drag force between phases as well as the dispersed phase of broad distribution, with the further advantage of better stability. Ultimately, the mixture method was adopted in this study on account of the determination of fewer variables in this model.

2.1. Continuity Equation

The continuity equation for the mixture is:
t ( ρ m ) + · ( ρ m v m ) = 0
where v m is the mass-averaged velocity:
v m = k = 1 n α k ρ k v k ρ m
and ρ m is the mixture density:
ρ m = k = 1 n α k ρ k
α k is the volume fraction of phase.

2.2. Momentum Equation

The momentum equation for the mixture can be obtained by summing the individual momentum equations for all phases. It can be expressed as:
t ( ρ m v m ) + · ( ρ m v m v m ) = p + · [ μ m ( v m + v m T ) ] + ρ m g + F · ( k = 1 n α k ρ k v d r , k v d r , k )
where n is the number of phases, F is a body force, and μ m is the viscosity of the mixture:
μ m = k = 1 n α k μ k
v d r , k is the drift velocity for secondary phase:
v d r , k = v k v m

2.3. Volume Fraction Equation for the Secondary Phases

From the continuity equation for the secondary phase, the volume fraction equation for secondary phase can be obtained as follows:
t ( α p ρ p ) + · ( α p ρ p v m ) = · ( α p ρ p v d r , p ) + q = 1 n m ˙ q p m ˙ p q

2.4. Granular Properties

Since the concentration of particles is an important factor in the calculation of the effective viscosity of the mixture, one may use the granular viscosity to get a value for the viscosity of the suspension. The volume-weighted average for the viscosity would now contain shear viscosity arising from particle momentum exchange owing to translation and collision.
The collisional and kinetic parts, along with the optional frictional part, can be added to give the solids shear viscosity:
μ s = μ s , c o l + μ s , k i n + μ s , f r
(1) collisional viscosity
The collisional part of the shear viscosity is modeled as [21]:
μ s , c o l = 4 5 α s ρ s d s g 0 , s s ( 1 + e s s ) ( Θ s π ) 1 2
(2) kinetic viscosity
The expressions for the kinetic viscosity are modeled as [22]:
μ s , k i n = d s ρ s Θ s π 6 ( 3 e s s ) [ 1 + 2 5 ( 1 + e s s ) ( 3 e s s 1 ) α s g 0 , s s ]
(3) optional frictional part viscosity [23]:
μ s , f r = P s sin ϕ 2 I 2 D

2.5. Solid Pressure

The total solid pressure was calculated and included in the mixture momentum equations:
P s , t o t a l = q = 1 N p q
where p q is present in the section for granular flows.

3. Numerical Procedure

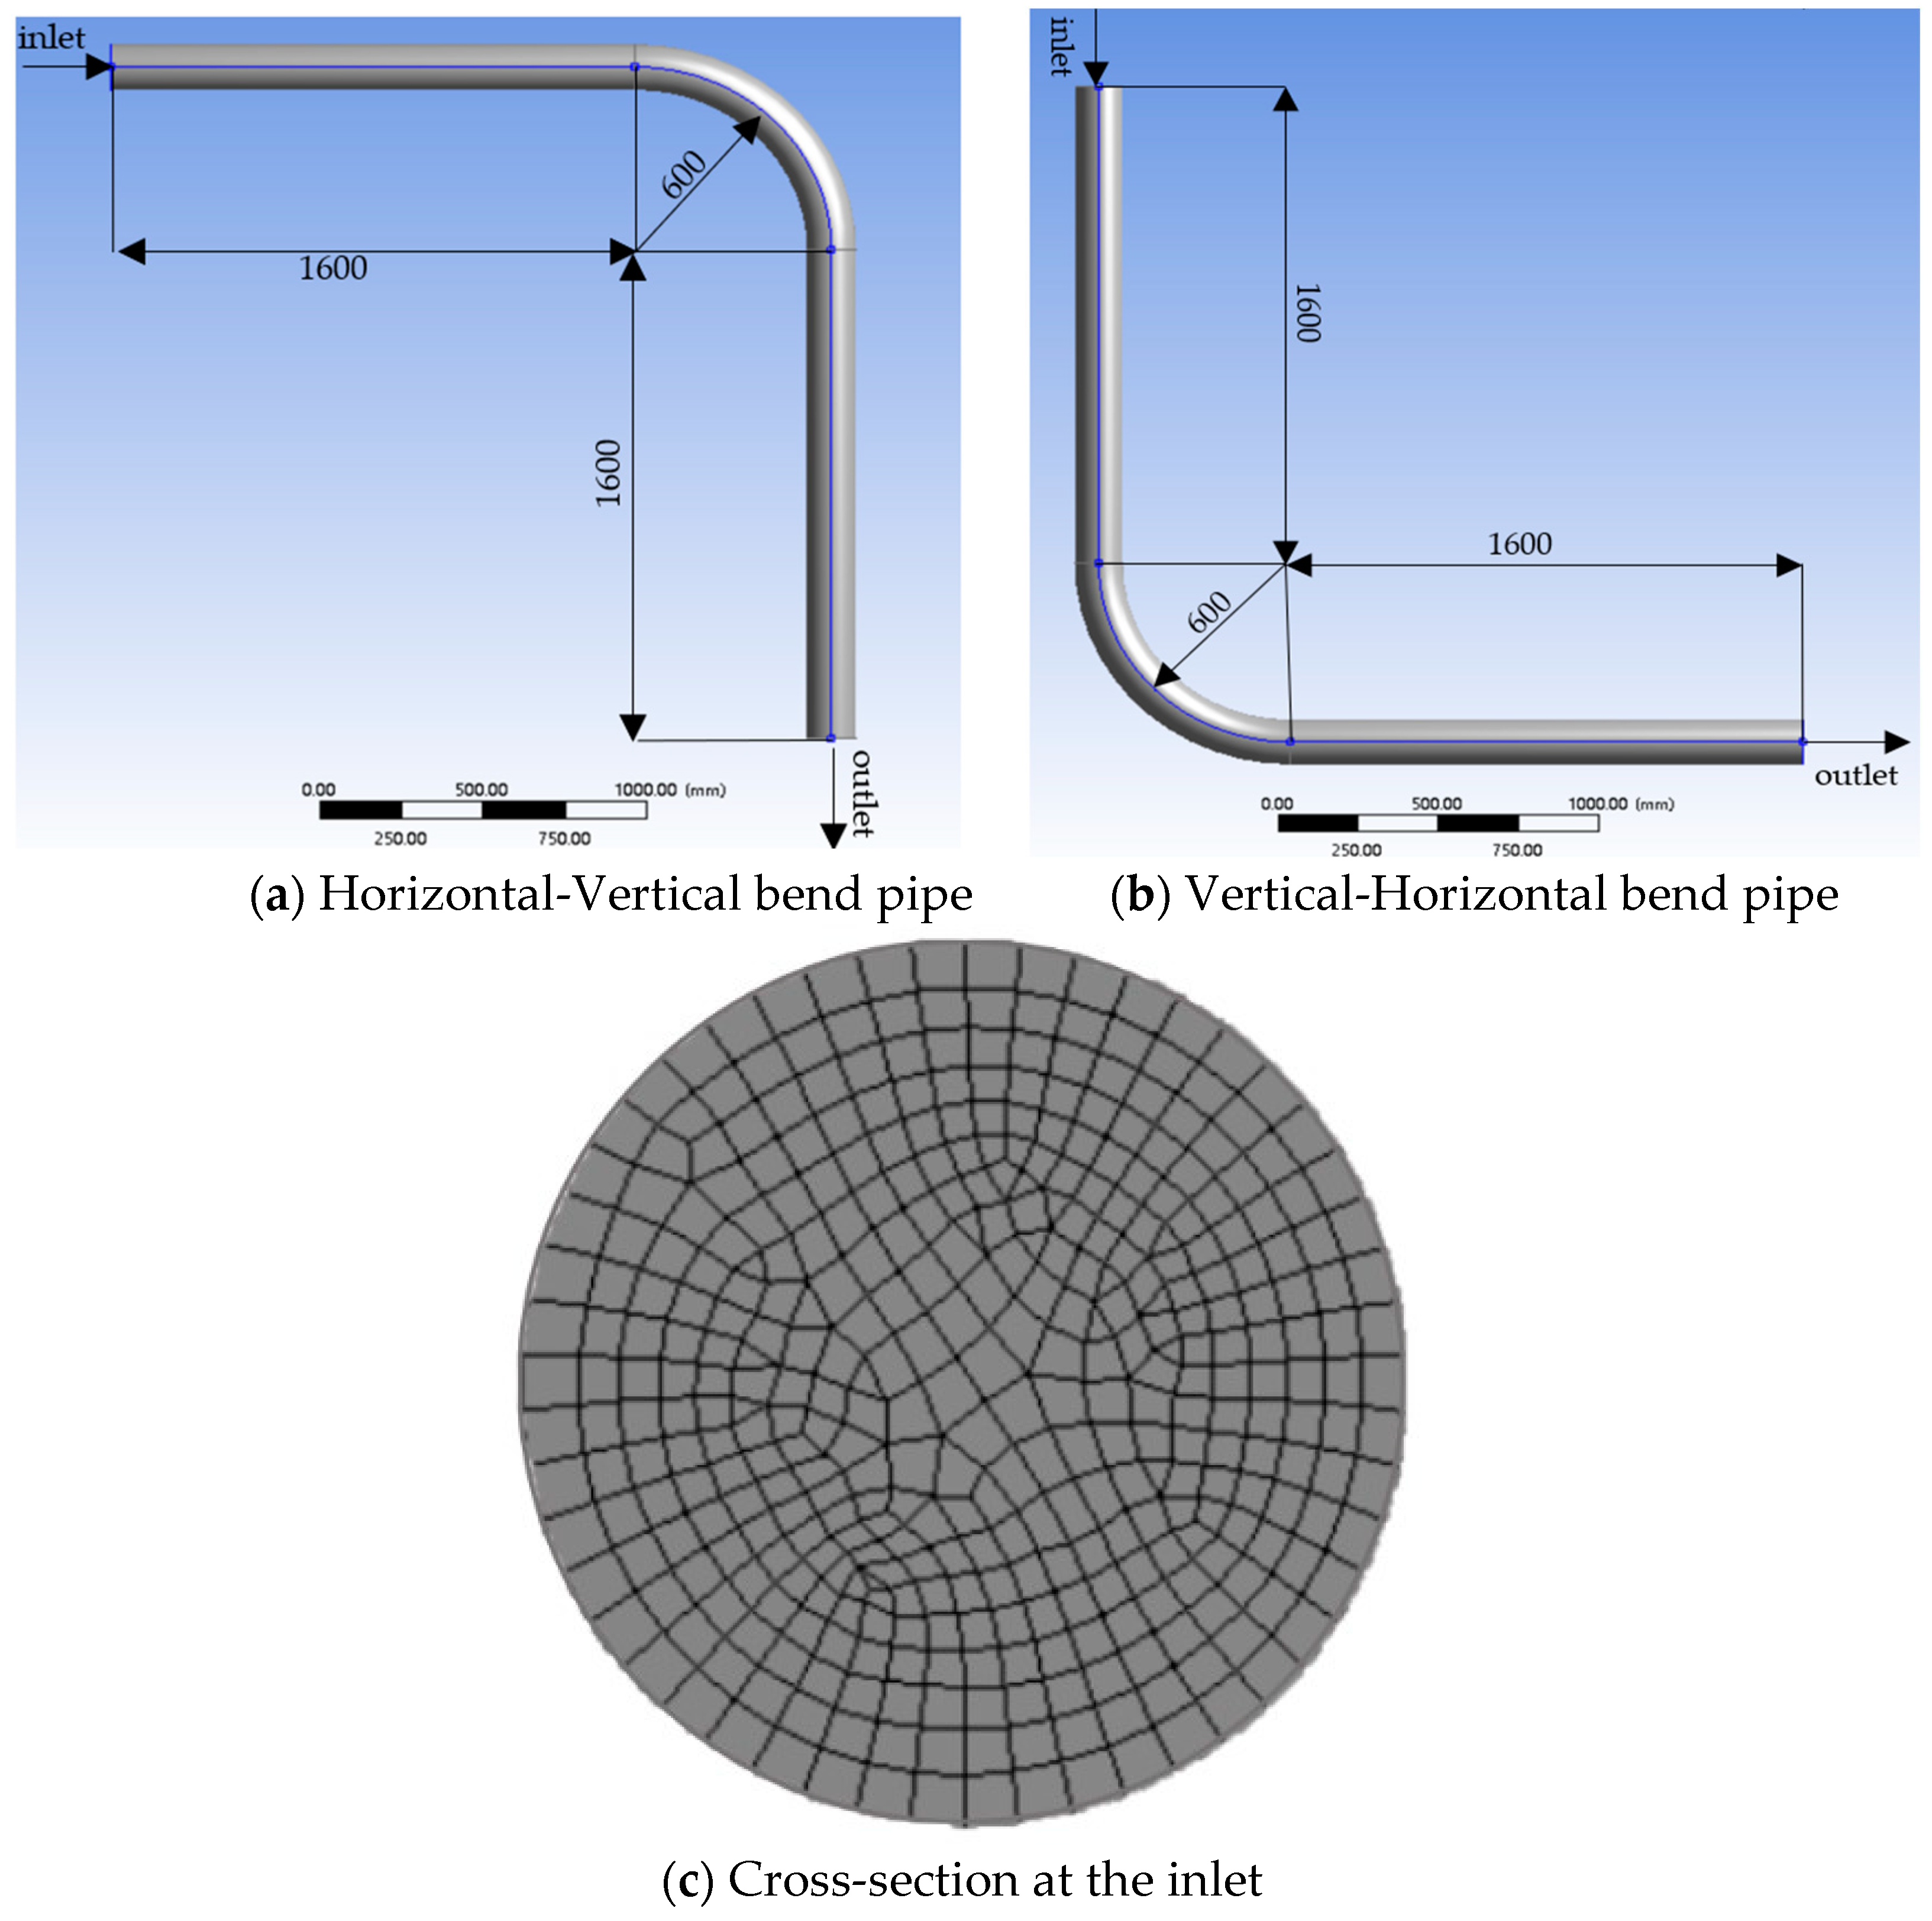
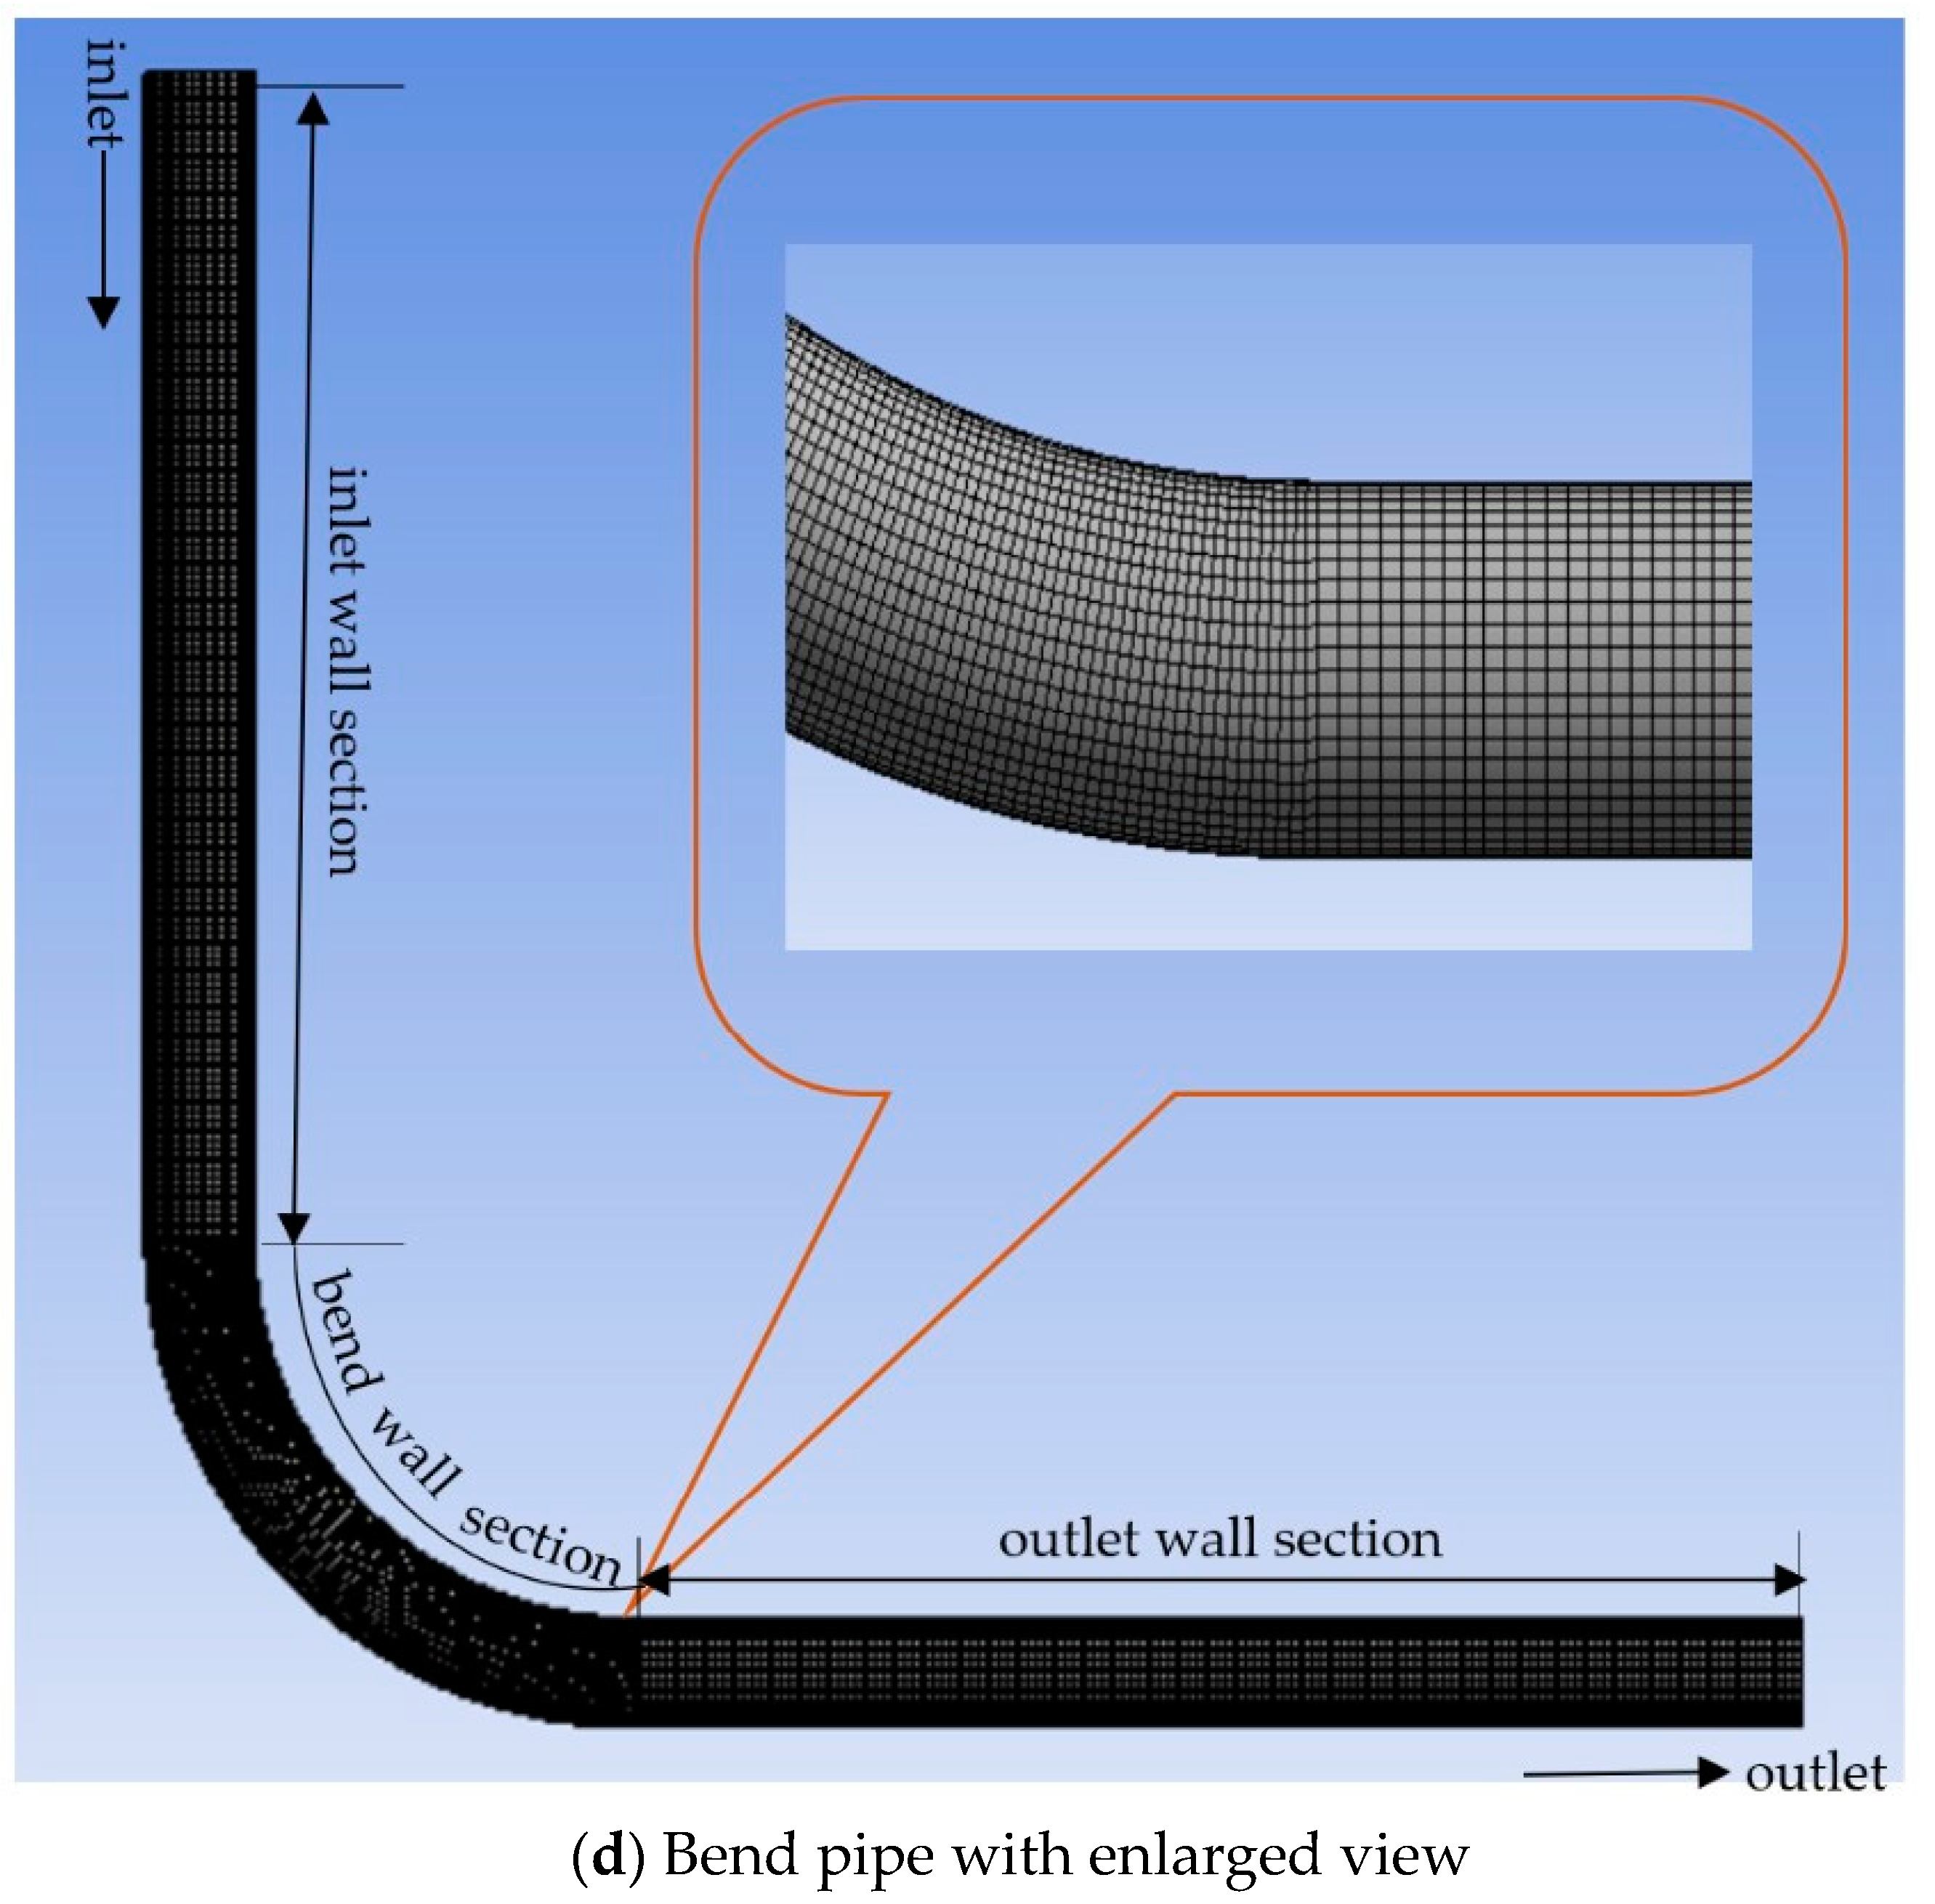
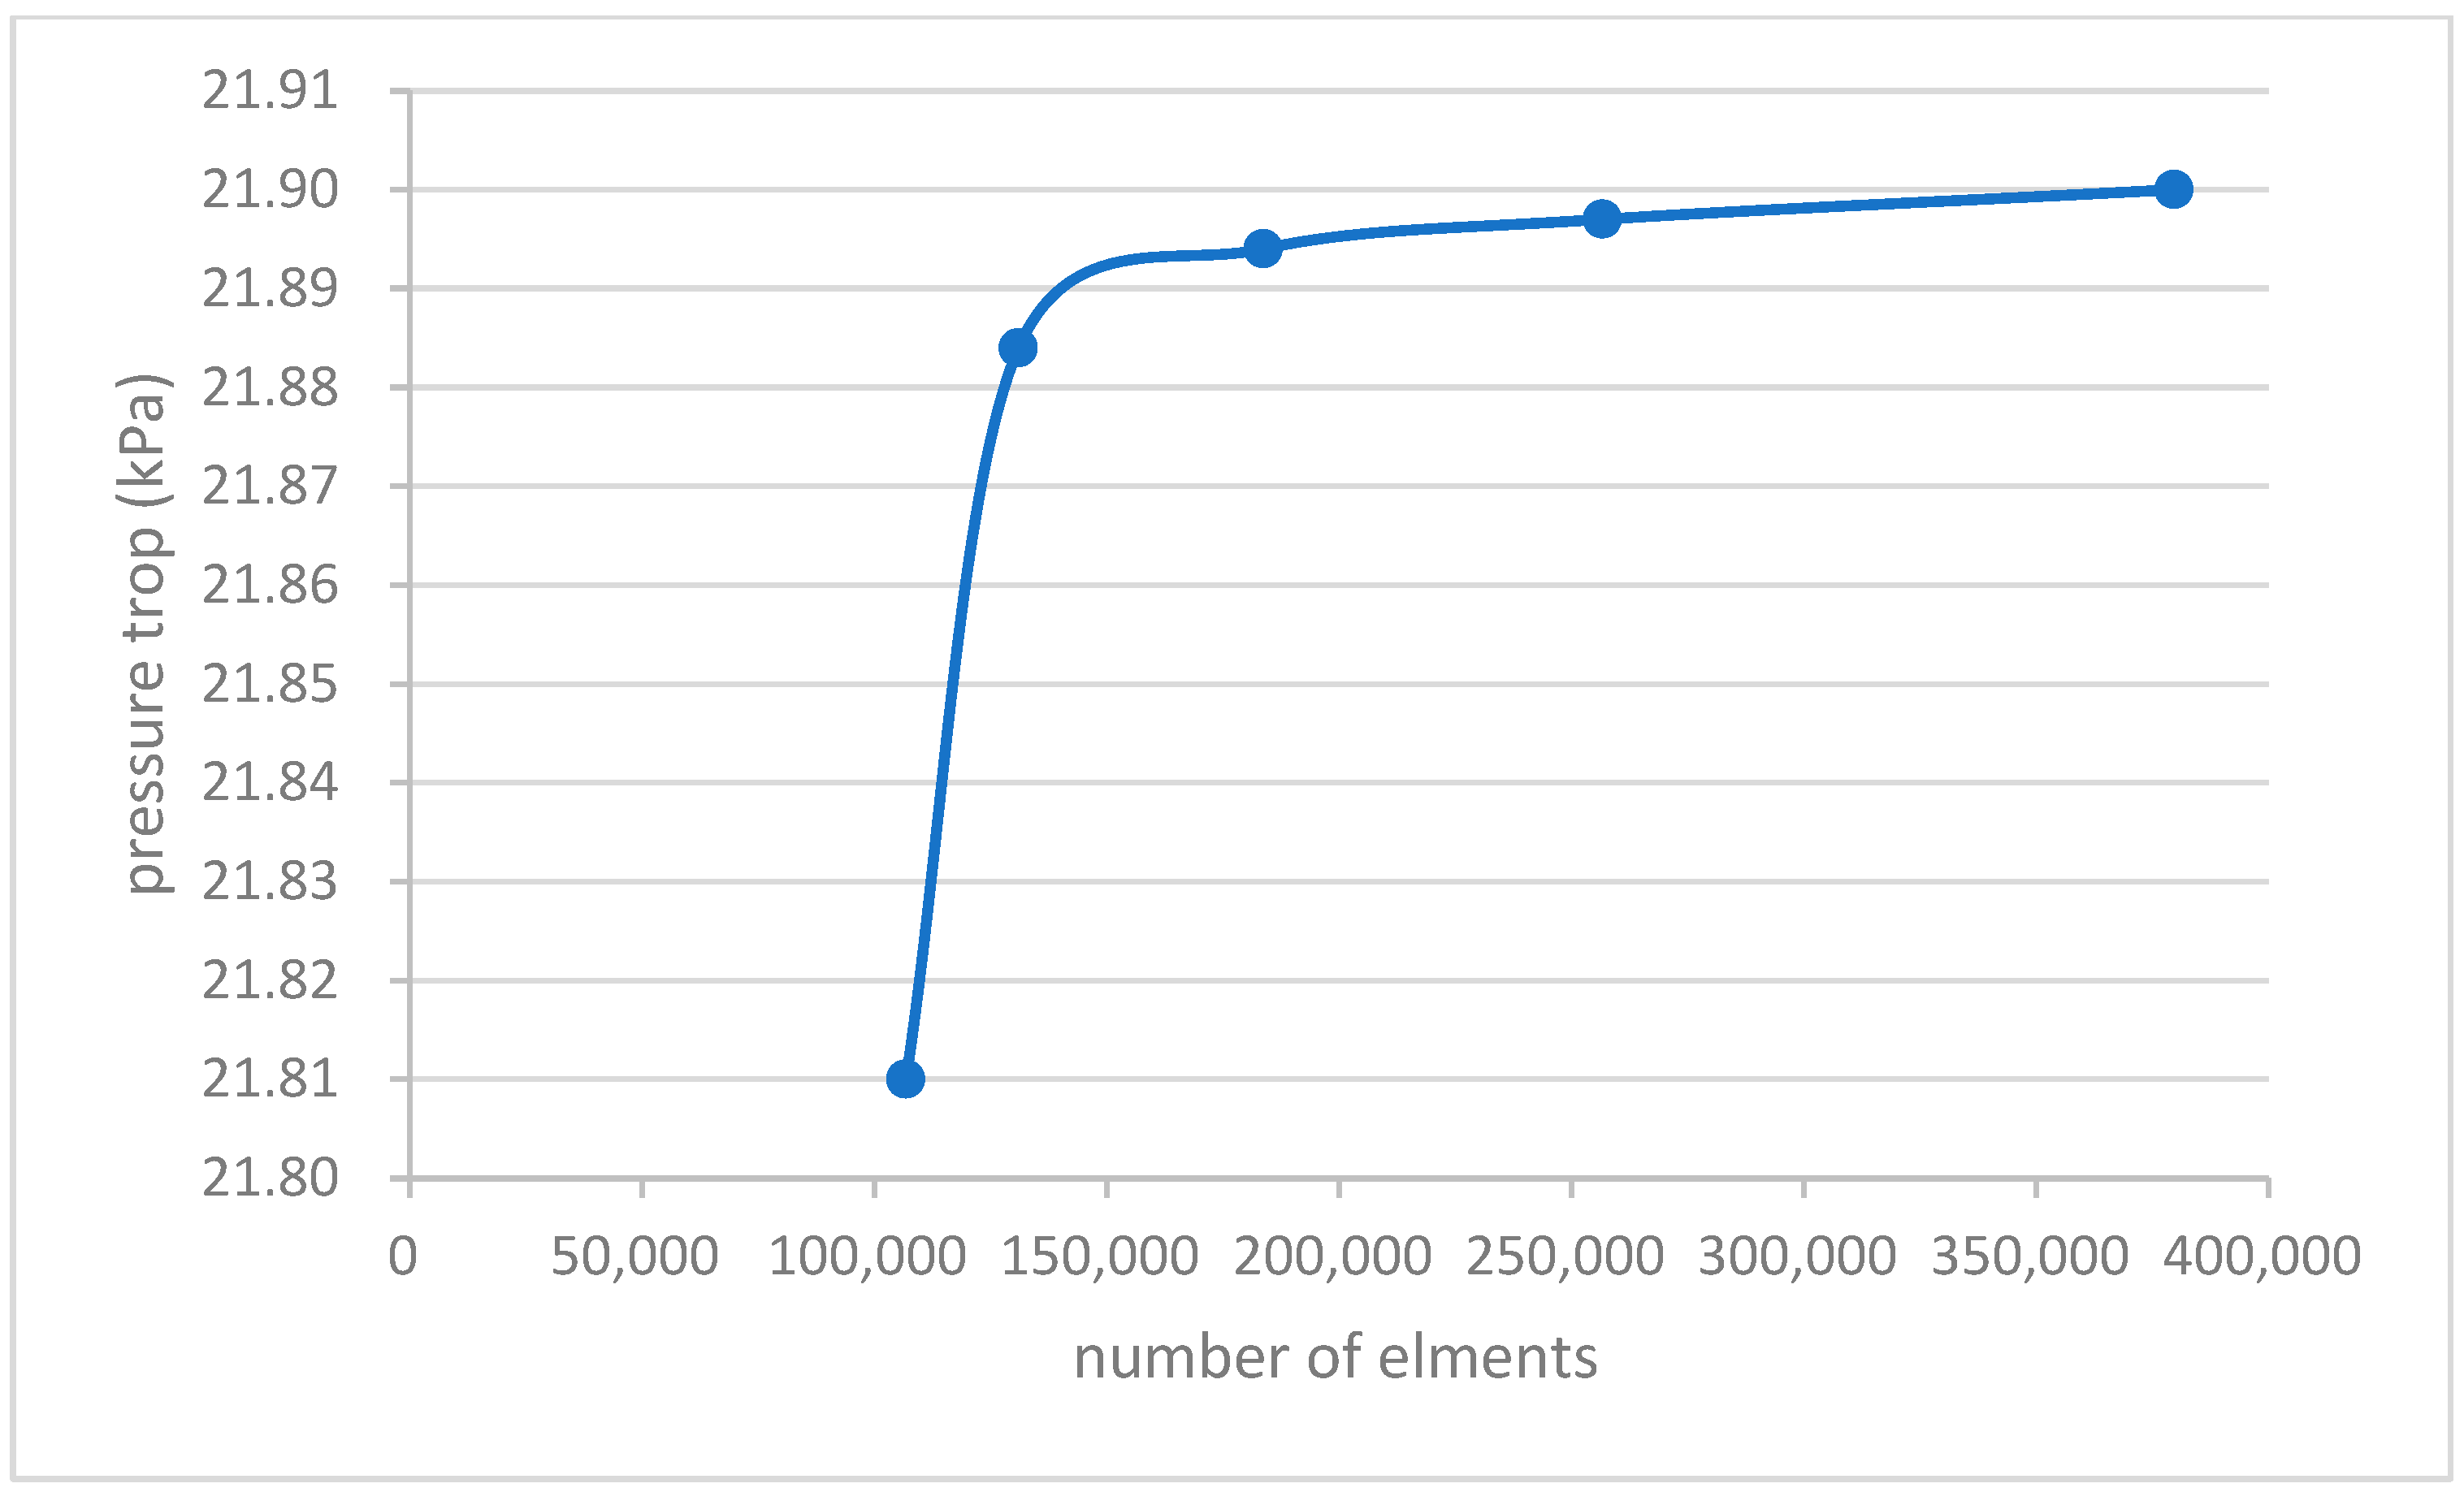
3.1. Geometry Model and Meshing

The simulation was performed in a 90° bend with an inner diameter (D) of 150 mm. According to the suggestion from the literature [24], L/D > 10 was adopted in the simulation to make sure that the high-concentration slurry developed fully in the straight pipe. The radius of curvature (R) is 600 mm according to most of the data selected for the backfilling pipeline. Figure 1a,b display the geometry of the two types of elbow pipes. The elbow is placed horizontally on the (X, Y) plane and (Y, Z) plane, and the flow direction of the inlet is set in the positive direction of X and the opposite direction of Y. Accordingly, the flow direction of the outlet is opposite to the direction of Y and positive direction of Z. A hexahedral structured mesh was used to divide the pipe wall and a boundary layer was set at the inlet/outlet with a growth rate of 1.2. Because the flow of slurry in the bend is more complex and changeable than that in the straight pipe, the bend is refined in the meshing process. Figure 1c,d show a cross-sectional view of the mesh at the inlet and the meshing of the bend pipe with an enlarged view.
In order to ensure the balance between calculation time and simulation accuracy, five different grid numbers, ranging from 100,000 (G1) to 380,000 (G5), were used to check the mesh independence. Through simulating transportation of CPB slurry in the pipeline at 1.6 m/s, the pressure drop between the inlet and outlet of the elbow under different grids was calculated. Figure 2 shows the deviation between the predicted pressure drop for different grids. As can be seen from the illustration, the pressure drop value tends to be stable without influencing by grid any more when the number of grids reaches more than 150,000. In other words, when the number of grids exceeds G3, the correlation between pressure loss of slurry in the pipeline and the number of grids gradually decreases with the increase of the number of grids. According to the above comprehensive analysis, we selected the mesh model with a grid number of 183,645 (G3) for subsequent steps.

3.2. Boundary Conditions and Solution Strategy

The running state of slurry was simulated as steady flow. The 3D pipe was defined with inlet, wall, and outlet. Inlet velocities were set as 1.2 m/s, 1.6 m/s, 2.0 m/s, 2.4 m/s, 2.8 m/s, and 3.2 m/s, which are commonly used in paste backfilling [25]. A mixture model was considered for this simulation, in which slurry mixed with fine particles and water was set as the primary phase, and coarse particles were set as the secondary phase with the 26% of initial volume fraction. In this model, the dynamic characteristics of coarse particles interspersed in other phases are considered to be dispersed [26]. All particle sizes in the dispersed phase in the mixture model were simplified into unified spherical size with no interaction between them [27]. Its application depends on the assumption that the density of each phase is constant and that the two phases have the same pressure field. Thus, coal gangue particles larger than 5 mm in CPB slurry were regarded as coarse particles (CP) with an average value of 10 mm. The remaining materials, including coal gangue less than 5 mm, fly ash, cement, and water, were regarded as fine-grained slurry (FGS), whose rheological properties are in accord with Bingham fluid [2,3]. According to the literature [28], the three-parameter Herschel–Bulkley model is better than the two-parameter Bingham model [29] at predicting the flow characteristics of the fluid. Therefore, the Herschel–Bulkley model was adopted for fine-grained slurry in this study. By calculating the Reynolds number, CPB slurry behaves as laminar flow, so laminar flow is used in this simulation process. Table 1 shows the detailed resolution strategy used during the simulation.

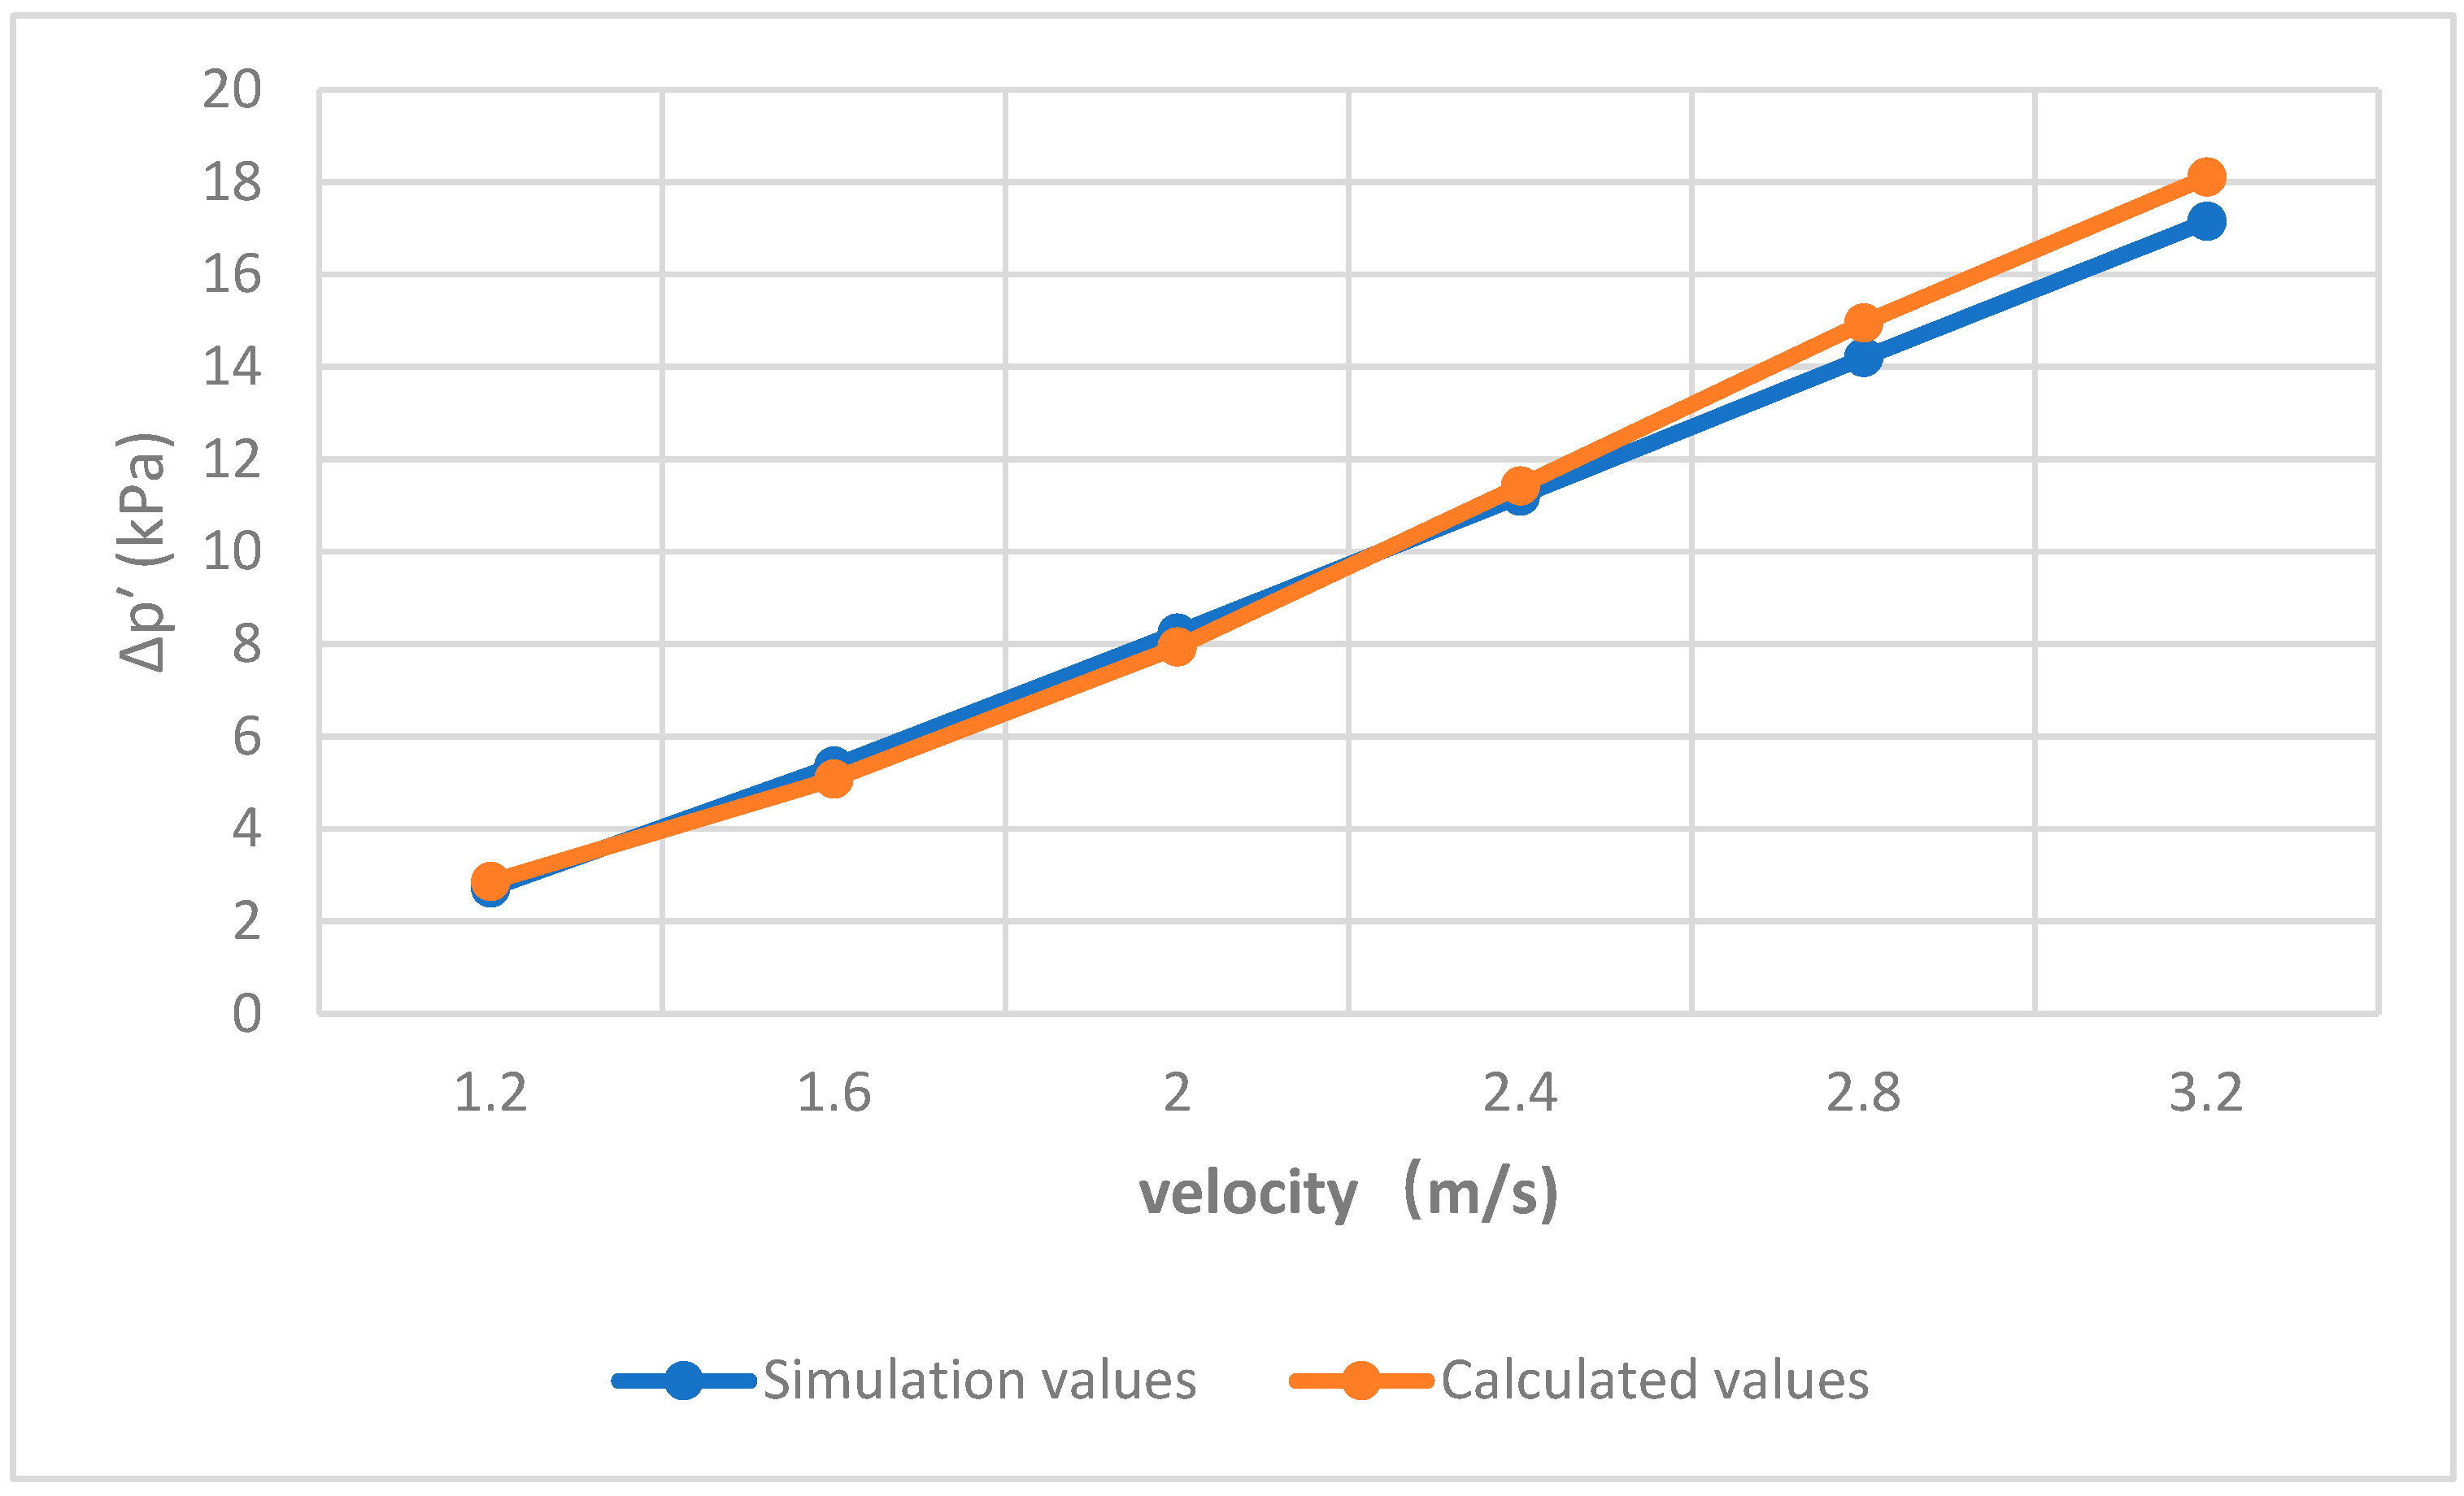
3.3. Model Validation

Pressure loss of slurry passing through elbow belongs to local pressure loss, which can be calculated using the following Formula (13):
Δ p L = ξ ρ v 2 2
where Δ p L is the local pressure loss, v is the average velocity, ρ is the density of slurry, whose value in the formula can be seen in Ref. [30].
As per the literature [31], in smooth transitional bends:
ξ = ξ θ 90
where ξ is the resistance coefficient of 90° elbow, which is related to the diameter of the pipe and the radius of curvature of the elbow, and its value is 0.13.
The pressure loss of the bend pipeline ( Δ p ) in horizontal–vertical pipeline is [32]:
Δ p = f × L × Δ p L
where L is the length of pipeline, f is the drag coefficient, which changes with the Reynold number [33].
Figure 3 illustrates the comparison of the results for all the six velocities of 1.2 m/s, 1.6 m/s, 2.0 m/s, 2.4 m/s, 2.8 m/s, and 3.2 m/s. From the graph, it can be observed that the predicted values of pressure loss show better agreement with the results calculated by equations. The maximum deviation between simulation and formula results is well within 5%.

4. Results and Discussion

4.1. Volume Fraction Distribution of CP

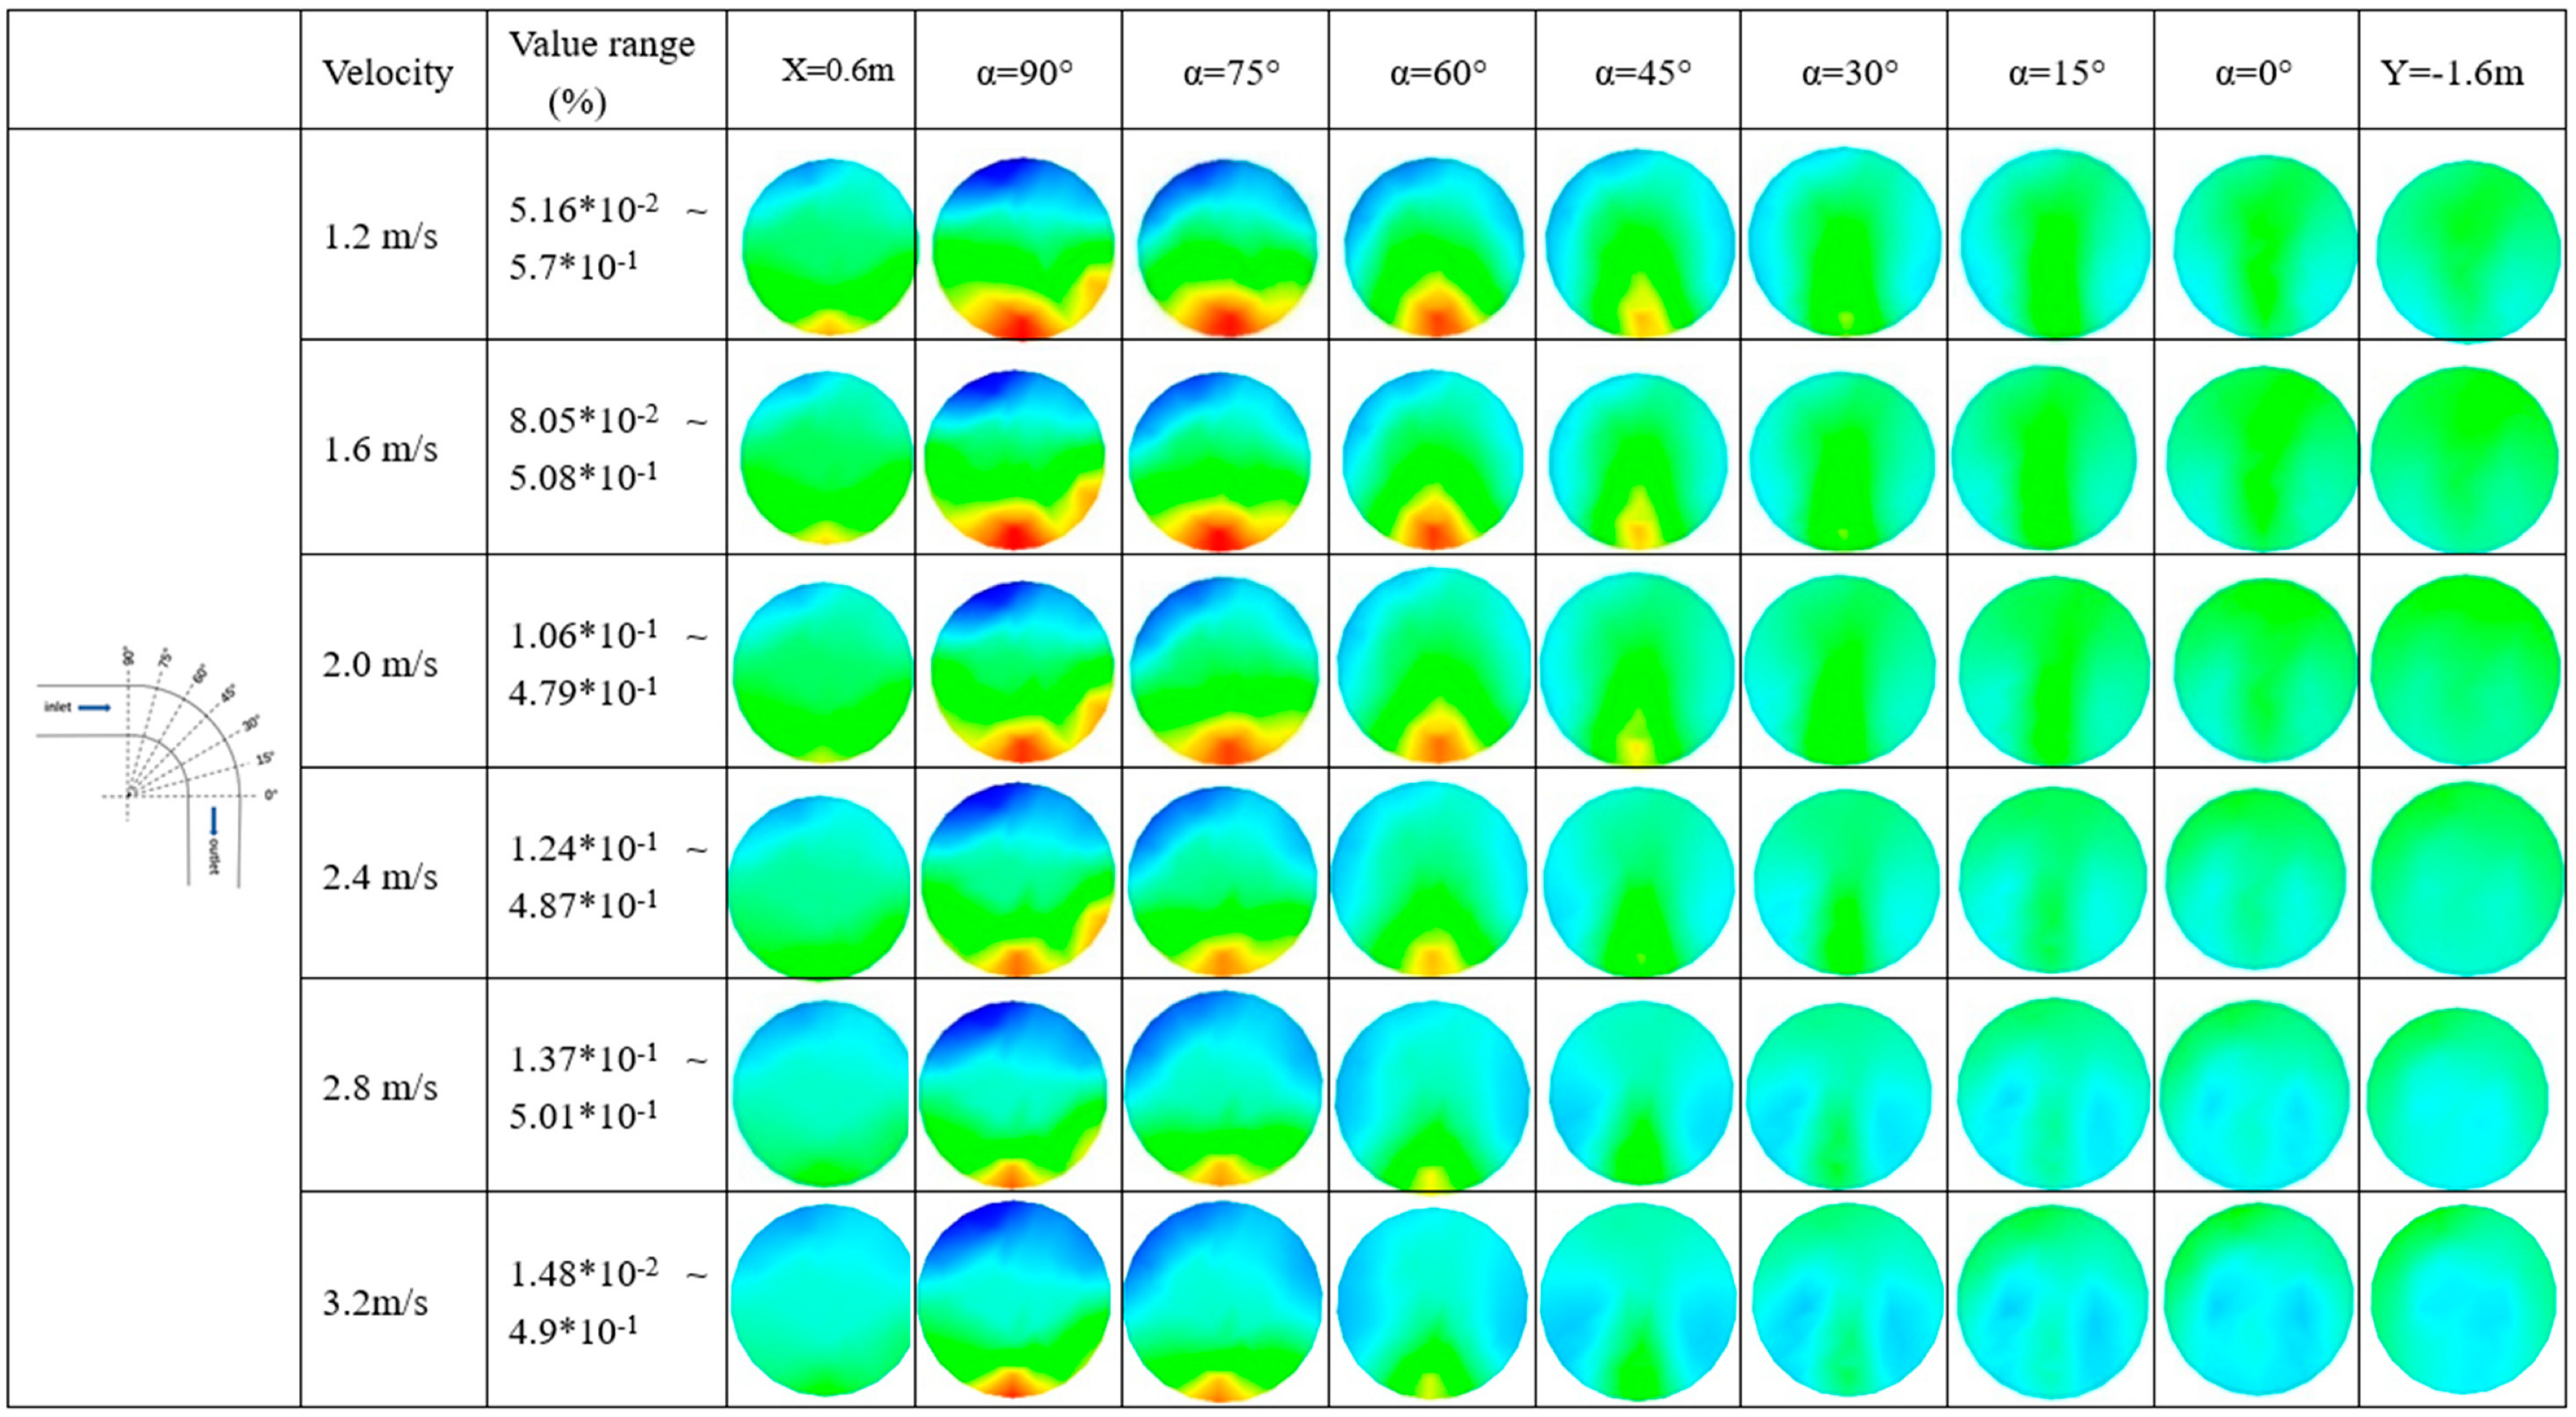
4.1.1. Volume Fraction Distribution of CP in Horizontal–Vertical Bend

As can be seen from Figure 4, under the six velocities, CP gradually began to precipitate after the uniform slurry was pumped into the pipeline for a certain distance (X = 0.6 m), which can be clearly seen at the position of X = 1.6 m (α = 90°). The CP volume fraction of slurry at different speeds presents an obvious distribution at the entrance of the elbow (α = 90° to α = 60°); the volume fraction of CP at the inner wall of the elbow is high, while it is low at the outer wall. In other words, in horizontal–vertical pipelines, the bottom of horizontal pipelines and the inner wall of the first half of the bend are more likely to be worn by coarse particles because of CP deposition. When passing through the bend outlet (α = 0°), CP gradually shifts to the lateral wall of the pipe. It can also be seen from the volume fraction distribution of the CP cross-section at different positions of horizontal–vertical bends at different speeds that the volume fraction of CP presents a trend of vortex circulation as the angle of the bends changes at a certain speed; the volume fraction of the inner wall of the elbow gradually decreases, while the volume fraction of the outer wall of the elbow gradually increases, ultimately resulting in dynamic change with obvious stratification of the volume fraction of CP at the entrance of the elbow (α = 90°) to a relatively uniform volume fraction distribution pattern at the exit of the elbow (α = 0°). The particles spread from the bottom of the pipe to the cross-section of the whole pipe, which means that the particles have a large transverse velocity [34]. The reasons for this phenomenon are mainly ascribable to the change of flow direction for slurry in horizontal–vertical pipe flow. The flow track of the slurry will follow the change of direction of the tube wall. The velocity direction of the slurry located at the outer wall of the pipe changes first, and the velocity is dispersed in different directions owing to the confinement of the pipe wall, which leads to the decrease of the velocity of the slurry located on the outer wall of the pipe. By this time, the velocity direction of slurry at the inner wall of the pipe does not change. The above process results in the transfer phenomenon that relatively high concentrations of CP located at the inner wall bent pipe shift to the lateral bend until the volume fraction of CP at the inner and outer walls are evenly distributed.
Owing to the change in velocity, the location and volume fraction of CP precipitation at the inlet of the pipeline are also different. At V = 1.2 m/s, CP deposition can be clearly observed at 0.6 m from the inlet, but this phenomenon is not obvious at the velocity of 2.4 m/s and above. In addition, we can also observe that the volume fraction of CP in the upper part of the pipeline does not change much at different velocities. Therefore, with the increase of velocity, CP is mainly distributed in the middle and bottom of the pipeline cross section at the entrance of the pipeline. It can also be seen from α = 90° (at X = 1.6 m) that the volume fraction of CP at the bottom of the pipeline tends to decrease with the increase of velocity. The above behavior can be interpreted as the velocity increasing the overall motion state of CPB slurry, which weakens the sinking speed of CP and makes more CP wrapped in the slurry toward the front of the pipeline. Moreover, the volume fraction of CP at the same bend angle (α) changes gradually with increasing velocity. Taking 75° and 60° as an example, the volume fraction of CP in the inner wall of the elbow gradually decreases with the increase of velocity. This phenomenon can be explained as follows: the increase in speed speeds up the CP’s motion, thus facilitating its circulation around the bend, allowing more CP to be suspended in the pipe. From the cross-section figure of α = 0°, it can be clearly observed that with the increase of flow rate, the slurry at the outlet of the pipeline becomes more uniform.

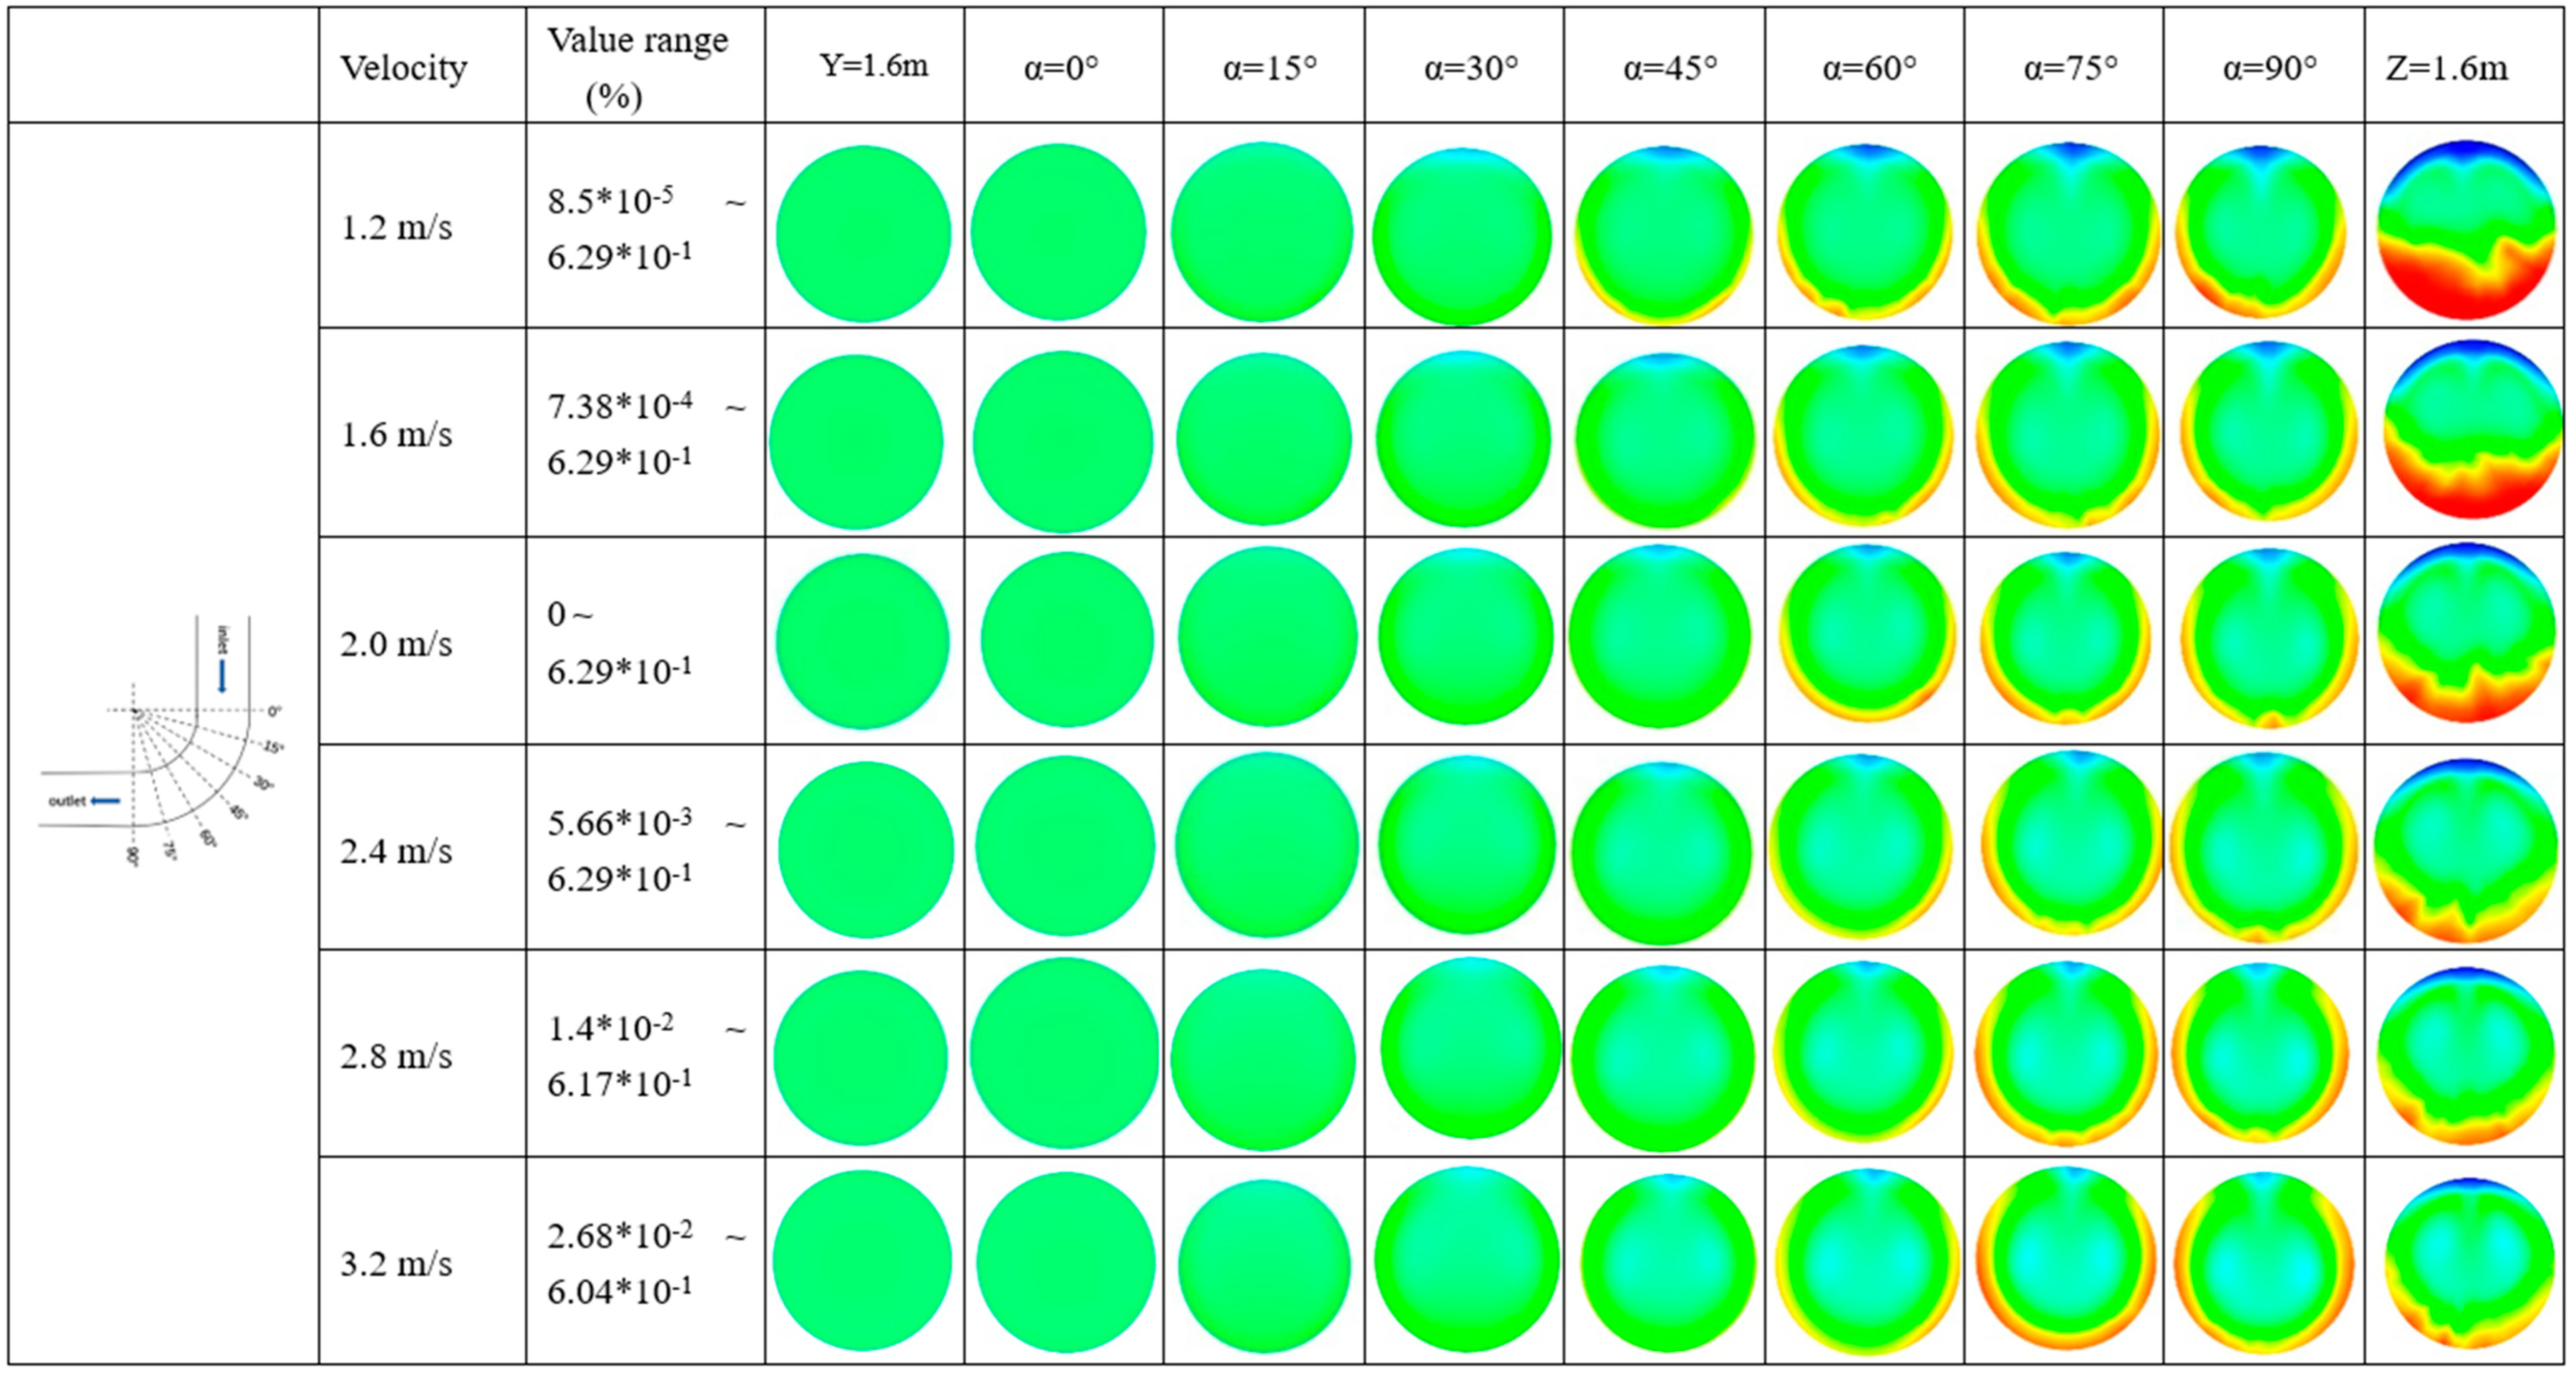
4.1.2. Volume Fraction Distribution of CP in Vertical–Horizontal Bend

When CPB slurry is transported in vertical–horizontal pipelines, the overall uniformity of the CP distribution of slurry remains good owing to the gravity acceleration in the vertical pipeline, which can be observed through the position at the pipe entrance (Y = 1.6 m) and the bend entrance (α = 0°), as shown in Figure 5. CP gradually precipitates toward the outer wall of the pipe when it passes through the bend section. At first, CP with low volume fraction appeared in the inner wall of the elbow (α = 45°), and then it continued to precipitate to form a clearly observable precipitation layer on the outer wall of the elbow (α = 75°). Likewise, when the slurry passes through the bend section, it can be observed that CP forms a vortex movement that diffuses to both sides of the wall surface and is gradually deposited to the bottom. When the slurry transitions from vertical pipe to horizontal pipe, CP begins to precipitate to the bottom of the pipe as the slurry flow becomes gradually smooth. Correspondingly, the CP region with low volume fraction appears in the upper part of the pipeline. These phenomena can be readily observed at the position of Z = 1.6 m with the low velocities from V = 1.2 m/s to V = 2 m/s. In other words, the acceleration of gravity plays a negative role in the horizontal tube, accelerating the downward movement trend of CP.
After the operation state of CP in the whole vertical–horizontal pipeline is explained, the changes of CP in the pipeline at different speeds will be described. In a vertical pipeline, the change of velocity has little influence on CP distribution. This may be attributable to the uniform distribution of CPB slurry at the beginning of operation. At this point, the CPB slurry can be considered as a whole because of good wrapping of fine-particle slurry to CP. Apparently, the increase in velocity slowed CP precipitation in the first half of the bend (α = 0° to α = 45°). However, when the slurry passes through the latter half of the bend (α = 60° to α = 90°), the deposition of CP to the outer wall of the pipe increases with the increase of the velocity, which is especially observable at α = 75°. As can be seen from the figure, the low volume fraction area of CP near the inner wall of the elbow gradually decreases with the increase of velocity, but the deposition area of CP on the outer wall of the elbow increases. In other words, the increase in velocity accelerates the circulation of CP in the bend, causing more CP to shift toward the pipe wall. The above verification can also be obtained from the gradual decrease of CP volume fraction in the elbow center with the increase of velocity. It can also be inferred from the above observation that in the vertical horizontal conveying pipeline, the outer wall position at the rear part of the elbow is more vulnerable to CP impact and results in pipeline wear. When it comes to the horizontal position, the phenomenon is the same as that of the horizontal position in the horizontal–vertical pipeline. With the transportation of slurry in the horizontal pipe, more and more CP is deposited at the bottom of the pipeline. This deposition can be improved with the increase of speed, but it is also necessary to guard against particle wear at the bottom of the horizontal pipe.

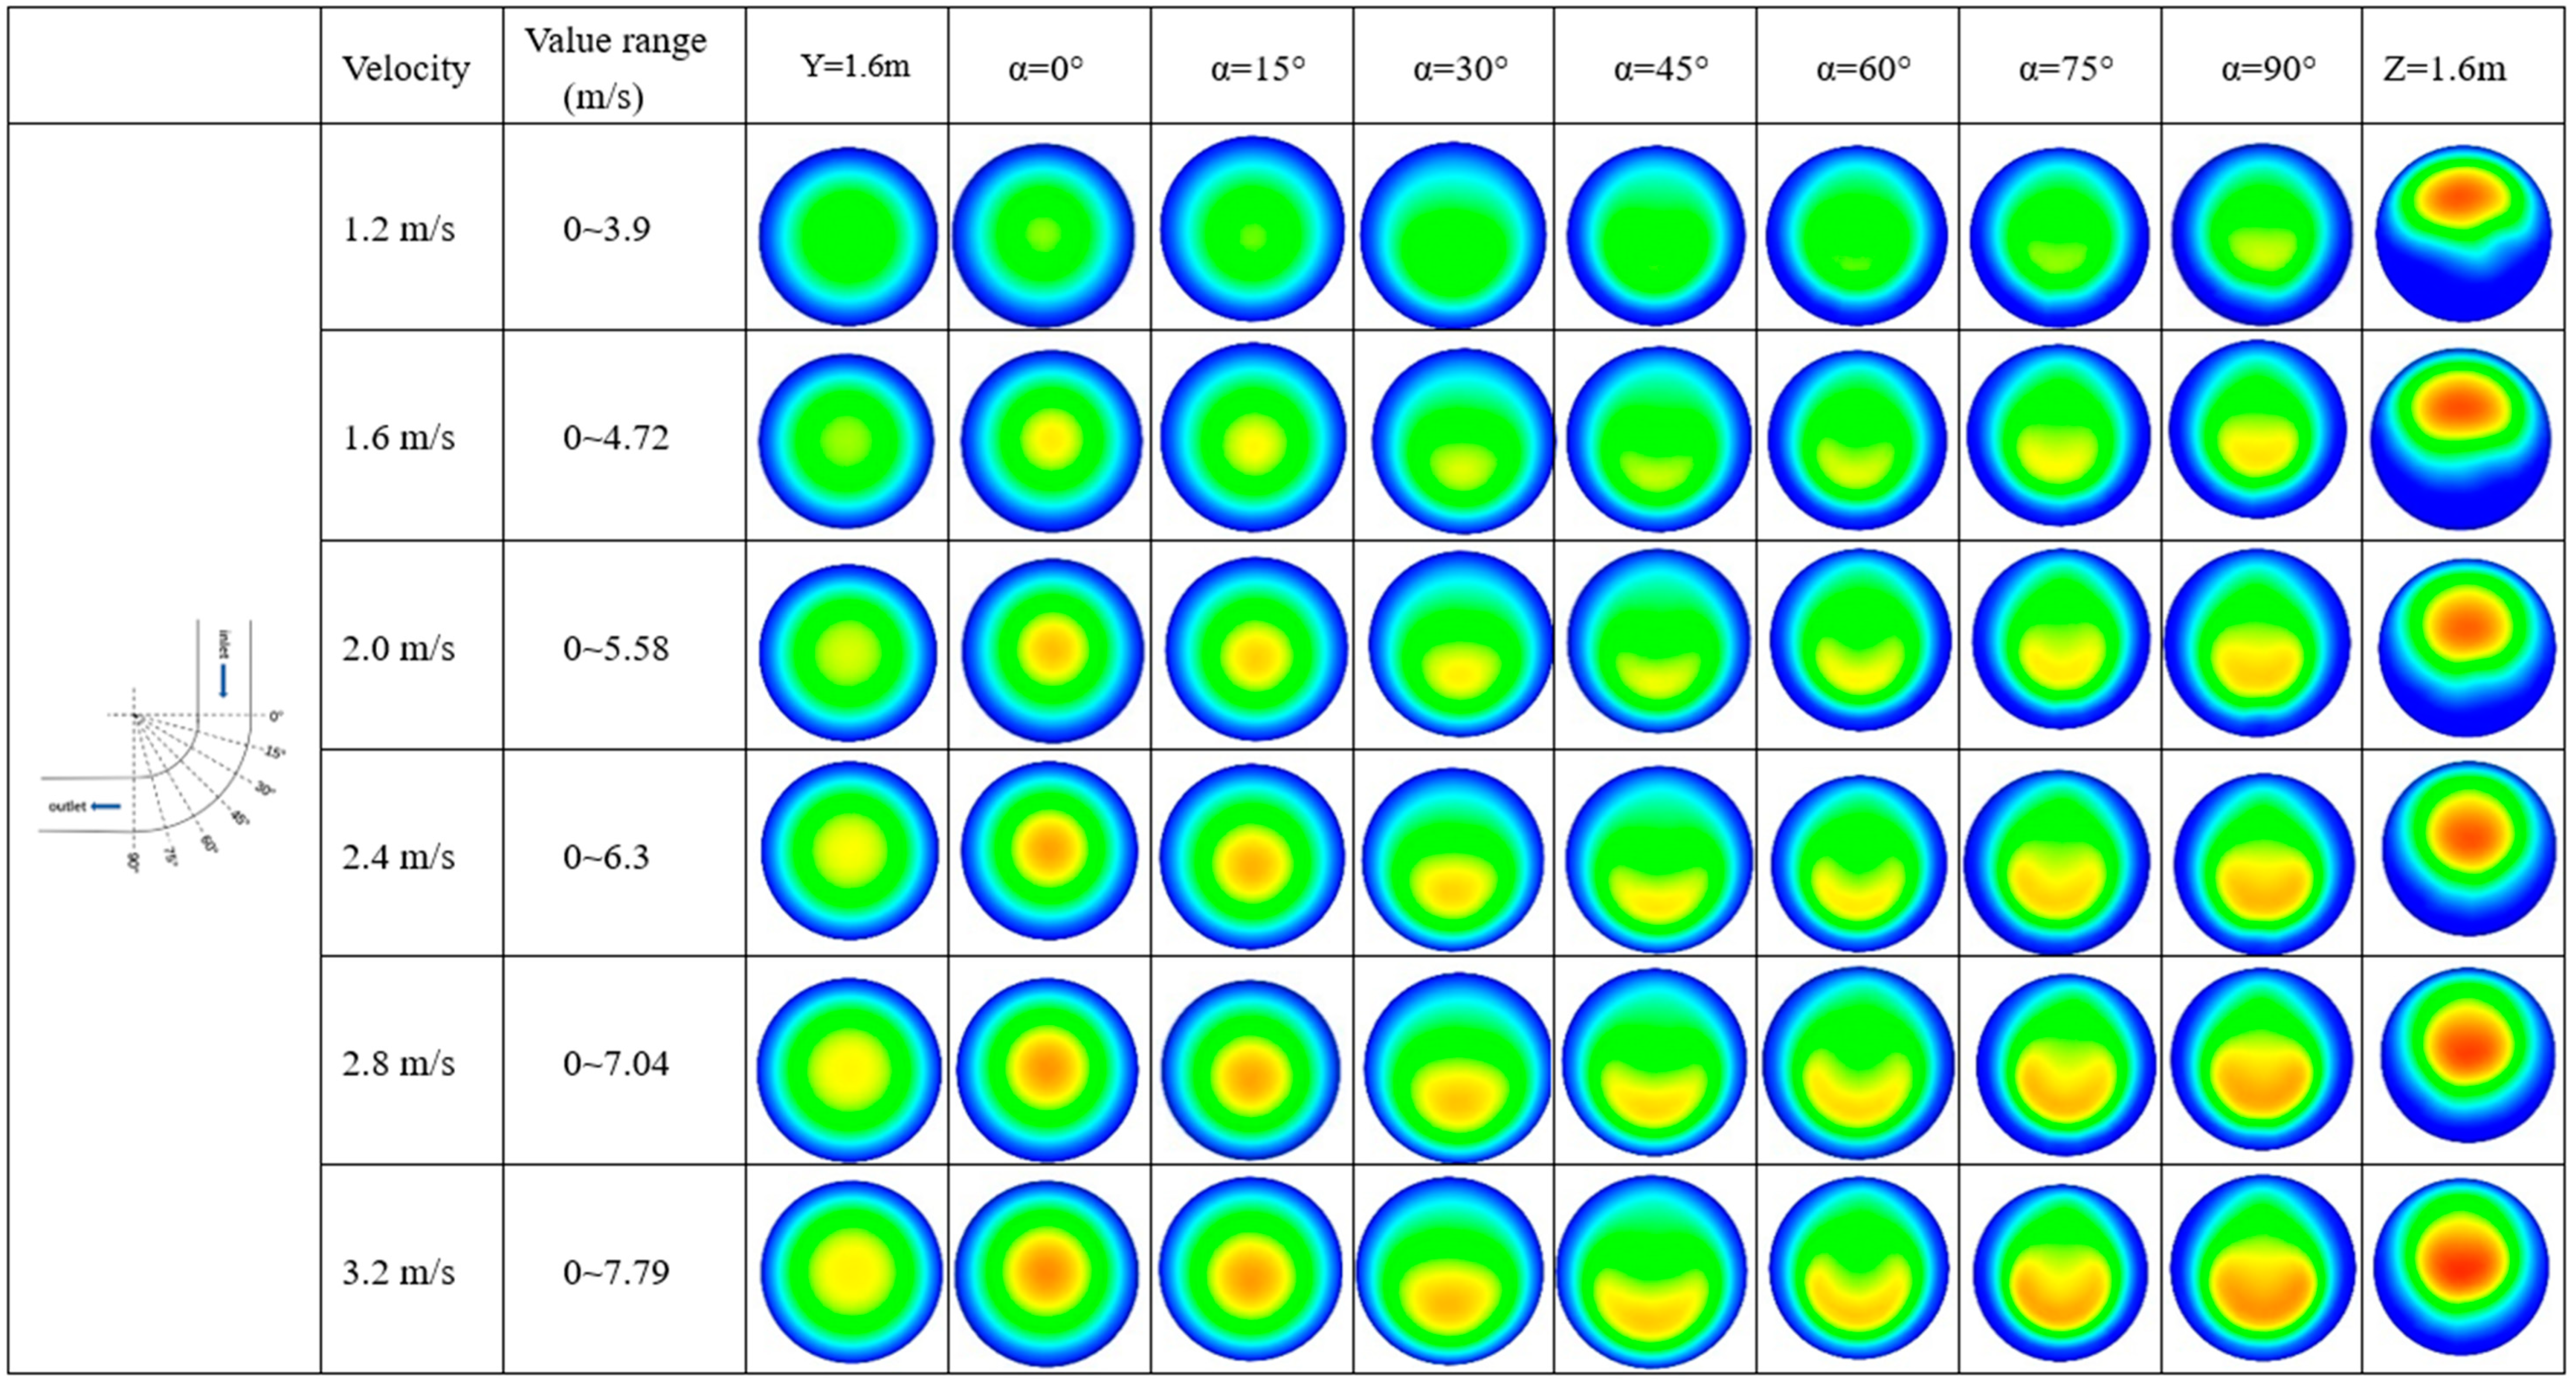
4.2. Velocity Distribution

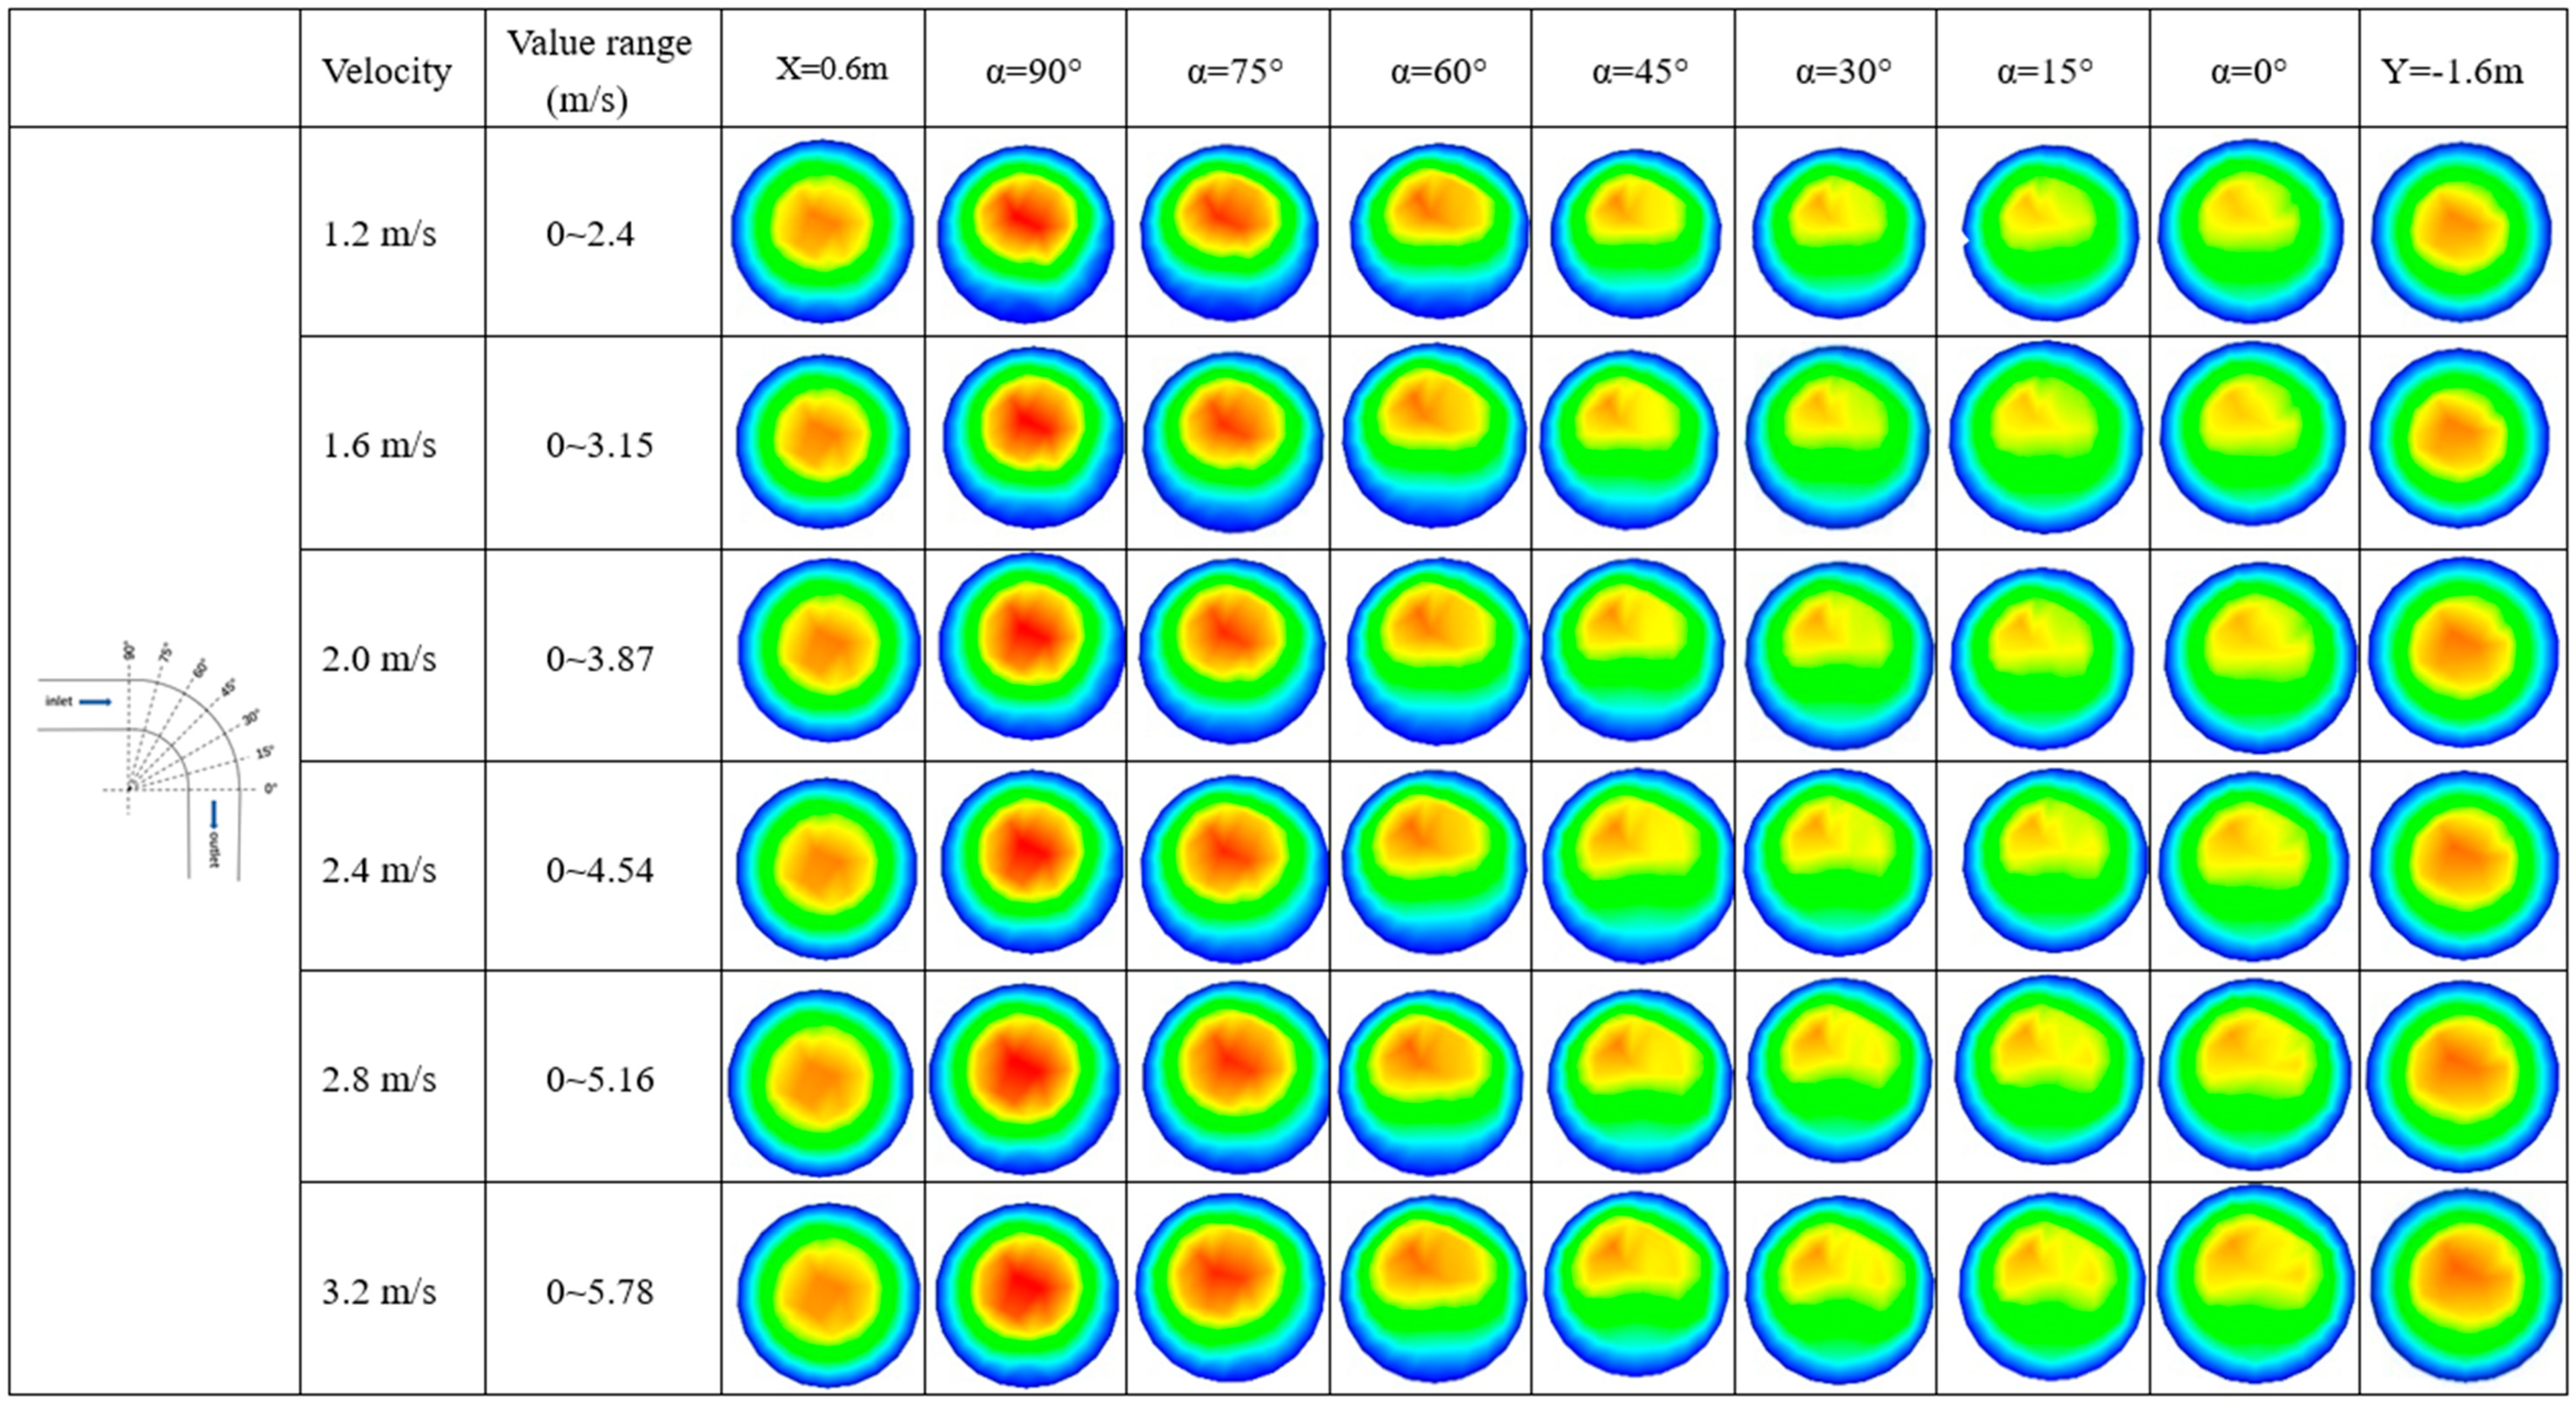
4.2.1. Velocity Distribution of CPB Slurry in Horizontal–Vertical Bend Pipe

It can be seen from the Figure 6 that, at initial velocities, the velocity distribution of CPB slurry at cross-section presents a symmetric distribution when it just entered the horizontal pipeline (x = 0.6 m); the velocity value decreases from the center to the periphery, which is similar to previous studies on the flow state of CPB slurry in the horizontal pipeline. When the slurry reaches the inlet of elbow x = 1.6 m (α = 90°) following the horizontal pipe, there is a difference in the cross-sectional of velocity distribution. When the velocity is lower, such as V = 1.2 m/s, the cross-sectional velocity distribution of slurry is no longer symmetrically distributed. The maximum velocity value originally located in the center is shifted upward, and more areas of low-velocity zone or even the velocity stagnation zone appear at the bottom of the pipeline. This is because at low velocity, CP particle gravity is greater than external resistance, resulting in settlement, which changes the overall structure of slurry. More fine particles float in the middle and upper layers of the pipe, and more coarse particles precipitate at the bottom of the pipe. This deviation continues to intensify through the bend pipe section at α = 75° and α = 60°. However, when arriving at α = 45° and α = 30°, the low-speed area of the inner wall of the pipe begins to decrease until the outer surface is uniform. This process of movement can also be explained by the change of velocity direction of CPB slurry and CP in the bend described in the previous section, as shown in Figure 7 for the specific change of speed direction. After the eddy movement in the bend is over, the velocity gradually returns to the standard pipe “plunger flow” state, such as Y = 1.6 m.
Next, CPB slurry states were compared at different flow rates. At the initial flow, the flow state CPB slurry is basically the same at different velocities, as can be seen from the pictures at x = 0.6 m without any conspicuous difference. The velocity distribution of the cross-section was basically consistent. However, when CPB slurry reaches the position of X = 1.6 m (α = 90°), discrepancy gradually emerged in the cross-section velocity distribution of the slurry owing to velocity difference. With the increase of velocity, the velocity distribution at this position gradually changes from the velocity offset state indicated by V = 1.2 m/s to the ideal “plunger flow” state indicated by 3.2 m/s. Obviously, the increase in velocity reduced the velocity of the CP settling to the bottom of the pipe and promoted the overall uniform flow of CPB slurry. Furthermore, the increased velocity also speeds up the recovery of CPB slurry after passing through the bend pipe. As shown in Figure 6, Y = −0.6 m (α = 0°), the central velocity distribution of CPB slurry at this position showed a faster recovery degree with the increase of velocity. More notably, with increasing velocity, the CPB slurry has a significantly larger area of higher speed at the center of the cross section near the exit (y = −1.6 m) than at the entrance (x = 0.6 m). In other words, the velocity promotes the motion of the CPB slurry after the bend pipe, which has not been observed in previous studies and literature, which may be caused by the gravity of the vertical pipe, while this phenomenon is not apparent at low speeds.

4.2.2. Velocity Distribution of CPB Slurry in Vertical–Horizontal Bend Pipe

Just as CP is evenly distributed in the vertical pipe, CPB slurry keeps a good “plunger flow” flow state in the vertical pipe (see Figure 8). As CPB slurry passes through the elbow, the high-velocity zone in the center displays a shift toward the outer wall of the elbow. In addition, the maximum velocity of slurry passing through the elbow is smaller than that of straight pipe. For example, when the velocity is 2 m/s, α = 0° is the critical surface of straight pipe and bend pipe, the maximum velocity of CPB slurry at the center of the cross section is 4.47 m/s. When α = 15°, the maximum cross-sectional velocity is 3.91 m/s. It can be considered that the bend changed the flow direction of CPB slurry and slowed down the flow velocity of CPB slurry. As the slurry flows out of the elbow, the high-velocity area begins to expand gradually, and the maximum velocity also begins to increase. Moreover, as with the velocity trace in the horizontal–vertical bend, the velocity direction of slurry in the vertical–horizontal bend will also be cycled due to the change of the bend direction. The slurry outside the vertical pipe first impinges on the outer wall of the elbow and then whirls toward the inner wall of the elbow. Finally, it is of concern that as CPB slurry flows through the horizontal pipe, the high-velocity area that was located just below the center of the pipe begins to shift from the upper part of the pipe, which is directly related to the deposition of CP in the horizontal pipe. Furthermore, when the slurry flows in the horizontal pipe, its maximum velocity near the outlet (Z = 1.6 m) is significantly higher than that near the inlet (Y = 1.6 m) in the vertical pipe. The reason may be that CP has been partially deposited at the bottom of the horizontal pipe near the outlet, and the reduction of CP in the upper part of the slurry reduces the friction resistance caused by coarse particles in the upper slurry, making the flow smoother.
The cross-section diagram of vertical pipe velocity (Y = 1.6 m) illustrates that the high-velocity area located in the center of the pipe will expand with the increase of velocity. The high-velocity zone in the center will expand more and more as the CPB slurry moves down following the vertical pipe. The velocity cross-sections of the elbow and horizontal pipe also reveal the influence of inlet velocity on the velocity distribution of slurry in the pipe. When the inlet flow rate reaches 3.2 m/s, the CPB slurry returns to the standard “plunger flow” condition more quickly in the horizontal pipe.

4.3. Pressure Loss in Different Pipe Shape

Studying slurry pressure loss in a pipeline is an essential step in the filling system. By studying the pressure loss, the operation of slurry in different pipelines can be directly fed back so as to optimize the initial pumping power of the pipelines. Table 2 shows the pressure loss of CPB slurry in two types of pipe shapes and bend sections at different flow rates.

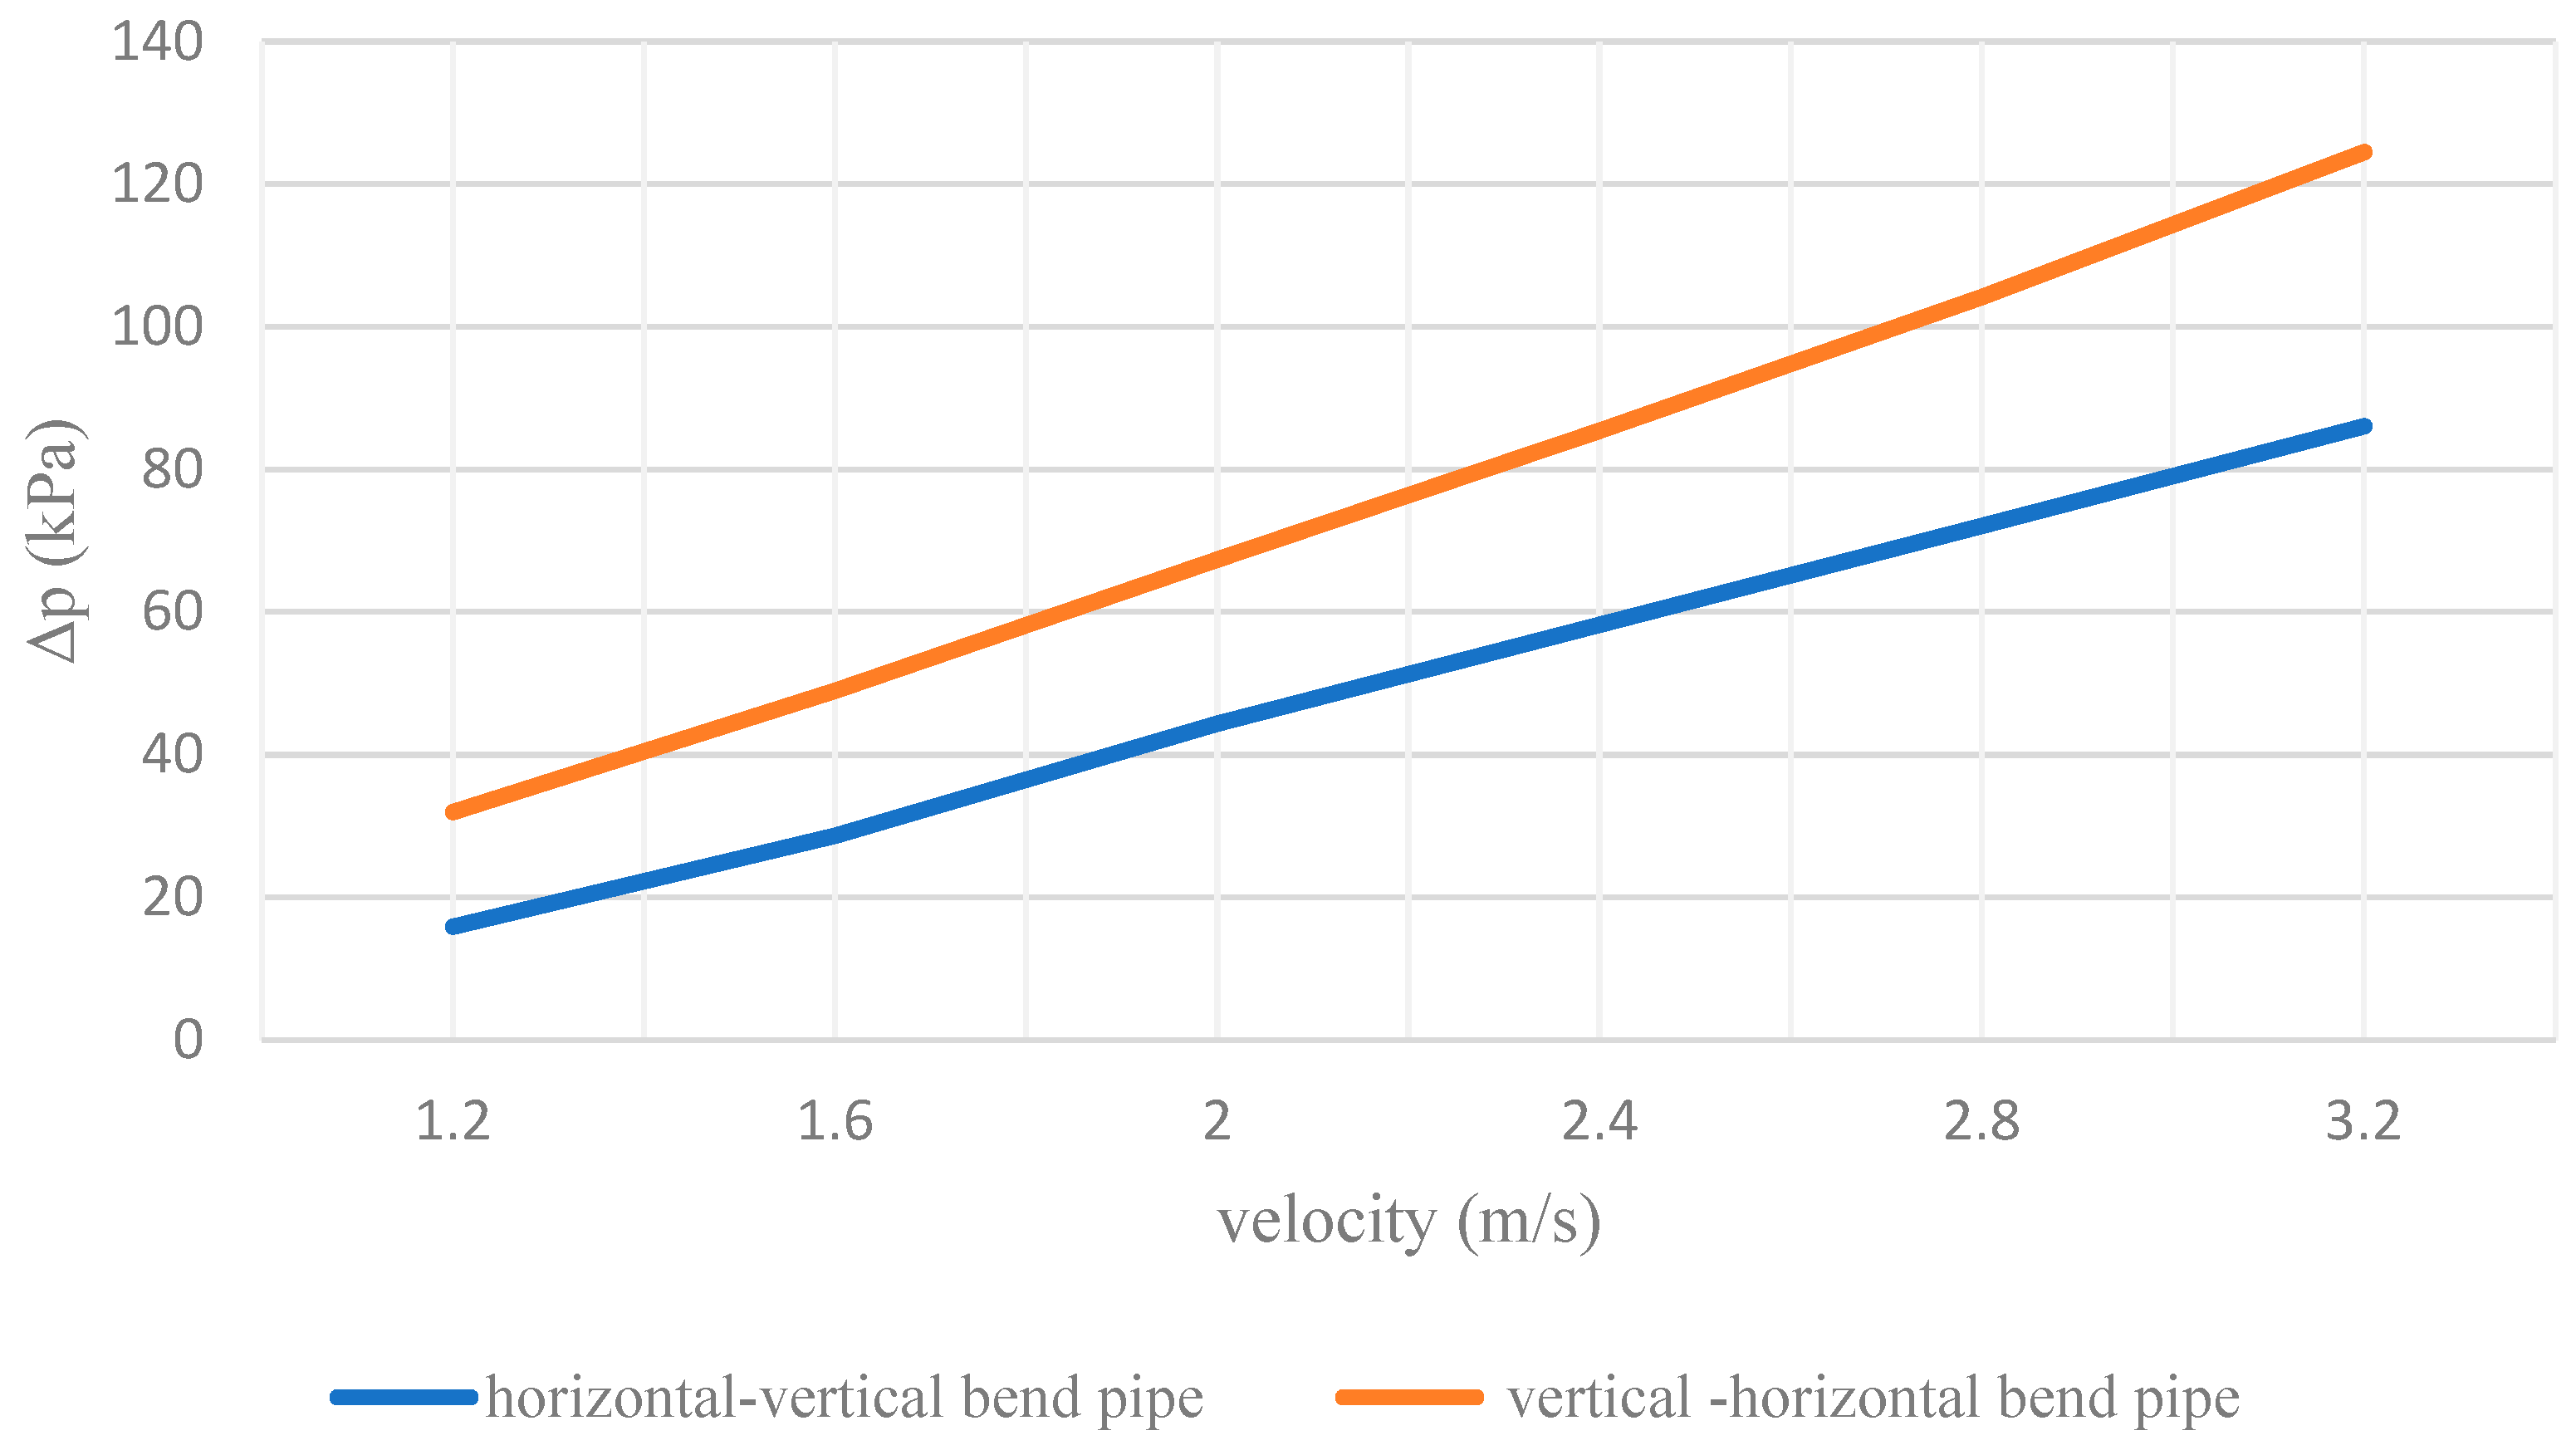
4.3.1. Pressure Loss of Bend Pipe

After generating the chart of the pressure loss value, it was found that the pressure loss in the pipeline increases linearly with the increase of speed, which is consistent with the literature [2,3]. Accordingly, velocity has a very important influence on the slurry pressure loss in the pipeline. The pressure loss of CPB slurry in the two pipe types at different flow rates was compared, as shown in Figure 9. The pressure loss of CPB slurry in vertical–horizontal bends is always greater than that in horizontal–vertical bends, and the gap gradually widens with the increase of velocity from 16.08 kPa at 1.2 m/s to 38.435 kPa at 3.2 m/s. Thus, CPB slurry undergoes more state changes in vertical–horizontal bends. The main reason for such a difference is that when the slurry flows in the vertical pipe which needs to overcome the work done by gravity, so that part of kinetic energy is converted into potential energy, resulting in the decrease of velocity. This change can also be observed in the comparison between Figure 7 and Figure 8. This decrease in velocity affects subsequent slurry transport, increasing settlement of the particle in the bend and horizontal section, resulting in increased pressure loss throughout the pipeline.

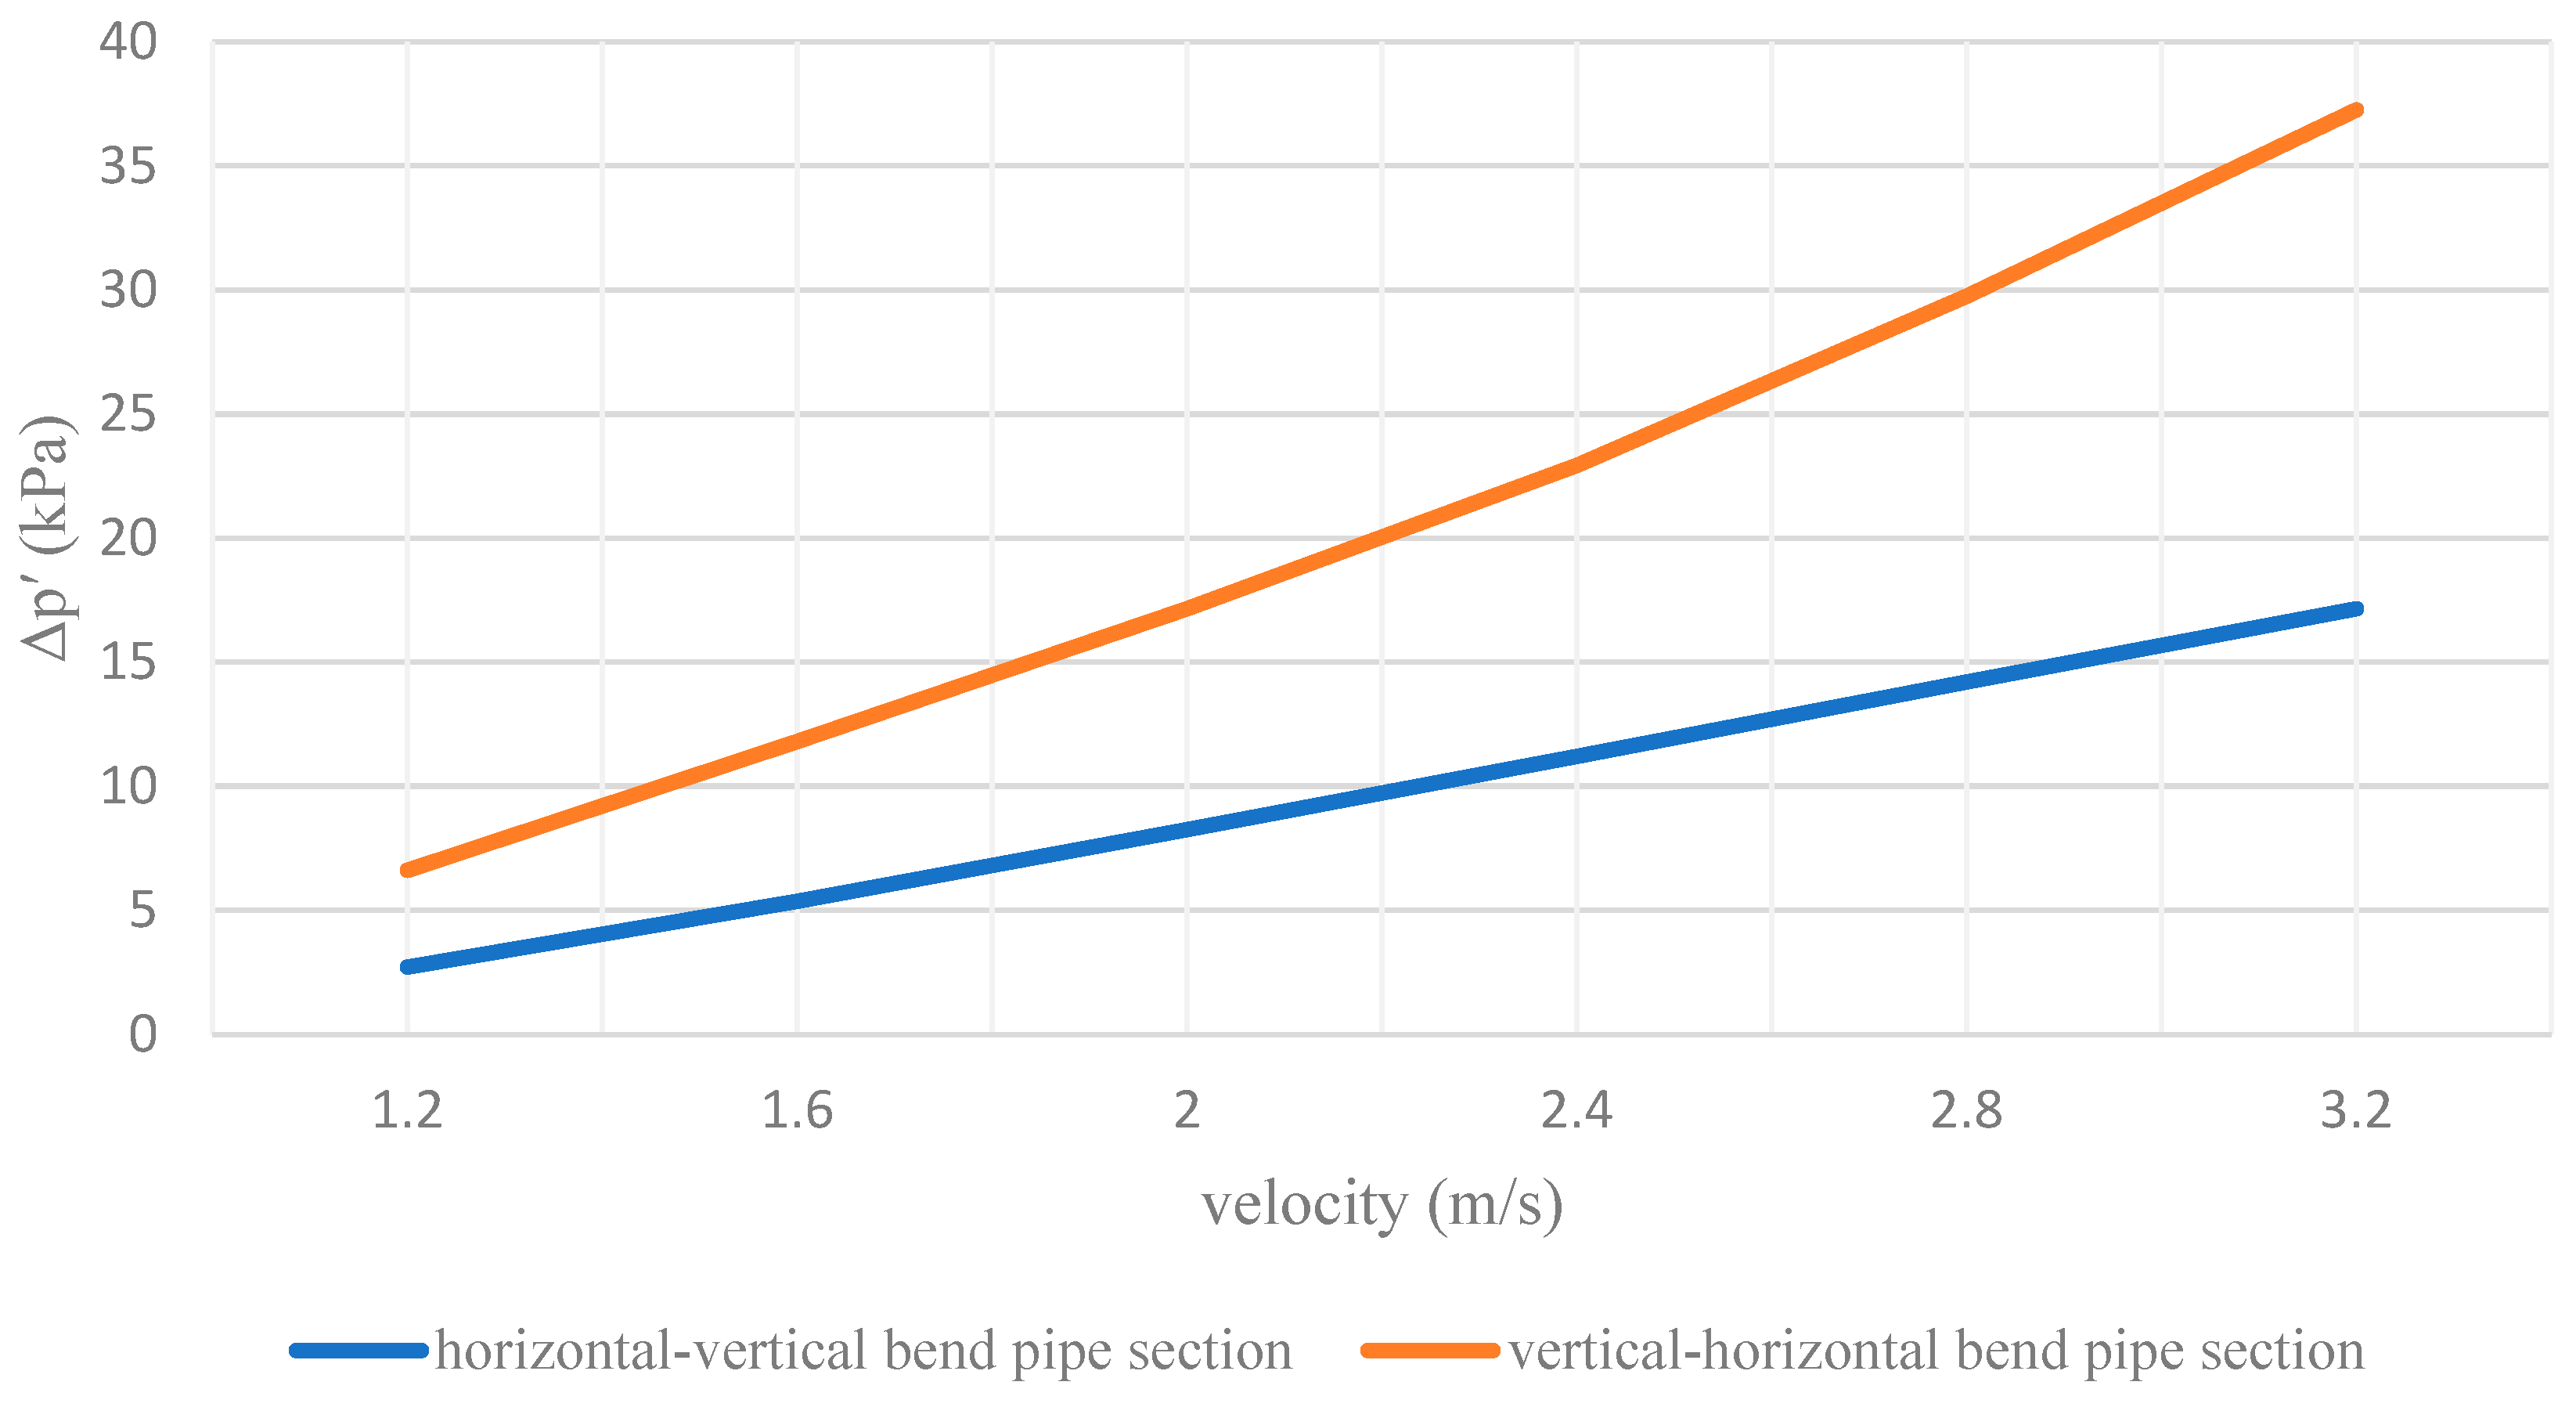
4.3.2. Pressure Loss of Bend Pipe Section

Compared with the pressure loss of the whole pipe (Δp), the pressure losses (Δp′) of the horizontal–vertical bend pipe section (shown in Figure 10) accounted for 17.1% and of the vertical-horizontal bend pipe section accounted for 20.7% at the velocity of 1.2 m/s. With the increase of velocity, the proportion of pressure loss in the bend section increases gradually. At the speed of 3.2 m/s, they accounted for 19.9% and 29.9%, respectively. It is noteworthy that the pressure loss in the horizontal–vertical bend section increased by 2.8%, and that in the vertical–horizontal bend section increased by 9.2%, as the speed increased from 1.2 m/s to 3.2 m/s. In other words, with the increase of velocity, the pressure loss of CPB slurry in the vertical–horizontal bend pipe section showed a trend of sharp increase compared with that in the horizontal–vertical bend pipe section. As can be seen from the above comparison, the vertical–horizontal bend section may consume more energy. It can be seen from Figure 4 and Figure 5 that at the same speed, the slurry tends to be uniform after passing through the bend in the horizontal-vertical pipe, while in the vertical-horizontal bend, particle precipitation appears in the bend part. This phenomenon makes the pressure loss in the bend part of the latter larger than that of the former. Moreover, particle precipitation causes more particles to come into contact at the elbow, which is exacerbated by the increase in velocity, resulting in a sharp increase in pressure loss at this stage.

5. Conclusions

By numerical simulation of CPB slurry transportation in two kinds of pipelines, the volume fraction distribution of coarse particles in CPB slurry and the cross-sectional velocity distribution of CPB slurry in different pipelines was studied. In the end, the pressure loss of CPB slurry and the pressure loss of the elbow in different pipelines were compared. The following conclusions can be drawn:
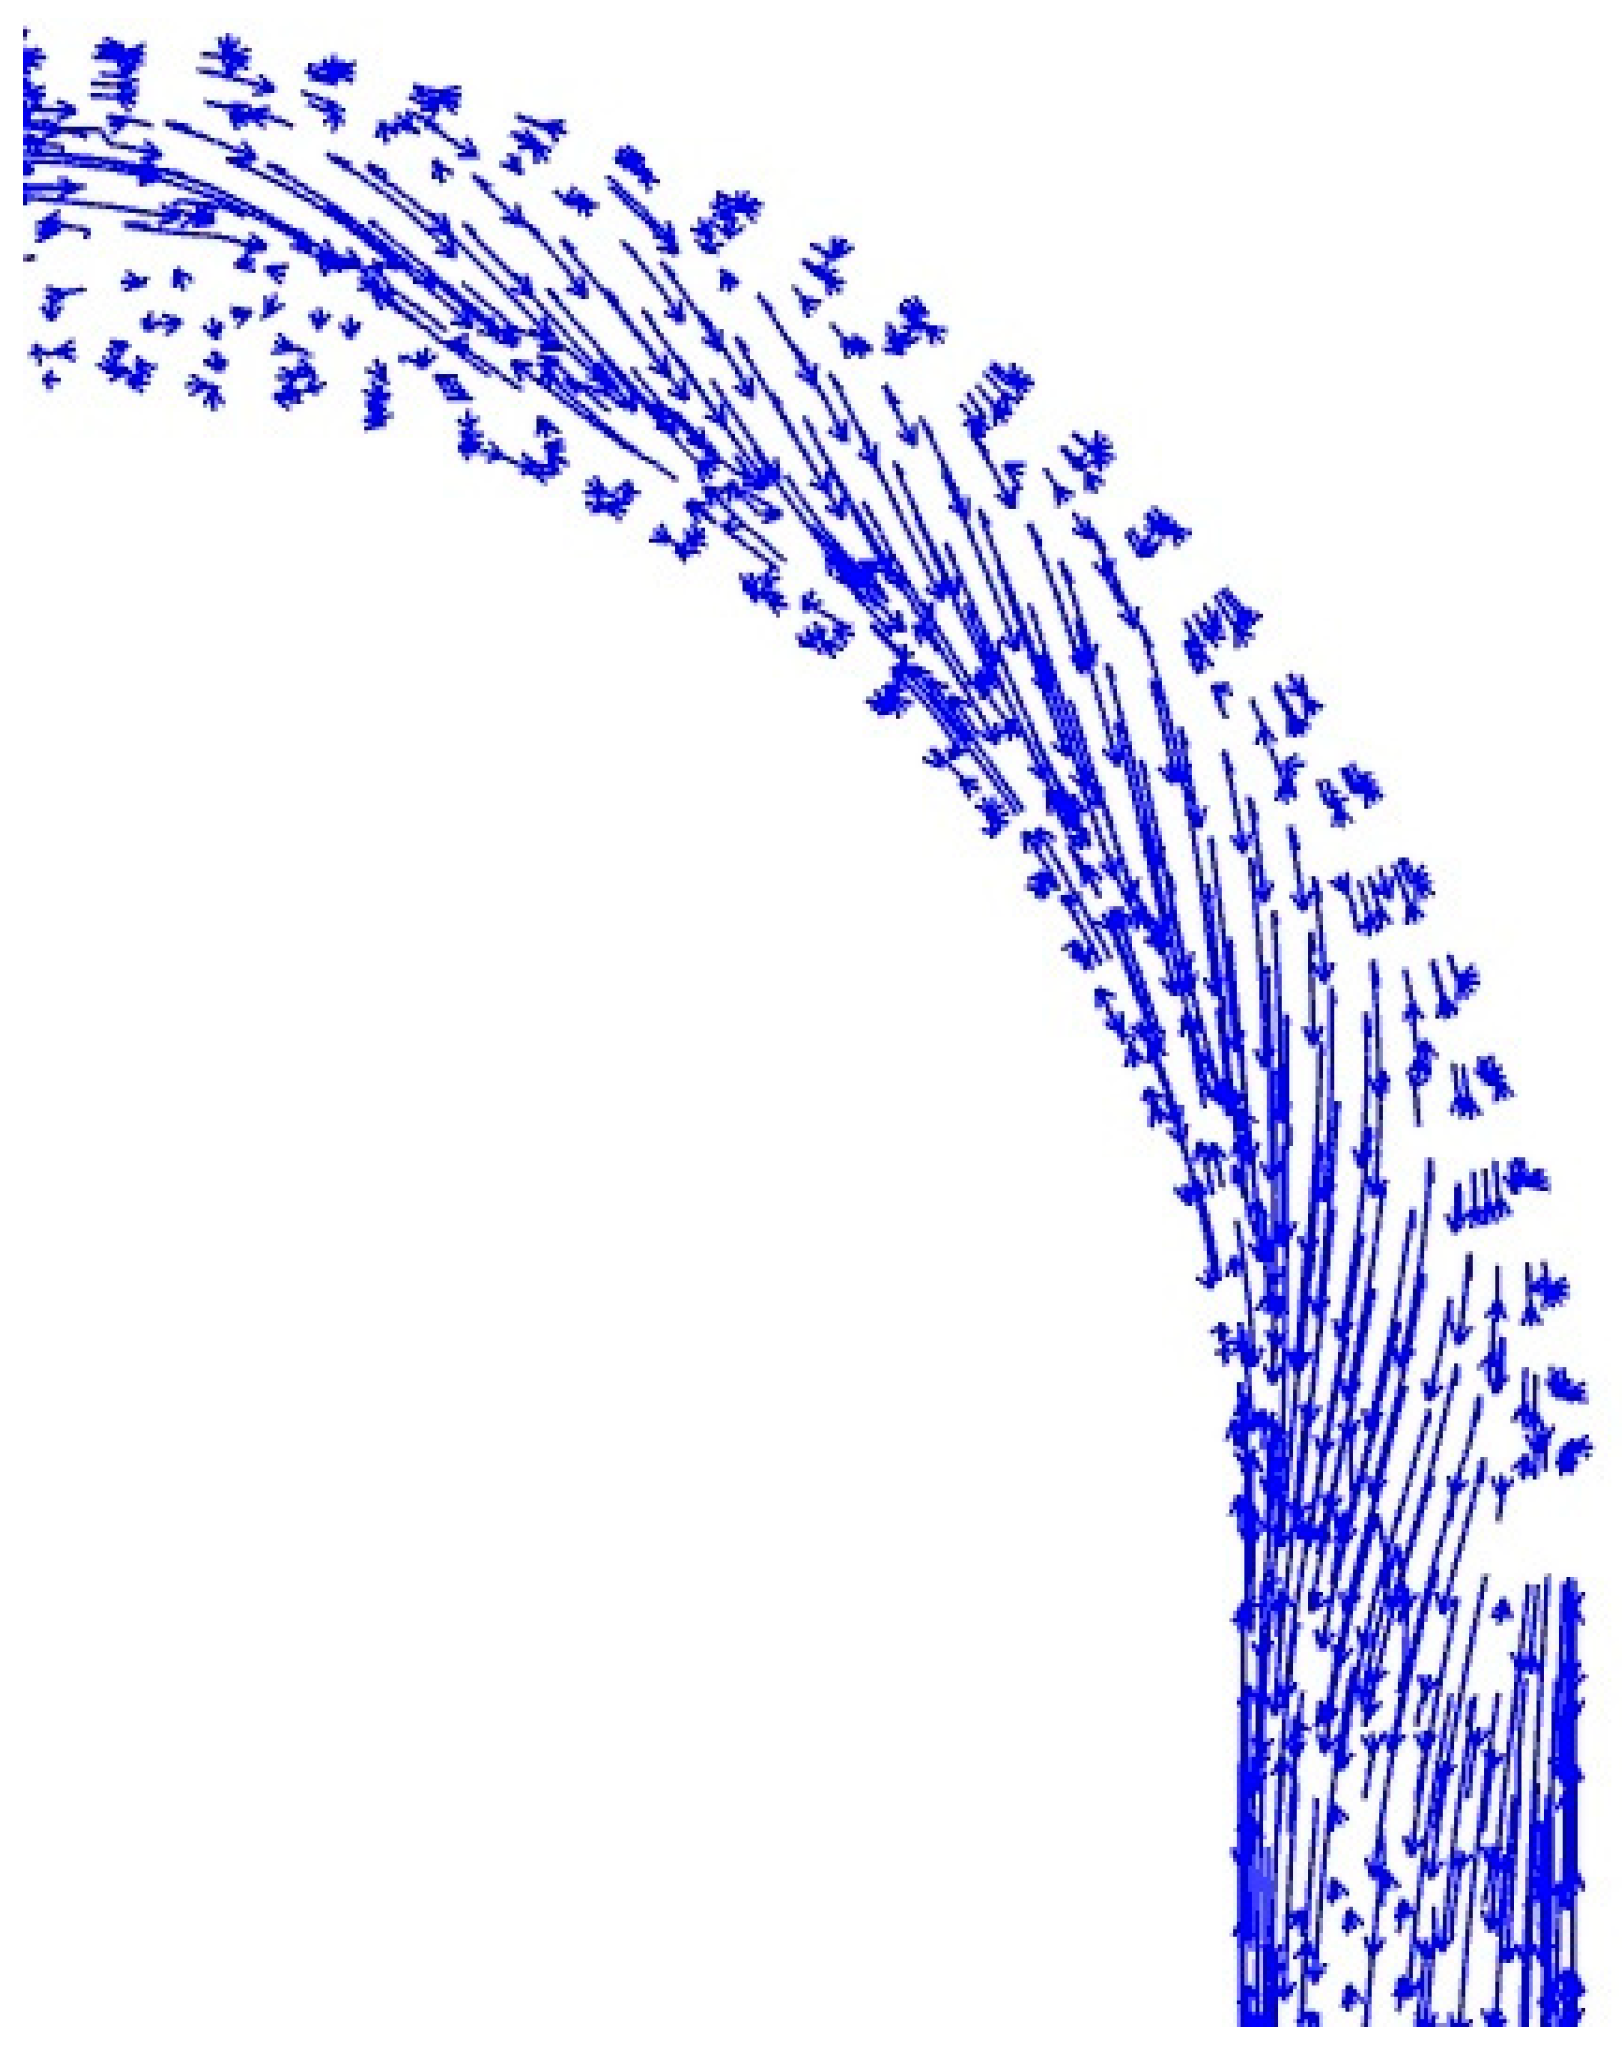
  • In a horizontal–vertical pipeline, CP deposition increases the risk of wall wear at the bottom of the horizontal pipe and inner wall of the first half of the bend, and an increase in velocity can delay this trend. With the movement of slurry, CP will form an obvious eddy current in the latter half of the elbow and the vertical pipe, making CP move to the outer wall of the elbow and the vertical pipe to achieve a relative uniform distribution.
  • In a vertical–horizontal pipeline, CP in the vertical pipeline is evenly distributed and is not affected by velocity. The outer wall of the latter half of the elbow is affected by CP deposition, which increases with the increase of velocity. The increase of velocity attenuates CP precipitation at the bottom of the horizontal pipe but has a negative effect on the latter half of the elbow. Therefore, measures should be taken to increase the abrasion resistance of the outer wall of the latter half of the elbow at high flow rates.
  • In the horizontal–vertical pipeline, the velocity distribution of CPB slurry in the horizontal pipe and the vertical pipe presents a symmetrical state with high value in the middle and low value on both sides and forms a zero-value velocity zone near the pipe wall, which is the standard “plunger flow” state. However, at a low flow rate, the velocity distribution of CPB slurry at the bottom of the horizontal pipe and the inner wall of the bend will be affected because of the precipitation of CP, increasing the risk of CPB blockage in the pipe.
  • In vertical–horizontal pipelines, the velocity distribution of the cross-section will shift with the change of pipe shape, and the difference of velocity distribution values will increase with the increase of velocity. In this pipeline, special attention should be paid to CPB slurry movement in the horizontal pipe, where CP deposition can increase clogging, and increased flow rate can mitigate this behavior.
  • Compared with the horizontal–vertical pipeline, the pressure loss in the vertical–horizontal pipeline will always be greater than the former with the increase of velocity, and the gap in the bend section will be larger. The mechanism of this requires more detailed research in the later stage.

Author Contributions

H.D.: Methodology, Formal analysis, Writing—original draft, Writing—review & editing. N.A.A., H.Z.M.S., K.A.B.A.: Conceptualization, Resources, Writing—review & editing, Supervision. All authors have read and agreed to the published version of the manuscript.

Funding

This research received no external funding.

Institutional Review Board Statement

Not applicable.

Informed Consent Statement

Informed consent was obtained from all subjects involved in the study.

Data Availability Statement

Not applicable.

Acknowledgments

The authors would like to express their gratitude and sincere gratitude to the Mechanical Engineering, Faculty of Engineering, University Putra Malaysia for their close cooperation in this work. I would also like to thank the supervisor and co-supervisor for their help.

Conflicts of Interest

The authors declare that they have no conflict of interest.

References

  1. Wang, C.; Gan, D. Study and analysis on the influence degree of particle settlement factors in pipe transportation of backfill slurry. Metals 2021, 11, 1780. [Google Scholar] [CrossRef]
  2. Yang, J.; Yang, B.; Yu, M. Pressure study on pipe transportation associated with cemented coal gangue fly-ash backfill slurry. Appl. Sci. 2019, 9, 512. [Google Scholar] [CrossRef] [Green Version]
  3. Zhang, C.; Tan, Y.Y.; Zhang, K.; Zhang, C.Y.; Song, W.D. Rheological parameters and transport characteristics of fresh cement tailings backfill slurry in an underground iron mine. Adv. Civ. Eng. 2021, 2021, 7916244. [Google Scholar] [CrossRef]
  4. Bartosik, A. Influence of coarse-dispersive solid phase on the 'particles-wall' shear stress in turbulent slurry flow with high solid concentration. Arch. Mech. Eng. 2010, 57, 45–68. [Google Scholar] [CrossRef] [Green Version]
  5. Bartosik, A. Validation of friction factor predictions in vertical slurry flows with coarse particles. J. Hydrol. Hydromech. 2020, 68, 119–127. [Google Scholar] [CrossRef]
  6. Peng, W.; Cao, X.; Hou, J.; Xu, K.; Fan, Y.; Xing, S. Experiment and numerical simulation of sand particle erosion under slug flow condition in a horizontal pipe bend. J. Nat. Gas Sci. Eng. 2020, 76, 103175. [Google Scholar] [CrossRef]
  7. Singh, J.P.; Kumar, S.; Mohapatra, S.K. Simulation and optimization of coal-water slurry suspension flow through 90 pipe bend using CFD. Int. J. Coal Prep. Util. 2021, 41, 428–450. [Google Scholar] [CrossRef]
  8. Singh, J.; Kumar, S.; Singh, J.P.; Kumar, P.; Mohapatra, S.K. CFD modeling of erosion wear in pipe bend for the flow of bottom ash suspension. Part. Sci. Technol. 2019, 37, 275–285. [Google Scholar] [CrossRef]
  9. Singh, V.; Kumar, S.; Mohapatra, S.K. Modeling of erosion wear of sand water slurry flow through pipe bend using CFD. J. Appl. Fluid Mech. 2019, 12, 679–687. [Google Scholar] [CrossRef]
  10. Zhou, M.; Kuang, S.; Xiao, F.; Luo, K.; Yu, A. CFD-DEM analysis of hydraulic conveying bends: Interaction between pipe orientation and flow regime. Powder Technol. 2021, 392, 619–631. [Google Scholar] [CrossRef]
  11. Xie, D.; Wu, Y.; Zhang, Z.; Wang, T.; Chen, P.; Cui, Y.; Feng, S. Numerical simulation of elbow erosion in liquid-solid two-phase flow. IOP Conf. Ser. Mater. Sci. Eng. 2020, 740, 012169. [Google Scholar] [CrossRef]
  12. Chen, Q.; Zhou, H.; Wang, Y.; Li, X.; Zhang, Q.; Feng, Y.; Qi, C. Resistance loss in cemented paste backfill pipelines: Effect of Inlet Velocity, Particle Mass Concentration, and Particle Size. Materials 2022, 15, 3339. [Google Scholar] [CrossRef] [PubMed]
  13. Feng, G.; Wang, Z.; Qi, T.; Du, X.; Guo, J.; Wang, H.; Wen, X. Effect of velocity on flow properties and electrical resistivity of cemented coal gangue-fly ash backfill (CGFB) slurry in the pipeline. Powder Technol. 2022, 396, 191–209. [Google Scholar] [CrossRef]
  14. Hewitt, D.; Allard, S.; Radziszewski, P. Pipe lining abrasion testing for paste backfill operations. Miner. Eng. 2009, 22, 1088–1090. [Google Scholar] [CrossRef]
  15. Nguyen, V.B.; Nguyen, Q.B.; Zhang, Y.W.; Lim, C.Y.H.; Khoo, B.C. Effect of particle size on erosion characteristics. Wear 2016, 348, 126–137. [Google Scholar] [CrossRef]
  16. Barati, R.; Neyshabouri, S.A.A.S.; Ahmadi, G. Issues in Eulerian–Lagrangian modeling of sediment transport under saltation regime. Int. J. Sediment Res. 2018, 33, 441–461. [Google Scholar] [CrossRef]
  17. Qin, S.; Zhou, X. Numerical simulation of pneumatic conveying characteristics of micron particles in horizontal pipe. Vibroengineering Procedia 2021, 38, 135–141. [Google Scholar] [CrossRef]
  18. Zhang, J.; Yuan, H.; Cheng, L.; Mei, N. Inverse estimation of the sand concentration for sand-oil flow in a horizontal pipeline based on the Eulerian–Eulerian model. J. Pet. Sci. Eng. 2020, 195, 107877. [Google Scholar] [CrossRef]
  19. Van Wachem, B.G.M.; Almstedt, A.E. Methods for multiphase computational fluid dynamics. Chem. Eng. J. 2003, 96, 81–98. [Google Scholar] [CrossRef]
  20. Kaushal, D.R.; Thinglas, T.; Tomita, Y.; Kuchii, S.; Tsukamoto, H. CFD modeling for pipeline flow of fine particles at high concentration. Int. J. Multiph. Flow 2012, 43, 85–100. [Google Scholar] [CrossRef]
  21. Gidaspow, D.; Bezburuah, R.; Ding, J. Hydrodynamics of circulating fluidized beds, kinetic theory approach. In Proceedings of the 7th Engineering Foundation Conference on Fluidization, Brisbane, Australia, 3–8 May 1992; pp. 75–82. [Google Scholar]
  22. Syamlal, M.; Rogers, W.; O’Brien, T.J. MFIX Documentation: Theory Guide; National Technical Information Service: Springfield, VA, USA, 1993; Volume 1, DOE/METC-9411004, NTIS/DE9400087.
  23. Schaeffer, D.G. Instability in the evolution equations describing incompressible granular flow. J. Differ. Equ. 1987, 66, 19–50. [Google Scholar] [CrossRef] [Green Version]
  24. Li, Y.; Mu, J.; Xiong, C.; Sun, Z.; Jin, C. Effect of visco-plastic and shear-thickening/thinning characteristics on non-Newtonian flow through a pipe bend. Phys. Fluids 2021, 33, 033102. [Google Scholar] [CrossRef]
  25. Deqing, G.A.N.; Haikuan, S.U.N.; Zhenlin, X.U.E.; Zepeng, Y.A.N.; Zhiyi, L.I.U. Flow characteristics of slurry conveying pipe with large flow under high temperature environment. MetalMine 2021, 50, 43. [Google Scholar]
  26. Lachemi, M.; Hossain, K.M.A.; Patel, R.; Shehata, M.; Bouzoubaâ, N. Influence of paste/mortar rheology on the flow characteristics of high-volume fly ash self-consolidating concrete. Mag. Concr. Res. 2007, 59, 517–528. [Google Scholar] [CrossRef]
  27. Silva, R.; Cotas, C.; Garcia, F.A.P.; Faia, P.M.; Rasteiro, M.G. Particle distribution studies in highly concentrated solid-liquid flows in pipe using the mixture model. Procedia Eng. 2015, 102, 1016–1025. [Google Scholar] [CrossRef] [Green Version]
  28. Gharib, N.; Bharathan, B.; Amiri, L.; McGuinness, M.; Hassani, F.P.; Sasmito, A.P. Flow characteristics and wear prediction of Herschel-Bulkley non-Newtonian paste backfill in pipe elbows. Can. J. Chem. Eng. 2017, 95, 1181–1191. [Google Scholar] [CrossRef]
  29. Bingham, E.C. Fluidity and Plasticity; McGraw-Hill: New York, NY, USA, 1922. [Google Scholar]
  30. Dong, H.Z. Experimental research on filling slurry and pipeline transportation characteristics in mined-out area. Master's Thesis, Taiyuan University of Technology, Taiyuan, China, 2013. [Google Scholar]
  31. Sun, H.H.; Huang, Y.C.; Yang, B.G. Contemporary Cemented Backfilling Technology; Metallurgical Industry Press: Beijing, China, 2002. [Google Scholar]
  32. Huang, Y.C.; Dong, Y.; Lv, Y.K. Numerical simulation study on paste-like slurry flow at elbow section of paste material transportation pipeline. Coal. Eng. 2014, 46, 84–86. [Google Scholar]
  33. Fei, X.J. Hydraulics of Slurry and Granular Material Transportation; Tsinghua University Press: Beijing, China, 1994. [Google Scholar]
  34. Dai, Y.; Zhang, Y.; Li, X. Numerical and experimental investigations on pipeline internal solid-liquid mixed fluid for deep ocean mining. Ocean. Eng. 2021, 220, 108411. [Google Scholar] [CrossRef]
Figure 1. Geometry and meshing of bend pipe.
Processes 10 01454 g001aProcesses 10 01454 g001b
Figure 2. The pressure drop varies with the number of elements.
Processes 10 01454 g002
Figure 3. Comparison of pressure drop.
Processes 10 01454 g003
Figure 4. Cross-sectional contours of volume fraction distribution of CP at horizontal–vertical bend pipe.
Processes 10 01454 g004
Figure 5. Cross-sectional contours of volume fraction distribution of CP at vertical–horizontal bend pipe.
Processes 10 01454 g005
Figure 6. Cross-sectional contours of velocity distribution of CPB at horizontal–vertical bend pipe.
Processes 10 01454 g006
Figure 7. The path lines of the velocity at the bend pipe.
Processes 10 01454 g007
Figure 8. Cross-sectional contours of velocity distribution of CPB at vertical–horizontal bend pipe.
Processes 10 01454 g008
Figure 9. Pressure loss of two types of bend pipe.
Processes 10 01454 g009
Figure 10. Pressure loss of two types of bend pipe section.
Processes 10 01454 g010
Table 1. Boundary conditions and parameters setting.
Boundary ConditionsInletVelocities
WallNo-slip
OutletPressure-out
Fluid typeSteady (considering the acceleration of gravity)
Viscous modelLaminar
Multiphase modelMixture
PhasesPrimary phaseDensity (kg/m3)1600
ViscosityHerschel–Bulkley
Secondary phaseDensity (kg/m3)2300
Diameter (mm)10
Volume fraction (%)26
Convergence10−4
Table 2. Pressure loss in different pipe shape.
Δp (kPa)Δp′ (kPa)
Velocity (m/s)Horizontal–vertical bend pipeHorizontal–vertical bend pipe section
1.215.9002.718
1.628.5955.362
244.3468.240
2.458.19411.202
2.872.05214.201
3.286.08617.151
Velocity (m/s)Vertical–horizontal bend pipeVertical–horizontal bend pipe section
1.231.9806.611
1.648.96711.796
267.37117.148
2.485.42422.934
2.8104.16429.747
3.2124.52137.262
Publisher’s Note: MDPI stays neutral with regard to jurisdictional claims in published maps and institutional affiliations.

