
Calibration and Experimental Validation of Contact Parameters in a Discrete Element Model for Tobacco Strips

Abstract
:1. Introduction
2. Materials and Methods
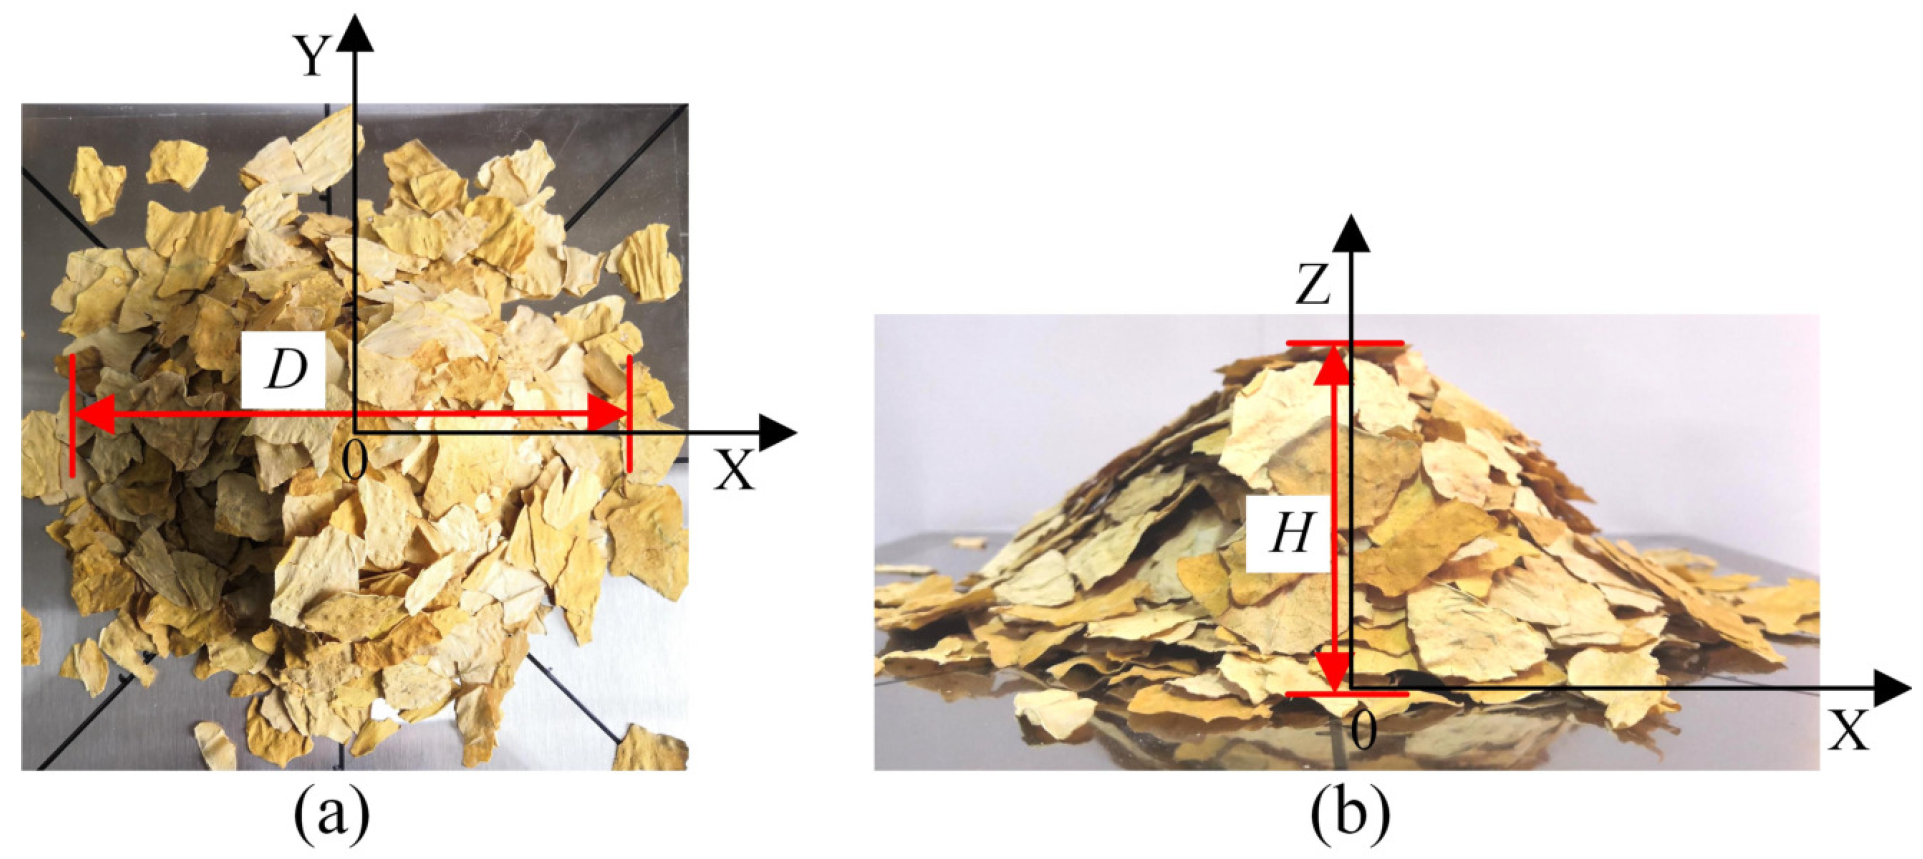
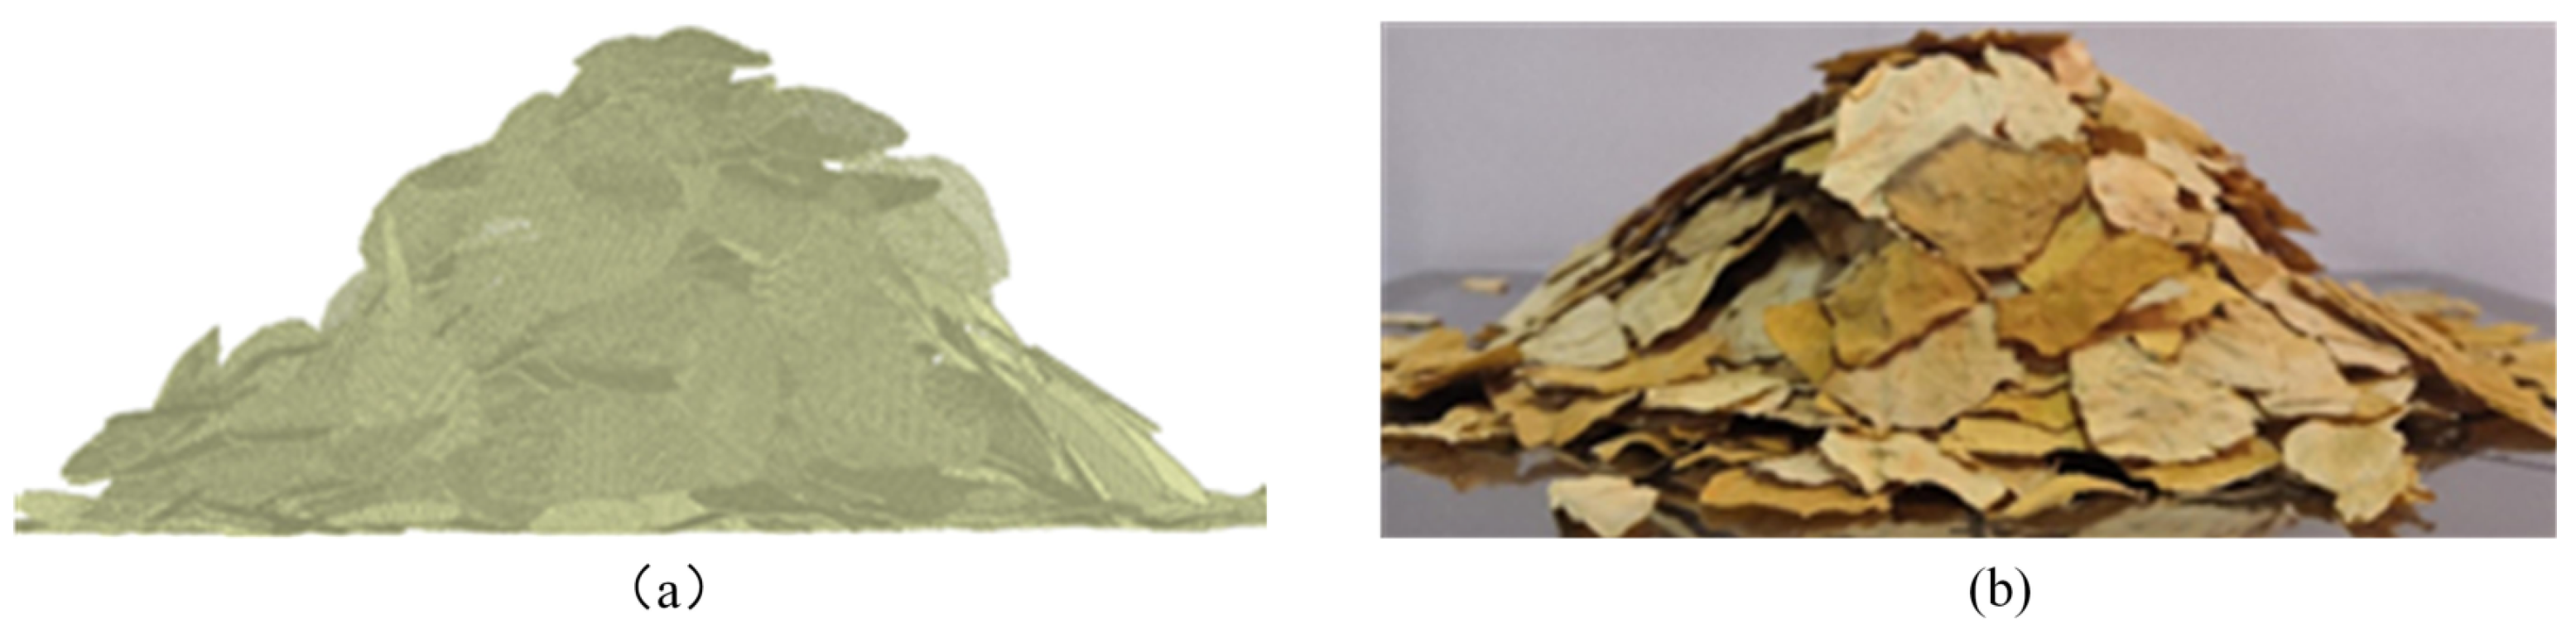
2.1. Tobacco Strips Material and Physical Test of Stacking Angle
2.2. Tobacco Strips Simulation Model
2.3. Simulation Parameters Determination
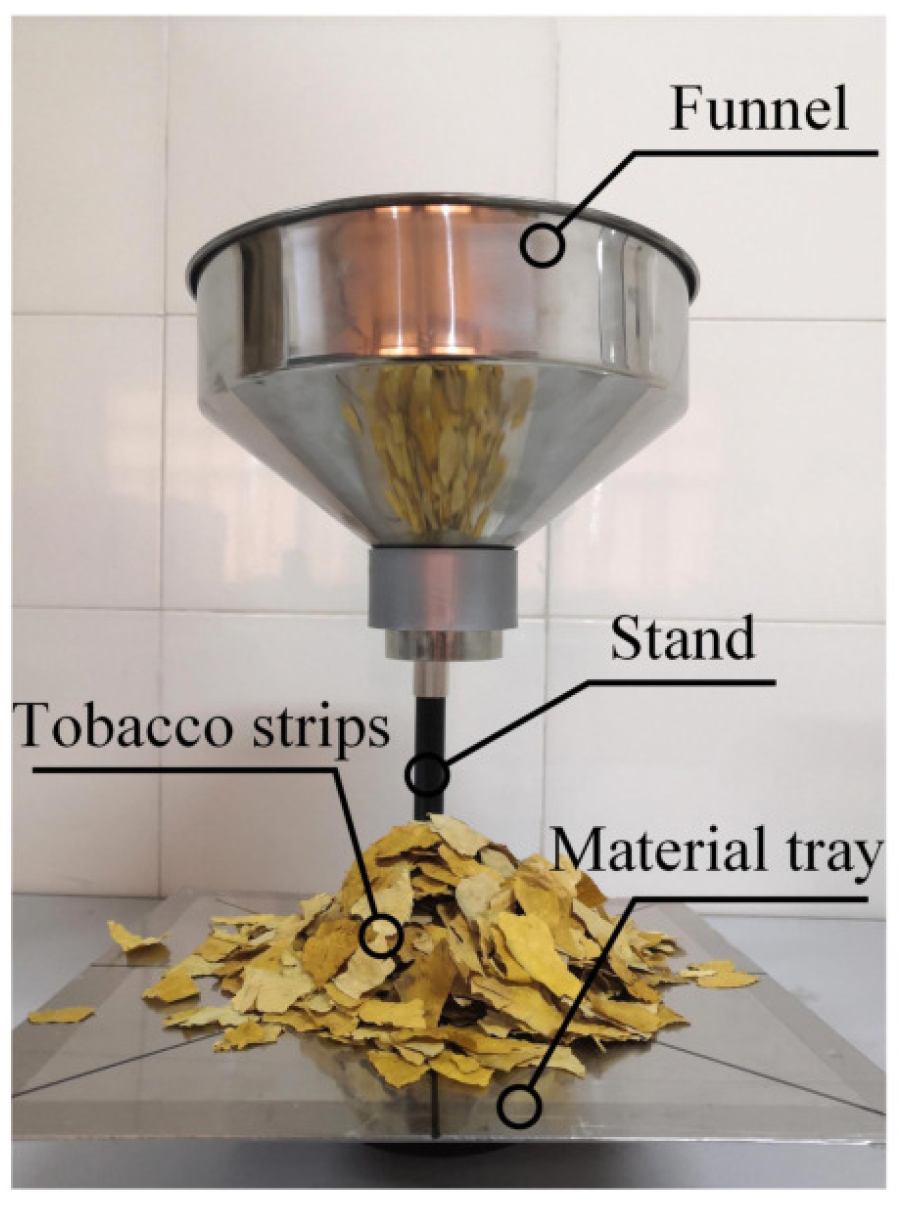
2.4. Tobacco Strips Stacking Angle Measurement for Physical Experiments
3. Results and Discussion
3.1. Calibration and Analysis of Contact Parameters
3.1.1. Screening and Analysis of Significant Parameters
3.1.2. The Optimal Range for Significant Parameters
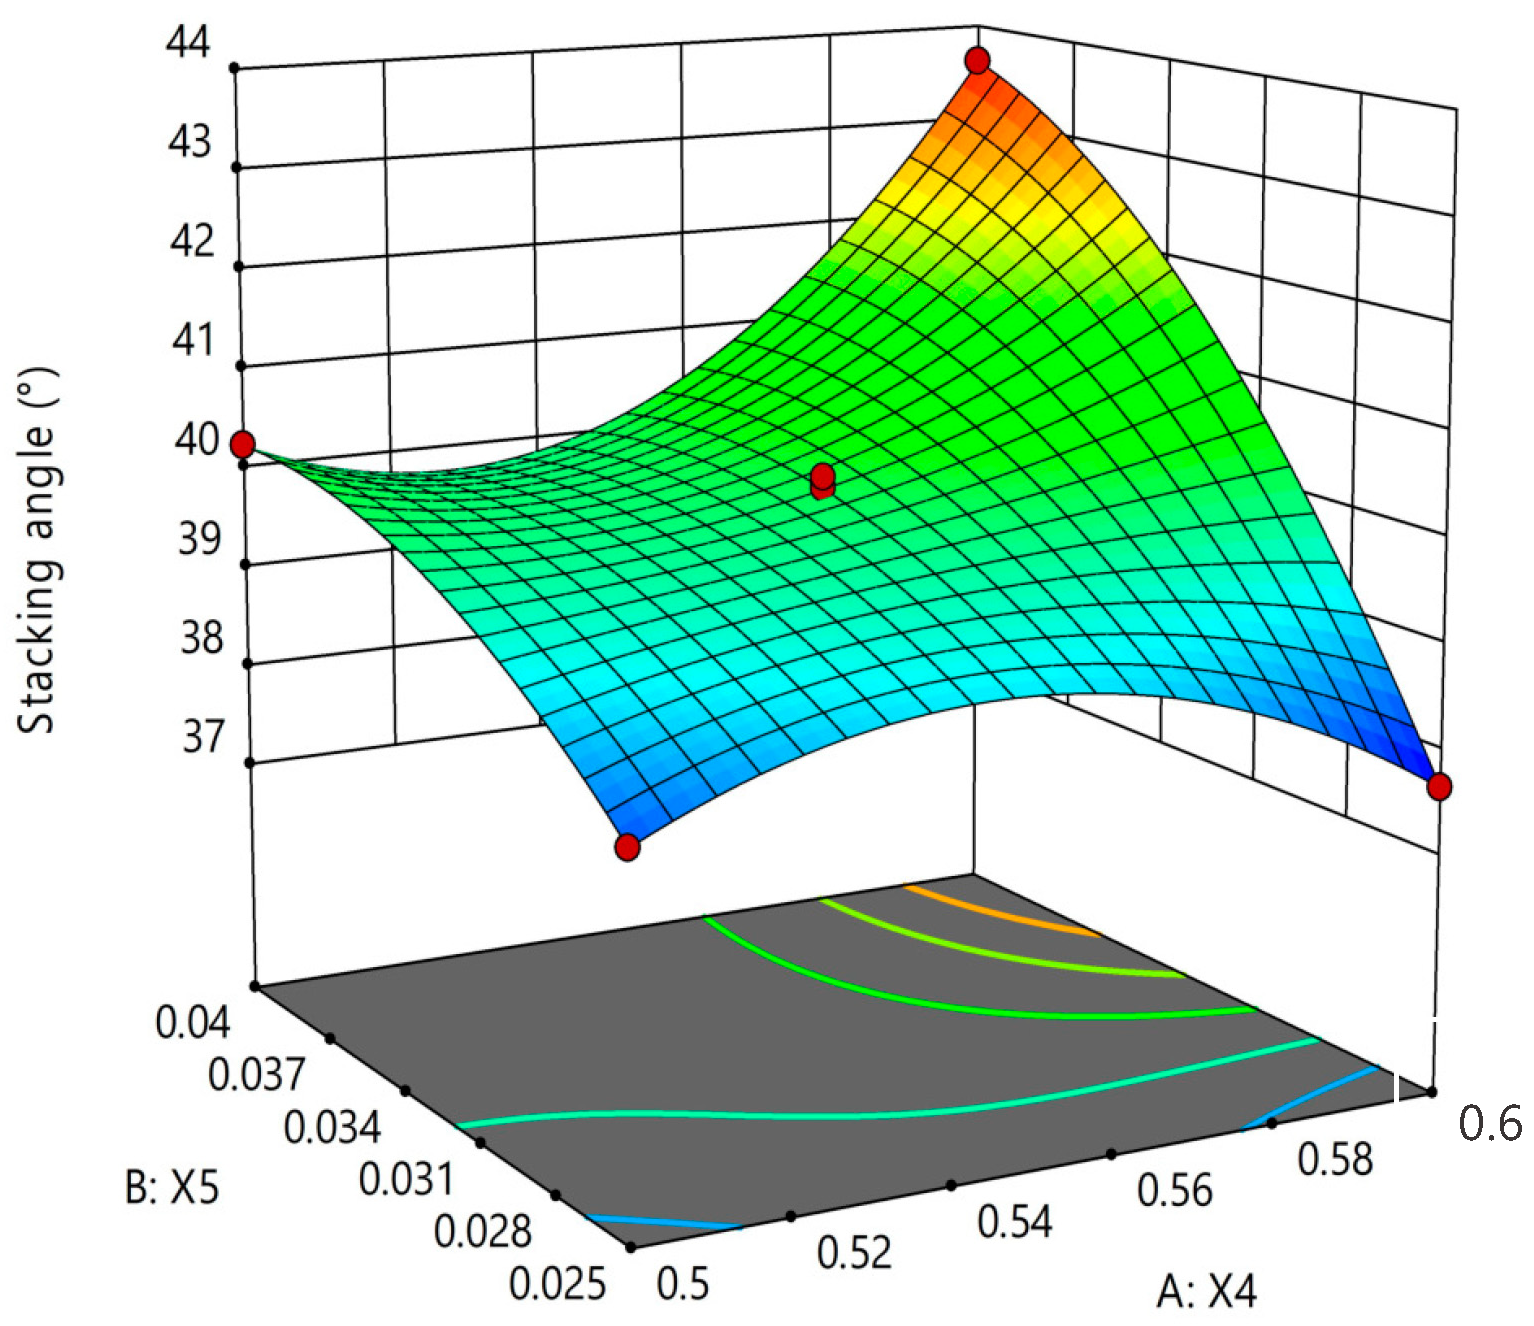
3.1.3. Results and Analysis of Central Composite Design
3.2. Validation and Analysis of Contact Parameter Calibration Results
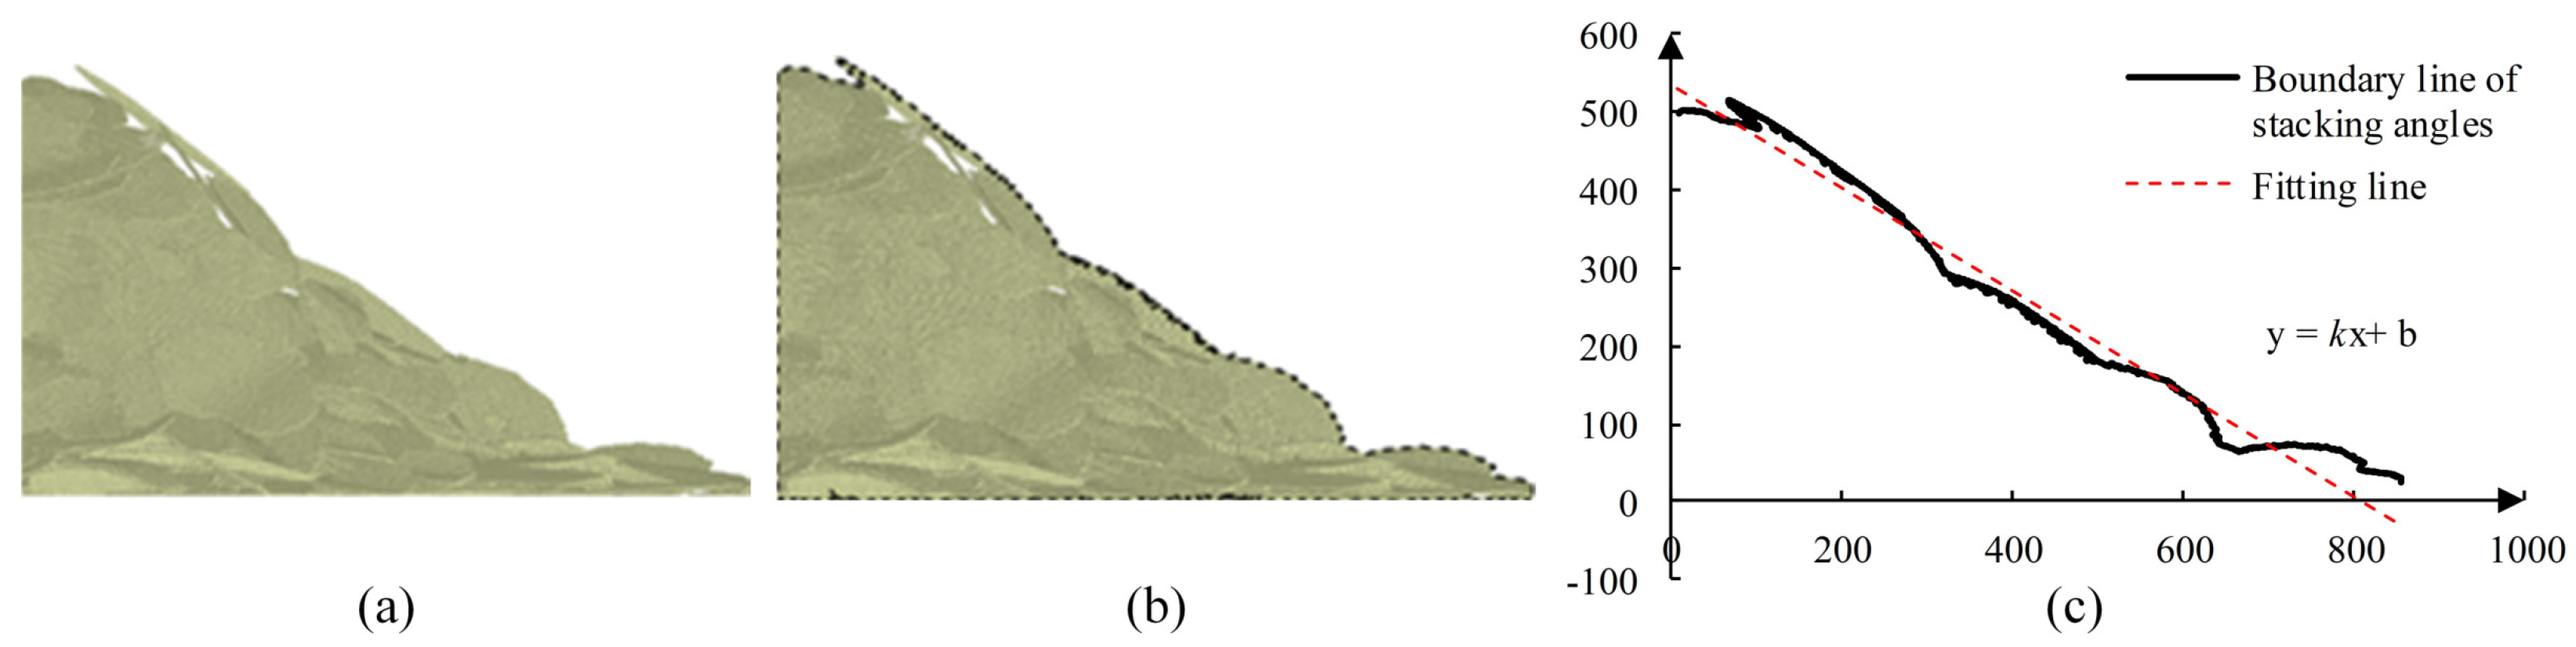
3.2.1. Verification and Analysis by the Stacking Angle Test
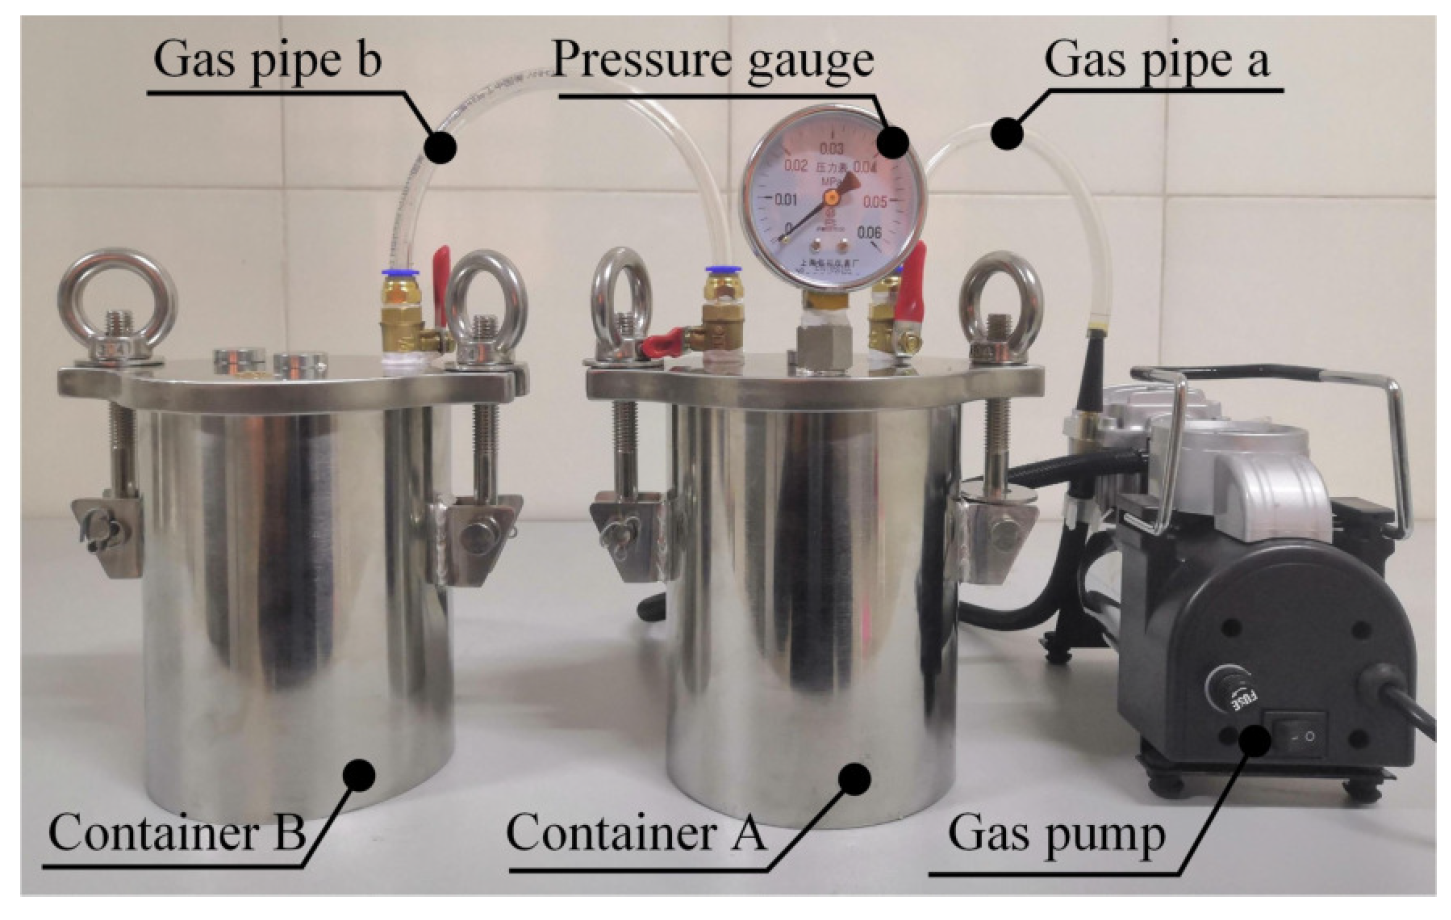
3.2.2. Verification and Analysis by the Void Ratio Test
4. Conclusions
- (1)
- The results of the significant factor screening test showed that among the parameters of the simulation model, the static friction coefficient between tobacco strips () and the rolling friction coefficient between tobacco strips () had an extremely significant effect on the stacking angle (p < 0.05). The results of the steepest ascent test showed that the tobacco strips stacking angle increased with the increase of the two significantly influencing parameters.
- (2)
- Based on the results of Central Composite Design, a regression equation between , , and stacking angle was established, and the response surface finding a solution to the regression equation was carried out using the physical test stacking angle of tobacco strips as the response index. The optimal combination of the significant parameters was obtained as the static friction coefficient between tobacco strips () is 0.560, and the rolling friction coefficient between tobacco strips () is 0.033.
- (3)
- The simulation test is carried out under the optimal combination of significant parameters. The average value of the stacking angle for the three simulations was 40.48, with a relative error of 0.27% compared to the actual physical test stacking angle. The mean value of the void ratio for the three simulations was 63.42%, with a relative error of 1.83% compared to the actual physical void ratio results. The accuracy and validity of the simulation parameters of the discrete element model for tobacco strips were demonstrated.
Author Contributions
Funding
Institutional Review Board Statement
Informed Consent Statement
Data Availability Statement
Conflicts of Interest
References
- Ye, J.; Yan, J.; Zhang, Z.; Yang, Z.; Liu, X. The effects of threshing and redrying on bacterial communities that inhabit the surface of tobacco leaves. Appl. Microbiol. Biotechnol. 2017, 101, 4279–4287. [Google Scholar] [CrossRef] [PubMed]
- Chu, H.; Zhang, C.; Wang, W.; Guo, Y.; Cheng, M.; Li, Y.; Qin, S.; Wang, Y. Design and application of automatic precision feeding equipment for threshing and redrying process. Acta Tabacaria Sin. 2021, 27, 45–50. [Google Scholar]
- Long, M.; Hua, Y.; Wang, X.; Wang, Y.; He, C.; Huangfu, D.; Zi, W. Effect of different combined moistening and redrying treatments on the physicochemical and sensory capabilities of smoking food tobacco material. Dry. Technol. 2018, 36, 52–62. [Google Scholar] [CrossRef]
- Wang, W.; Feng, X.; Fan, Z.; Ma, C.; Chen, H.; Ren, Z. Design and application of control strategy for moisture content in redried tobacco strips packed in cases. Tob. Sci. Technol. 2020, 53, 103–107+112. [Google Scholar]
- Jia, H.; Deng, J.; Deng, Y.; Chen, T.; Wang, G.; Sun, Z.; Guo, H. Contact parameter analysis and calibration in discrete element simulation of rice straw. Int. J. Agric. Biol. Eng. 2021, 14, 72–81. [Google Scholar] [CrossRef]
- Saruwatari, M.; Nakamura, H. Coarse-grained discrete element method of particle behavior and heat transfer in a rotary kiln. Chem. Eng. J. 2022, 428, 130969. [Google Scholar] [CrossRef]
- Liu, D.; Sun, L.; Ma, H.; Cui, W. Process simulation and mesoscopic analysis of rockfill dam compaction using discrete element method. Int. J. Geomech. 2020, 26, 04020047. [Google Scholar] [CrossRef]
- Wang, Z.; Liu, C.; Wu, J.; Jiang, H.; Zhao, Y. Impact of screening coals on screen surface and multi-index optimization for coal cleaning production. J. Clean. Prod. 2018, 187, 562–575. [Google Scholar] [CrossRef]
- Hou, Z.; Dai, N.; Chen, Z.; Qiu, Y.; Zhang, X. Measurement and calibration of physical property parameters for Agropyron seeds in a discrete element simulation. Trans. Chin. Soc. Agric. Eng. 2020, 36, 46–54. [Google Scholar]
- Boukouvala, F.; Gao, Y.; Muzzio, F.; Ierapetritou, M.G. Reduced-order discrete element method modeling. Chem. Eng. Sci. 2013, 95, 12–26. [Google Scholar] [CrossRef]
- Huang, Y.; Wang, B.; Yao, Y.; Ding, S.; Zhang, J.; Zhu, R. Parameter optimization of fluted-roller meter using discrete element method. Int. J. Agric. Biol. Eng. 2018, 11, 65–72. [Google Scholar] [CrossRef]
- Wen, X.; Yuan, H.; Wang, G.; Jia, H. Calibration method of friction coefficient of granular fertilizer by discrete element simulation. Trans. Chin. Soc. Agric. Mach. 2020, 51, 115–122+142. [Google Scholar]
- Gallego, E.; Fuentes, J.M.; Ruiz, Á; Hernández-Rodrigo, G.; Aguado, P.; Ayuga, F. Determination of mechanical properties for wood pellets used in DEM simulations. Int. Agrophys. 2020, 34, 485–494. [Google Scholar] [CrossRef]
- Zeng, Z.; Ma, X.; Cao, X.; Li, Z.; Wang, X. Critical Review of Applications of Discrete Element Method in Agricultural Engineering. Trans. Chin. Soc. Agric. Mach. 2021, 52, 1–20. [Google Scholar]
- Rackl, M.; Hanley, K.J. A methodical calibration procedure for discrete element models. Powder Technol. 2017, 307, 73–83. [Google Scholar] [CrossRef] [Green Version]
- Cao, X.; Li, Z.; Li, H.; Wang, X.; Ma, X. Measurement and Calibration of the Parameters for Discrete Element Method Modeling of Rapeseed. Processes 2021, 9, 605. [Google Scholar] [CrossRef]
- Zhou, L.; Yu, J.; Liang, L.; Wang, Y.; Yu, Y.; Yan, D.; Sun, K.; Liang, P. DEM Parameter Calibration of Maize Seeds and the Effect of Rolling Friction. Processes 2021, 9, 914. [Google Scholar] [CrossRef]
- Liu, F.; Zhang, J.; Chen, J. Modeling of flexible wheat straw by discrete element method and its parameter calibration. Int. J. Agric. Biol. Eng. 2018, 11, 42–46. [Google Scholar] [CrossRef] [Green Version]
- Liao, Y.; Liao, Q.; Zhou, Y.; Wang, Z.; Jiang, Y.; Liang, F. Parameters calibration of discrete element model of fodder rape crop harvest in bolting stage. Trans. Chin. Soc. Agric. Mach. 2020, 51, 73–82. [Google Scholar]
- Xie, C.; Yang, J.; Wang, B.; Zhuo, P.; Li, C.; Wang, L. Parameter calibration for the discrete element simulation model of commercial organic fertilizer. Int. Agrophys. 2021, 35, 107–117. [Google Scholar] [CrossRef]
- Mudarisov, S.; Farkhutdinov, I.; Khamaletdinov, R.; Khasanov, E.; Mukhametdinov, A. Evaluation of the significance of the contact model particle parameters in the modelling of wet soils by the discrete element method. Soil Tillage Res. 2022, 215, 105228. [Google Scholar] [CrossRef]
- Stahl, M.; Konietzky, H.; Te Kamp, L.; Jas, H. Discrete element simulation of geogrid-stabilised soil. Acta Geotech. 2014, 9, 1073–1084. [Google Scholar] [CrossRef]
- Ma, Y.; Song, C.; Xuan, C.; Wang, H.; Yang, S.; Wu, P. Parameters calibration of discrete element model for alfalfa straw compression simulation. Trans. Chin. Soc. Agric. Eng. 2020, 36, 22–30. [Google Scholar]
- Al-Hashemi, H.M.B.; Al-Amoudi, O.S.B. A review on the angle of repose of granular materials. Powder Technol. 2018, 330, 397–417. [Google Scholar] [CrossRef]
- Favier, J.F.; Abbaspour-Fard, M.H.; Kremmer, M. Modeling nonspherical particles using multisphere discrete elements. J. Eng. Mech. 2001, 127, 971–977. [Google Scholar] [CrossRef]
- Wang, W.; Cai, D.; Xie, J.; Zhang, C.; Liu, L.; Chen, L. Parameters Calibration of Discrete Element Model for Corn Stalk Powder Compression Simulation. Trans. Chin. Soc. Agric. Mach. 2021, 52, 127–134. [Google Scholar]
- Pan, D. Research and Design of Key Technologies for Automatic Tobacco Sorting. Master’s Thesis, Guizhou University, Guizhou, China, 2016. [Google Scholar]
- Zhang, R.; Jiao, W.; Zhou, J.; Qi, B.; Liu, H.; Xia, Q. Parameter Calibration and Experiment of Rice Seeds Discrete Element Model with Different Filling Particle Radius. Trans. Chin. Soc. Agric. Mach. 2020, 51, 227–235. [Google Scholar]
- Liang, R.; Chen, X.; Jiang, P.; Zhang, B.; Meng, H.; Peng, X.; Kan, Z. Calibration of the simulation parameters of the particulate materials in film mixed materials. Int. J. Agric. Biol. Eng. 2020, 13, 29–36. [Google Scholar] [CrossRef]
- Hao, J.; Wei, W.; Huang, P.; Qin, J.; Zhao, J. Calibration and experimental verification of discrete element parameters of oil sunflower seeds. Trans. Chin. Soc. Agric. Eng. 2021, 37, 36–44. [Google Scholar]
- Zhou, L.; Yu, J.; Wang, Y.; Yan, D.; Yu, Y. A study on the modelling method of maize-seed particles based on the discrete element method. Powder Technol. 2020, 374, 353–376. [Google Scholar] [CrossRef]
- Wang, Y.; Liang, Z.; Zhang, D.; Cui, T.; Shi, S.; Li, K.; Yang, L. Calibration method of contact characteristic parameters for corn seeds based on EDEM. Trans. Chin. Soc. Agric. Eng. 2016, 32, 36–42. [Google Scholar]
- Mohazzabi, P.; Hill, W.C. A simple method for accurate determination of porosity using ideal gas law. J. Porous Mater. 2013, 20, 441–445. [Google Scholar] [CrossRef]


| Category | Size (mm) | Proportion |
|---|---|---|
| Large tobacco strips | >25.4 | 10% |
| Medium tobacco strips | 12.7–25.4 | 80% |
| Small tobacco strips | 6.35–12.7 | 10% |
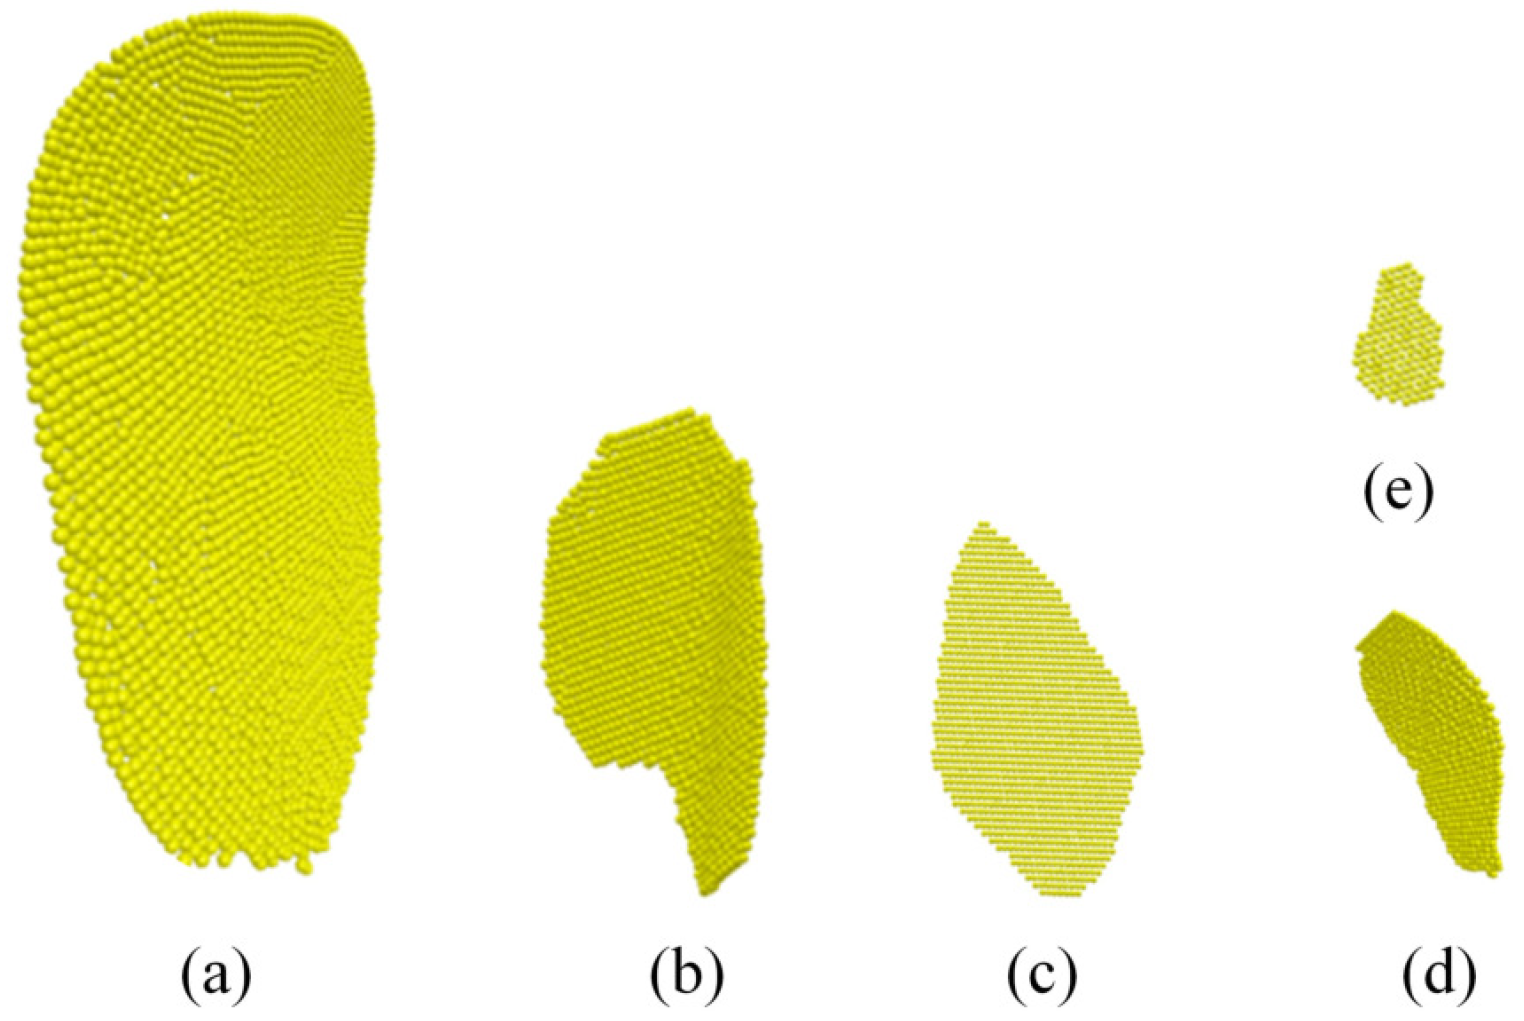
| Category | Category Code | Curl | Size (mm) | Particles Count | Proportion |
|---|---|---|---|---|---|
| Large tobacco strips | a | 20% | 27 | 3682 | 10% |
| Medium tobacco strips I | b | 16% | 23 | 1702 | 30% |
| Medium tobacco strips II | c | 0% | 20 | 1216 | 20% |
| Medium tobacco strips III | d | 12% | 15 | 777 | 30% |
| Small tobacco strips | e | 0% | 8 | 140 | 10% |
| Parameter | Value | Source |
|---|---|---|
| Tobacco strips density (kg/m) | 280 | [27] |
| Tobacco strips Poisson’s ratio | 0.25–0.35 | [27] |
| Tobacco strips shear modulus (Pa) | 2.4 × –3.5 × | [27] |
| Stainless steel density (kg/m) | 7850 | [19,26] |
| Stainless steel Poisson’s ratio | 0.3 | [19,26] |
| Stainless steel shear modulus (Pa) | 7.94 × | [19,26] |
| Collision recovery coefficient between tobacco strips | 0.01–0.10 | [26] |
| Static friction coefficient between tobacco strips | 0.4–1.0 | Laboratory measurement |
| Rolling friction coefficient between tobacco strips | 0.01–0.10 | Laboratory measurement |
| Collision recovery coefficient between tobacco strips and stainless steel | 0.02–0.20 | [26] |
| Static friction coefficient between tobacco strips and stainless steel | 0.35–0.50 | Laboratory measurement |
| Rolling friction coefficient between tobacco strips and stainless steel | 0.01–0.05 | Laboratory measurement |
| Parameters | Symbols | Level | |
|---|---|---|---|
| Low Level (−1) | High Level (+1) | ||
| Tobacco strips Poisson’s ratio | 0.25 | 0.35 | |
| Tobacco strips shear modulus (Pa) | 2.4 × | 3.5 × | |
| Collision recovery coefficient between tobacco strips | 0.01 | 0.10 | |
| Static friction coefficient between tobacco strips | 0.40 | 1.00 | |
| Rolling friction coefficient between tobacco strips | 0.01 | 0.10 | |
| Collision recovery coefficient between tobacco strips and stainless steel | 0.02 | 0.20 | |
| Static friction coefficient between tobacco strips and stainless steel | 0.35 | 0.50 | |
| Rolling friction coefficient between tobacco strips and stainless steel | 0.01 | 0.05 | |
| No. | (°) | ||||||||
|---|---|---|---|---|---|---|---|---|---|
| 1 | 1 | 1 | −1 | −1 | −1 | 1 | −1 | 1 | 30.80 |
| 2 | 1 | −1 | −1 | −1 | 1 | −1 | 1 | 1 | 43.13 |
| 3 | −1 | −1 | −1 | 1 | −1 | 1 | 1 | −1 | 45.63 |
| 4 | 1 | −1 | 1 | 1 | −1 | 1 | 1 | 1 | 42.75 |
| 5 | 1 | −1 | 1 | 1 | 1 | −1 | −1 | −1 | 69.97 |
| 6 | −1 | 1 | 1 | −1 | 1 | 1 | 1 | −1 | 47.51 |
| 7 | 1 | 1 | 1 | −1 | −1 | −1 | 1 | −1 | 28.71 |
| 8 | 1 | 1 | −1 | 1 | 1 | 1 | −1 | −1 | 64.36 |
| 9 | −1 | −1 | 1 | −1 | 1 | 1 | −1 | 1 | 45.23 |
| 10 | −1 | 1 | −1 | 1 | 1 | −1 | 1 | 1 | 50.66 |
| 11 | −1 | −1 | −1 | −1 | −1 | −1 | −1 | −1 | 37.45 |
| 12 | −1 | 1 | 1 | 1 | −1 | −1 | −1 | 1 | 49.87 |
| Parameters | Sum of Squares | Mean Square | F-Value | p-Value |
|---|---|---|---|---|
| 0.9464 | 0.9464 | 0.0658 | 0.8142 | |
| 12.51 | 12.51 | 0.8692 | 0.4199 | |
| 12.02 | 12.02 | 0.8355 | 0.4281 | |
| 681.16 | 681.16 | 47.35 | 0.0063 ** | |
| 611.33 | 611.33 | 42.49 | 0.0073 ** | |
| 1.03 | 1.03 | 0.0714 | 0.8067 | |
| 128.64 | 128.64 | 8.94 | 0.0581 | |
| 81.07 | 81.07 | 5.64 | 0.0982 |
| Test Level No. | (°) | Relative Error /% | ||
|---|---|---|---|---|
| 1 | 0.4 | 0.010 | 33.22 | 17.71% |
| 2 | 0.5 | 0.025 | 38.15 | 5.50% |
| 3 | 0.6 | 0.040 | 43.44 | 7.60% |
| 4 | 0.7 | 0.055 | 50.13 | 24.18% |
| 5 | 0.8 | 0.070 | 54.38 | 34.70% |
| 6 | 0.9 | 0.085 | 56.08 | 38.91% |
| 7 | 1.0 | 0.100 | 56.56 | 40.10% |
| Level Coding | Parameters | |
|---|---|---|
| −1.414 | 0.479 | 0.0219 |
| −1 | 0.50 | 0.025 |
| 0 | 0.55 | 0.0325 |
| 1 | 0.60 | 0.040 |
| 1.414 | 0.621 | 0.0431 |
| No. | (°) | Relative Error /% | ||
|---|---|---|---|---|
| 1 | 1.41421 | 0 | 42.51 | 5.30% |
| 2 | 0 | 0 | 40.17 | 0.50% |
| 3 | 1 | 1 | 43.62 | 8.05% |
| 4 | 0 | 0 | 40.26 | 0.27% |
| 5 | 0 | 0 | 40.03 | 0.84% |
| 6 | 0 | 0 | 40.12 | 0.62% |
| 7 | 0 | 1.41421 | 39.92 | 1.11% |
| 8 | 0 | 0 | 40.15 | 0.54% |
| 9 | −1.41421 | 0 | 39.97 | 0.99% |
| 10 | 0 | −1.41421 | 38.31 | 5.10% |
| 11 | −1 | −1 | 38.22 | 5.32% |
| 12 | −1 | 1 | 40.25 | 0.30% |
| 13 | 1 | −1 | 37.64 | 6.72% |
| Source | Sum of Squares | df | Mean Square | F-Value | p-Value | |
|---|---|---|---|---|---|---|
| Model | 31.07 | 8 | 3.88 | 560.42 | <0.0001 | significant |
| 3.23 | 1 | 3.23 | 465.48 | < 0.0001 | ||
| 1.3 | 1 | 1.3 | 187.02 | 0.0002 | ||
| 3.9 | 1 | 3.9 | 562.86 | < 0.0001 | ||
| 1.71 | 1 | 1.71 | 246.72 | < 0.0001 | ||
| 1.52 | 1 | 1.52 | 219.12 | 0.0001 | ||
| 4.03 | 1 | 4.03 | 582.16 | < 0.0001 | ||
| 0.087 | 1 | 0.087 | 12.56 | 0.0239 | ||
| 0.1182 | 1 | 0.1182 | 17.06 | 0.0145 | ||
| Pure Error | 0.0277 | 4 | 0.0069 | |||
| Cor Total | 31.1 | 12 | ||||
| = 0.9991 | = 0.9973 | = 0.2076% | = 86.3346 | |||
Publisher’s Note: MDPI stays neutral with regard to jurisdictional claims in published maps and institutional affiliations. |
© 2022 by the authors. Licensee MDPI, Basel, Switzerland. This article is an open access article distributed under the terms and conditions of the Creative Commons Attribution (CC BY) license (https://creativecommons.org/licenses/by/4.0/).
Share and Cite
Jiang, W.; Wang, L.; Tang, J.; Yin, Y.; Zhang, H.; Jia, T.; Qin, J.; Wang, H.; Wei, Q. Calibration and Experimental Validation of Contact Parameters in a Discrete Element Model for Tobacco Strips. Processes 2022, 10, 998. https://doi.org/10.3390/pr10050998
Jiang W, Wang L, Tang J, Yin Y, Zhang H, Jia T, Qin J, Wang H, Wei Q. Calibration and Experimental Validation of Contact Parameters in a Discrete Element Model for Tobacco Strips. Processes. 2022; 10(5):998. https://doi.org/10.3390/pr10050998
Chicago/Turabian StyleJiang, Wei, Lihua Wang, Jun Tang, Yanchao Yin, Hao Zhang, Tongpeng Jia, Jiwei Qin, Huaiyu Wang, and Qike Wei. 2022. "Calibration and Experimental Validation of Contact Parameters in a Discrete Element Model for Tobacco Strips" Processes 10, no. 5: 998. https://doi.org/10.3390/pr10050998