Article

Heat/PMS Degradation of Atrazine: Theory and Kinetic Studies

1
School of Materials and Environmental Engineering, Chengdu Technological University, Chengdu 611730, China
2
State Environmental Protection Key Laboratory of Synergetic Control and Joint Remediation for Soil & Water Pollution, Chengdu 610059, China
3
Faculty of Geosciences and Environmental Engineering, Southwest Jiaotong University, Chengdu 611756, China
4
Haitian Water Group Co., Ltd., Chengdu 610200, China
*
Author to whom correspondence should be addressed.
Processes 2022, 10(5), 941; https://doi.org/10.3390/pr10050941
Submission received: 28 March 2022 / Revised: 30 April 2022 / Accepted: 3 May 2022 / Published: 9 May 2022
(This article belongs to the Topic Advanced Oxidation Process: Applications and Prospects)

Abstract

:
The degradation effect of heat/peroxymonosulfate (PMS) on atrazine (ATZ) is studied. The results show that the heat/PMS degradation for ATZ is 96.28% at the moment that the phosphate buffer (PB) pH, temperature, PMS dosage, ATZ concentration, and reaction time are 7, 50 °C, 400 μmol/L, 2.5 μmol/L, and 60 min. A more alkaline PB is more likely to promote the breakdown of ATZ through heat/PMS, while the PB alone has a more acidic effect on the PMS than the partially alkaline solution. HO and S O 4 coexisted within the heat/PMS scheme, and ATZ quantity degraded by HO and S O 4 in PB with pH = 7, pH = 1.7~1. HC O 3 makes it difficult for heat/PMS to degrade ATZ according to inorganic anion studies, while C l and N O 3 accelerate the degradation and the acceleration effect of N O 3 is more obvious. The kinetics of ATZ degradation via heat/PMS is quasi-first-order. Ethanol (ETA) with the identical concentration inhibited ATZ degradation slightly more than HC O 3 , and both of them reduced the degradation rates of heat/PMS to 7.06% and 11.56%. The addition of C l and N O 3 increased the maximum rate of ATZ degradation by heat/PMS by 62.94% and 189.31%.

1. Introduction

With the continuous growth of the world’s population, the demand for crops increases, and the use of chemical fertilizers, pesticides, and herbicides has caused serious impacts on the global soil and water environment [1,2]. Herbicides remain the most effective, efficient, and economical way to control weeds, and its market continues to grow even with the plethora of generic products. With the development of herbicide-tolerant crops, use of herbicides is increasing around the world, which has resulted in severe contamination of the environment [3]. Atrazine is a commonly used chemical herbicide. This herbicide is considered moderately toxic for humans and very dangerous for the environment since significant levels persist in the environment and are highly toxic even in low concentrations [4]. ATZ is also potentially harmful to the growth and development of aquatic plants, animals, mammals, amphibians, and human cells [5,6]. Annual atrazine use in China has increased year on year since 1980 [7]. Based on this, the total amount of ATZ used nationwide could reach 108 kg by the end of 2018. ATZ can be excreted in wastewater on a variety of environmental substrates, for example, ground and surface water, various sediments, potable water, and soil [8]. The amount of ATZ in ground and surface water and soil can continue increasing because of its heavy use and chemical stability [9]. Inside the aqueous solution, atrazine owns a half-life of 60 to 150 days in humic acid and/or water, accordingly [10]. Due to the serious environmental hazards of ATZ, as early as 1994, the US Environmental Protection Agency issued a communique stating that only 3 μg L−1 ATZ is allowed in the water [11]. However, atrazine is found in 32% of U.S. water bodies, at an average quantity of 0.17 g/L [12]. Many of our rivers and reservoirs detected more than 3.9 μg/L, and in the Hygienic Standard for Drinking Water, the number is required to be limited to 2 μg/L [13,14,15,16,17].
Effects and endocrine disruption are the two main biological consequences of ATZ. The harmful effects of ATZ on various organisms in nature are mainly manifested in the interference of ATZ in the normal operation of the endocrine system and it causing organisms to produce toxic reactions. From the viewpoint of Sun et al. [18], ATZ with a concentration of 10 mg/L or above inhibited the germination rate of rice seeds. Fu et al. [19] found that an ATZ concentration of 0.125 mg/cm2 inhibited the embryonic development of the red-eared turtle. The research of Benjamin and others [20] showed that ATZ can slow the vertebrae growth of zebra fish. Excessive use of ATZ (greater than 3 mmol/L) can lead to severe head defects in development zebra fish cranial [21,22]. According to the studies by Remayi and others [23], atrazine at 0.2 mg/L and 0.5 mg/L can damage the germ cell lines and spermatogenic tubules of adult frogs, and extensive connective tissue was formed around the spermatogenic tubules. Lin et al. [24] discovered that ATZ can cause ion imbalances in the heart and liver of quails, causing additional harm. Through raising the work of CYP19 enzyme in creatures’ body, ATZ can disrupt the body’s endocrine balance, according to the studies by Beaudoin and others. According to studies by Beaudoin and others, ATZ can disrupt the body’s endocrine equilibrium through raising the action of the CYP19 proteinase among human organisms. [25]. Chao et al.’s research shows that atrazine (ATZ) poses high risks to algae and worms [26].
At present, various improved oxidation processes depending on PS/PMS, such as heat/PS [27], PBS/PMS [28], UV/PS [29], and UV/PMS [30], have been proven to have good degradation effect on ATZ in water. However, heat/PMS heat/PMS degradation of ATZ is rarely researched. Therefore, in PB, the impacts of heat/PMS upon ATZ oxidation degradation under various situations are studied. The process and dynamics of degradation are also investigated, which provides some reference value for further enriching the chemical treatment technology of pesticides containing drainage.

2. Materials and Methods

2.1. Reagents and Instruments

Reagents: All below are analytically pure, including caustic soda, sodium dihydrogen phosphate, sodium nitrite, ETA, tert-butanol (TBA), sodium chloride, baking soda, and potash nitrate. ATZ and PMS were bought on Aladdin.
Instruments: HPLC (2695–2996), electronic balance, UV lamp (Cnlight ZW5D15W-Z150), pH meter (PHSJ-3F), CNC ultrasonic cleaning machine (KH5200DB), Ultrapure Water machine by Youpu, Smart thermostat that saves energy (DC-1030), and isothermal magnetism mixer (78HW-1).

2.2. Experiment Scheme

2.2.1. Solution Preparation

A total of 100 mol/L ATZ reserve liquid was made from water through ultrapure. The water resistivity was 18.24 MΩ cm. The Na H 2 P O 4 solution’s concentration of Na H 2 P O 4 NaOH buffer was 0.2 mol/L. The NaOH solution’s concentration was separated into two parts: 0.2 mol/L and 0.02 mol/L. Concentrations of NaN O 2 , NaCl , NaHC O 3 , and KN O 3 solution were configured to 0.1 mol/L, 1 mol/L, 0.5 mol/L, and 1 mol/L, respectively. PMS solution was set to 0.01 mol/L and kept in a dark place. Concentrations of tert-butyl alcohol and ethanol solution were 8 g/L and with a steady capacity of 1 L. Table 1 demonstrates the pH6, pH7, and pH8 production techniques.

2.2.2. Experiments with a Heat/PMS Degradation Manner for ATZ

Heat/PMS degradation of ATZ in 1.25 mmol/L PB was investigated using a variety of temperature conditions (30, 40, 50, and 60 °C), pH value (6, 7, and 8), PMS concentration (50, 100, 200, and 400 μmol/L), and ATZ concentration (1.25, 2.5, and 5 μmol/L). Various concentrations of tertiary butyl alcohol and ethanol degrade ATZ in different ways. Below a 50 °C water bath, the process of ATZ degradation by various concentrations of TBA and ETA was studied when PB, PMS, and ATZ concentrations were 1.25 mmol/L, 100 μmol/L, and 2.5 μmol/L, accordingly. Effects of typical anions C l , HC O 3 , N O 3 in water upon the ATZ degradation via heat/PMS were studied through adding diverse concentrations of NaCl , NaHC O 3 and NaN O 3 , and 0.1 mol/L of NaN O 2 solution played an ending agent role.

2.3. Analysis Method

ATZ was evaluated via using a Symmetry® C18 LC column. The exact detecting methods are listed below: a 60:40 methyl alcohol to ultrapure water mobile phase ratio, a flow velocity of 0.8 mL/min, operating temperatures of 40 °C, and determinate wavelength of 225 nm.

3. Results and Discussion

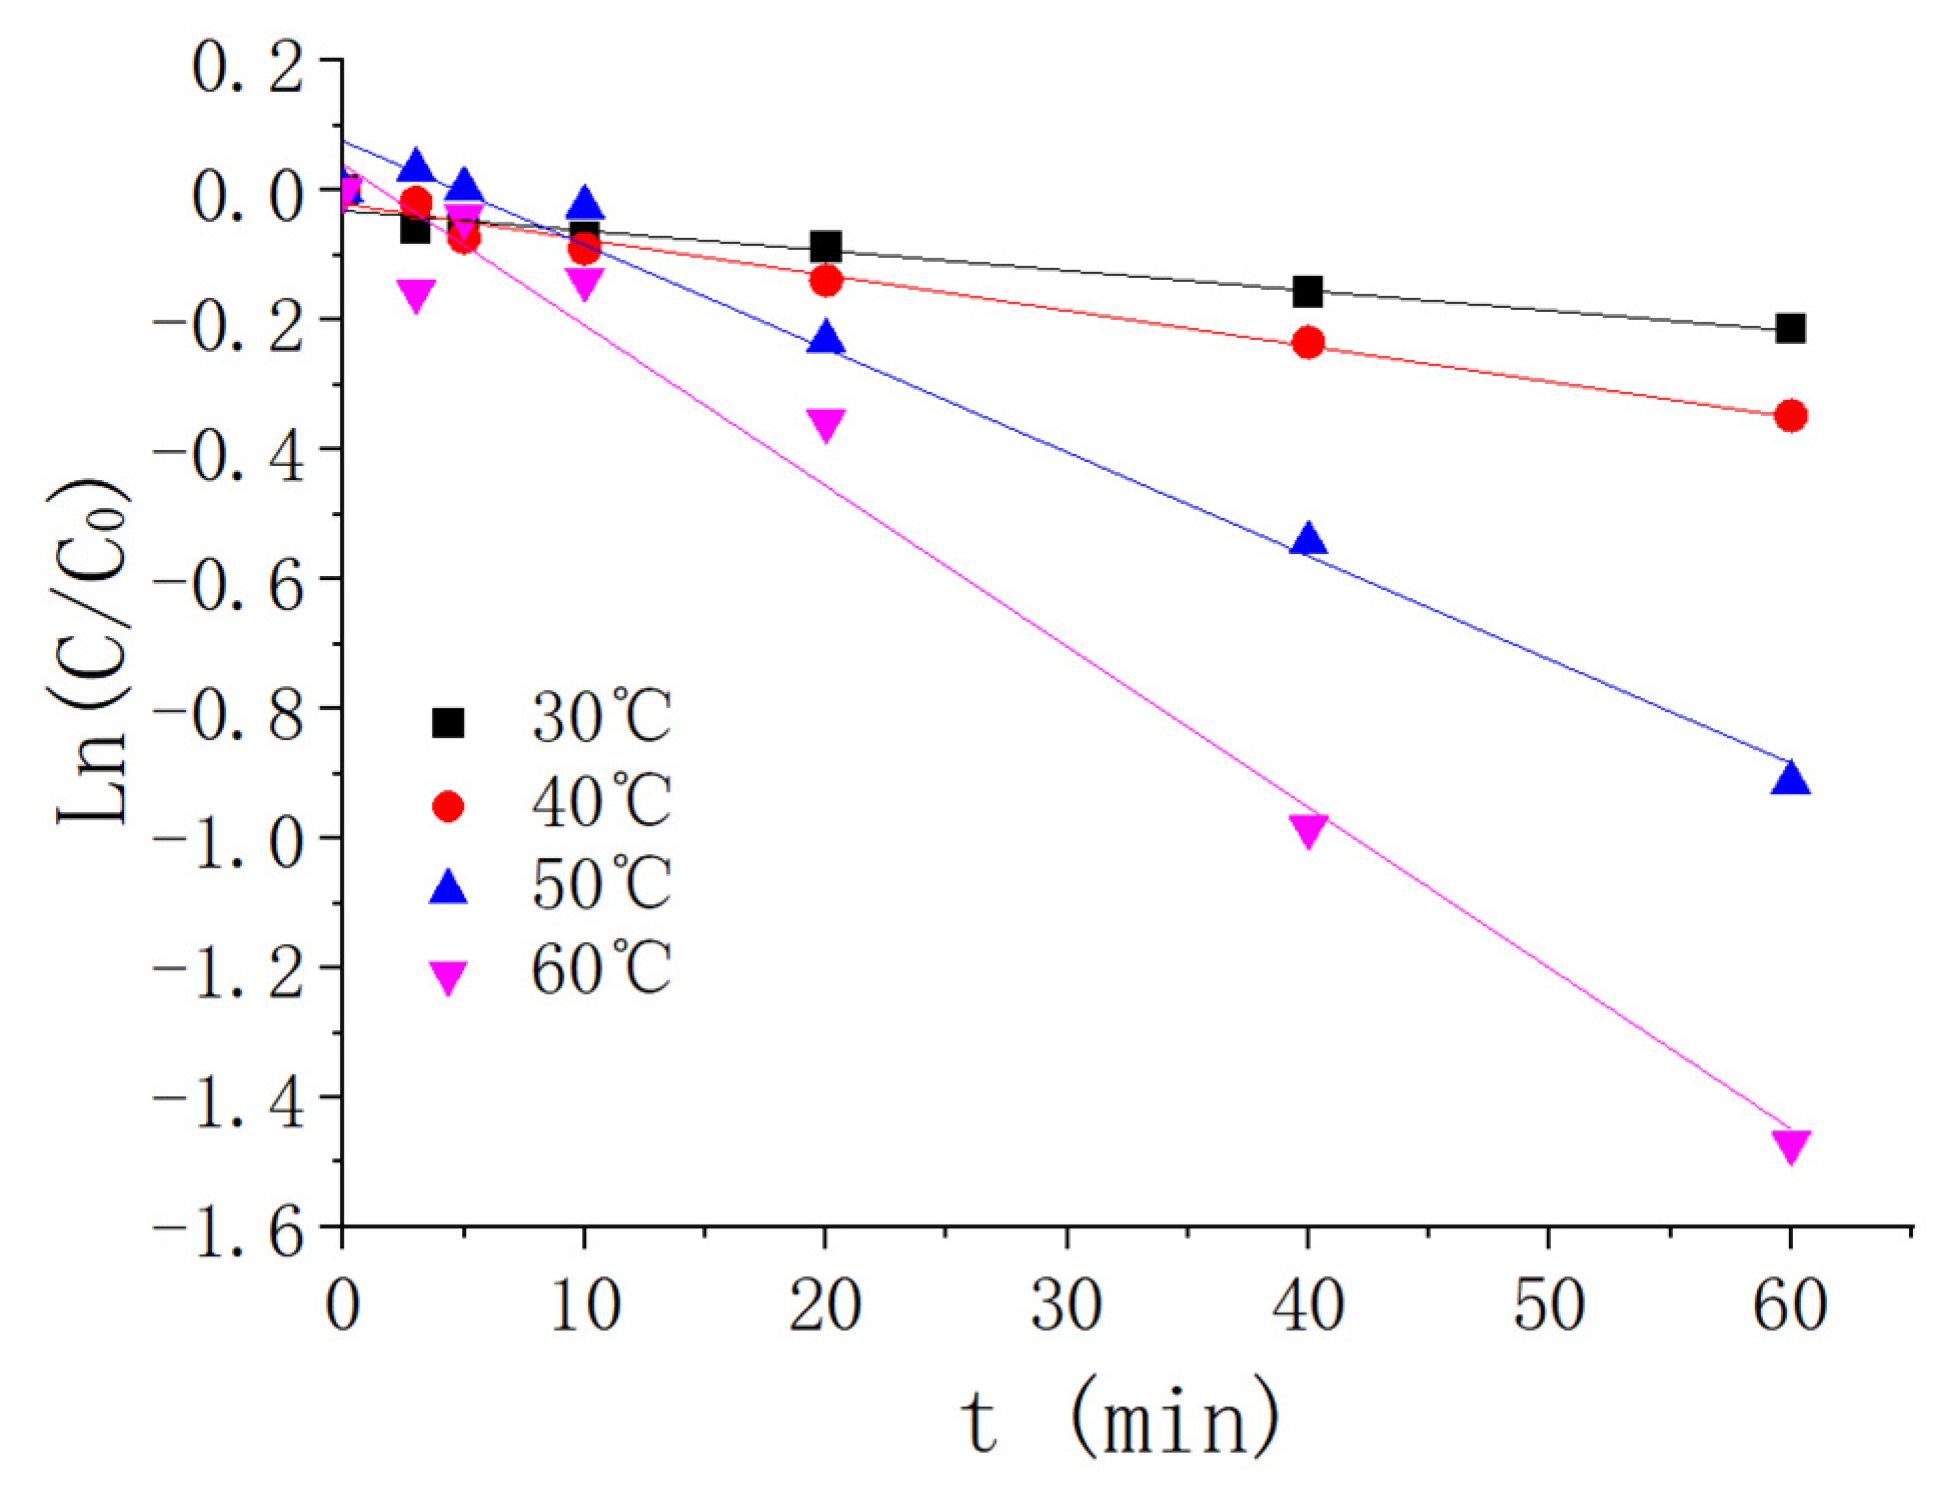
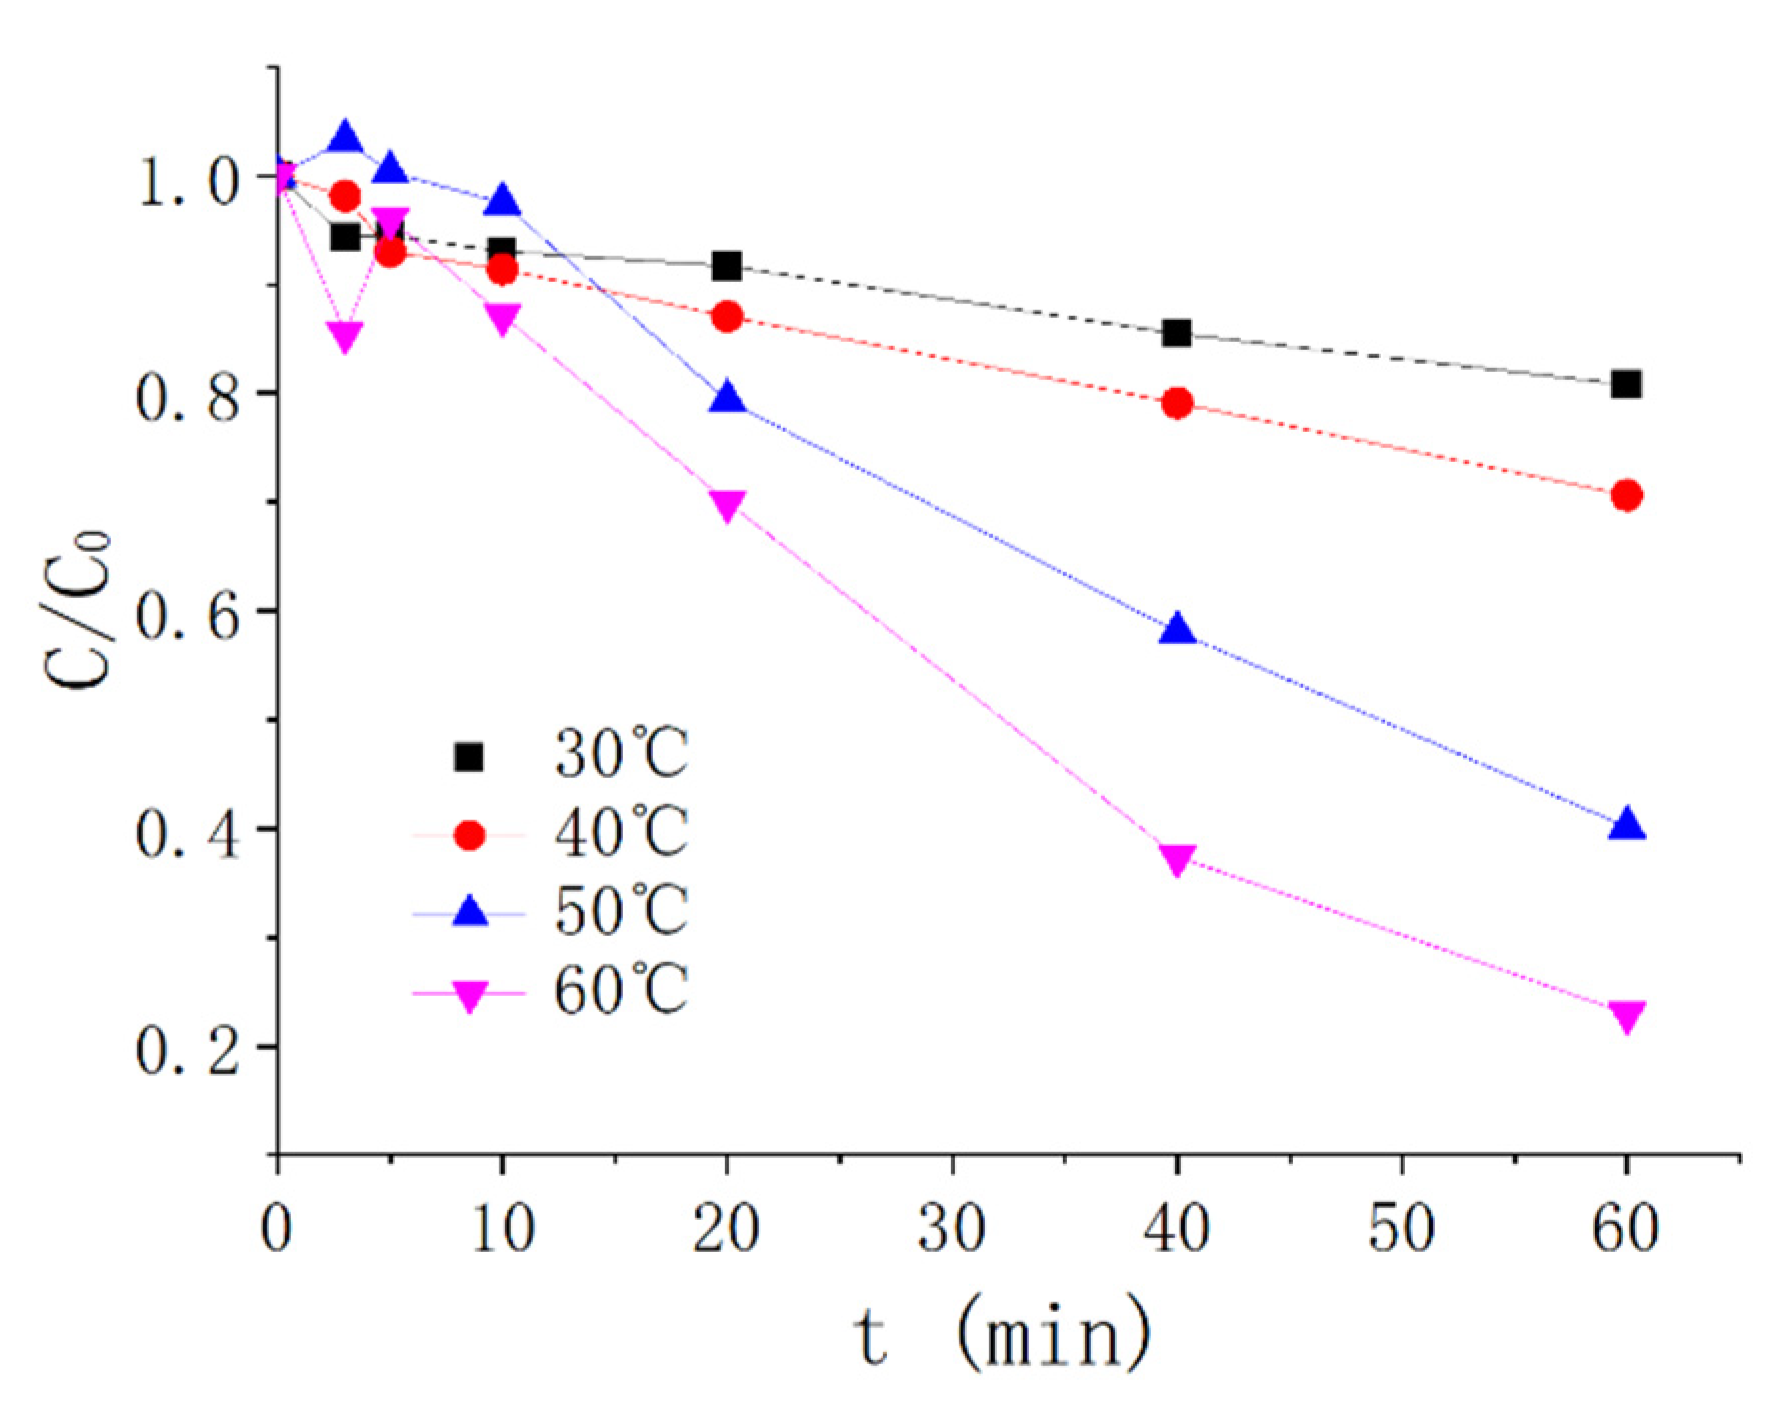
3.1. The Influence of Temperature upon ATZ Degradation via Heat/PMS

In PB of pH = 7, diverse temperatures have an effect upon the ATZ degradation via heat/PMS, which is depicted in Figure 1 as ATZ and PMS concentrations are accordingly 2.5 μmol/L and 100 μmol/L. As Canlan showed in research [31], formula of the kinetics on oxidative degradation of ATZ via heat/PMS is established according to the below kinetic equation, and the first-order-kinetics are,
Ln ( C / C 0 ) = K 1 t
  • C : ATZ concentration at any given time, μmol/L;
  • C 0 : The concentration of ATZ at start, μmol/L;
  • K 1 : The pseudo first-order reaction rate constant, min−1.
As Figure 1 shows, ATZ elimination rate is higher as the temperature increases from 40 °C to 50 °C than as the temperature ranges from 30 °C to 40 °C and 50 °C to 60 °C. The experiments of ATZ degradation via heat/PMS under various temperatures conformed to the quasi-first-order reaction kinetics. As Figure 1 depicts, reaction proceed rises 8.05 times as temperature rises from 30 °C to 60 °C. This is because temperature does have a major effect upon the outcome. As temperature rises, the level of free radicals inside the reaction rises as well, accelerating the degradation of ATZ [32,33]. Also, ATZ elimination rate at various temperatures is given. (See Appendix A, Figure A1).

3.2. The Influence of PMS Concentration upon ATZ Degradation via Heat/PMS

In PB of pH = 7, the effect of diverse PMS concentration upon ATZ degradation via heat/PMS is depicted in Figure 2 as the concentration and temperature of ATZ are 2.5 μmol/L and 50 °C, respectively. According to Figure 2, the experiments of ATZ degradation via heat/PMS under various PMS concentrations all match the pseudo-first-order reaction kinetics. As the reaction concentration increases from 0.050 mmol/L to 0.400 mmol/L, the reaction rate increases 20.19 times. This is mainly because, when other conditions remain unchanged, the higher the concentration of oxidant per unit time, the higher the concentration of free radicals generated by thermal excitation, and then the higher the oxidation efficiency. It can thus be seen that PMS concentration makes a big difference on the degradation of ATZ by heat/PMS. Also, effect of the PMS density on ATZ removal rates is given. (See Appendix A, Figure A2).

3.3. The Impact of pH Value upon ATZ Degradation via Heat/PMS

As the ATZ concentration, PMS concentration, and temperature are 2.5 mol/L, 100 mol/L, and 50 °C, respectively, the influence of different pH on heat/PMS degradation of ATZ is shown in Figure 3. As Figure 3 depicts, as the reaction pH is rising, the action of ATZ degradation via heat/PMS is gradually strengthening. As the reaction pH rises from 6 to 8, ATZ elimination rate increases from 38.94% to 76.37%. The rate of ATZ elimination in an alkaline environment is greater than in an acidic environment. The following are the primary causes: heat can trigger PMS to produce S O 4 and HO (as shown in Equations (1) and (2)), and HO has slightly higher oxidizing ability to ATZ than to S O 4 . S O 4 and HO exhibit secondary reaction rates that are 3 × 10⁹ M−1s−1 [34] and 2.59 × 10⁹ M−1s−1 [35]. The S O 4 has a capacity to interact with any pH of water to generate HO . The reaction rate factor is 8.30 M−1s−1 [36] (as seen in Equations (1)–(3)). However, in alkaline environments, S O 4 can interact with O H to generate HO as well, and the reaction rate factor is 6.50 × 10⁷ M−1s−1 [37] (as shown in Equations (1)–(4)). In most cases, pH alterations have no effect on the production of S O 4 in heat/PMS. Thus, more HO is generated in heat/PMS systems at alkaline environments, and the elimination rate of ATZ in alkaline environment is greater than that under acid environment. As is depicted in Figure 3 and Table 2, the ATZ degradations via heat/PMS experiments under diverse pH value are all in accordance with the pseudo-first-order reaction kinetics. With reaction pH rising from 6 to 8, the reaction rate increases 2.89 times, which indicates that pH value makes a big difference in ATZ degradation via heat/PMS. Also, effect of pH on ATZ removal rates is given. (See Appendix A, Figure A3).
HS O 5 + Heat S O 4 + HO
S O 4 + H 2 O S O 4 2 + H O + H +
  S O 4 + O H S O 4 2 + H O

3.4. The Effect of ATZ Concentration upon the ATZ Degradation via Heat/PMS

Impacts of various ATZ concentrations upon the ATZ degradation via heat/PMS in PB of pH = 7 at 50 °C are depicted in Figure 4 when the PMS concentrations are 2.5 μmol/L and 10 μmol/L. As ATZ concentration rises, the influence of ATZ degradation via heat/PMS has a gradual decline, as is depicted in Figure 4a. As ATZ concentration increases from 1.25 μmol/L to 5 μmol/L, ATZ elimination rate declines from 90.77% to 56.91%. It is worth noting that the ATZ concentration tends to be balanced after 5 min when the concentration of ATZ is 5. This mainly because increasing the ATZ concentration results in the rise of collisions among ATZ with S O 4 and H O in unit time, leading to rapid degradation of ATZ. After the oxidant is used up, the concentration of ATZ tends to equilibrium and does not decrease. As is shown in Figure 4b, the experiments upon the ATZ degradation via heat/PMS with different pH are all in accordance with the pseudo-first-order reaction kinetics. As ATZ concentration rises from 1.25 μmol/L to 2.5 μmol/L, the rate of reaction decreases by 2.45 times. This implies that ATZ concentration greatly affects ATZ degradation via heat/PMS.

3.5. Degradation Mechanism Study of ATZ via Heat/PMS

When the PMS and ATZ concentrations were, accordingly, 10 mol/L and 2.5 mol/L, temperature was 50 °C. The ATZ degradation process via heat/PMS was investigated using a single variable method with 1.25 mmol/L PB solution and pH values of 6, 7, and 8, and the results are shown in Figure 5.
According to Figure 5a, the degradation effect is weak and the degradation rate of ATZ by PB alone is about 3%. The ATZ would not decompose under the 50 °C water bath. Compared with adjusting the initial pH value to 7 with NaOH , using PB with the pH value of 7 has better ATZ degradation effect by heat/PMS. This is largely due to that the pH of system at the start was changed to 7 by NaOH , and the pH measured 4.5 after the reaction, which is similar to the pH gradient degradation effect demonstrated in this paper and will not be repeated here. In addition, PB can activate PMS to create S O 4 and HO [28]. In accordance with studies of Dionysiou et al. [38], the tert-butanol(TBA) reaction rates with HO and S O 4 were 3.8–7.6 × 10⁸ M−1s−1 and 4–9.1 × 10⁵ M−1s−1, while Buxton [39] and others found that ETA reaction rates with HO and S O 4 were, respectively, 1.2–2.8 × 10⁹ M−1s−1 and 1.6–7.7 × 10⁷ M−1s−1. Therefore, when HO and S O 4 cohabit, TBA can catch HO , while ETA can catch HO and S O 4 .
As depicted in Figure 5b–d, the addition of TBA and ETA have an inhibition effect upon the ATZ degradation via heat/PMS, and the inhibition effect of TBA is weaker than ETA. HO and S O 4 cohabit within the heat/PMS system. Maintaining TBA and ETA with the concentration of 64 mg/L, respectively, in PB under pH 6, the ATZ degradation rate via heat/PMS is decreased to 17.44% and 5.04%, indicating that ATZ oxidative degradations by HO and S O 4 are, respectively, 55.21% and 31.84%, and the oxidation ratio of the two is close to 1.7 to 1. Maintaining TBA and ETA with the concentration of 64 mg/L, respectively, in PB under pH 7, the degradation rates of ATZ by heat/PMS decrease to 42.50% and 1.66%, indicating that ATZ oxidative degradations by HO and S O 4 are, respectively, 29.00% and 68.23%, and the oxidation ratio of the two is close to 1 to 2.4. Maintaining TBA and ETA with the concentration of 64 mg/L, respectively, in PB under pH 8, the ATZ degradation rates via heat/PMS decrease to 46.23% and 7.32%, indicating that ATZ oxidative degradation by HO and S O 4 are, respectively, 39.47% and 50.95%, and the oxidation ratio of the two is close to 1 to 1.3. It can be seen from this that under any pH conditions, the oxidative degradation of ATZ via heat/PMS is mostly caused by free radicals, but the dominant free radical types are different under diverse pH conditions.
When the ATZ and PMS concentrations are, respectively, 2.5 μmol/L and 10 μmol/L, and reaction temperature is 20 °C, the degradation effect of ATZ is shown in Figure 5e in PB of 12.5 mmol/L with the pH of 6, 7, and 8. As is depicted in Figure 5e, PMS has no degradation effect on ATZ when adjusting the initial pH of the reaction system to 6, 7, and 8 by NaOH . The degradation rates of ATZ by PMS are, respectively, 11.72%, 13.5%, and 7.87% when the pHs of PB are 6, 7, and 8, respectively. The PMS oxidation mechanism is when the PMS are excited to generate strong oxidizing S O 4 to oxidize and degrade the target, indicating that the PB can excite PMS to generate S O 4 . The overall effects of PMS on ATZ degradation in different PB solutions are listed as follows: degradation is best at pH 7, then followed by pH 6 and pH 8; the degradation effect is only slightly different when the PMS pH measures 6 and 7, indicating that phosphate is more likely to stimulate PMS under acidic conditions, which is consistent with the research by Gu et al. [28].

3.6. The Influence of Typical Anions Concentration in Solutions upon the ATZ Degradation via Heat/PMS

The typical anions’ effects in solutions such as C l , HC O 3 , and N O 3 upon the ATZ degradation via heat/PMS are depicted in Figure 6. The concentrations of PB, PMS, and ATZ were, respectively, 1.25 mmol/L, 10 μmol/L, and 2.5 μmol/L. PB pH value equaled 7. Reaction temperature was 50 °C.
On the basis of Figure 6a–c, HC O 3 shows an inhibition influence on the ATZ degradation by heat/PMS. This is mainly because to produce C O 3 , HC O 3 could fight with ATZ for HO and S O 4 within the heat/PMS system, whose reaction rate is lower than those of HO and S O 4 (as shown in Equations (5)–(7)). The C l and N O 3 both have auxo-action influence upon ATZ degradation within the heat/PMS system at the identical concentration, and the promoting effect of N O 3 is higher than C l . Specific phenomenon behavior is shown below; the ATZ degradation efficiency increased from 59.86% to 80.73% and 94.15%, respectively, after adding C l of 1 mmol/L and N O 3 of 2 mmol/L to the heat/PMS system. It is worth mentioning that the C l shows a promoting effect within the set concentration range, but the promoting effect first increases and then decreases. In addition, the promoting effect is strongest when the concentration is 1 mmol/L. This is largely due to that minor C l could trigger PMS to produce HO and S O 4 [40] to increase the HO and S O 4 concentrations in the heat/PMS system and accelerate the ATZ degradation. When the Cl- increased in the reaction system, C l could fight with ATZ for HO and S O 4 within the heat/PMS system to produce Cl . Reaction rates of HO and S O 4 are higher than those of C l . Thus, it shows an inhibiting effect on the degradation (the main equations are shown in Equations (8) to (12)). S O 4 could react with N O 3 to generate N O 3 (around 2.5 V) whose redox potential is similar to S O 4 , participate in the ATZ degradation to accelerate the PMS decomposition, increase the concentration of HO and S O 4 in the heat/PMS system, and accelerate the ATZ degradation (the main equations are shown in Equations (13) and (14)). The research presented by Ghauch et al. [41] also found that N O 3 can promote the degradation of bisoprolol by heat/PS, which is similar to the experimental phenomenon. As shown in Figure 6d, comparing with HC O 3 of the same concentration, ETA has a slightly stronger inhibitory influence upon ATZ degradation via heat/PMS; it reduced the ATZ degradation rate to 7.06% and 11.56%, respectively. The additions of C l and N O 3 increase the maximum rate of ATZ degradation by 62.94% and 189.31%, respectively. The reaction is shown in formulas (5)–(14) [36,42,43,44,45,46,47,48,49].
HO + HC O 3 C O 3 + H 2 O ,   K = 8.60 × 10 6   M 1 s 1
S O 4 + HC O 3 C O 3 + HS O 4 , K = 2.80 × 10 6   M 1 s 1
C O 3 + ATZ products ,   K = 6.20 × 10 6   M 1 s 1
HO + C l ClO H , K = 4.30 × 10 9   M 1 s 1
ClO H + C l C l 2 + O H , K = 1.0 × 10 5   M 1 s 1
S O 4 + C l Cl + S O 4 2 , K = 3.0 × 10 9   M 1 s 1
Cl + C l C l 2 , K = 8.50 × 10 9   M 1 s 1
C l 2 + ATZ products , K = 5.0 × 10 4   M 1 s 1
S O 4 + N O 3 N O 3 + S O 4 2 , K = 5.0 × 10 4   M 1 s 1
N O 3 + ATZ products

3.7. The AZT Degradation Products via Heat/PMS and Degradation Path Analysis

The ATZ degradation products via heat/PMS were studied and the degradation path was inferred by HPLC-ESI-MS (cationic pattern). Three samples were taken from 5, 20, and 60 min during the experiment, and first-order mass spectrometry was performed for total ion and extraction ion analysis.
It can be seen from the mass spectra, total ion flow diagram, and extract ionic flow diagram of the three samples that the charge mass ratio of the main ATZ degradation products are 128, 146, 174, 188, 198, 214, and 232 [30,31,50,51], and so on. ATZ has a relative molecular mass of 216. ATZ has a molecular mass 42 more than m/z174, and the molecular mass of isopropyl is exactly 42, so m/z174 is considered as deisopropyl ATZ (deisopropyl atrazine, DIA). ATZ has a molecular mass 28 more than m/z188 and the molecular mass of ethyl is exactly 28, so m/z188 is considered as desetyleatrazine ATZ (desetyleatrazine, DEA). M/z174 has a molecular mass 28 more than m/z146, and the molecular mass of ethyl is exactly 28; m/z188 has a molecular mass 42 more than m/z146, and the molecular mass of isopropyl is exactly 42. Therefore, m/z146 is considered as deethylation deisopropyl ATZ (deethylation deisopropyl atrazine, DEIA). m/z146 has a molecular mass 18 more than m/z128. Thus m/z128 is considered as chlorine ions of DEIA replaced by hydroxyl groups, 2-hydroxy-4,6-diaminoATZ (deethylation deisopropyl hydroxy atrazine, DEIHA). ATZ has a molecular mass 18 more than m/z198. Therefore, it is considered that in the ATZ degradation procedure, hydroxyl groups replaced the Cl atoms to generate 2-hydroxy ATZ (hydroxy atrazine, HA). ATZ has a molecular mass 16 less than m/z232 and the molecular mass of hydroxy is exactly 16. Therefore, it is considered that in the ATZ degradation procedure, a hydroxyl group replaced a hydrogen atom to generate 2-chloro-4-hydroxy-ethylene-6-isopropyl ATZ (2-Chloro-4-hydroxyethylamino-6-isopropylatrazine, CHEIA). m/z232 has a molecular mass 18 more than m/z214, so m/z128 is considered as the further dehydration and degradation product of CHEIA, 2-Chloro-4-vinylamino-6-isopropylamino ATZ (2-Chloro-4-vinylamino-6-isopropylamino atrazine, CVIA). m/198 has a molecular mass 16 less than m/z 214, so m/z214 is considered to be the product of hydroxyl substituting one of the hydrogen atoms in HA, 2,4-dihydroxy ATZ (dihydroxy atrazine, DHA).
This shows that the ATZ degradation via heat/PMS is primarily accomplished through by dealkylation and dechlorination, which matches the findings of Ji et al. [52]. Figure 7 depicts the degradation method of ATZ.

4. Conclusions

The ATZ degradation in PB via heat/PMS was investigated by the methods of experiment and kinetics modeling. The degradation mechanism, oxidation kinetics, and degradation products were studied. The following are the main findings of this paper. The ATZ degradation efficiency of heat/PMS is proportional to temperature and PMS concentration but inversely proportional to ATZ concentration. PB is more favorable to ATZ degradation under alkaline environments. Acidic environments are more favorable for PB to stimulate PMS. HO and S O 4 cohabit within heat/PMS system. ATZ degradation via heat/PMS is mainly free radical oxidative degradation under any pH conditions, but the dominant free radical types are different under different pH conditions. HC O 3 has repressive impacts on the degradation of ATZ. Both C l and N O 3 show facilitating effects on the ATZ degradation via heat/PMS, and the stimulating impact of N O 3 is more remarkable. ATZ degradation kinetics via heat/PMS corresponds with quasi-first-order reaction kinetics. Dealkylation and dechlorination are the key mechanisms through which ATZ is degraded via heat/PMS. A total of eight products of seven mass-to-charge ratio were found by the product analysis.
The degradation of atrazine by UV/PMS and US/PMS, and even the degradation of atrazine by thermal-activated persulfate, has been studied. However, there are few studies on the degradation mechanism of atrazine by heat/PMS system in PB. In this paper, the mechanism was obtained through the study of the system, and it was found that PB in alkaline condition can promote the degradation of ATZ by heat/PMS more than PB in acidic condition. The important conclusions are that PB is more likely to stimulate PMS in acidic conditions than in alkaline conditions, and that PB alone can stimulate PMS, which offers a breakthrough and contribution to previous studies and lays a foundation for subsequent studies.
Atrazine is not easy to degrade, and it can exist stably in aqueous environments for a long time, which not only affects the survival of animals and plants, but also threatens human health. Most studies do not clarify the types and hazards of ATZ degradation intermediates. Therefore, paying attention to the degradation efficiency of atrazine while taking into account the toxicity of intermediate degradation products is of great significance for optimizing ATZ degradation technology, which is also one of the future development directions.

Author Contributions

Conceptualization, Y.L. (Yixin Lu) and J.C.; data curation, G.L.; formal analysis, Y.L. (Yujie Liu); funding acquisition, Y.L. (Yixin Lu); methodology, C.T., Y.L. (Yixin Lu); supervision, G.L.; visualization, Y.L. (Yujie Liu); writing—original draft, Y.L. (Yixin Lu); writing—review and editing, J.C. All authors have read and agreed to the published version of the manuscript.

Funding

This research was funded by the Science and Technology Project of Sichuan Province, grant number: 22ZDYF2880, 22YYJC3490; Open Fund of State Environmental Protection Key Laboratory of Synergetic Control and Joint Remediation for Soil & Water Pollution, grant number: GHBK-2021-004; School Level Project of Chengdu Technological University, grant number: 2021ZR020, QM2021003, QM2021034, QM2021064, QM2021080; National Innovation Training Program for College Students, grant number: S202011116015, S202011116031.

Institutional Review Board Statement

Not applicable.

Informed Consent Statement

Not applicable.

Data Availability Statement

Data are contained within the article.

Conflicts of Interest

The authors declare no conflict of interest.

Appendix A. Single Factor Influence Diagram

As Figure A1 shows, the influence of degradation of ATZ via heat/PMS is increasing as the reaction temperature is rising. ATZ elimination rate improves from 19.22 percent to 77.01 percent as reaction temperature increases from 40 °C to 50 °C.
Figure A1. ATZ elimination rate at various temperatures ( C 0 = 2.5 μmol/L).
Processes 10 00941 g0a1
As Figure A2 depicts, the ATZ degradation is remarkably increasing as the PMS concentration increases. The ATZ elimination rate increases from 10.95% to 96.28% as the system’s PMS concentration increases from 0.050 mmol/L to 0.400 mmol/L. Moreover, ATZ elimination rate increased most significantly as the PMS concentration improved from 0.050 mmol/L to 0.100 mmol/L.
Figure A2. Effect of the PMS density on ATZ removal rates ( C 0 = 2.5 μmol/L). Experimental findings.
Processes 10 00941 g0a2
As Figure A3 depicts, as the reaction pH rises from 6 to 8, ATZ elimination rate increases from 38.94% to 76.37%.
Figure A3. Effect of pH on ATZ removal rates ( C 0 = 2.5 μmol/L). Experimental findings.
Processes 10 00941 g0a3

References

  1. Saber, Z.; van Zelm, R.; Pirdashti, H.; Schipper, A.M.; Esmaeili, M.; Motevali, A.; Nabavi-Pelesaraei, A.; Huijbregts, M.A. Understanding farm-level differences in environmental impact and eco-efficiency: The case of rice production in Iran. J. Sustain. Prod. Consum. 2021, 27, 1021–1029. [Google Scholar] [CrossRef]
  2. Tang, L.; Hayashi, K.; Inao, K.; Birkved, M.; Bruun, S.; Kohyama, K.; Shimura, M. Developing a management-oriented simulation model of pesticide emissions for use in the life cycle assessment of paddy rice cultivation. Sci. Total Environ. 2020, 716, 137034. [Google Scholar] [CrossRef]
  3. Singh, B.; Singh, K. Microbial degradation of herbicides. Crit. Rev. Microbiol. 2016, 42, 245–261. [Google Scholar] [CrossRef]
  4. Esparza-Naranjo, S.B.; da Silva, G.F.; Duque-Castaño, D.C.; Araújo, W.L.; Peres, C.K.; Boroski, M.; Bonugli-Santos, R.C. Potential for the Biodegradation of Atrazine Using Leaf Litter Fungi from a Subtropical Protection Area. Curr. Microbiol. 2021, 78, 358–368. [Google Scholar] [CrossRef] [PubMed]
  5. Supraja, P.; Tripathy, S.; Krishna Vanjari, S.R.; Singh, V.; Singh, S.G. Label free, electrochemical detection of atrazine using electrospun Mn2O3 nanofibers: Towards ultrasensitive small molecule detection. Sens. Actuators B Chem. 2019, 285, 317–325. [Google Scholar] [CrossRef]
  6. Yan, P.; Jin, Y.; Xu, L.; Mo, Z.; Qian, J.; Chen, F.; Yuan, J.; Xu, H.; Li, H. Enhanced photoelectrochemical aptasensing triggered by nitrogen deficiency and cyano group simultaneously engineered 2D carbon nitride for sensitively monitoring atrazine. Biosens. Bioelectron. 2022, 206, 114144. [Google Scholar] [CrossRef] [PubMed]
  7. Huang, H.; Zhang, C.; Zhang, P.; Cao, M.; Xu, G.; Wu, H.; Zhang, J.; Li, C.; Rong, Q. Effects of biochar amendment on the sorption and degradation of atrazine in different soils. Soil Sediment Contam. Int. J. 2018, 27, 643–657. [Google Scholar] [CrossRef]
  8. Majewska, M.; Harshkova, D.; Pokora, W.; Bascik-Remisiewicz, A.; Tulodziecki, S.; Aksmann, A. Does diclofenac act like a photosynthetic herbicide on green algae? Chlamydomonas reinhardtii synchronous culture-based study with atrazine as reference. Ecotoxicol. Environ. Saf. 2021, 208, 111630. [Google Scholar] [CrossRef]
  9. Li, P.; Yao, L.Y.; Jiang, Y.J.; Wang, D.D.; Wang, T.; Wu, Y.P.; Li, B.X.; Li, X.T. Soybean isoflavones protect SH-SY5Y neurons from atrazine-induced toxicity by activating mitophagy through stimulation of the BEX2/BNIP3/NIX pathway. Ecotoxicol. Environ. Saf. 2021, 227, 112886. [Google Scholar] [CrossRef]
  10. Bui, H.; Pham, V.H.; Pham, V.D.; Pham, T.B.; Nguyen, T.V. Development of nano-porous silicon photonic sensors for pesticide monitoring. Dig. J. Nanomater. Biostruct. 2018, 13, 57–65. [Google Scholar]
  11. Zhang, C.-j.; Si, S.; Yang, Z. Design of molecularly imprinted TiO2/carbon aerogel electrode for the photoelectrochemical determination of atrazine. Sens. Actuators B Chem. 2015, 211, 206–212. [Google Scholar] [CrossRef]
  12. Beaulieu, M.; Cabana, H.; Taranu, Z.; Huot, Y. Predicting atrazine concentrations in waterbodies across the contiguous United States: The importance of land use, hydrology, and water physicochemistry. Limnol. Oceanogr. 2020, 65, 2966–2983. [Google Scholar] [CrossRef]
  13. Institute of Environmental and Health-Related Product Safety, Chinese Center for Disease Control and Prevention. Hygienic Standards for Drinking Water; Ministry of Health, Standardization Administration of China: Beijing, China, 2006; p. 16.
  14. Ouyang, W.; Zhang, Y.; Lin, C.; Wang, A.; Tysklind, M.; Wang, B. Metabolic process spatial partition dynamics of Atrazine in an estuary-to-bay system, Jiaozhou bay. J. Hazard Mater. 2021, 414, 125530. [Google Scholar] [CrossRef] [PubMed]
  15. Sun, X.; Liu, F.; Shan, R.; Fan, Y. Spatiotemporal distributions of Cu, Zn, metribuzin, atrazine, and their transformation products in the surface water of a small plain stream in eastern China. Environ. Monit. Assess. 2019, 191, 433. [Google Scholar] [CrossRef]
  16. Zhang, Y.; Zhang, H.; Yang, M. Profiles and risk assessment of legacy and current use pesticides in urban rivers in Beijing, China. Environ. Sci. Pollut. Res. Int. 2021, 28, 39423–39431. [Google Scholar] [CrossRef]
  17. Zheng, Q.; Wang, W.; Liu, S.; Zhang, Z.; Qu, S.; Li, F.; Wang, C.; Li, W. Modeling colloid-associated atrazine transport in sand column based on managed aquifer recharge. Environ. Earth Sci. 2018, 77, 667. [Google Scholar] [CrossRef]
  18. Sun, J.T.; Pan, L.L.; Zhan, Y.; Tsang, D.C.W.; Zhu, L.Z.; Li, X.D. Atrazine contamination in agricultural soils from the Yangtze River Delta of China and associated health risks. Environ. Geochem. Health 2017, 39, 369–378. [Google Scholar] [CrossRef]
  19. Fu, L.; Ni, J.; Ruan, Y.; Dong, R.; Shi, H. Effects of Atrazine on Embryonic Development and Histological Structure of Liver and Kidney in Red-eared Turtle(Trachemys scripta elegans). Fish. Sci. 2017, 36, 104–108. [Google Scholar]
  20. Walker, B.S.; Kramer, A.G.; Lassiter, C.S. Atrazine affects craniofacial chondrogenesis and axial skeleton mineralization in zebrafish (Danio rerio). Toxicol. Ind. Health 2018, 34, 329–338. [Google Scholar] [CrossRef]
  21. Hanson, M.L.; Solomon, K.R.; Van Der Kraak, G.J.; Brian, R.A. Effects of atrazine on fish, amphibians, and reptiles: Update of the analysis based on quantitative weight of evidence. Crit. Rev. Toxicol. 2019, 49, 670–709. [Google Scholar] [CrossRef]
  22. Huang, W.; Wu, T.; Au, W.W.; Wu, K. Impact of environmental chemicals on craniofacial skeletal development: Insights from investigations using zebrafish embryos. Environ. Pollut. 2021, 286, 117541. [Google Scholar] [CrossRef]
  23. Rimayi, C.; Odusanya, D.; Weiss, J.M.; de Boer, J.; Chimuka, L.; Mbajiorgu, F. Effects of environmentally relevant sub-chronic atrazine concentrations on African clawed frog (Xenopus laevis) survival, growth and male gonad development. Aquat. Toxicol. 2018, 199, 1–11. [Google Scholar] [CrossRef]
  24. Lin, J.; Li, H.-X.; Qin, L.; Du, Z.-H.; Xia, J.; Li, J.-L. A novel mechanism underlies atrazine toxicity in quails (Coturnix Coturnix coturnix): Triggering ionic disorder via disruption of ATPases. Oncotarget 2016, 7, 83880. [Google Scholar] [CrossRef] [PubMed] [Green Version]
  25. Caron-Beaudoin, E.; Denison, M.S.; Sanderson, J.T. Effects of Neonicotinoids on Promoter-Specific Expression and Activity of Aromatase (CYP19) in Human Adrenocortical Carcinoma (H295R) and Primary Umbilical Vein Endothelial (HUVEC) Cells. Toxicol. Sci. 2016, 149, 134–144. [Google Scholar] [CrossRef] [PubMed] [Green Version]
  26. Su, C.; Cui, Y.; Liu, D.; Zhang, H.; Baninla, Y. Endocrine disrupting compounds, pharmaceuticals and personal care products in the aquatic environment of China: Which chemicals are the prioritized ones? Sci. Total Environ. 2020, 720, 137652. [Google Scholar] [CrossRef]
  27. Wang, W.; Chen, M.; Wang, D.; Yan, M.; Liu, Z. Different activation methods in sulfate radical-based oxidation for organic pollutants degradation: Catalytic mechanism and toxicity assessment of degradation intermediates. Sci. Total Environ. 2021, 772, 145522. [Google Scholar] [CrossRef] [PubMed]
  28. Wang, W.; Chen, M.; Wang, D.; Yan, M.; Liu, Z. On peroxymonosulfate-based treatment of saline wastewatser: When phosphate and chloride co-exist. RSC Adv. 2018, 8, 13865–13870. [Google Scholar]
  29. Cui, J.Z.; Cai, S.K.; Zhang, S.R.; Wang, G.Q.; Gao, C.Z. Degradation of a non-oxidizing biocide in circulating cooling water using UV/persulfate: Kinetics, pathways, and cytotoxicity. Chemosphere 2022, 289, 133064. [Google Scholar] [CrossRef]
  30. Cui, J.Z.; Cai, S.K.; Zhang, S.R.; Wang, G.Q.; Gao, C.Z. Degradation of Atrazine by UV/PMS in Phosphate Buffer. Pol. J. Environ. Stud. 2019, 28, 2735–2744. [Google Scholar]
  31. Jiang, C.; Yang, Y.; Zhang, L.; Lu, D.; Lu, L.; Yang, X.; Cai, T. Degradation of Atrazine, Simazine and Ametryn in an arable soil using thermal-activated persulfate oxidation process: Optimization, kinetics, and degradation pathway. J. Hazard Mater. 2020, 400, 123201. [Google Scholar] [CrossRef]
  32. Wu, S.; Li, H.; Li, X.; He, H.; Yang, C. Performances and mechanisms of efficient degradation of atrazine using peroxymonosulfate and ferrate as oxidants. Chem. Eng. J. 2018, 353, 533–541. [Google Scholar] [CrossRef]
  33. Zhang, H.; Liu, X.; Lin, C.; Li, X.; Zhou, Z.; Fan, G.; Ma, J. Peroxymonosulfate activation by hydroxylamine-drinking water treatment residuals for the degradation of atrazine. Chemosphere 2019, 224, 689–697. [Google Scholar] [CrossRef] [PubMed]
  34. Lutze, H.V.; Stephanie, B.; Insa, R.; Nils, K.; Rani, B.; Melanie, G.; Clemens, V.S.; Schmidt, T.C. Degradation of chlorotriazine pesticides by sulfate radicals and the influence of organic matter. Environ. Sci. Technol. 2015, 49, 1673. [Google Scholar] [CrossRef] [PubMed]
  35. Khan, J.A.; He, X.; Shah, N.S.; Khan, H.M.; Hapeshi, E.; Fatta-Kassinos, D.; Dionysiou, D.D. Kinetic and mechanism investigation on the photochemical degradation of atrazine with activated H2O2, S2O82− and HSO5. Chem. Eng. J. 2014, 252, 393–403. [Google Scholar] [CrossRef]
  36. Luo, C.; Ma, J.; Jiang, J.; Liu, Y.; Song, Y.; Yang, Y.; Guan, Y.; Wu, D. Simulation and comparative study on the oxidation kinetics of atrazine by UV/H2O2, UV/HSO5 and UV/S2O82. Water Res. 2015, 80, 99–108. [Google Scholar] [CrossRef]
  37. Hayon, E.; Treinin, A.; Wilf, J. Electronic spectra, photochemistry, and autoxidation mechanism of the sulfite-bisulfite-pyrosulfite systems. The SO2, SO3, SO4, and SO5 radicals. J. Am. Chem. Soc. 1972, 94, 47–57. [Google Scholar] [CrossRef]
  38. Anipsitakis, G.P.; Dionysiou, D.D. Radical generation by the interaction of transition metals with common oxidants. Environ. Sci. Technol. 2004, 38, 3705. [Google Scholar] [CrossRef]
  39. Buxton, G.V.; Greenstock, C.L.; Helman, W.P.; Ross, A.B. Critical review of rate constants for reactions of hydrated electrons, hydrogen atoms and hydroxyl radicals ( OH/ O in aqueous solution. J. Phys. Chem. Ref. Data 1988, 17, 513–886. [Google Scholar] [CrossRef] [Green Version]
  40. Yang, S.; Wang, P.; Yang, X.; Shan, L.; Zhang, W.; Shao, X.; Niu, R. Degradation efficiencies of azo dye Acid Orange 7 by the interaction of heat, UV and anions with common oxidants: Persulfate, peroxymonosulfate and hydrogen peroxide. J. Hazard. Mater. 2010, 179, 552–558. [Google Scholar] [CrossRef]
  41. Ghauch, A.; Tuqan, A.M. Oxidation of bisoprolol in heated persulfate/H2O systems: Kinetics and products. Chem. Eng. J. 2012, 183, 162–171. [Google Scholar] [CrossRef]
  42. Buxton, G.V.; Salmon, G.A.; Wood, N.D. A Pulse Radiolysis Study of the Chemistry of Oxysulphur Radicals in Aqueous Solution. In Physico-Chemical Behaviour of Atmospheric Pollutants; Springer: New York, NY, USA, 1990; pp. 245–250. [Google Scholar]
  43. Huie, R.E.; Clifton, C.L. Temperature dependence of the rate constants for reactions of the sulfate radical, SO4, with anions. J. Phys. Chem. 1990, 94, 8561–8567. [Google Scholar] [CrossRef]
  44. Huang, J.; Mabury, S.A. A new method for measuring carbonate radical reactivity toward pesticides. Environ. Toxicol. Chem. Int. J. 2000, 19, 1501–1507. [Google Scholar] [CrossRef]
  45. Jayson, G.G.; Parsons, B.J.; Swallow, A.J. Some simple, highly reactive, inorganic chlorine derivatives in aqueous solution. Their formation using pulses of radiation and their role in the mechanism of the Fricke dosimeter. J. Chem. Soc. Faraday Trans. 1 Phys. Chem. Condens. Phases 1973, 69, 1597–1607. [Google Scholar] [CrossRef]
  46. Grigor’ev, A.E.; Makarov, I.E.; Pikaev, A.K. Formation of Cl2in the bulk of solution during radiolysis of concentrated aqueous solutions of chlorides. Khimiya Vysok. Ehnergij 1987, 21, 123–126. [Google Scholar]
  47. Das, T.N. Reactivity and role of SO5•radical in aqueous medium chain oxidation of sulfite to sulfate and atmospheric sulfuric acid generation. J. Phys. Chem. A 2001, 105, 9142–9155. [Google Scholar] [CrossRef]
  48. Yu, X.-Y.; Barker, J.R. Hydrogen peroxide photolysis in acidic aqueous solutions containing chloride ions. II. Quantum yield of HO•(Aq) radicals. J. Phys. Chem. A 2003, 107, 1325–1332. [Google Scholar] [CrossRef]
  49. Gao, Y.Q.; Gao, N.Y.; Deng, Y.; Yin, D.Q.; Zhang, Y.S. Florfenicol Water by UV/Na2S2O8 process. Environ. Sci. Pollut. Res. Int. 2015, 22, 8693–8701. [Google Scholar] [CrossRef]
  50. Lu, Y.; Xu, W.; Nie, H.; Zhang, Y.; Deng, N.; Zhang, J. Mechanism and Kinetic Analysis of Degradation of Atrazine by US/PMS. Int. J. Environ. Res. Public Health 2019, 16, 1781. [Google Scholar] [CrossRef] [Green Version]
  51. Wang, G.; Cheng, C.; Zhu, J.; Wang, L.; Gao, S.; Xia, X. Enhanced degradation of atrazine by nanoscale LaFe1-xCuxO3-delta perovskite activated peroxymonosulfate: Performance and mechanism. Sci. Total Environ. 2019, 673, 565–575. [Google Scholar] [CrossRef]
  52. Ji, Y.; Dong, C.; Kong, D.; Lu, J.; Zhou, Q. Heat-activated persulfate oxidation of atrazine: Implications for remediation of groundwater contaminated by herbicides. Chem. Eng. J. 2015, 263, 45–54. [Google Scholar] [CrossRef]
Figure 1. ATZ degradation kinetics curves under diverse temperature ( C 0 = 2.5 μmol/L).
Processes 10 00941 g001
Figure 2. Effect of the PMS density on ATZ removal rates ( C 0 = 2.5 μmol/L). The ATZ degradation kinetics curves.
Processes 10 00941 g002
Figure 3. The kinetics of quasi-first-order reactions of heat/PMS degradation of ATZ at different pH values.
Processes 10 00941 g003
Figure 4. Effect of ATZ density ( C 0 ) on ATZ removal rates: (a) experimental results; (b) the ATZ degradation kinetics curves.
Processes 10 00941 g004
Figure 5. (a) Analysis of each component’s oxidation impact upon the heat/PMS system. (b) The impact of TBA and ETA upon ATZ degradation via heat/PMS in PB of pH = 6. (c) The impact of TBA and ETA upon ATZ degradation via heat/PMS in PB of pH = 7. (d) The impact of TBA and ETA upon heat/PMS degradation ATZ in PB of pH = 8. (e) The impact of phosphate buffer upon the degradation of ATZ via PMS alone.
Processes 10 00941 g005aProcesses 10 00941 g005b
Figure 6. (a) The impact of C l upon the ATZ degradation via heat/PMS in PB of PH = 7. (b) The impact of HC O 3 upon ATZ degradation via heat/PMS in PB of pH = 7. (c) The impact of N O 3 upon ATZ degradation via heat/PMS in PB of pH = 7. (d) The kinetics of quasi-first-order reaction of heat/PMS degradation ATZ.
Processes 10 00941 g006
Figure 7. The possible degradation pathway of ATZ.
Processes 10 00941 g007
Table 1. Manner of Na H 2 P O 4 NaOH buffer preparing.
pH0.2 mol/L
Na H 2 P O 4 (mL)
0.2   mol / L   NaOH (mL)
625028.50
7250148.15
8250244.00
Table 2. The kinetics equations and parameters of quasi-first-order reactions of heat/PMS degradation of ATZ at various pH.
pHKinetic Equationt1/2 (min)Kobs (min−1)R2
6Ln(C/C0) = −0.00816t − 0.0116684.90.001850.99775
7Ln(C/C0) = −0.01600t − 0.0757143.30.016000.98355
8Ln(C/C0) = −0.02362t − 0.0139429.30.023620.98119
Publisher’s Note: MDPI stays neutral with regard to jurisdictional claims in published maps and institutional affiliations.

