Article

Structure-Dependent Eco-Toxicity of Vegetable Tannin

1
The Key Laboratory of Leather Chemistry and Engineering of Ministry of Education, Sichuan University, Chengdu 610065, China
2
National Engineering Laboratory for Clean Technology of Leather Manufacture, Sichuan University, Chengdu 610065, China
*
Author to whom correspondence should be addressed.
Processes 2022, 10(5), 816; https://doi.org/10.3390/pr10050816
Submission received: 30 March 2022 / Revised: 18 April 2022 / Accepted: 19 April 2022 / Published: 21 April 2022

Abstract

:
Vegetable tannin is widely applied in various industries, in agriculture, and in water treatment as a natural polyphenolic compound; however, little data has been collected concerning the relationship between structure and eco-toxicity. Here, the toxicity of six commercial tannin and three model chemicals was assessed using Photobacterium phosphoreum. Two kinds of hydrolyzed tannin displayed higher bioluminescence inhibition than four kinds of condensed tannin, and the model chemical of hydrolyzed tannin also showed greater toxicity than those of condensed tannin, indicating the structure dependent eco-toxicity of vegetable tannin. The reactive toxicity mechanism was proposed, which was illustrated by molecular simulations based on the model chemicals and luciferase.

1. Introduction

Vegetable tannin is a series of natural polyphenolic compounds with molecular weights from 500 to 20,000 Da [1,2,3], which can be divided into hydrolyzed tannin and condensed tannin according to molecular structure [4]. Hydrolyzed tannin is polyester composed of sugar and organic acid [5]. Condensed tannin is also called proanthocyanidin, and oligomer or polymer of two or more catechins (flavan-3-ols). The structure of typical vegetable tannin is shown in Figure 1 [5,6].
Tannin is widely applied in various industries, in agriculture, and in medicine [6]. Vegetable tannin in the range of 350,000–400,000 tons is used across the word for leather processing as a tanning agent to transform raw hides or skins into leather [7]. In general, excessive tannin is added during the manufacturing in order to obtain better driving force for penetrating and bonding on the collagen fibers, and only about 85% is absorbed in the conventional vegetable tanning system [8,9]. This means that 60,000–80,000 tons of vegetable tannin is discharged in 1,000,000–1,500,000 m3 of spent vegetable tanning liquor in effluent [10]. In addition, vegetable tannin has been widely applied as friendly natural coagulants in the water treatment process [11]. However, some pioneer studies have found tannin in waste water is difficult to biodegrade, and tannin removals only reach 50% after 9.8–12.6 days [12]. Then ecological risk assessment is necessary to clarify the environmental impact of vegetable tannin.
Many researchers have reported the adverse effects of some kinds of vegetable tannin towards various sea organisms such as marine bacterium [13,14], marine microalga [15,16], and sea urchins [17,18]. However, most of them focused on individual hydrolyzed tannin, condensed tannin, or tannin extract from tree bark. For example, Nicola et al. found mimosa tannin could induce hormesis/toxicity in sea urchins’ early development and in algal growth [17,18], and the toxicity of hydrolyzed tannin such as tannin acid toward the marine Phaeodactylum tricornutum has been reported [15,16], whereas Barbero-Lopez et al. compared the ecotoxicity of Colatan GT10 extract with commercial copper-based wood preservative using marine Aliivibrio fischeri bacteria [14]. Nevertheless, studies available provide scanty information about the effect of tannin structure on ecotoxicity and the corresponding toxicity mechanism, which needs to be further investigated.
Luminescent bacteria is widely used to test the acute toxicity of chemicals, pesticides and pharmaceuticals for its advantages such as high sensitivity and low cost [19,20,21,22,23]. In this study, we conducted the toxicity assay of six kinds of commercial vegetable tannin commonly used in leather industry toward photobacterium (P.) phosphoreum, including both hydrolyzed tannin and condensed tannin. The tested hydrolyzed tannin involved tara tannin and valonia tannin, whereas the larch tannin, wattle tannin, bayberry tannin, and acacia mangium tannin represented condensed tannin. We also studied the toxicity of gallic acid (GA), catechin (CAT), and epigallocatechin (EGC) to further explore the impact of tannin structure; these are commonly used as precursor chemicals of hydrolyzed tannin and condensed tannin, respectively [24]. The structures of these precursor chemicals are also shown in Figure 1. Furthermore, the toxic mechanism concerning precursor chemicals was further investigated through in silico simulations of molecular docking and dynamics.

2. Materials and Methods

2.1. Materials and Chemicals

The commercial tannin was provided by Guangdong Dymatic Chemical, Inc. (Guangdong, China), including tara tannin, valonia tannin, larch tannin, wattle tannin, bayberry tannin, and acacia mangium tannin. Gallic acid (GA, analytical grade) was supplied by Chengdu Kelong Chemical Reagent Factory (Chengdu, China). Catechin (CAT, >98%, purity) and epigallocatechin (EGC, >98%, purity) were purchased from Shanghai Hanhong Chemical Co., Ltd. (Shanghai, China). All the other chemicals are of analytical grade, and those used for toxicity tests were diluted with 3% NaCl solution.

2.2. Determination of Tannin Content

The tannin content in commercial samples was determined according to standard method ISO 14088: 2012, which is conducted based on the reaction between tannin and hide powder through indirect gravimetric analysis. In addition, insoluble matter, moisture, and non-tannin components were also analyzed.

2.3. Acute Toxicity Experiments

Acute toxicity tests were conducted using fresh P. phosphoreum (T3 mutation), which was cultured according to previous description [22]. The details can be found in the Supplementary Materials. Bioluminescence was measured by LumiFox6000 (Shenzhen Langshi Biological Instrument Company, Ltd., Shenzhen, China); 50 μL of bacterial suspension was exposed to 950 μL of tested sample solution for 15 min at 20 °C, whereas 950 μL of 3% NaCl and 0.10 mg/L HgCl2 solution were used as blank and positive control, respectively. The relative luminous intensity was expressed as:
E = I I 0 × 100
where I and I0 are the bioluminescence intensity of the test sample and blank control, respectively. The EC50 value is the effective concentration when light emission of bacteria reduces 50% [25,26], which could be used to compare the toxicity of samples [27]. A higher EC50 value indicates less toxicity. To characterize the fluctuation of toxic effects, 95% confidence intervals were used.

2.4. Field Emission Scanning Electron Microscope (FE-SEM)

A 10 mL amount of fresh bacteria suspension was centrifuged for 10 min, and mixed with vegetable tannin (2 g/L tara tannin and 10 g/L larch tannin) and 2 g/L model compounds (GA, CAT and EGC), respectively. The samples were incubated at 20 °C for 30 min, and then immersed in 2.5% glutaraldehyde solution for 12 h to immobilize the bacteria. After dehydration by successive gradients in concentrations of ethanol (10, 30, 50, 70, 90, and 100 v/v%), samples were observed by FE-SEM (Cambridge CamScan CS-300, Cambridge, UK) [28].

2.5. Molecular Simulation

Only three model molecules (ligands) have been used in the computational part of the study (GA, CAT, EGC).

2.5.1. Molecular Docking

Molecular docking was performed by using CDOCKER in Discovery Studio 3.1 (Accelrys Co., Ltd., San Diego, CA, USA). The 3D crystal structure of luciferase (1BRL) was obtained from the Protein Date Bank (http://www.rcsb.org/pdb accessed on 12 March 2021). The protein was prepared by removing water molecules, adding hydrogen atoms, and setting pH to 7.0. The structure of compounds (ligands) used in the molecular docking was generated with Chemoffice software. The receptor (luciferase) and ligands (compounds) were pretreated under the CHARMm force field [29]. The selection of optimal binding conformations was based on the lowest CDOCKER energy [30].

2.5.2. Molecular Dynamics Simulation

Molecular dynamics simulation of the complex formed by luciferase (1BRL) and ligand was carried out using the free GROMACS 20.2 software package (http://www.gromacs.org accessed on 12 March 2021). The AMBER ff14SB protein force filed was used to model all peptide interactions, and the General AMBER Force Filed (GAFF) was used for the ligands [31,32,33]. The AMBER ff14SB force filed was provided by GROMACS. The GAFF topologies were generated by the Antercharmber software from Ambertools 20 [34,35]. The GAFF topologies and coordinate files were converted into the GROMACS format using the ACPYPE script [36,37,38]. The whole complex system was solvated in rectangular with the TIP3P water model. Na+ was added to neutralize the charge of the 1BRL-ligand system. Energy minimization was achieved by the steepest descent integrator for 50,000 steps until the maximum force was less than 10 kJ/mol. After minimization, the system was equilibrated at 300 K using V-rescale (modified Berendsen thermostat) for 100 ps in the NVT ensemble. Then 100 ps NPT equilibration with a target pressure of 1 atm was performed by using the Berendsen algorithm. Finally, the molecular dynamics simulation was carried out for 10 ns with time steps of 2 fs. The long-ranged electrostatic interaction was calculated through the Particle Mesh Ewald (PME). The root–mean–square deviation (RMSD) was used to analyze the simulation data.

3. Result and Discussion

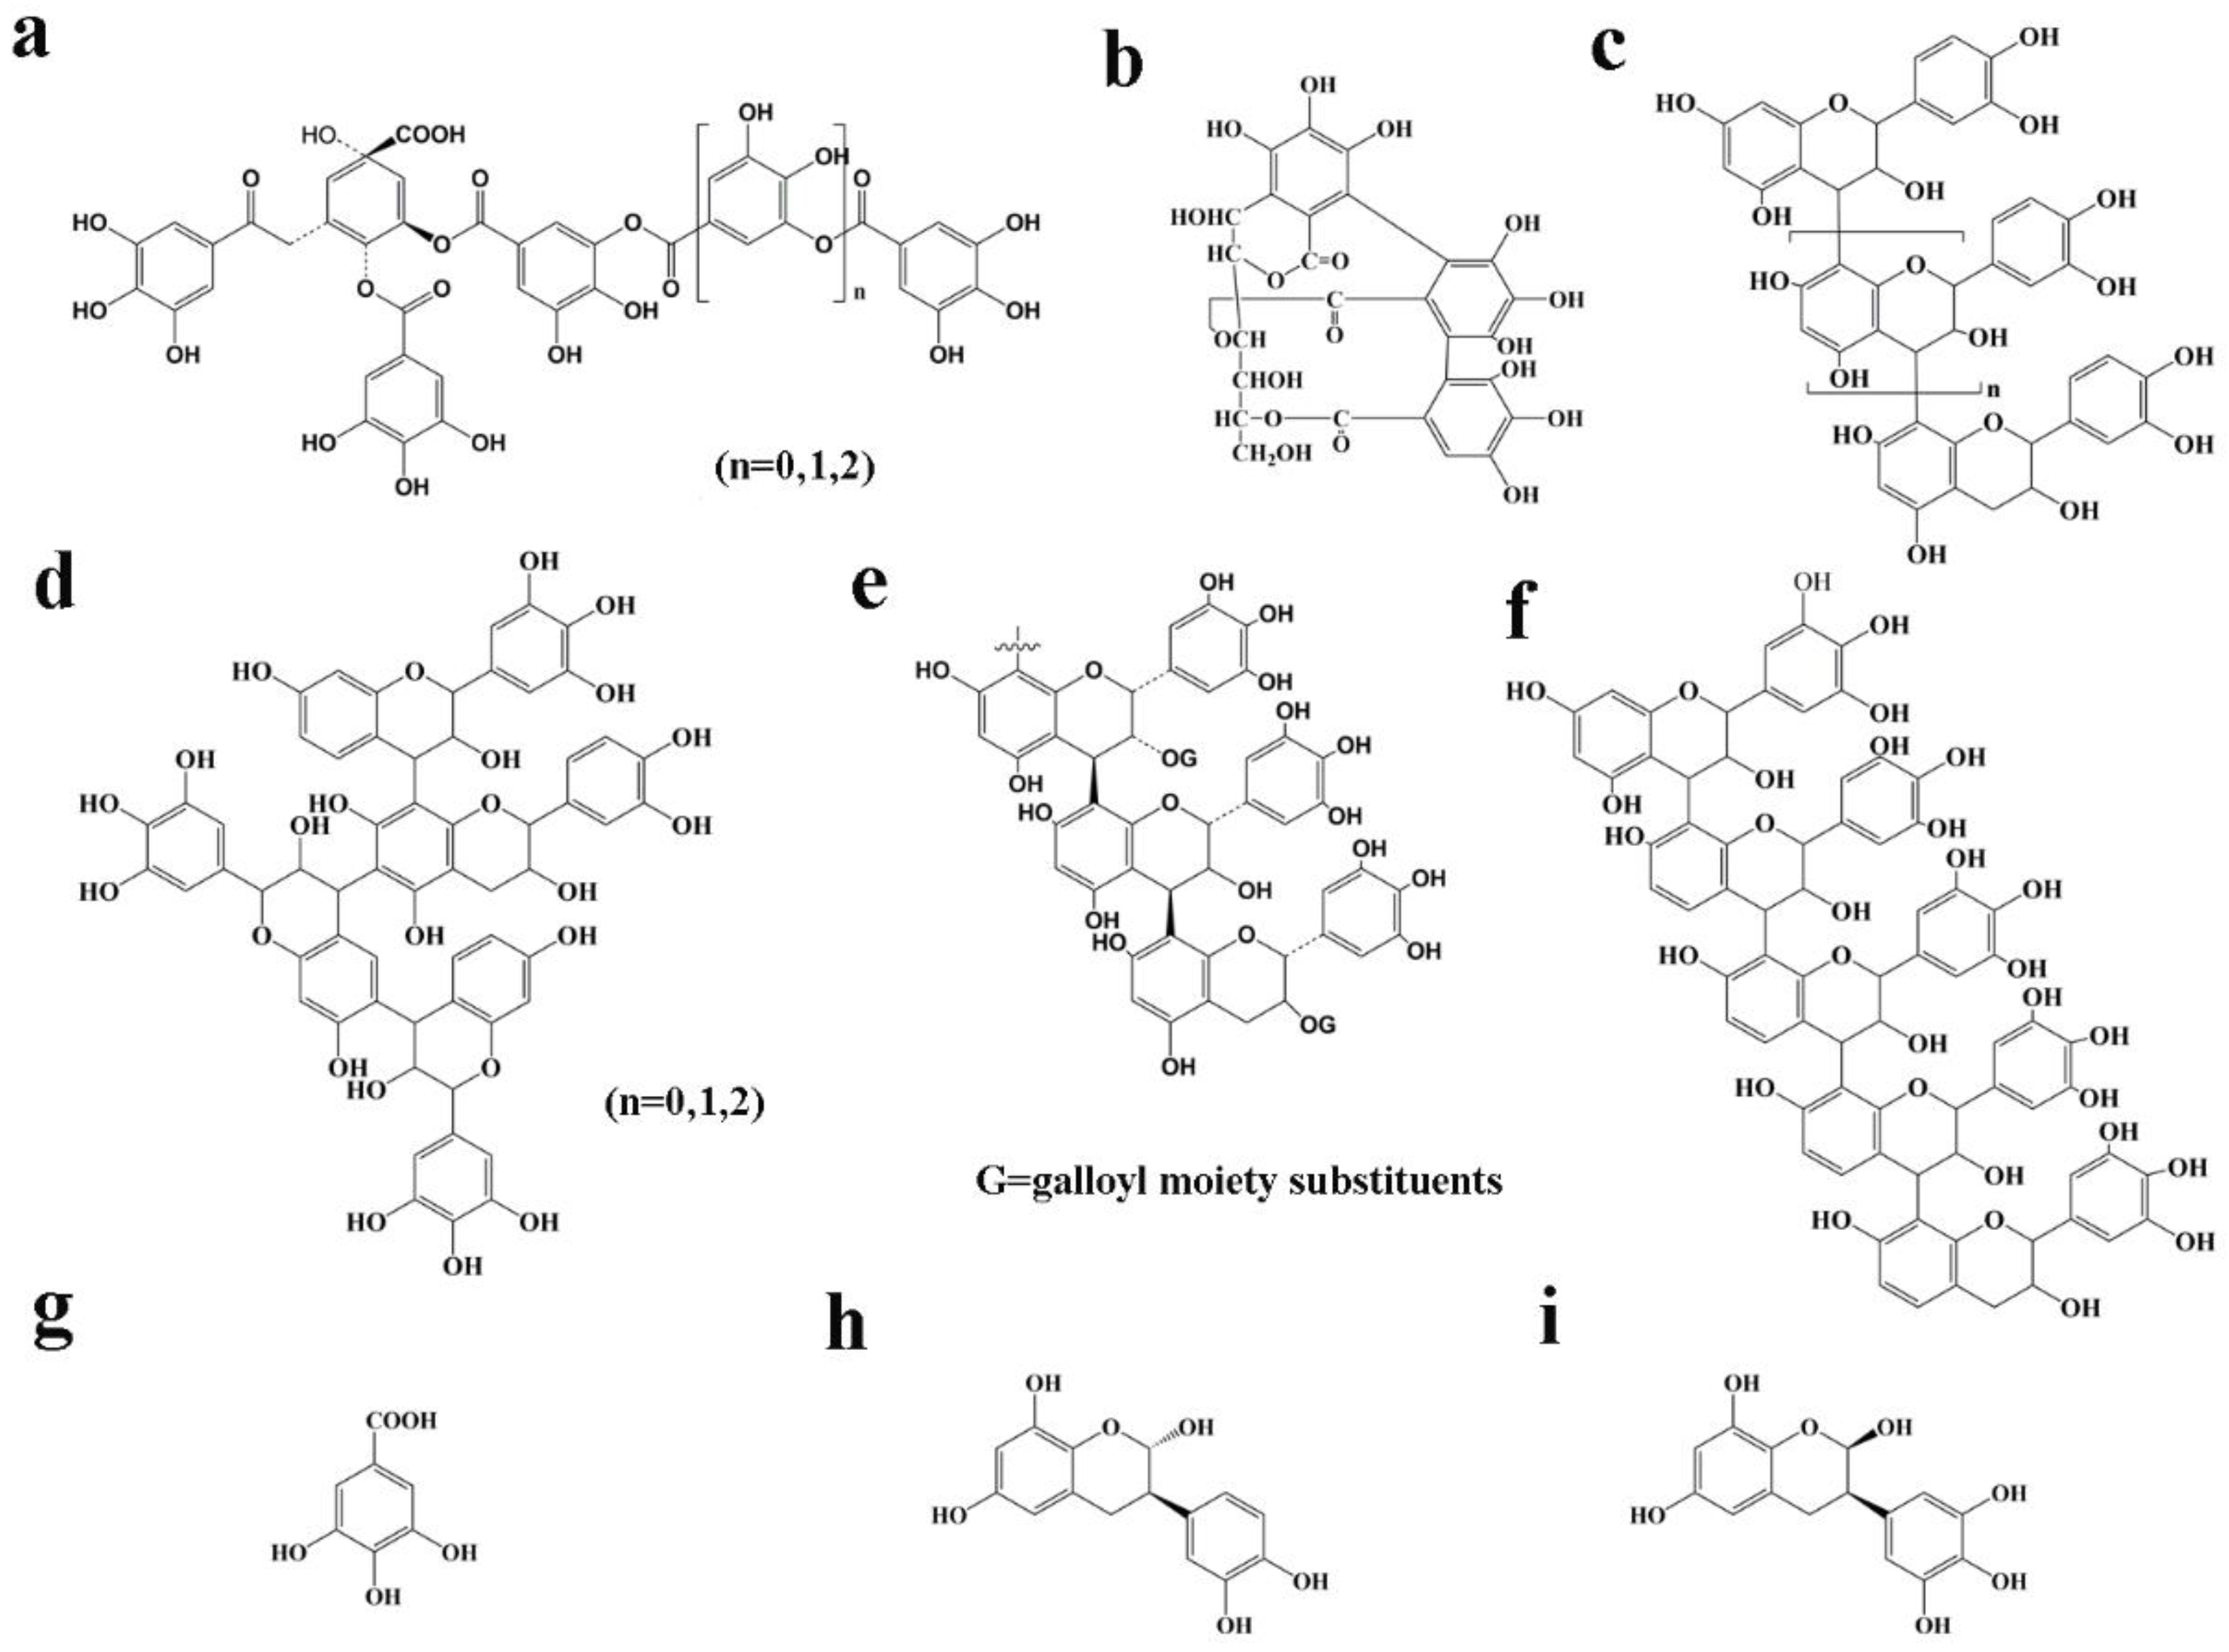
3.1. Component Analysis

Tannin was the main component in the six kinds of commercial vegetable tannin, as shown in Table 1. Tara tannin had the highest tannin content and larch tannin had the lowest. Then the subsequent calculations of the dose-dependent toxicity were all based on the tannin content in commercial samples.

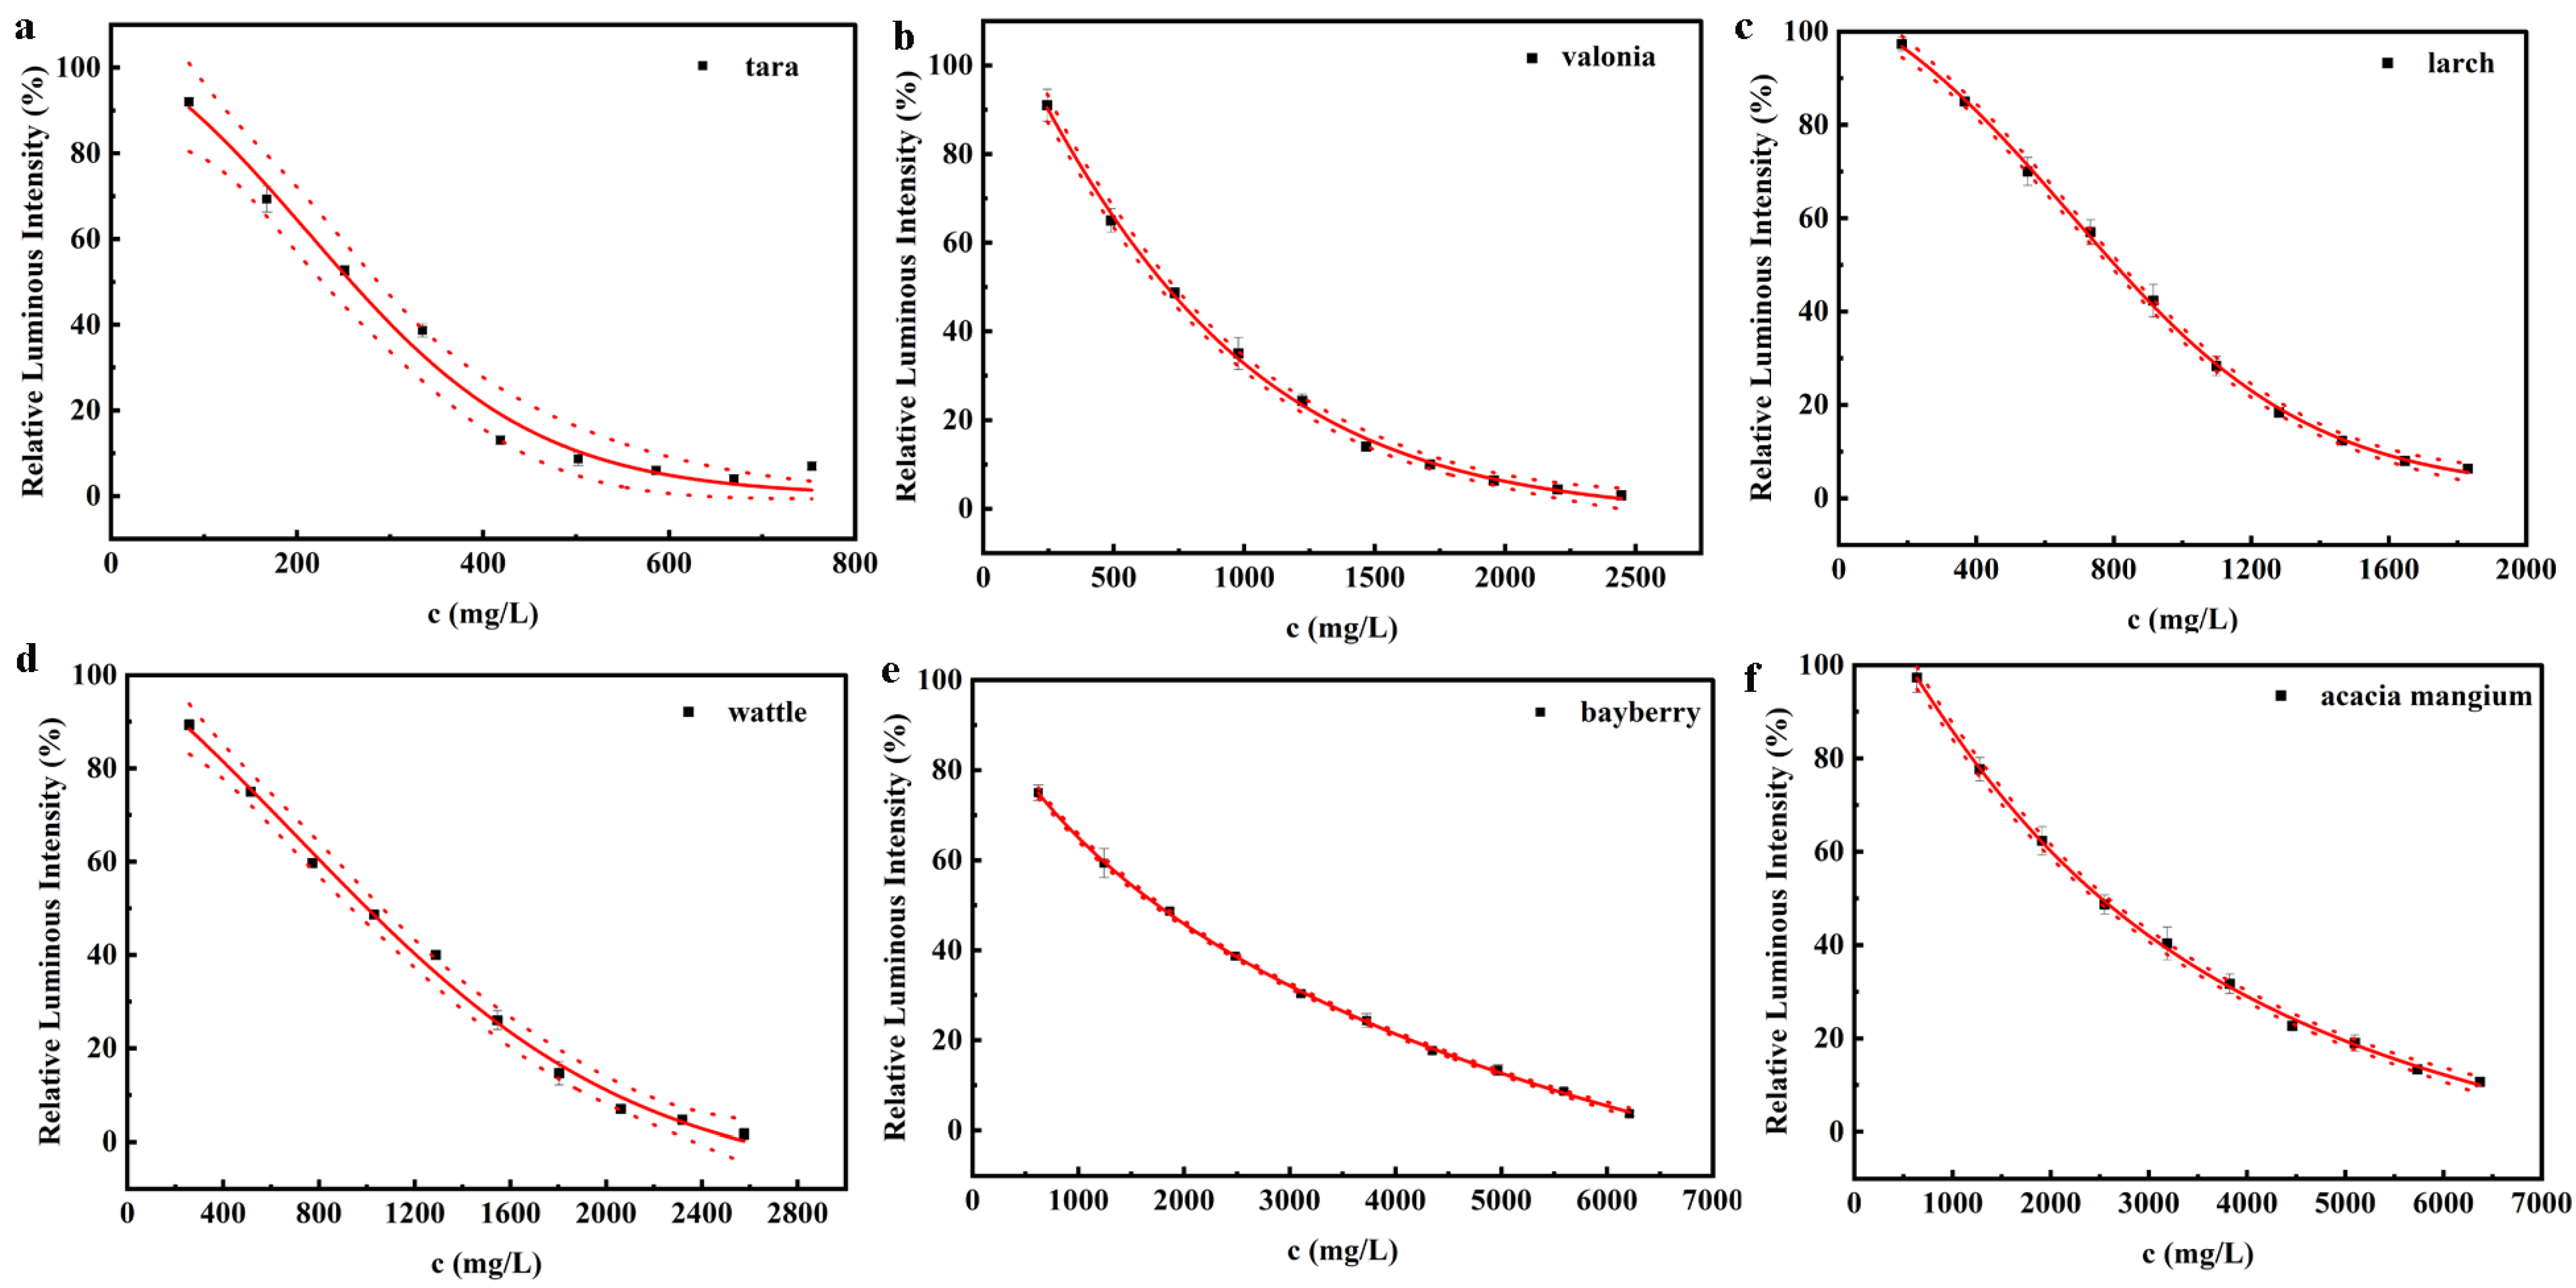
3.2. Toxicity of Vegetable Tannin and the Precursor Chemicals

3.2.1. Toxicity of Hydrolyzed Tannin

The concentration-response curves of hydrolyzed tannin (tara tannin and valonia tannin) are shown in Figure 2a,b. As the concentration of tannin increased, the luminescence inhibition of P. phosphoreum increased and the relative luminous intensity decreased. The relative luminous intensity dropped below 10% when the concentration of tara tannin moved beyond 400 mg/L. The Slogistic1 function model (Table S2) was used to fit the concentration-response curves of tara tannin with a correlation coefficient of 0.9813, and the EC50 value was 257.97 ± 5.48 mg/L. The concentration-response curves of the valonia tannin were well fitted by the DoseResp function model (Table S2) with a correlation coefficient of 0.9981, and the obtained EC50 value was 704.86 ± 22.35 mg/L. Obviously, the toxicity of the tara tannin was much higher than that of the valonia tannin.

3.2.2. Toxicity of Condensed Tannin

Figure 2c–f show the dose-response curve of four kinds of condensed tannin (larch tannin, wattle tannin, bayberry tannin, acacia mangium tannin). With the increase of the condensed tannin concentration, the relative luminous intensity of the bacterial solution decreased, indicating the enhancement of inhibitory effect on P. phosphoreum. The model of logistic function or DoseResp function (Table S2) were used to fit these dose-response curves with a correlation coefficient higher than 0.99, and the obtained EC50 value was 804.16 ± 36.03 mg/L for larch tannin, 1001.78 ± 9.38 mg/L for wattle tannin, 1749.24 ± 77.59 mg/L for bayberry tannin, and 2521.22 ± 134.87 mg/L for acacia mangium tannin. Based on the EC50 value, larch tannin showed higher toxicity on P. phosphoreum, while acacia mangium tannin showed lowest toxicity in the four kinds of condensed tannin. However, the toxicity of four kinds of condensed tannin was lower than that of two kinds of hydrolyzed tannin, indicating the high relevance of the toxicity on the structure of tannin.

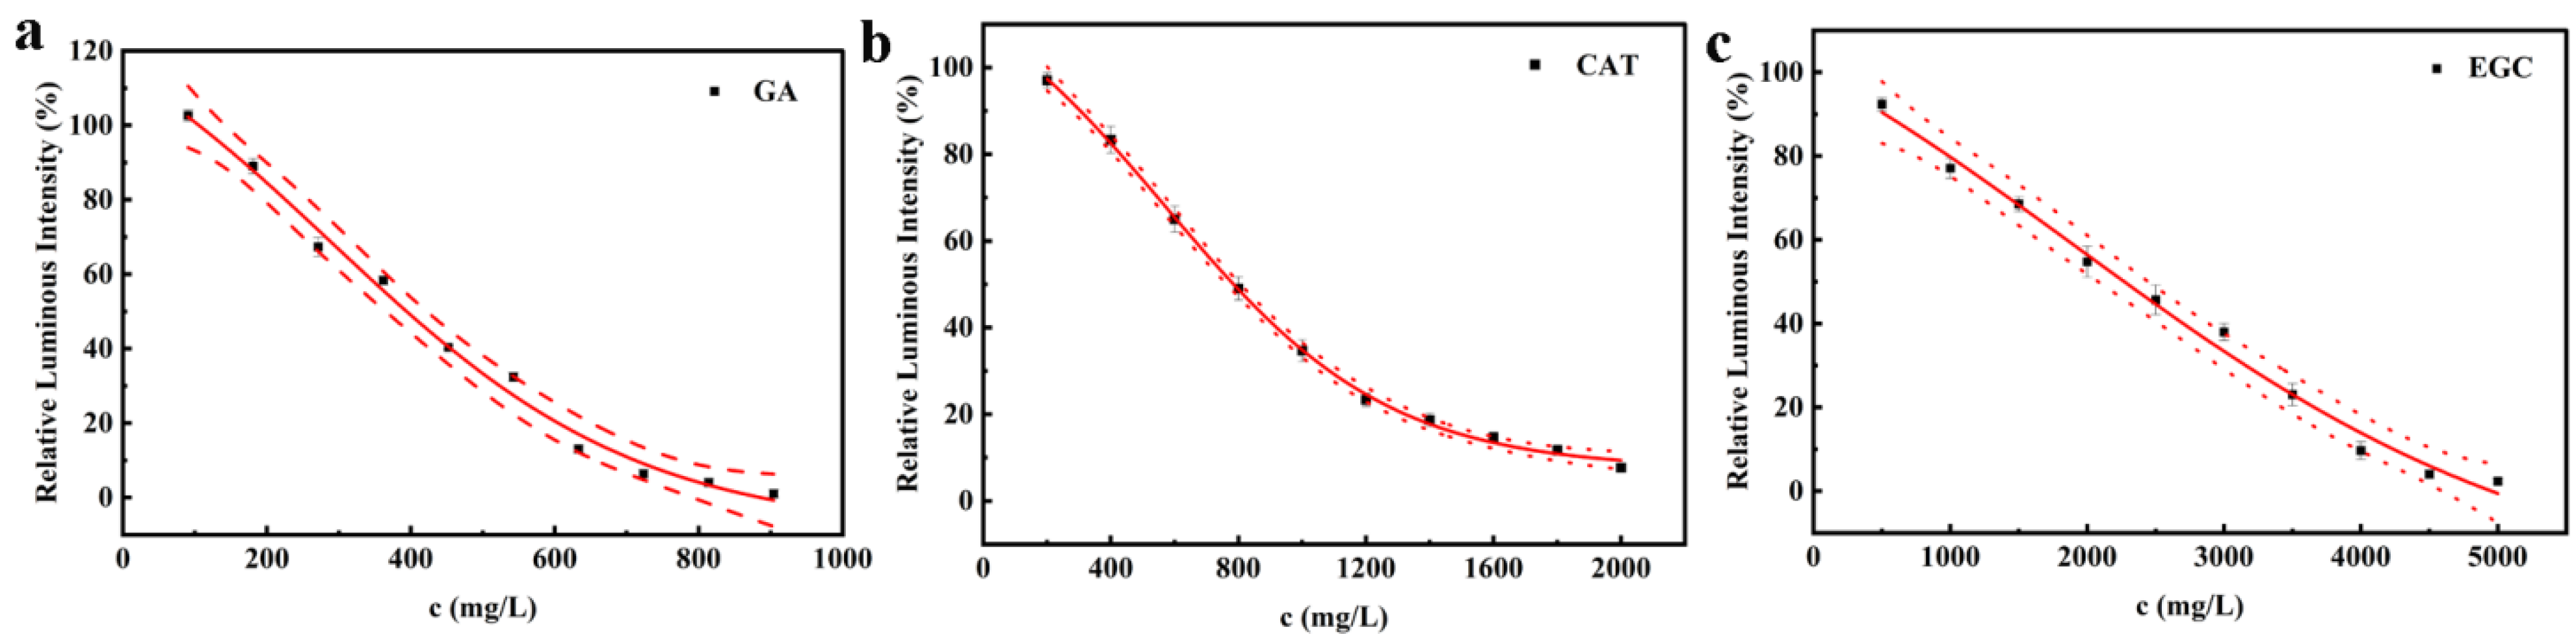
3.2.3. Toxicity of Model Compounds

To further explore the relationship between tannin structure and toxicity toward P. phosphoreum, we tested the toxicity of model compounds, namely GA as the model of hydrolyzed tannin, and CAT and EGC as the model of condensed tannin. The results are shown in Figure 3.
Obviously, the relative luminous intensity decreased with the increasing concentration. The DoseResp function model (Table S2) was used to fit the concentration-response curves of GA, CAT, and EGC with a high correlation coefficient. The calculated EC50 value was 394.68 ± 6.80 mg/L for GA, 783.73 ± 29.03 mg/L for CAT and 2272.52 ± 33.69 mg/L for EGC, illustrating higher toxicity of GA compared with CAT and EGC. The toxicity of three model compounds followed the sequence of GA > CAT > EGC. The tendency was consistent with the findings of higher toxicity of hydrolyzed tannin than condensed tannin, confirming the key role of structure in the toxicity.

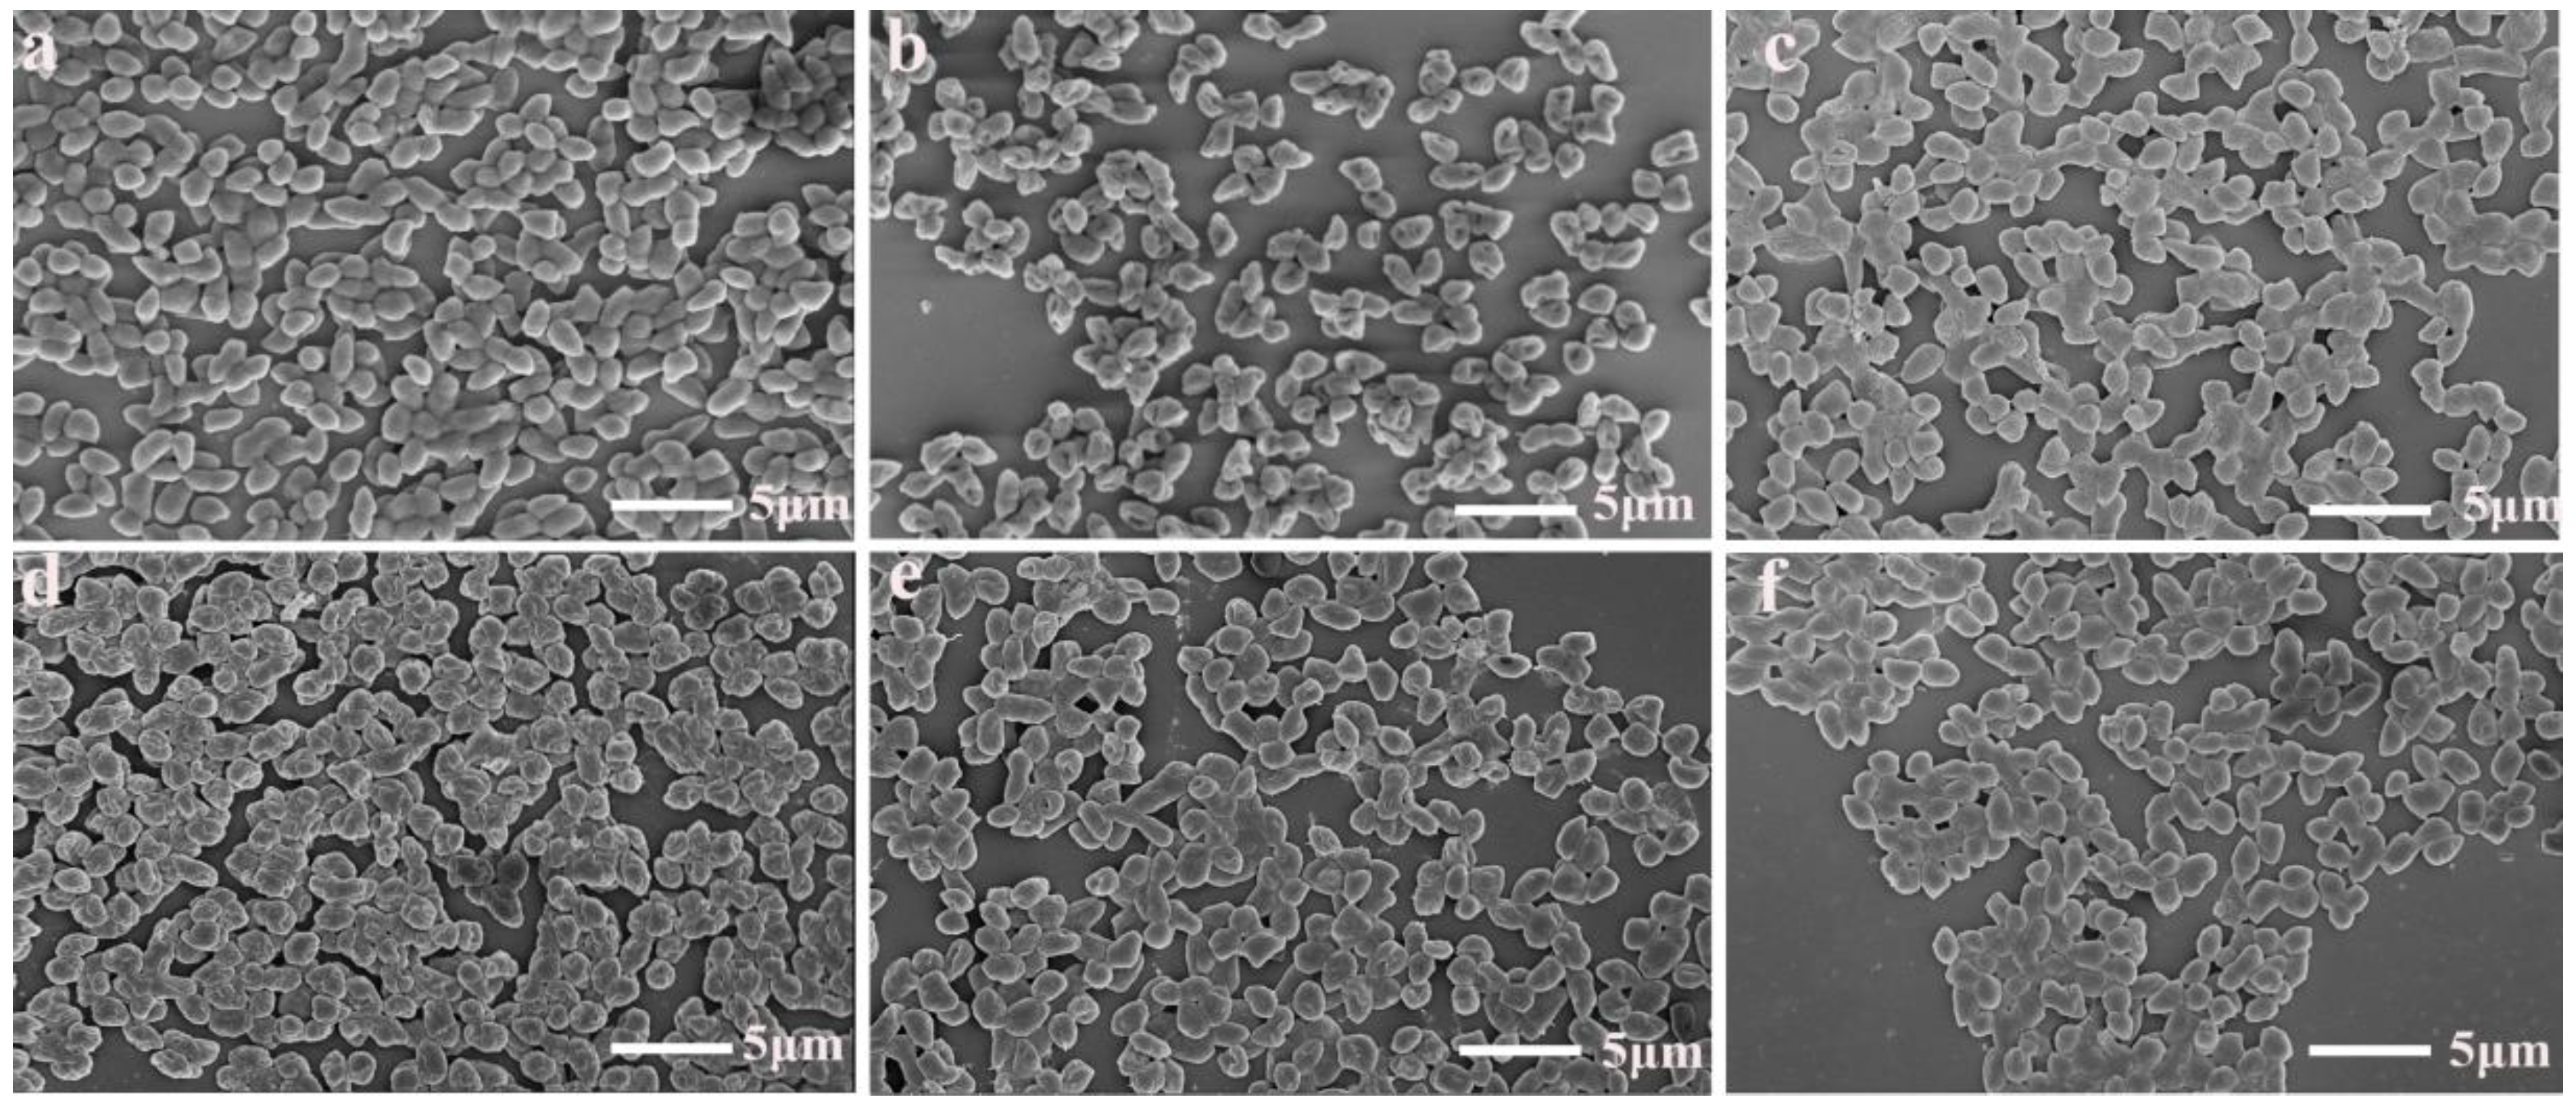
3.3. Morphologies of P. phosphoreum

The morphologies of P. phosphoreum were observed by FE-SEM, as shown in Figure 4. The normal bacteria cell displayed smooth surfaces, intact structures, and clear edges (Figure 4a). After P. phosphoreum was treated by tara tannin, the cell showed notable shrinkage, and the cell membrane ruptured (Figure 4b). However, the P. phosphoreum treated by larch tannin aggregated and presented slight deformation (Figure 4c). For three model compounds, the morphologies of P. phosphoreum treated by GA were shrunk and became flat, very different from those treated by CAT and EGC, and the latter showed similarity to that of larch tannin. This further illustrated the effect of tannin structure on toxicity.

3.4. Toxicity Mechanism

Understanding the toxicity mechanism or modes of action of these natural organic compounds was particularly important to reveal target molecular pathways and identify key endpoints for environmental monitoring and risk assessing [39]. Then the model compounds of tannin were used to further explore the toxicity mechanism for their clear structure. In general, organic compounds could be roughly classified into narcotic compounds and reactive compounds according to the toxicity mechanism toward aquatic organisms [40]. The toxicity of narcotic compounds is aroused from the disruption of the cell membrane of the organism via an absolutely non-specific mode of action, and depends entirely on the hydrophobicity of the compound. Then the toxicity is also called baseline toxicity, which can be predicted by the logarithm of the octanol/water partition coefficient (log KOW). On the other hand, the toxicity of the reactive compounds is much greater than the baseline toxicity because of the specific interactions with the organisms [40].
The baseline toxicity of model compounds could be calculated by the following equation [41]:
log 1/EC50 = 0.938 log KOW + 0.833
The logKOW of model chemicals could be obtained through literature [42,43]. The information of three model compounds, such as CAS number, name abbreviation (Abb.), molecular weight (MW), log KOW, predicted toxicity, and experimental toxicity, is listed in Table 2. Both the predicted and experimental toxicity showed GA had higher toxicity. However, compared with predicted baseline toxicity, the experimental toxicity was much greater, suggesting strong reactive interactions between model compound and specific receptor of luminous bacteria such as luciferase.

3.4.1. Molecular Docking

The luciferase is often used as one of the potential receptors to investigate the toxic mechanism of luminous bacteria for the luciferase-catalyzed bioluminescence [44], which is a heterodimeric enzyme composed of two parts, LUX A and LUX B [45]. The binding site of luciferase was found by the CDOCKER program, as shown in Figure S1, and the constitution of active sites was similar to the finding of Fan et al. [46]. The optimal binding site of luciferase varied with ligands, and the docking results are listed in Table 3. The docking preferential conformations are shown in Figure S2.
As shown in Table 3, the CDOCKER energy of three systems was lower than −35 kcal/mol, indicating the formation of a complex between the ligand and receptor, and confirming the reactive toxicity mechanism. GA had the lowest binding energy of −39.35 kcal/mol, suggesting the highest affinity with luciferase. The binding affinity sequence of the three model compounds with luciferase followed GA > CAT > EGC, in agreement with that of experimental toxicity, indicating the target role of luciferase when P. phosphoreum was exposed to tannin. More numbers of H-bonds and Pi-bonds were formed with increasing molecular size of ligand. However, the CDOCKER energy was determined by both the strength and numbers of the bonds formed between the receptor and the ligand [47]. Then, the best receptor–ligand complexes with lowest CDOCKER energy representing hydrolyzed tannin (GA) or condensed tannin (CAT) were taken to further explore the stability of complexes by molecular dynamics simulation.

3.4.2. Molecular Dynamics

Molecular dynamics simulation is another method to investigate the toxicity mechanism of compounds; it evaluates toxic effects by calculating the structural changes of the receptor (i.e., luciferase) before and after docking of the ligand. RMSD is used to estimate the stability of the receptor–ligand complex. Greater structural change caused by a ligand illustrates the greater impact on luciferase, which would lead to greater bioluminescence inhibition of P. phosphoreum. The change of RMSD with time is shown in Figure S3. RMSD increased with the increase of time from 0 ps to 2000 ps, and the complex system was equilibrized after 2000 ps. The 1BRL-CAT complex system showed similar varying RMSD value as the blank, indicating CAT had little effect on the structure of luciferase. However, the RMSD value of the 1BRL-GA complex system was much higher than that of the blank, illustrating greater influence of GA on the structure of luciferase. The results could explain why the toxicity of hydrolyzed tannin was greater than that of condensed tannin.

4. Conclusions

The potential ecotoxicological effects of typical hydrolyzed and condensed vegetable tannin to aquatic species were investigated on the basis of a luminescence inhibition test with P. phosphoreum. In general, for hydrolyzed tannin, the EC50 was lower than 704.86 mg/L. The EC50 value of condensed tannin was higher than 800 mg/L. The hydrolyzed tannin was found to show higher toxicity than the condensed tannin on account of lower EC50 values, indicating that the toxicity of tannin depends on the structure. The EC50 values of model compounds also indicated that GA as a precursor of hydrolyzed tannin exhibited greater toxicity than CAT and EGC as precursors of condensed tannin. The reactive toxicity mechanism was found to play an important role by molecular docking and molecular dynamics simulations.

Supplementary Materials

The following supporting information can be downloaded at: https://www.mdpi.com/article/10.3390/pr10050816/s1, Figure S1: The binding site of luciferase; Figure S2: The preferential conformations of complex formed by luciferase with model compounds from CDOCKER (1: GA, 2: CAT, 3: EGC. (a): 3D-diagram (b): 2D-diagram. For the interaction, Pi bond was set as purple line, the hydrogen bond was set as green line, the van der Waals was set as light green and salt bridge was set as orange.); Figure S3: Times dependence of root-mean-square deviations (RMSD); Table S1: Culture medium of P. phosphoreum; Table S2: Regression models describing the concentration-response curves of vegetable tannin and model compounds. Supplementary material related to this article can be found, in the online version.

Author Contributions

Conceptualization, F.H.; formal analysis, L.P.; methodology, F.H.; software, W.L. and X.J.; supervision, W.Z.; writing—original draft, F.H.; writing—review & editing, W.Z. All authors have read and agreed to the published version of the manuscript.

Funding

This work was funded by the National Natural Science Foundation of China grant number 21776185.

Institutional Review Board Statement

Not applicable.

Informed Consent Statement

Not applicable.

Data Availability Statement

Not applicable.

Conflicts of Interest

The authors declare no conflict of interest.

References

  1. Cassano, A.; Adzet, J.; Molinari, R.; Buonomenna, M.G.; Roig, J.; Drioli, E. Membrane treatment by nanofiltration of exhausted vegetable tannin liquors from the leather industry. Water Res. 2003, 37, 2426–2434. [Google Scholar] [CrossRef]
  2. Aguilar, C.N.; Rodriguez, R.; Gutierrez-Sanchez, G.; Augur, C.; Favela-Torres, E.; Prado-Barragan, L.A.; Ramirez-Coronel, A.; Contreras-Esquivel, J.C. Microbial tannases: Advances and perspectives. Appl. Microbiol. Biotechnol. 2007, 76, 47–59. [Google Scholar] [CrossRef] [PubMed]
  3. Romero-Dondiz, E.M.; Almazán, J.E.; Rajal, V.B.; Castro-Vidaurre, E.F. Removal of vegetable tannins to recover water in the leather industry by ultrafiltration polymeric membranes. Chem. Eng. Res. Des. 2015, 93, 727–735. [Google Scholar] [CrossRef]
  4. Barbehenn, R.V.; Peter Constabel, C. Tannins in plant-herbivore interactions. Phytochemistry 2011, 72, 1551–1565. [Google Scholar] [CrossRef] [PubMed]
  5. Serrano, J.; Puupponen-Pimia, R.; Dauer, A.; Aura, A.M.; Saura-Calixto, F. Tannins: Current knowledge of food sources, intake, bioavailability and biological effects. Mol. Nutr. Food Res. 2009, 53 (Suppl. S2), S310–S329. [Google Scholar] [CrossRef] [PubMed] [Green Version]
  6. Khanbabaee, K.; Ree, V. Tannins: Classification and definition. Nat. Prod. Rep. 2001, 18, 641–649. [Google Scholar] [CrossRef] [PubMed]
  7. China, C.R.; Nyandoro, S.S.; Munissi, J.J.E.; Maguta, M.M.; Meyer, M.; Schroepfer, M. Tanning capacity of tessmannia burttii extracts: The potential eco-friendly tanning agents for the leather industry. J. Leather Sci. Eng. 2021, 3, 149–157. [Google Scholar] [CrossRef]
  8. Scholz, W.; Lucas, M. Techno-economic evaluation of membrane filtration for the recovery and re-use of tanning chemicals. Water Res. 2003, 37, 1859–1867. [Google Scholar] [CrossRef]
  9. Falcao, L.; Araujo, M.E.M. Vegetable tannins used in the manufacture of historic leathers. Molecules 2018, 23, 1081. [Google Scholar] [CrossRef] [Green Version]
  10. Kanth, S.V.; Venba, R.; Madhan, B.; Chandrababu, N.K.; Sadulla, S. Cleaner tanning practices for tannery pollution abatement: Role of enzymes in eco-friendly vegetable tanning. J. Clean. Prod. 2009, 17, 507–515. [Google Scholar] [CrossRef]
  11. Ibrahim, A.; Yaser, A.Z.; Lamaming, J. Synthesising tannin-based coagulants for water and wastewater application: A review. J. Environ. Chem. Eng. 2021, 9, 105007. [Google Scholar] [CrossRef]
  12. Balakrishnan, A.; Kanchinadham, S.; Kalyanaraman, C. Respirometric assessment of vegetable tanning process wastewater generated from tanneries. Eng. Rep. 2020, 2, e12229. [Google Scholar] [CrossRef]
  13. Jochimsen, J.C.; Jekel, M.R. Partial oxidation effects during the combined oxidative and biological treatment of separated streams of tannery wastewater. Water Sci. Technol. 1997, 35, 337–345. [Google Scholar] [CrossRef]
  14. Barbero-Lopez, A.; Akkanen, J.; Lappalainen, R.; Peraniemi, S.; Haapala, A. Bio-based wood preservatives: Their efficiency, leaching and ecotoxicity compared to a commercial wood preservative. Sci. Total Environ. 2021, 753, 142013. [Google Scholar] [CrossRef] [PubMed]
  15. Libralato, G.; Avezzu, F.; Volpi Ghirardini, A. Lignin and tannin toxicity to Phaeodactylum tricornutum (Bohlin). J. Hazard. Mater. 2011, 194, 435–439. [Google Scholar] [CrossRef] [PubMed]
  16. Germirli Babuna, F.; Yilmaz, Z.; Okay, O.S.; Arslan Alaton, I.; Iskender, G. Ozonation of synthetic versus natural textile tannins: Recalcitrance and toxicity towards Phaeodactylum tricornutum. Water Sci. Technol. 2007, 55, 45–52. [Google Scholar] [CrossRef]
  17. De Nicola, E.; Gallo, M.; Iaccarino, M.; Meric, S.; Oral, R.; Russo, T.; Sorrentino, T.; Tunay, O.; Vuttariello, E.; Warnau, M.; et al. Hormetic versus toxic effects of vegetable tannin in a multitest study. Arch. Environ. Contam. Toxicol. 2004, 46, 336–344. [Google Scholar] [CrossRef]
  18. De Nicola, E.; Meric, S.; Gallo, M.; Iaccarino, M.; Della Rocca, C.; Lofrano, G.; Russo, T.; Pagano, G. Vegetable and synthetic tannins induce hormesis/toxicity in sea urchin early development and in algal growth. Environ. Pollut. 2007, 146, 46–54. [Google Scholar] [CrossRef]
  19. Mariscal, A.; Peinado, M.T.; Carnero-Varo, M.; Fernandez-Crehuet, J. Influence of organic solvents on the sensitivity of a bioluminescence toxicity test with Vibrio harveyi. Chemosphere 2003, 50, 349–354. [Google Scholar] [CrossRef]
  20. Parvez, S.; Venkataraman, C.; Mukherji, S. A review on advantages of implementing luminescence inhibition test (Vibrio fischeri) for acute toxicity prediction of chemicals. Environ. Int. 2006, 32, 265–268. [Google Scholar] [CrossRef]
  21. Mohseni, M.; Abbaszadeh, J.; Maghool, S.S.; Chaichi, M.J. Heavy metals detection using biosensor cells of a novel marine luminescent bacterium Vibrio sp. mm1 isolated from the caspian sea. Ecotoxicol. Environ. Saf. 2018, 148, 555–560. [Google Scholar] [CrossRef] [PubMed]
  22. Zhou, W.J.; Long, W.J.; Xu, T.; Peng, L.Q.; Zhang, W.H. Organic ligands unexpectedly increase the toxicity of chromium(III) for luminescent bacteria. Environ. Chem. Lett. 2019, 17, 1849–1855. [Google Scholar] [CrossRef]
  23. Li, J.; Yuan, T.; Ma, Y.; Shen, Z.; Tian, Y.; Gao, L.; Dong, X. Acute toxicity assessment of indoor dust extracts by luminescent bacteria assays with photobacterium phosphoreum T3. Environ. Res. 2020, 198, 110447. [Google Scholar] [CrossRef]
  24. Liu, L.; Xiao, X.; Li, K.; Li, X.; Yu, K.; Liao, X.; Shi, B. Prevention of bacterial colonization based on self-assembled metal-Phenolic nanocoating from rare-earth ions and catechin. ACS Appl. Mater. Inter. 2020, 12, 22237–22245. [Google Scholar] [CrossRef]
  25. Ishibashi, H.; Uchida, M.; Hirano, M.; Hayashi, T.; Yamamoto, R.; Kubota, A.; Ichikawa, N.; Ishibashi, Y.; Tominaga, N.; Arizono, K. In vivo and in silico analyses of estrogenic potential of equine estrogens in medaka (Oryzias latipes). Sci. Total Environ. 2021, 767, 144379. [Google Scholar] [CrossRef] [PubMed]
  26. Sigurnjak Bures, M.; Ukic, S.; Cvetnic, M.; Prevaric, V.; Markic, M.; Rogosic, M.; Kusic, H.; Bolanca, T. Toxicity of binary mixtures of pesticides and pharmaceuticals toward Vibrio fischeri: Assessment by quantitative structure-activity relationships. Environ. Pollut. 2021, 275, 115885. [Google Scholar] [CrossRef] [PubMed]
  27. Hou, J.; Tang, J.; Chen, J.; Zhang, Q. Quantitative structure-toxicity relationship analysis of combined toxic effects of lignocellulose-derived inhibitors on bioethanol production. Bioresour. Technol. 2019, 289, 121724. [Google Scholar] [CrossRef]
  28. Han, W.M.; Hou, M.C.; He, F.M.; Zhang, W.H.; Shi, B. Ecotoxicity and interacting mechanism of anionic surfactant sodium dodecyl sulfate (SDS) and its mixtures with nonionic surfactant fatty alcohol-polyoxyethlene ether (AEO). Aqua. Toxicol. 2020, 222, 9. [Google Scholar] [CrossRef]
  29. Shen, L.; Johnson, T.L.; Clugston, S.; Huang, H.; Butenhof, K.J.; Stanton, R.V. Molecular dynamics simulation and binding energy calculation for estimation of oligonucleotide duplex thermostability in rna-based therapeutics. J. Chem. Inf. Model. 2011, 51, 1957–1965. [Google Scholar] [CrossRef]
  30. Wang, L.; Ma, M.; Yu, Z.; Du, S.K. Preparation and identification of antioxidant peptides from cottonseed proteins. Food Chem. 2021, 352, 129399. [Google Scholar] [CrossRef]
  31. Lindorff-Larsen, K.; Piana, S.; Palmo, K.; Maragakis, P.; Klepeis, J.L.; Dror, R.O.; Shaw, D.E. Improved side-chain torsion potentials for the Amber ff99SB protein force field. Proteins 2010, 78, 1950–1958. [Google Scholar] [CrossRef] [PubMed] [Green Version]
  32. Maier, J.A.; Martinez, C.; Kasavajhala, K.; Wickstrom, L.; Hauser, K.E.; Simmerling, C. ff14SB: Improving the accuracy of protein side chain and backbone parameters from ff99SB. J. Chem. Theory Comput. 2015, 11, 3696–3713. [Google Scholar] [CrossRef] [PubMed] [Green Version]
  33. Tian, C.; Kasavajhala, K.; Belfon, K.A.A.; Raguette, L.; Huang, H.; Migues, A.N.; Bickel, J.; Wang, Y.Z.; Pincay, J.; Wu, Q.; et al. ff19SB: Amino-acid specific protein backbone parameters trained against quantum mechanics energy surfaces in solution. J. Chem. Theory Comput. 2020, 16, 528–552. [Google Scholar] [CrossRef] [PubMed]
  34. Zheng, S.; Tang, Q.; He, J.; Du, S.; Xu, S.; Wang, C.; Xu, Y.; Lin, F. VFFDT: A new software for preparing amber force field parameters for metal-containing molecular systems. J. Chem. Inf. Model. 2016, 56, 811–818. [Google Scholar] [CrossRef]
  35. Hofer, F.; Kraml, J.; Kahler, U.; Kamenik, A.S.; Liedl, K.R. Catalytic Site pKa Values of aspartic, cysteine, and serine proteases: Constant pH MD Simulations. J. Chem. Inf. Model 2020, 60, 3030–3042. [Google Scholar] [CrossRef]
  36. Figueira, T.R.E.S.; Okura, V.; Rodrigues da Silva, F.; Jose da Silva, M.; Kudrna, D.; Ammiraju, J.S.S.; Talag, J.; Wing, R.; Arruda, P. A bac library of the sp80-3280 sugarcane variety (Saccharum sp.) and its inferred microsynteny with the sorghum genome. BMC Res. Notes 2012, 5, 185. [Google Scholar] [CrossRef] [Green Version]
  37. Silva, A.W.S.D.; Vranken, W.F.V. ACPYPE-Antechamber python parser interface. BMC Res. Notes 2012, 5, 367. [Google Scholar] [CrossRef] [Green Version]
  38. Boyd, N.J.; Wilson, M.R. Optimization of the GAFF force field to describe liquid crystal molecules: The path to a dramatic improvement in transition temperature predictions. Phys. Chem. Chem. Phys. 2015, 17, 24851–24865. [Google Scholar] [CrossRef] [Green Version]
  39. Enoch, S.J.; Cronin, M.T.; Schultz, T.W.; Madden, J.C. An evaluation of global QSAR models for the prediction of the toxicity of phenols to tetrahymena pyriformis. Chemosphere 2008, 71, 1225–1232. [Google Scholar] [CrossRef]
  40. Verhaar, H.; Leeuwen, C.; Hermens, J. Classifying environmental pollutants. Chemosphere 1992, 25, 471–491. [Google Scholar] [CrossRef]
  41. Wang, X.H.; Fan, L.Y.; Wang, S.; Wang, Y.; Yan, L.C.; Zheng, S.S.; Martyniuk, C.J.; Zhao, Y.H. Relationship between acute and chronic toxicity for prevalent organic pollutants in Vibrio fischeri based upon chemical mode of action. J. Hazard. Mater. 2017, 338, 458–465. [Google Scholar] [CrossRef]
  42. Uribe, S.T.; López-Giraldo, L.J.; Decker, E.A. Relationship between the physiochemical properties of cocoa procyanidins and their ability to inhibit lipid oxidation in liposomes. J. Agric. Food Chem. 2018, 66, 4490–4502. [Google Scholar] [CrossRef] [PubMed]
  43. Casoni, D.; Sarbu, C. Modeling of food preservatives chromatographic lipophilicity applying genetic algorithm and multiple linear regression. Rev. Roum. Chim. 2011, 56, 381–389. [Google Scholar] [CrossRef]
  44. Bacilieri, M.; Paoletta, S.; Basili, S.; Fanton, M.; Moro, S. A novel generalized 3d-qsar model of camptothecin analogs. Qsar Comb. Sci. 2011, 30, 927–938. [Google Scholar] [CrossRef] [PubMed]
  45. Tinikul, R.; Chunthaboon, P.; Phonbuppha, J.; Paladkong, T. Bacterial luciferase: Molecular mechanisms and applications. Enzymes 2020, 47, 427–455. [Google Scholar] [CrossRef] [PubMed]
  46. Fan, L.Y.; Huang, Y.; Huang, T.; Zhao, K.; Zhang, Y.N.; Li, C.; Zhao, Y.H. Photolysis and photo-induced toxicity of pyraclostrobin to Vibrio fischeri: Pathway and toxic mechanism. Aqua. Toxicol. 2020, 220, 105417. [Google Scholar] [CrossRef] [PubMed]
  47. Bayles, A.V.; Fisher, J.M.; Valentine, C.S.; Nowbahar, A.; Helgeson, M.E.; Squires, T.M. Hydrogen bonding strength determines water diffusivity in polymer ionogels. J. Phys. Chem. B 2021, 125, 5408–5419. [Google Scholar] [CrossRef]
Figure 1. Structure of vegetable tannin and precursors. (a) Tara tannin, (b) valonia tannin, (c) larch tannin, (d) wattle tannin, (e) bayberry tannin, (f) acacia mangium tannin, (g) gallic acid (GA), (h) catechin (CAT), (i) epigallocatechin (EGC).
Processes 10 00816 g001
Figure 2. The dose-response curve of hydrolyzed tannin and condensed tannin. (a) Tara tannin, (b) valonia tannin, (c) larch tannin, (d) wattlet tannin, (e) bayberry tannin, (f) acacia mangium tannin.
Processes 10 00816 g002
Figure 3. The dose-response curve of model compounds. (a) GA, (b) CAT, (c) EGG.
Processes 10 00816 g003
Figure 4. The morphologies of P. phosphoreum untreated (a) and treated with 2 g/L tara tannin (b), 10 g/L larch tannin (c), 2 g/L GA (d), 2 g/L CAT (e), 2 g/L EGC (f).
Processes 10 00816 g004
Table 1. Component analysis of the commercial vegetable tannin.
ComponentTara TanninValonia TanninLarch TanninWattle TanninBayberry TanninAcacia Mangium Tannin
Moisture/%11.014.110.611.512.713.1
Tannin/%83.762.661.064.462.163.7
Non-tannin/%0.518.925.622.020.019.9
Insoluble matter/%5.04.52.82.15.23.3
Table 2. Log KOW, predicted, and experimental toxicity for three model compounds.
CompoundCASAbb.MWLog KowLog 1/EC50
(Pred)
Log 1/EC50 (Exp)
Gallic acid149-91-7GA170.120.701.452.63
Catechin7295-85-4CAT290.270.371.182.57
Epigallocatechin970-74-1EGC306.271.121.882.13
Table 3. CDOCKER energy of three model compounds (GA, CAT, and EGC).
CompoundSiteCDOCKER Energy (kcal/mol)H-BondsPi-Bonds
GA2−39.35THR80 (LUX A)
PHE117 (LUX A)
HIS82 (LUX B)
ARG85 (LUX B)
ARG119 (LUX B)
ALA81 (LUX A)
CAT2−36.63PRO79 (LUX A)
ARG85 (LUX A)
THR119 (LUX A)
LYS274 (LUX A)
HIS81 (LUX B)
ALA81 (LUX A)
ARG85 (LUX B)
EGC1−35.88TYR110 (LUX A)
ALA174 (LUX A)
GLU175 (LUX A)
ILE191 (LUX A)
SER227 (LUX A)
TYR254 (LUX A)
LEU109 (LUX A)
VAL173 (LUX A)
LEU192 (LUX A)
Publisher’s Note: MDPI stays neutral with regard to jurisdictional claims in published maps and institutional affiliations.

