Article

Reaction Extraction of Levulinic Acid and Formic Acid from Cellulose Deep Hydrolyzate

1
School of Chemical Engineering and Technology, National Engineering Research Center of Distillation Technology, Tianjin University, Tianjin 300072, China
2
Zhejiang Institute of Tianjin University, Ningbo 315201, China
*
Authors to whom correspondence should be addressed.
Processes 2022, 10(4), 734; https://doi.org/10.3390/pr10040734
Submission received: 18 March 2022 / Revised: 2 April 2022 / Accepted: 5 April 2022 / Published: 11 April 2022

Abstract

:
Levulinic acid (LA), a platform chemical with high added value, can be obtained by deep hydrolysis of cellulose, but accompanied by the production of formic acid (FA). Due to its high water content, the recovery of levulinic acid and formic acid from aqueous solution consumes a lot of energy in industry. This paper will use the method of reactive extraction to explore the optimal conditions for the recovery of levulinic acid and formic acid from deep hydrolysate. First, the kinetic and thermodynamic parameters of the reaction process were studied. Then, the effects of different parameters, such as temperature, catalyst dosage, and raw material ratio, on the reaction extraction process were investigated. Finally, through the simulation and optimization of the process, the optimized recovery conditions were chosen to realize the recovery of formic acid and levulinic acid. It is found that reactive extraction can achieve the purpose of efficiently separating levulinic acid and formic acid from the aqueous solution by the yield of 99.1% and 99.9%, respectively.

1. Introduction

Due to the depletion of fossil energy, the conversion of renewable biomass energy into platform chemicals and biofuels has attracted people’s attention [1], so it is an ideal alternative to product carbon-based chemicals in the future [2]. As the most abundant biomass resource on earth, cellulose can not only be recycled, but also be easily biodegradable and environment-friendly [3]. Therefore lignocellulosic biomass is a favorable alternative to replace petroleum as new ablesource of carbon [4]. Levulinic acid, one of the products of deep hydrolysis of cellulose, is one of the important products of biomass hydrolysis, and is listed as one of 12 biomass-based materials by the U.S. Department of Energy [5]. Levulinic acid is the basic raw materials for the synthesis of various light chemical products [6]. It is widely used in pesticides, solvents, and many chemical industries.
The advantages of deep hydrolysis of cellulose to prepare levulinic acid are that it is cheap and easy to obtain raw materials, regeneration is rapid, and it is environmentally friendly. It involves multiple steps. First, cellulose is hydrolyzed to produce glucose under the catalysis of inorganic acid. Then glucose is isomerized to fructose, and fructose is heated to catalyze the removal of three molecules of water to form 5-hydroxymethylfurfural. Finally 5-hydroxymethyl Furfural is further decarboxylated to generate levulinic acid and formic acid [7]. Although some intermediate steps may be more suitable in organic solvents, water is a more suitable solvent for the synthesis of levulinic acid than others [8]. But for the protection of the equipment, a large amount of water is added during the reaction, which makes it energy-intensive to recover levulinic acid and formic acid from the system.
At present, the methods which have been used to separate levulinic acid from aqueous solution include adsorption, extraction, precipitation, distillation, nanofiltration, reverse osmosis, and electrodialysis [9]. The typical industrial method used to separate levulinic acid is distillation, which is simple and beneficial to engineering. However, there will be amounts of heat steam cost for distillating water out. Moreover, the boiling points of water and formic acid are close, so it is difficult to separate them by distillation. Adsorption can achieve high removal rates, even if the feedstock content is low. Besides, its adsorbent is easy to remove and can be reused. However, due to the similar chemical properties of formic acid and levulinic acid, their adsorbents are difficult to selectively adsorb and separate. The waste adsorbent also needs professional treatment (otherwise it will pollute the environment). Reactive extraction is an ideal recovery method that not only solves the problem that formic acid and water have similar boiling points, but also does not cause the problem of adsorbent pollution.
Reactive extraction is a technique that utilizes the chemical reaction between the extractant and the extract to achieve the purpose of separation. That is, the physical properties (mainly dissolution properties) between the extract compound, formed by the chemical reaction between the extract and the extractant, and the unreacted substances in the separated system have changed, thereby achieving separation [10]. Compared with ordinary extraction, reactive extraction requires smaller solvent volume, less solubility in water, and higher separation degree. Hasan Uslu [11] used the LSER model to determine the extractability of TPA dissolved in toluene to levulinic acid. Dipaloy Datta et al. [12] used n-octanol(OC) as solvent and tri-n-butyl phosphate (TBP) and tri-n-octylamine (TOA) as extractants to explore the reactive extraction of levulinic acid at room temperature with a 90% yield. Sumalatha Edaab et al. [13] used MIBK and TOA to separate levulinic acid and the final levulinic acid yield reached 98%. In the previous studies, most of them used the extraction method of complex extraction, and mostly the recovery of levulinic acid was studied alone. There were very few studies of reactive extraction for recovery of both formic acid and levulinic acid from aqueous solution.
In this paper, the esterification reaction was used to achieve the reactive extraction of formic acid and levulinic acid, which reaction extractant is n-octanol and the reaction catalyst is H-ZSM-5 [14]. Firstly, the kinetic parameters and thermodynamic features of formic acid and levulinic acid were studied by esterification experiments and LLE experiments. Then the effects of stirring speed, catalyst dosage, reaction temperature and initial reactant ratio on the yield of reactive extraction were studied, and optimized these important conditions. Finally, the simulation and optimization of the reactive extraction were achieved by Aspen Plus.

2. Materials and Methods

2.1. Chemicals

Formic acid was supplied by Shanghai Anaiji Chemical Company and levulinic acid was supplied by Shanghai Aladdin Reagent Company, both of them are analytical reagent (AR) grade and can be used directly. Analytical grade n-octanol (99%) from Macklin was used without further purification. H-ZSM-5(Si/Al = 25) was made in the chemical plant of Nankai University in Tianjin.

2.2. Esterification Reaction

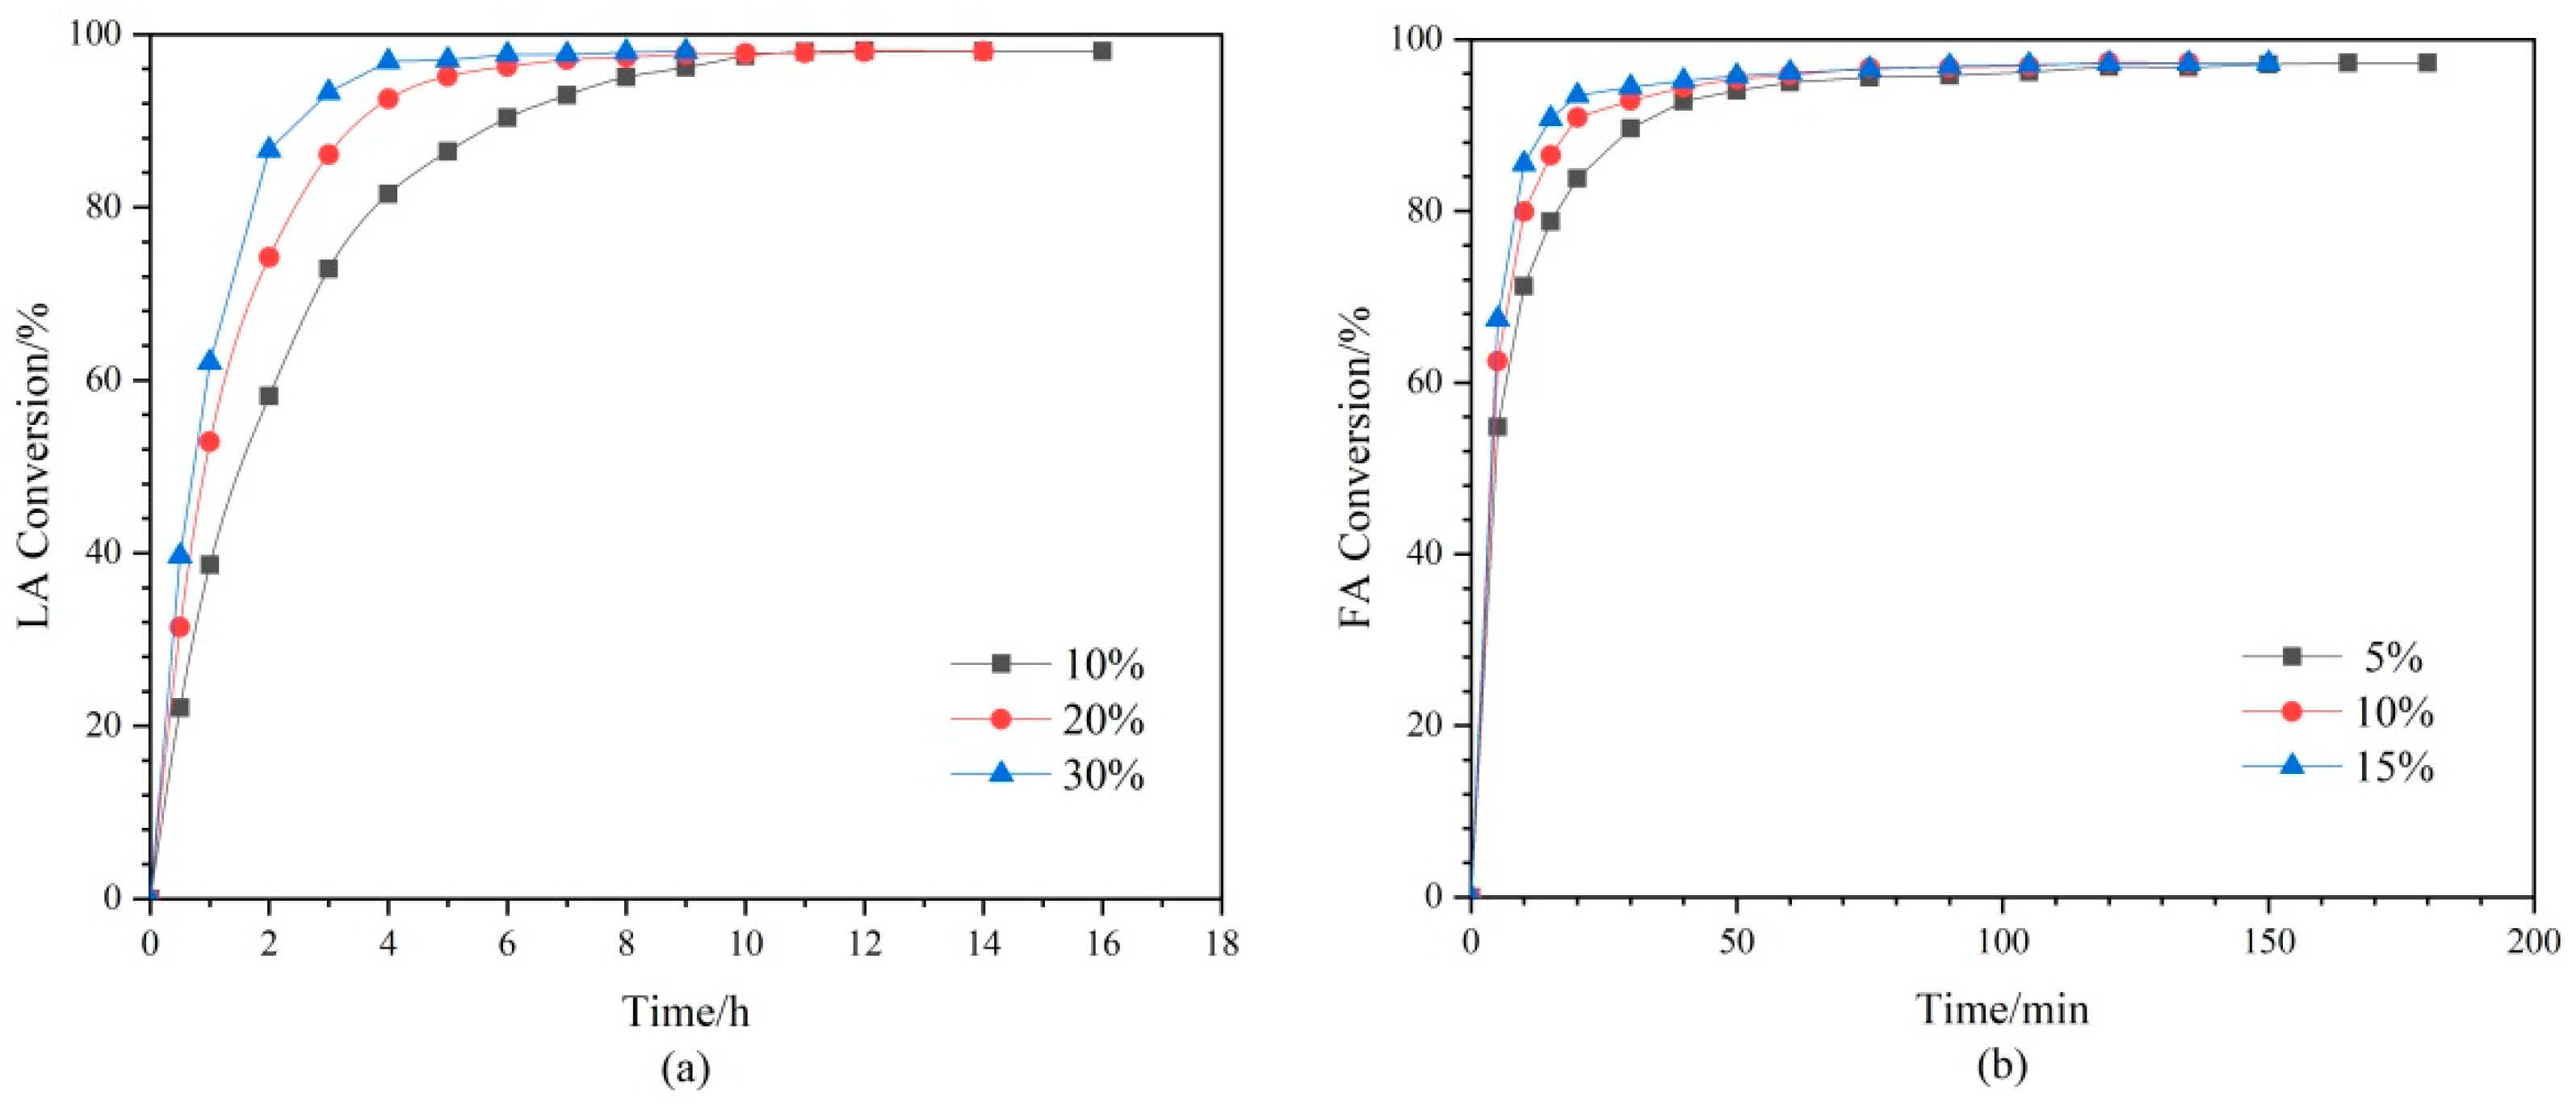
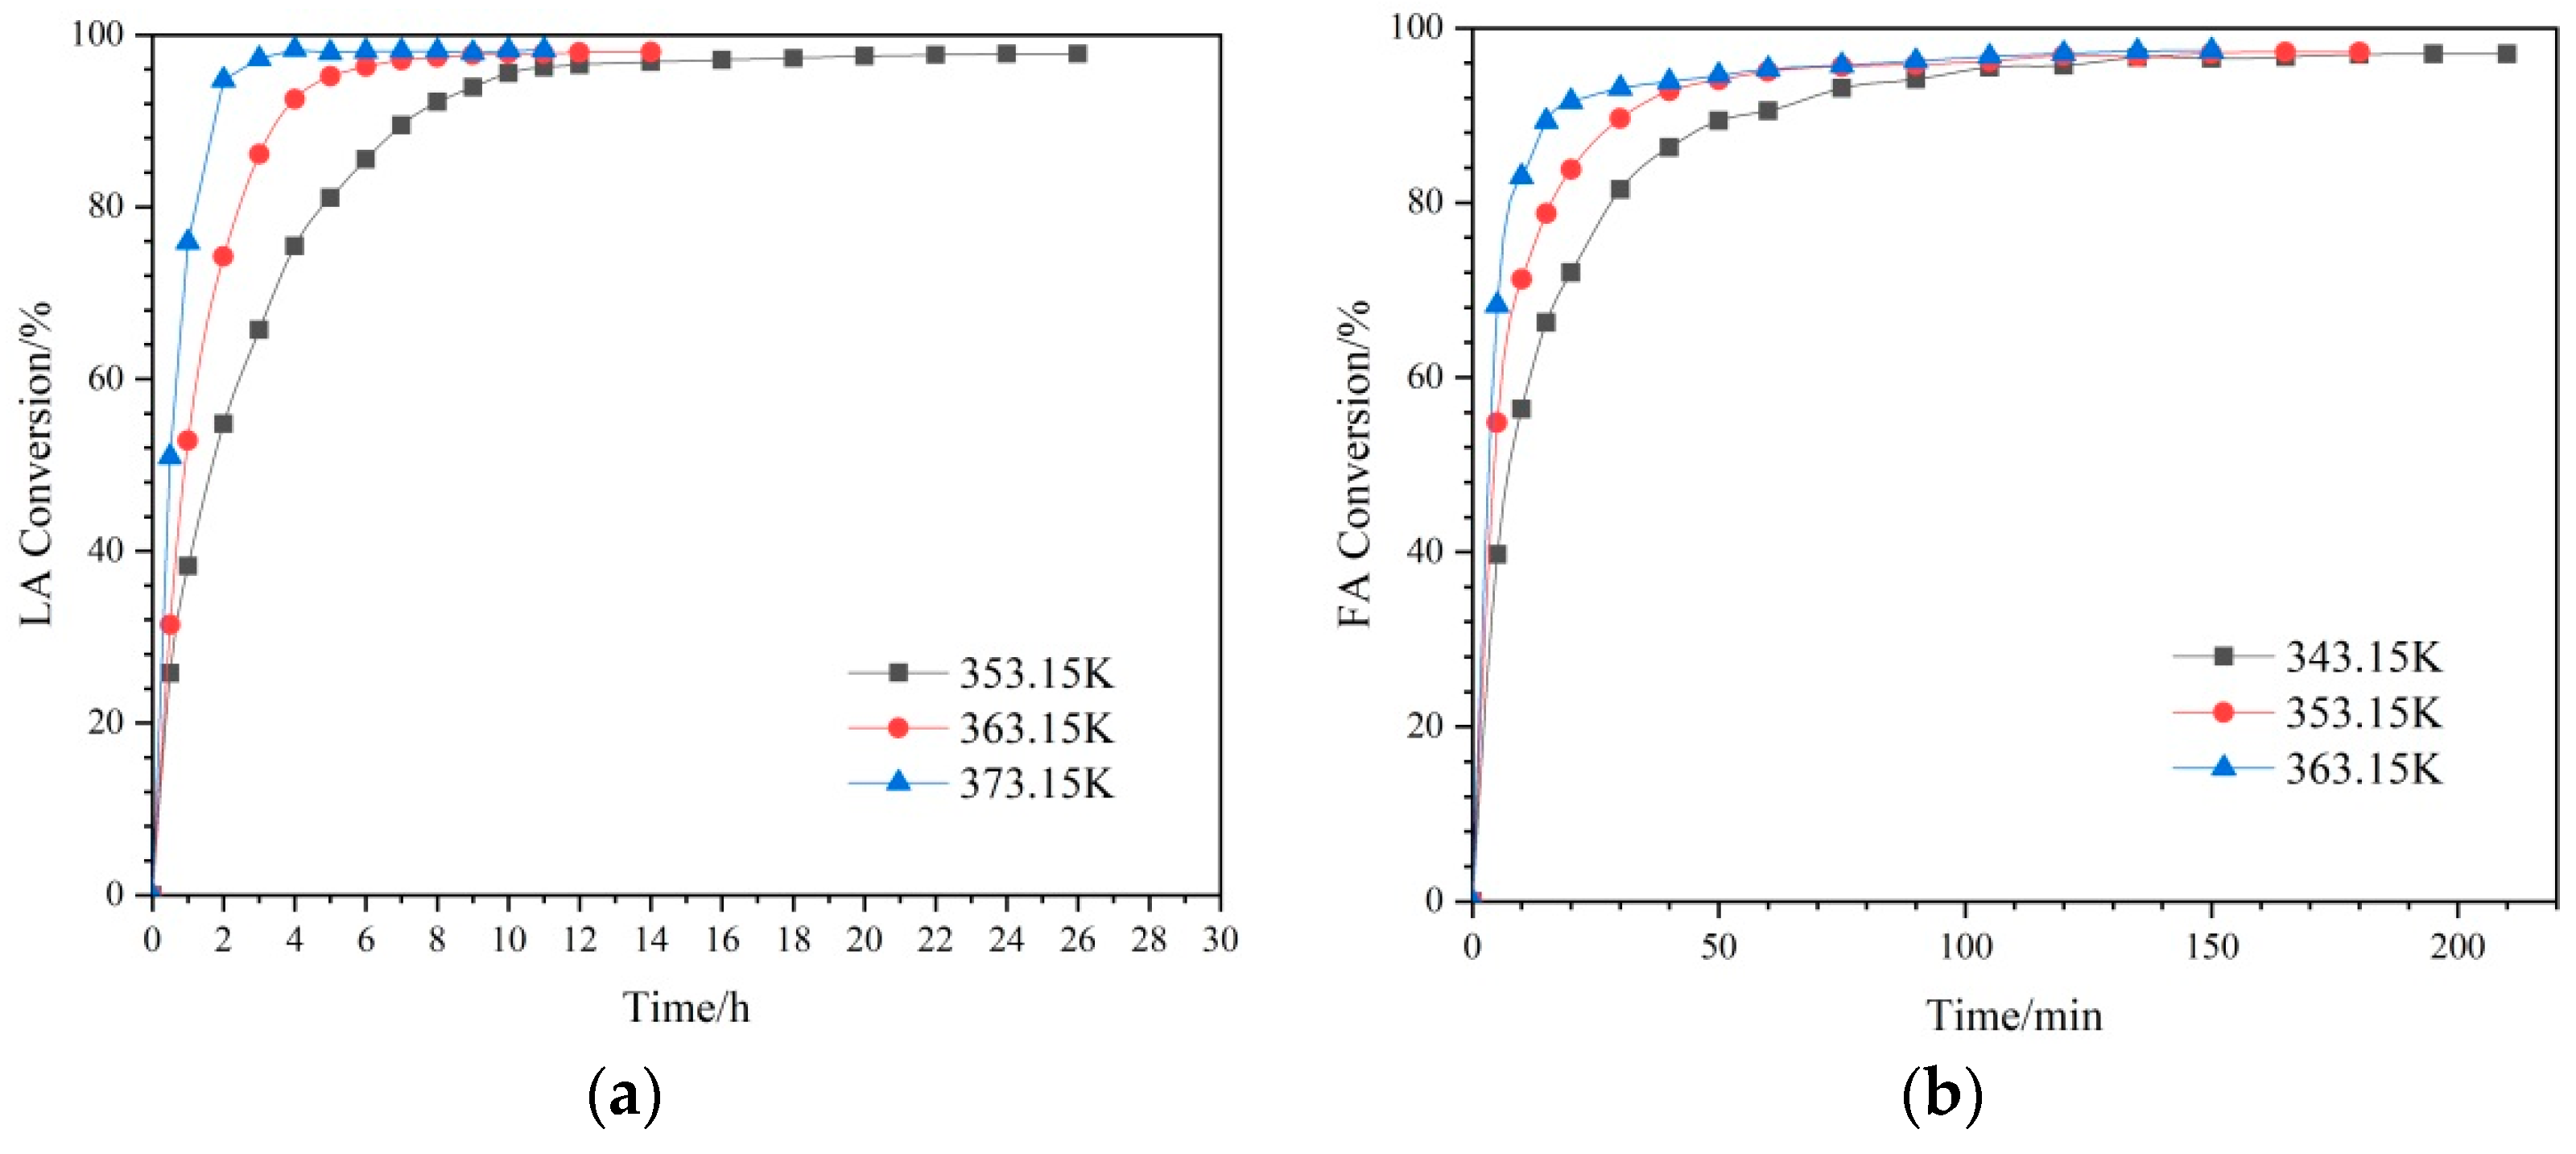
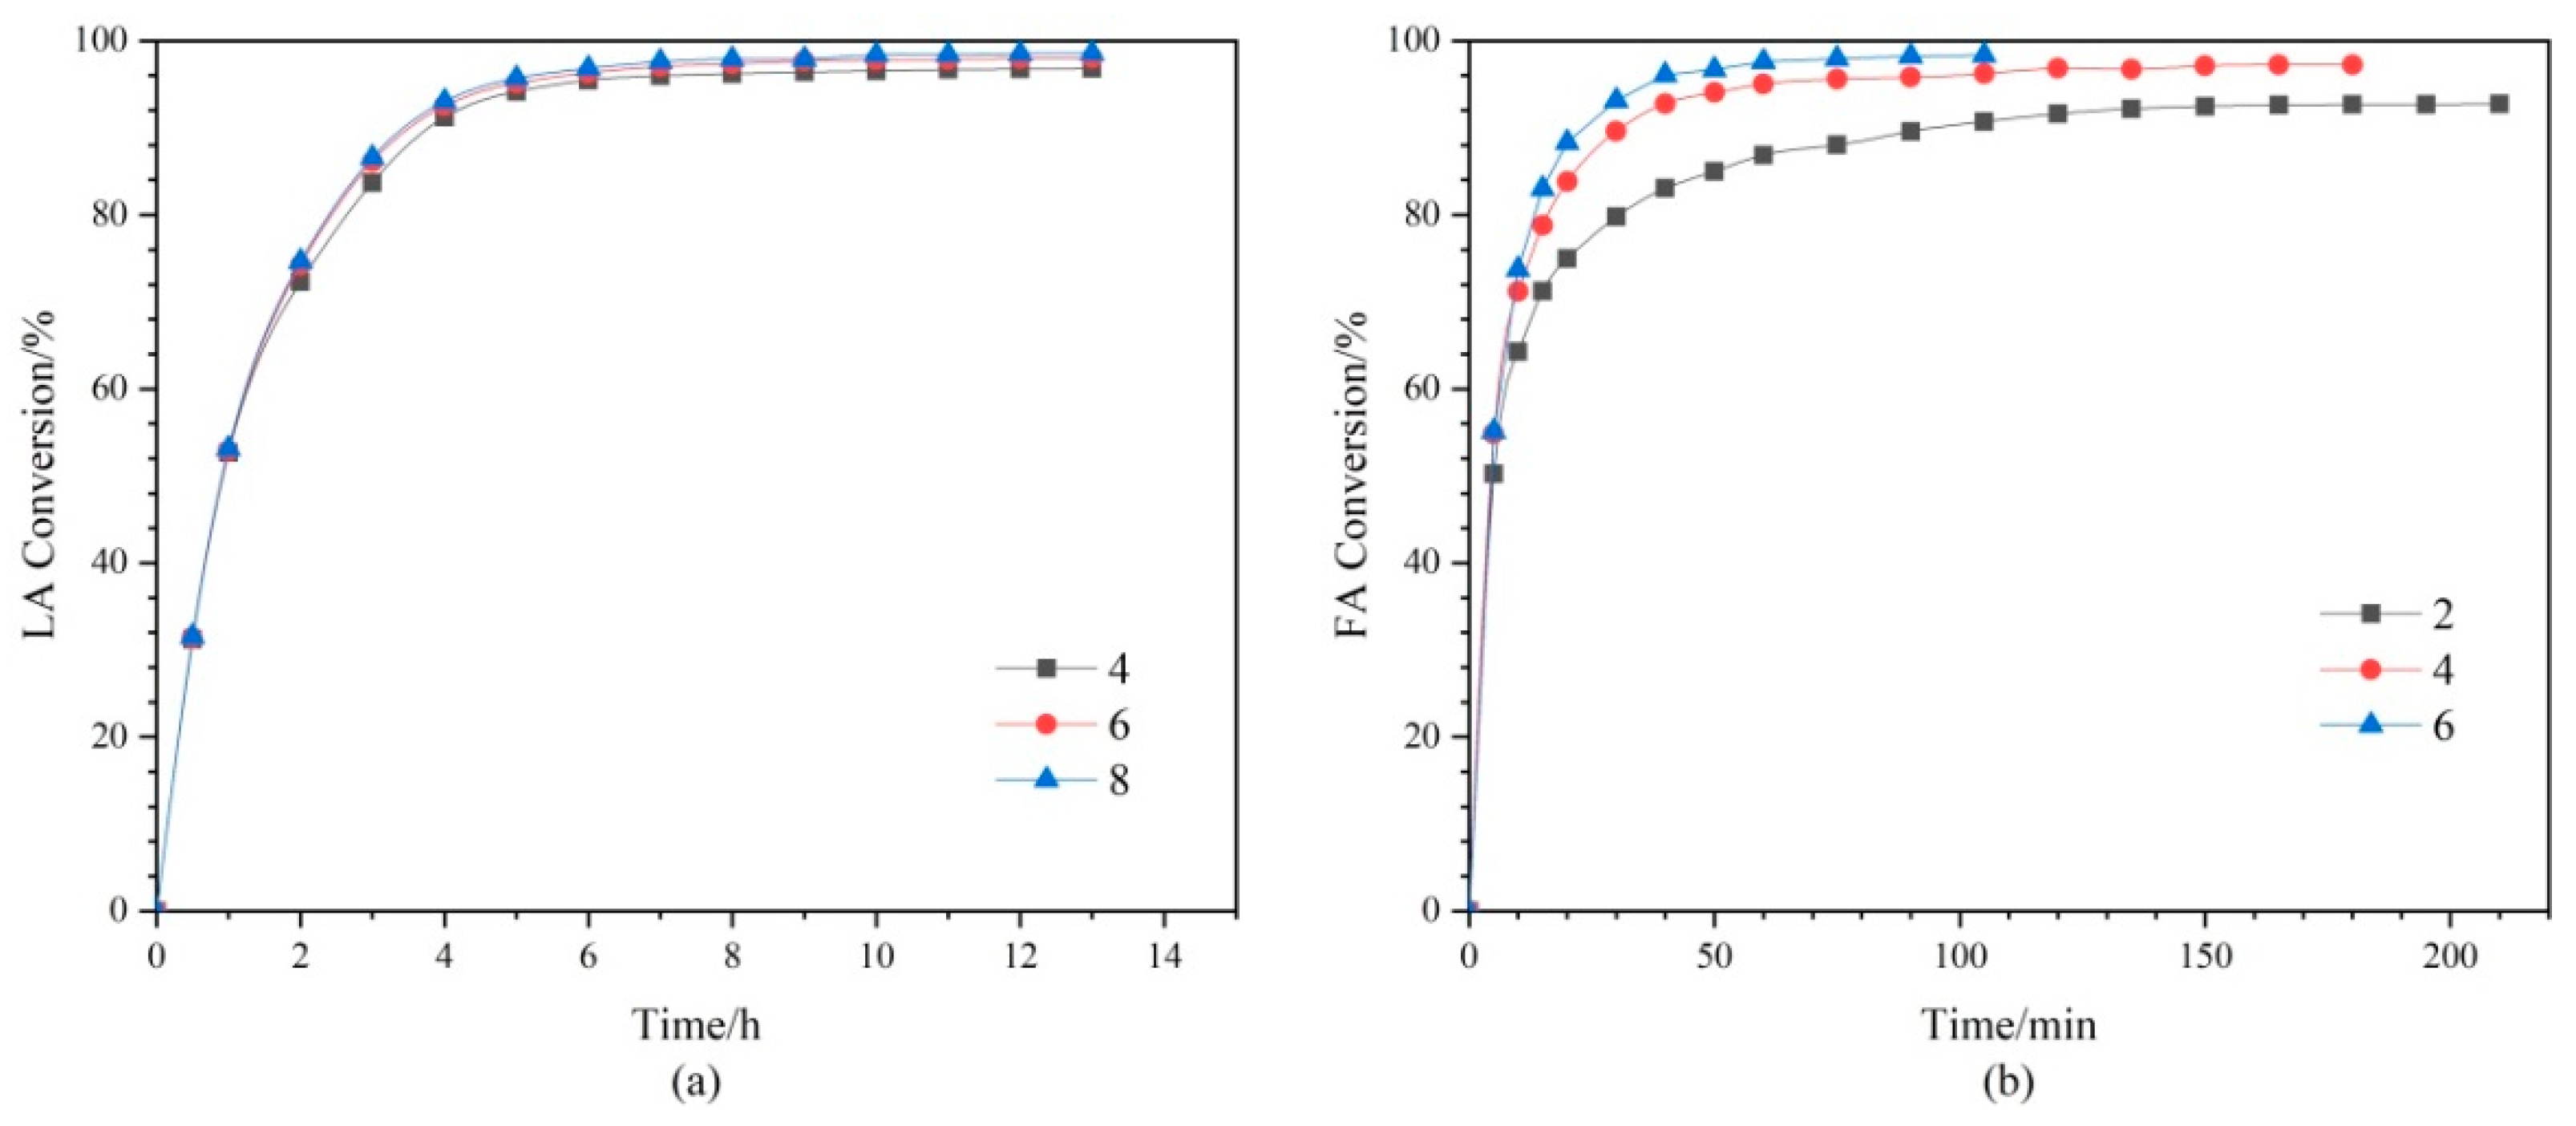
The esterification reactions were carried out in a 250 mL round bottom flask. Before the reaction, specific amounts of n-octanol and H-ZSM-5 were charged into the flask and heated until the desired temperature at stirring of 600 rpm, and then the preheated acid was added. Liquid samples were withdrawn at interval times, and were rapidly cooled down to prevent the further reaction. The FA or LA conversion was calculated from the final octyl formate (OF) or octyl levulinate (OL) concentration. The sign that the esterification experiment reaches equilibrium is that the concentration of the corresponding ester no longer changes. All experiments in this paper were repeated three times to ensure reproducibility.

2.3. Liquid-Liquid Equilibrium (LLE)

The liquid-liquid equilibrium (LLE) experiments of FA + OF + OC + Water and LA + OL + OC + Water were carried out in a 250 mL round bottom flask. The specific mass of FA + OF or LA + OF, n-octanol and water were added to a flask and heated and stirred in a magnetic stirrer, after which the mixtures were vigorously stirred for 1 h and then stopped stirring and settled for 3 h to reach extraction equilibrium. The upper layer is the extract phase, and the lower layer is the raffinate phase. After sampling carefully from both phases using syringes, the samples from the two phases were tested by gas chromatography and liquid chromatography.

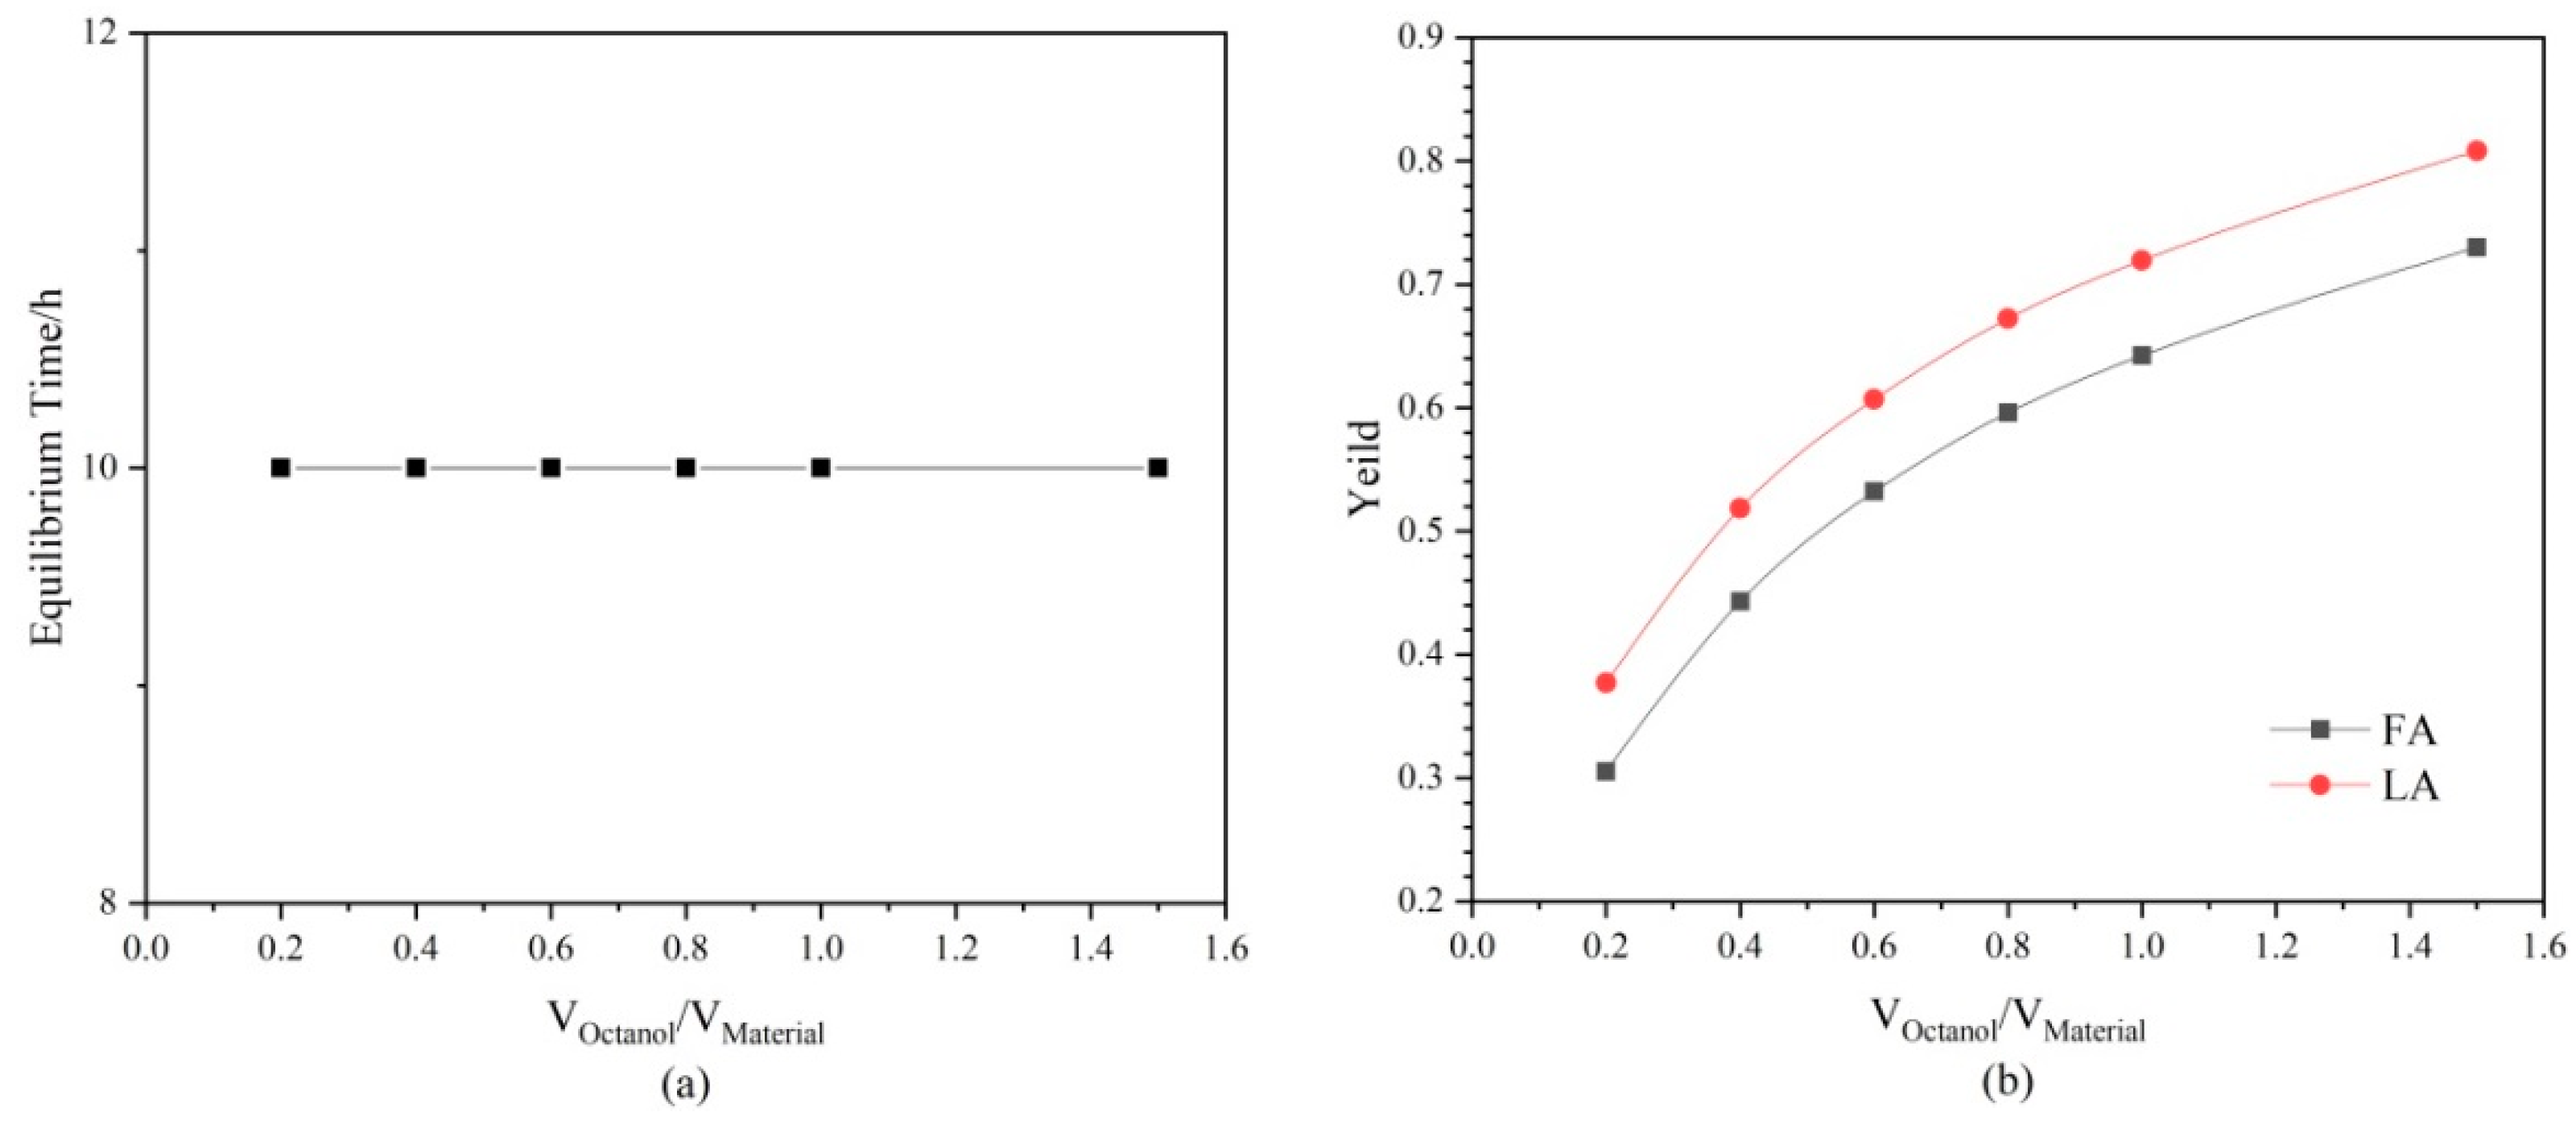
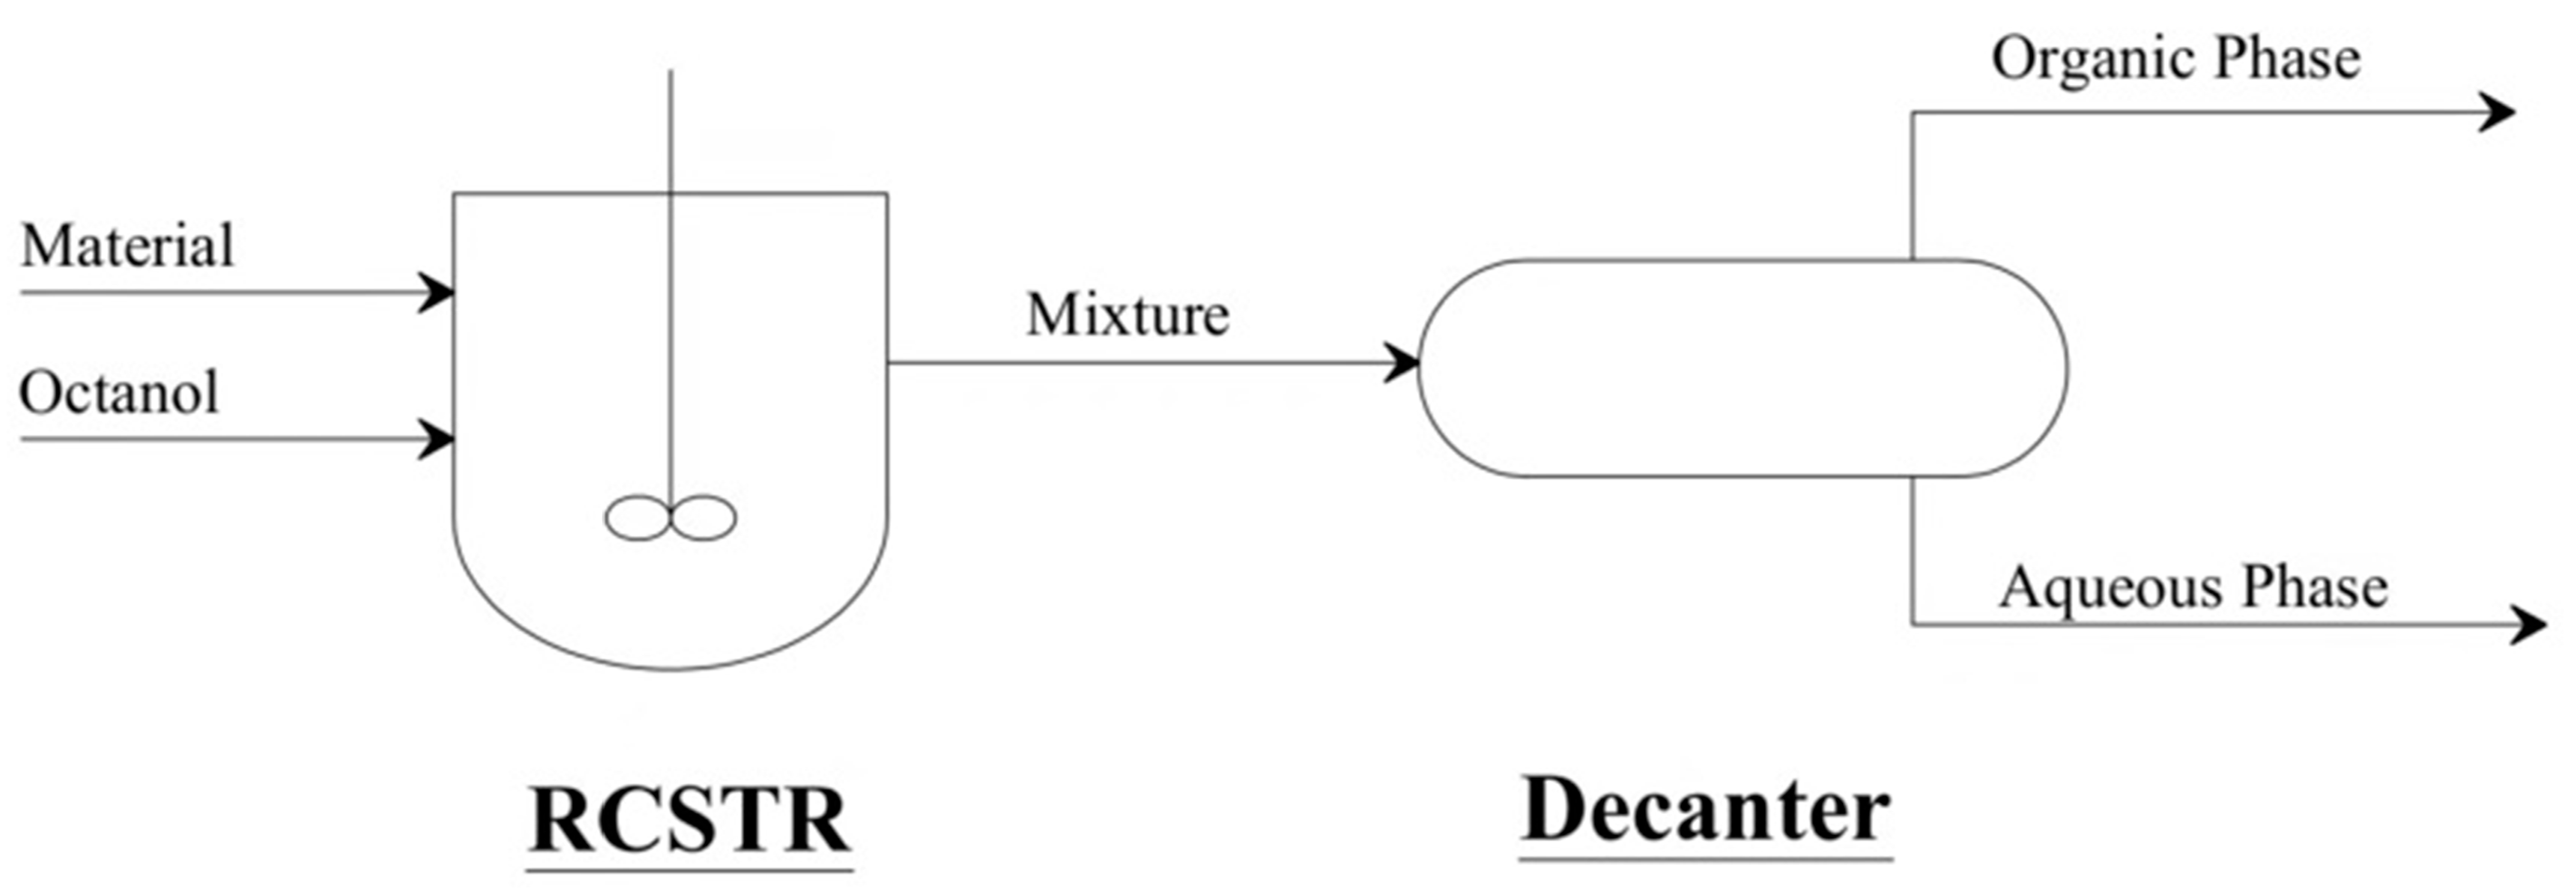
2.4. Reactive Extraction

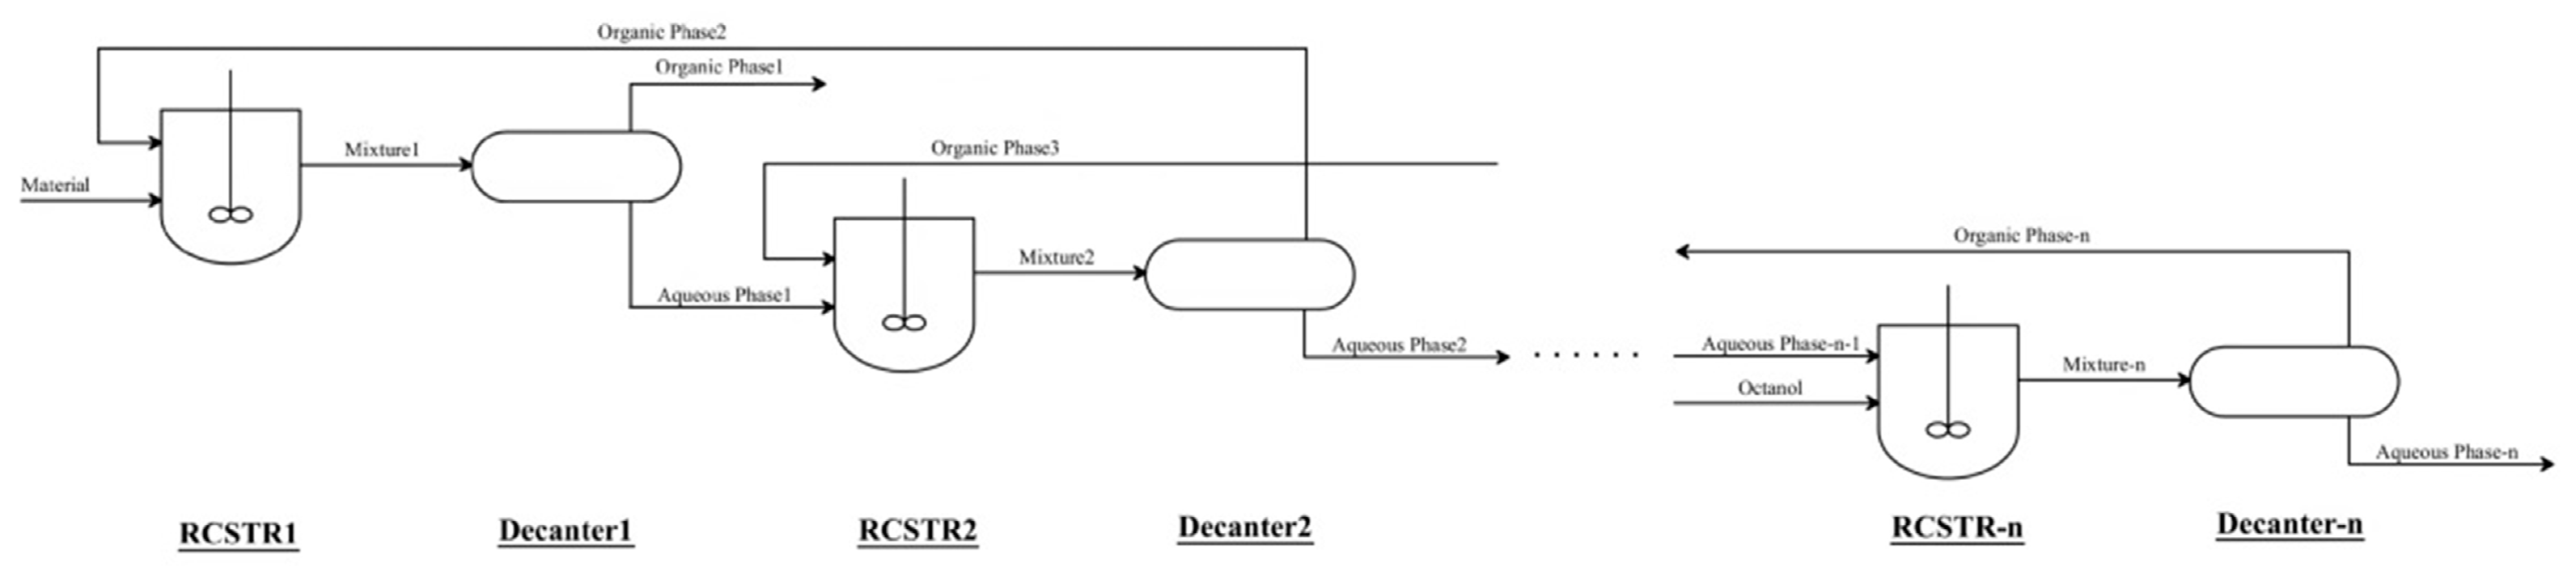
Reactive extraction of LA and FA was carried out in a 250 mL round bottom flask equipped with a condensing tube, which was heated by a magnetic stirrer. The raw material aqueous solution and the catalyst were added to the three-necked flask, and then stirred and heated. After heating to the specified temperature, the preheated n-octanol was added, and then start timing. Intermediate sampling was executed in the mixed state of the reaction. The liquid mixtures were centrifuged at a specific temperature, and then collected samples from the upper and lower phases separately. The data obtained is the two-phase composition obtained after liquid-liquid stratification at the time of sampling.

2.5. Analytical Method

Samples of n-octanol phase were measured by a GC (American Thermo Scientific, Austin, TX, USA, Trace 1300) equipped with a flame ionization detector (FID) and using an external standard method. The column was a DB-FFAP column (30 m × 0.25 mm × 0.25 µm). The detection conditions for the systems were as follows: the carrier gas was nitrogen (>99.999% purity), the injector temperature was 350 °C and the detector was at 350 °C, the column oven was maintained at 80 °C for 1 min firstly and then utilized the temperature programmed system from 80 to 240 °C at a rate of 40 °C min−1 and maintained at 240 °C for 2 min.
Samples of aqueous phase were analyzed by a liquid chromatograph (American Thermo Scientific, Austin, TX, USA, Ultimate 3000) equipped with a UV detector at a wavelength of 210 nm and an Aminex HPX-87H carbohydrate analysis column (300 mm × 7.8 mm, Bio-Rad, Hercules, CA, USA) using an external standard method. The temperature of oven was set to be at40 °C. The 0.005 M sulfuric acid with a flow rate of 0.6 Ml/min was our mobile phase.
The moisture content of samples was analyzed by Karl Fischer micro-moisture tester (Beijing Pioneer Wei-Feng Technology, Beijing, China, ZDJ-3S). Its titrant is a Karl Fischer reagent (Tianjin Concord Technology, Tianjin, China, KFR-1202).

3. Result and Discussion

3.1. Esterification Experiments

Considering the influence of many factors on the esterification reaction, the effects of these reaction parameters were studied to obtain the kinetic and thermodynamic parameters of the esterification reaction and determine better reaction conditions.

3.1.1. Effect of Catalyst Dosage

The effect of catalyst dosage was assessed from 5 to 30% (5 to 15%) (wt% of the total mass of OC and LA (OC and FA)) was illustrated in Figure 1a,b, with the fixed reaction temperature and OC to LA (OF to FA) molar ratio of 363.15 K and 6 (353.15 K and 4). From Figure 1a,b, it can be concluded that with the catalyst dosage increased, the reaction rate increased and the equilibrium conversion did not change. This is due to the fact that the presence of catalyst only affects the reaction rate and does not affect the reaction equilibrium. Therefore, the greater the amount of catalyst, the faster the reaction is.

3.1.2. Effect of Reaction Temperature

The effect of temperature was investigated from 353.15 K to 373.15 K under the following conditions: 20% H-ZSM-5 catalyst dosage and OC to LA molar ratio of 6. The effect of temperature of FA was assessed varying from 343.15 K to 363.15 K at 5% H-ZSM-5 catalyst dosage and an initial molar ratio of 4. Both the reaction rate and the equilibrium conversion of materials are affected by temperature as observed in Figure 2a,b. These results indicate that for LA and FA, the reaction rate and the equilibrium conversion are both increased with the temperature, which means LA esterification and FA esterification are endothermic.

3.1.3. Effect of Initial Reactants Ratio

The esterification of OC to LA was studied in the initial molar ratio from 4:1 to 8:1 with 20% H-ZSM-5 dosage and 363.15 K, and the effect of initial OC to FA molar ratio was from 2:1 to 6:1 with 5% H-ZSM-5 dosage and 353.15 K. As observed from Figure 3a,b, increasing the reactants molar ratio can remarkably increase the FA and LA conversion. This is due to the fact that the equilibrium constant of the reaction is certain under specific conditions. This means that the presence of excess n-octanol will increase the acid conversion and the conversion rate of LA and FA.

3.1.4. Chemical Equilibrium

The reaction equations of esterification of formic acid and levulinic acid are as follows:
CH 2 O 2   +   C 8 H 18 O     C 9 H 18 O 2   +   H 2 O
  C 5 H 8 O 3   +   C 8 H 18 O     C 13 H 24 O 3   +   H 2 O
The pseudo-homogeneous (PH) model [15,16] is used to fit esterification reactions of LA and FA as follows [17]:
r = r A = k 1 c A c B     k 2 c C c D   = k 1 ( c A c B   -   1 K eq c C c D )
K eq   =   k 1 / k 2
where K eq is the chemical equilibrium constant, k 1 is the kinetic constant of the forward reaction, and k 2 is the kinetic constant of the backward reaction, c A ,   c B represent the concentrations of reactants, c C ,   c D represent the concentrations of products (mol/L).
The equilibrium constant expressions for the esterification of LA and FA are described as follows [18]:
K LA   = C OL C Water C LA C OC
K FA   = C OF C Water C FA C OC
where K LA is the chemical equilibrium constant of LA, K FA is the chemical equilibrium constant of FA, and C OL ,   C OF ,   C LA , C FA , C OC and C Water represent the concentrations of OL, OF, LA, FA, OC and water (mol/L).
The Vant’ Hoff equation was used to calculate the standard reaction enthalpy:
lnK = H RT + C
where K is the chemical equilibrium constant, T is the temperature in Kelvin, R is the gas constant, C is a constant. The linear plot of lnK versus 1/T is illustrated in Figure 4. So,
lnK FA = 916.762 T + 5.048
lnK LA = 1431.082 T + 6.210
According to
k i = k i , 0 e - E a , i RT
So
lnk = E a RT   +   lnk 0
where E a is the activation energy, and k 0 is the pre-exponential factor. Therefore, by finding the corresponding relationship between the equilibrium constant and temperature, the corresponding activation energy and pre-exponential factor can be obtained.
The linear plots of ln k i versus 1/T of LA and FA are shown in Figure 5:
The kinetic parameters fitted to the experimental data are summarized in Table 1.

3.2. Liquid-Liquid Equilibrium

This part introduces the liquid-liquid extraction phase equilibrium theory, aiming to study the liquid-liquid extraction phase equilibrium data of our system, and provide a basis for the process design and simulation of the reactive extraction process [19].

3.2.1. Liquid-Liquid Phase Equilibrium Experiment

This section measures the liquid-liquid equilibrium data of the FA-OF-OC-water and LA-OL-OC-water quaternary systems at 323.15 K, 343.15 K, and 363.15 K, which are listed in Table 2 and Table 3 (the data in the table are all mass percent).
From the above results, the solubility of OF and OL in n-octanol is greater than that of FA and LA. This confirms that the yields of FA and LA obtained by the reactive extraction method are far greater than those obtained by simple extraction. It further confirms the feasibility of the reactive extraction scheme.

3.2.2. Regression of Model Parameters

As shown in Table 4 and Table 5, the UNIQUAC model in the activity coefficient model is used to regress and fit the above experimental data [20], and the result of the fit is obtained by the regression function of the Aspen Plus.

3.3. Reactive Extraction for FA and LA

Since n-octanol can act as an extractant as well as a reactant, it means that it can be used to generate esters and extract acids and esters. Therefore, when considering the yields of formic acid and levulinic acid, it is necessary to comprehensively consider the amount of formic acid and octyl formate and levulinic acid and octyl levulinate in n-octanol, that is:
Yield = n O-OC   +   n A-OC n 0
where nO-OC is ester content in n-octanol phase, nA-OC is acid content in n-octanol phase, and n 0 is acid content in material. On this basis, the following is an exploration of the effects of different factors on reaction extraction time and yield.
The experimental data of esterification experiments shows that the equilibrium time of formic acid is much shorter than that of levulinic acid. Therefore, when considering the equilibrium time later, the time standard for assessing whether equilibrium is reached is the time when the esterification reaction of levulinic acid is reached. The criterion to judge the equilibrium of reactive extraction is that the concentration of each substance in the two phases is not changed.
Considering the stirring speed, catalyst concentration, initial reactant ratio and reaction temperature have a great influence on the reactive extraction process [21], these factors were explored and discussed to screen for suitable conditions.

3.3.1. Effect of Stirring Speed

Reactive extraction experiments were carried out with stirring speed from 200 rpm 1000 rpm with 20% H-ZSM-5 as catalyst and n-octanol/aqueous phase volume ratio 0.6:1 at 363.15 K. Figure 6a shows that, as the stirring speed increases, the time for the reaction to reach equilibrium first decreases and then increases. The reason is that in the presence of solid catalyst, the increase of stirring speed affects the mixing degree of the system. The higher the mixing degree of the system, the higher the probability of raw material collision is, and the reaction becomes faster. However, with the gradual increase of stirring speed to a certain level, some solids will be centrifuged [22], which will change the distribution of catalyst in the system and reduce the concentration, so it will affect the reaction speed to a certain extent, resulting in the increase of reaction equilibrium time. Besides, according to Figure 6b, the stirring speed does not affect the reaction equilibrium of LA or FA. So, it can be concluded that 600 rpm is the most suitable stirring speed, which is basically consistent with the literature [23].

3.3.2. Effect of Catalyst Dosage

The catalytic activity of H-ZSM-5 on reactive extraction of LA and FA was carried out with a catalyst dosage of 5–30% with a reaction temperature of 363.15 K, n-octanol/aqueous phase volume ratio 0.6:1 and stirring speed of 600 rpm. As shown in Figure 7a, the less catalyst (i.e., the reaction of 5% H-ZSM-5) is completed after 28 h, while the highest catalytic concentration (i.e., 30% H-ZSM-5) occurs after 8 h. So, the larger the amount of catalyst is, the shorter the time of the reaction to the equilibrium. As for the effect of catalyst dosage on reaction yield, it can be concluded from Figure 7b that under different catalyst dosage, the fluctuations in yield are small and similar for both acids, which means they are probably the yield errors caused by the number of materials. Therefore, the amount of catalyst has no effect on the yield of reactive extraction. However, considering the cost of catalyst and the influence of a large number of catalysts on the mixing degree of the system, 20% was finally selected.

3.3.3. Effect of Reaction Temperature

The reactive extraction was carried out in the region 323.15–383.15 K (the test was carried out in an autoclave.) with 20% H-ZSM-5 as catalyst and n-octanol/aqueous phase volume ratio 0.6:1 at a stirring rate of 600 rpm. As displayed in Figure 8, the temperature affects both the reaction rate and the equilibrium conversion, and the reaction become faster with the rising temperature. From Figure 8a, it can be concluded that with the increase of temperature, the time to equilibrium decreases, from 84 h to 4 h. Temperature has positive influence on reactive extraction since the increase of temperature increases the energy of the molecules in the system, which in turn accelerates the reaction. It also speeds up the movement of molecules, which in turn accelerates the diffusion. According to Figure 8b, with the increase of temperature, the reaction rate increases. The yield of LA is 49.4% at 323.15 K and 65% at 383.15 K, the yield of FA is 51.4% at 323.15 K and 53.6% at 383.15 K, which means that both of the yields of LA and FA increased with the increase of temperature.

3.3.4. Effect of Initial Reactant Ratio

From the LLE point of view, OL and OF is more soluble than LA and FA in the n-octanol according to Section 3.2. With 20% H-ZSM-5 dosage, 600 rpm and 363.15 K, the effect of initial n-octanol/aqueous phase volume ratio was studied from 0.2:1 to 1.5:1 (the molar ratio of n-octanol to FA and LA is about from 2:1 to 15:1). Figure 9a,b show the variation of reaction time and the OL, OF, LA and FA contents in octanol phase with various initial molar ratio of n-octanol to acid. It can be concluded from Figure 9a that increasing the amount of n-octanol has no effect on the reaction time. The main reason is that in our system, the content of water is large and the content of acid is small. Therefore, it reduces the dilution effect of the addition of n-octanol, so that the influence of n-octanol content on the system is reduced. As can be seen from Figure 9b, changing the volume ratio of n-octanol to raw material is about 0.2:1 to 1.5:1 increases the LA conversion from 37.7% to 80.8% at 10 h, and increases the FA conversion from 30.5% to 73%. The yields of levulinic acid and formic acid increase with the increase of the amount of n-octanol.
Above all, with 20% H-ZSM-5 dosage, 600 rpm, 363.15 K and initial n-octanol/aqueous phase volume ratio 1.5:1, the yield of FA was 73%, the yield of LA was 80.8%.

3.4. Simulation and Optimization

In this part, the software program Aspen Plus was used to simulate and optimize the reaction extraction process through a multi-stage reactive extraction method [24] to achieve the separation of formic acid and levulinic acid. Multi-stage extraction can be divided into multi-stage crosscurrent extraction and multi-stage countercurrent extraction, so multi-stage reactive extraction can also be in two forms: multi-stage crosscurrent reactive extraction and multi-stage countercurrent reactive extraction. These two forms of reactive extraction will be simulated and optimized, respectively, in the following work.

3.4.1. Experimental Data Fitting

Before the simulation optimization, by setting simulating parameters according to the obtained kinetic and thermodynamic parameters, the batch reactor and the separation tank were used to fit the reaction kinetic data and liquid-liquid equilibrium data, and then compared them with the experimental reactive extraction data to verify the reliability. In Figure 10, the modules selected for fitting data were the fully mixed flow reactor model RCSTR and the liquid-liquid equilibrium extraction tank model decanter, which are the coupling of the commonly used fitting models for reactive extraction.
The results of the experimental and simulated values are as Figure 11. It can be seen that, whether for formic acid or levulinic acid, the error between the obtained simulated value and the experimental result is within 10%, which proves the reliability of the kinetic and thermodynamic parameters.

3.4.2. Multistage Crosscurrent Reactive Extraction

Multistage crosscurrent reactive extraction is to extract the raffinate phase after one extraction by contacting with fresh extractant again. Its mechanism is to break the balance of materials at this stage by adding n-octanol in batches, promote the reaction to proceed in the forward direction, and then improve the yield of raw materials in the process of reaction extraction. The simulation process is shown in Figure 12.

Effect of Single-Stage Reaction Extraction Time

In this section, the effect of single-stage reaction extraction time on feedstock recovery in the multistage crosscurrent reactive extraction process is investigated. In the simulation process, the reaction time of each reactor was set to be the same, and the amount of newly added n-octanol in each reactor was also the same, which was the volume ratio of n-octanol: raw material = 0.2:1.
From Figure 13, the multi-stage reaction extraction improves the recovery rate of formic acid and levulinic acid, and the more reaction stages, the greater the yields. For example, the yield of formic acid from 23.4% when n = 1 to 88.3% when n = 8, and the yield of levulinic acid increased from 31.6% when n = 1 to 94.9% when n = 8 within 12 h. Besides, it is obvious that the yield of levulinic acid increases with the rising reaction time but the yield of formic acid is basically unchanged. It can be concluded from Figure 13b that for formic acid, even if the reaction time is only 2 h, the esterification reaction of formic acid can reach equilibrium, so the reaction time has little effect on the yield of formic acid. But for levulinic acid, Figure 13a shows that the longer the single-stage reaction time is, the greater the yield of levulinic acid obtained. Since its reaction rate is lower than that of formic acid, it reaches equilibrium until 12 h. So, the yield of levulinic acid increases by rising the reaction time.

Effect of Single-Stage N-Octanol Dosage

According to previous studies, the increase of the amount of extractant has a positive effect on the yield generally. The reaction time of each reactor was set to be 12 h, and the amount of newly added n-octanol in each reactor was the same. When setting the feeding amount of n-octanol, the amount in each reactor was set as the volume ratio of n-octanol:raw material = 0.2:1, 0.3:1, 0.4:1, 0.6:1 and 0.8:1.
From the results in Figure 14, the more n-octanol are used, the higher the formic acid and levulinic acid yields are. By increasing the n-octanol feeding, a high yield can be obtained at a low number of stages. When the number of stages is limited, the yield increases by rising the addition amount. When the number of raw materials is small, the yield increases by rising the number of reaction stages. Both of them affect the final yields. With the increase of reaction extraction stages, the change of yields gradually becomes smooth. This is due to the fact that the concentration of formic acid and levulinic acid gradually decreases as the number of stages increases, so the amount of acid that can be recovered by the same amount of n-octanol will be less. Besides, with the increase of the n-octanol dosage, the change trend of the yield is more obvious at lower grades. This is since the larger the amount of single-stage n-octanol is added, the more formic acid and levulinic acid that can be recovered. The subsequent trends gradually flattened since the higher yields of formic acid and levulinic acid in the previous reaction extraction process, which results in the concentration of raw materials in the aqueous phase decreasing.

3.4.3. Multistage Countercurrent Reactive Extraction

The mechanism of multi-stage countercurrent reactive extraction is to optimize the reactive extraction process by adding raw materials and n-octanol from the first and last stage reactors respectively, so that the two phases form a cross-flow process. Multi-stage countercurrent extraction is a method of two-phase countercurrent contact through multiple extractors, which has the advantages of good operation effect, small consumption of extractant, and good separation efficiency and process efficiency.
The simulation process is shown in Figure 15:
Next, the influence of different factors on the results of reactive extraction was explored. The conditions were explored include: single-stage reaction time, the number of reaction extraction stages and n-octanol dosage. The purpose of exploring the effect of these conditions is to obtain higher yields of formic acid and levulinic acid.

Effect of Single-Stage Reaction Time

The single-stage reaction time affects the process mainly by affecting the conversion rate of raw materials.
Taking n-octanol:raw material = 1:1 as an example, the effect of reaction time on the raw material yield was explored. According to Figure 16b, the reaction time has little effect on the yield of formic acid. The reason for this phenomenon is that the reaction of formic acid can reach an equilibrium state within 2 h. When n = 4, the yield of formic acid can reach 95.4%. For levulinic acid, the overall yield increases as the reaction time increases for the esterification reaction of levulinic acid requires more time to reach equilibrium. When n = 4, the yield of levulinic acid can reach 99.1% within 12 h.

Effect of N-Octanol Dosage

Taking each stage of reaction reaching equilibrium as the benchmark, the addition amount of n-octanol is the volume ratio of n-octanol: raw material = 0.6, 0.8, 1.0, 1.2 and 1.5 five cases.
According to Figure 17, it can be concluded that with the increase of the amount of n-octanol, the yields of formic acid and levulinic acid are gradually improved, and as the dosage increases, the trend of change becomes less obvious. This is due to the fact that under the premise of certain reaction conditions and reaction stages, increasing the amount of n-octanol is conducive to the forward progresses of the esterification reaction of formic acid and levulinic acid, and is also conducive to the dissolution of the acid and its corresponding ester in n-octanol. Therefore, from the two aspects, increasing the amount of n-octanol is conducive to the forward progress of the reaction. Furthermore, with the increase of the number of reaction stages, the overall recovery rate showed an upward trend, but the upward trend is gradually slowing down. The reason for this phenomenon is the reduction of raw materials as the reaction stage increases. In the case of n = 4, when using about 1.5 times of n-octanol, about 99.1% of the formic acid recovery rate and the recovery rate of levulinic acid is 99.9%, which basically realizes the recovery of formic acid and levulinic acid, and achieves our goal.

3.4.4. Comparison of Crosscurrent and Countercurrent Reactive Extraction

Table 6 lists the cases where the levulinic acid yield can reach 99% under the experimental conditions.
According to Table 6, it can be concluded that the number of countercurrent reactive extraction stages is less and the amount of n-octanol is smaller to obtain the same raw material yield, which means that countercurrent reactive extraction is more suitable for the research system of this paper. So countercurrent reactive extraction is chosen and the maximum yields of FA and LA are 99.1% and 99.9%.

4. Conclusions

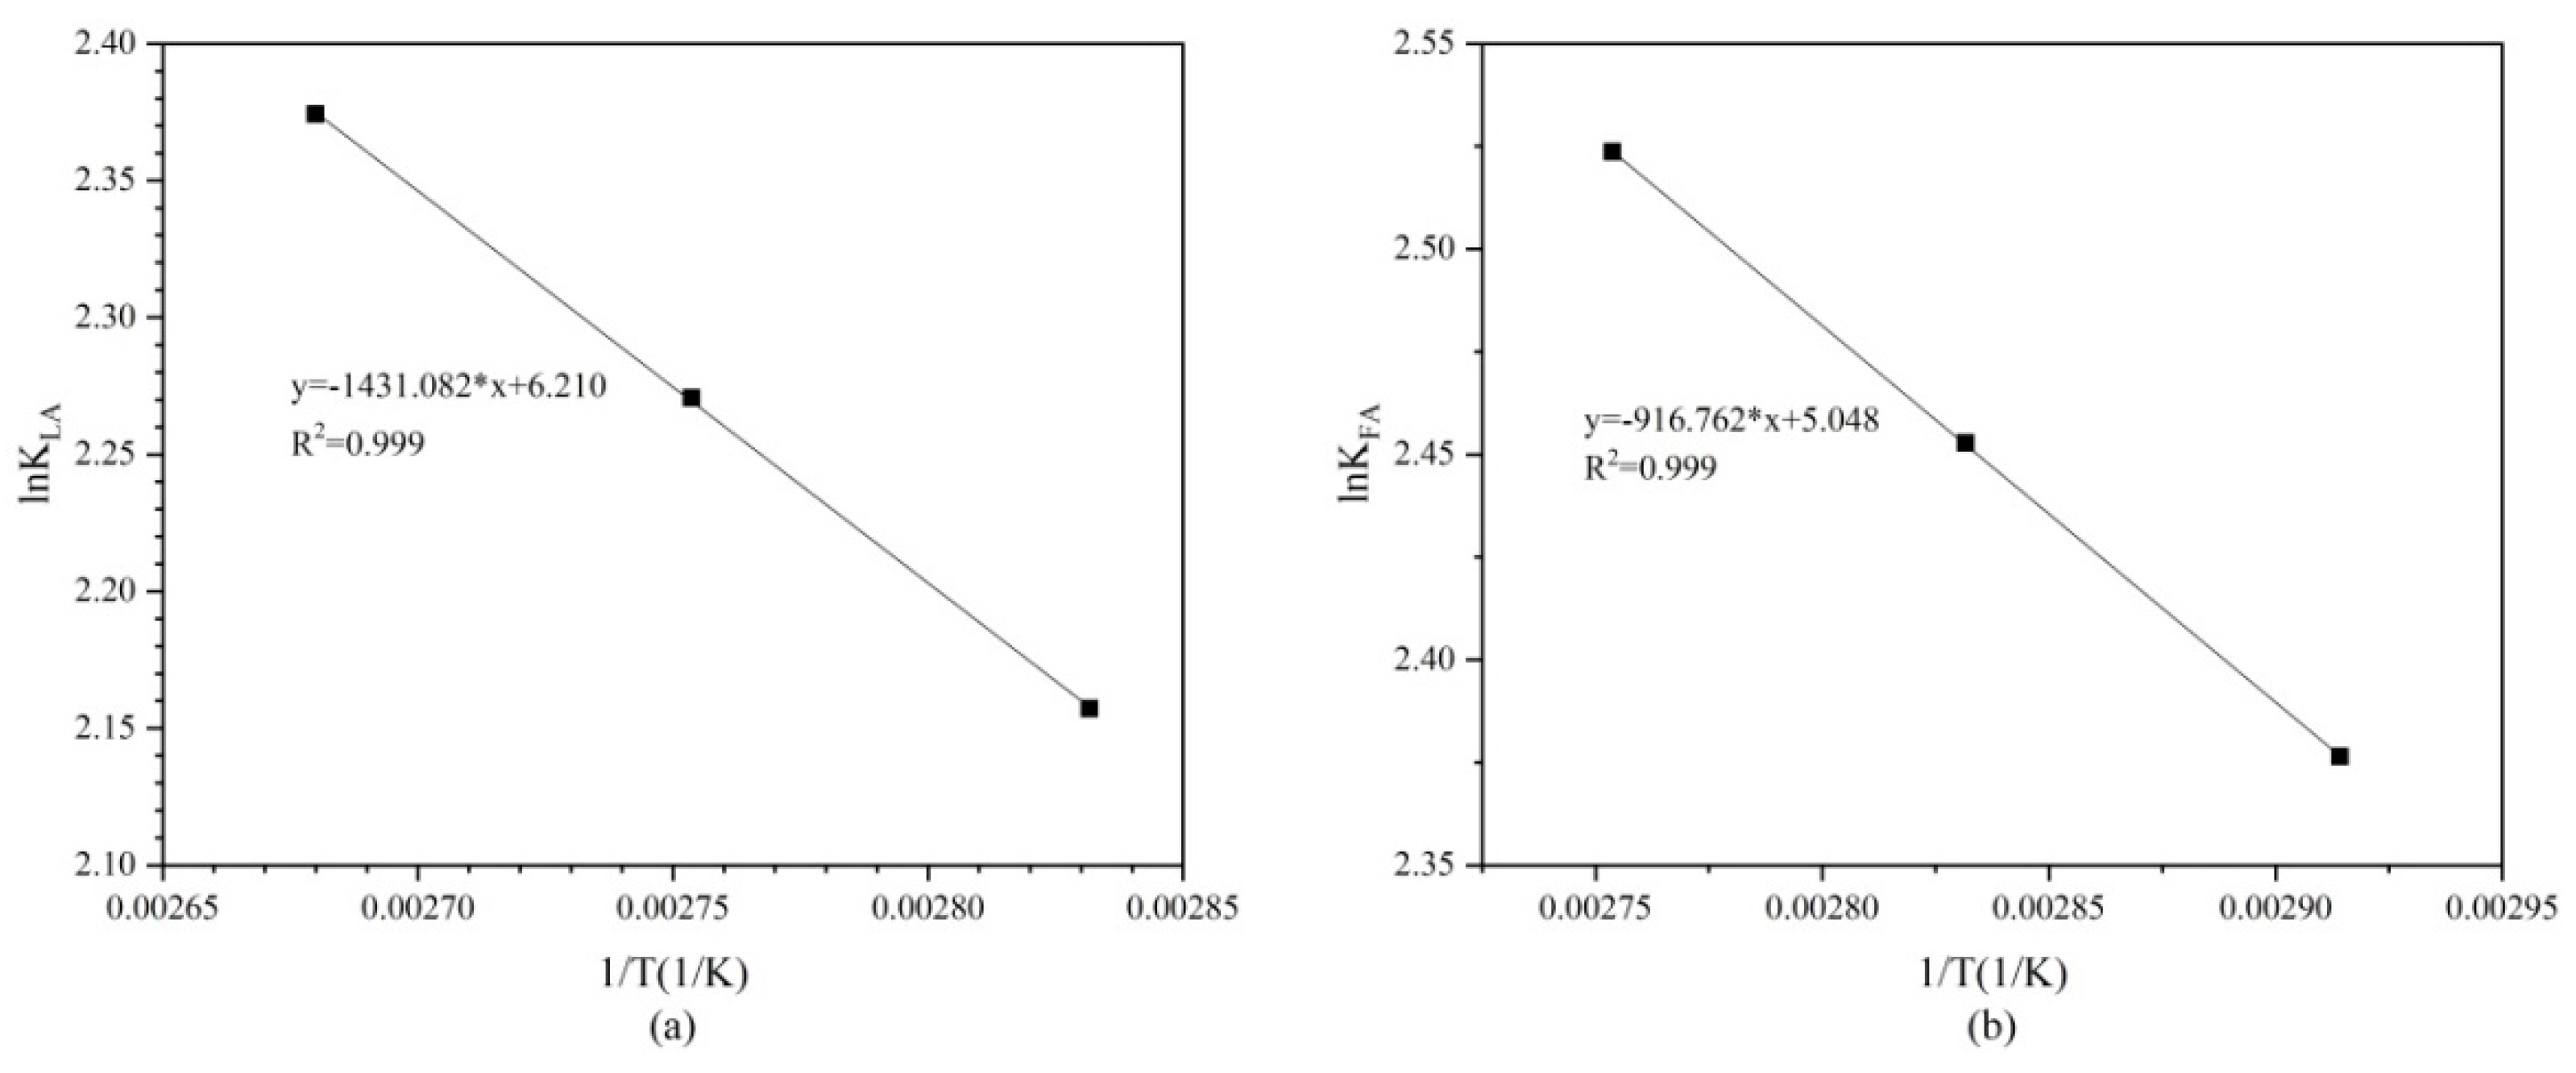
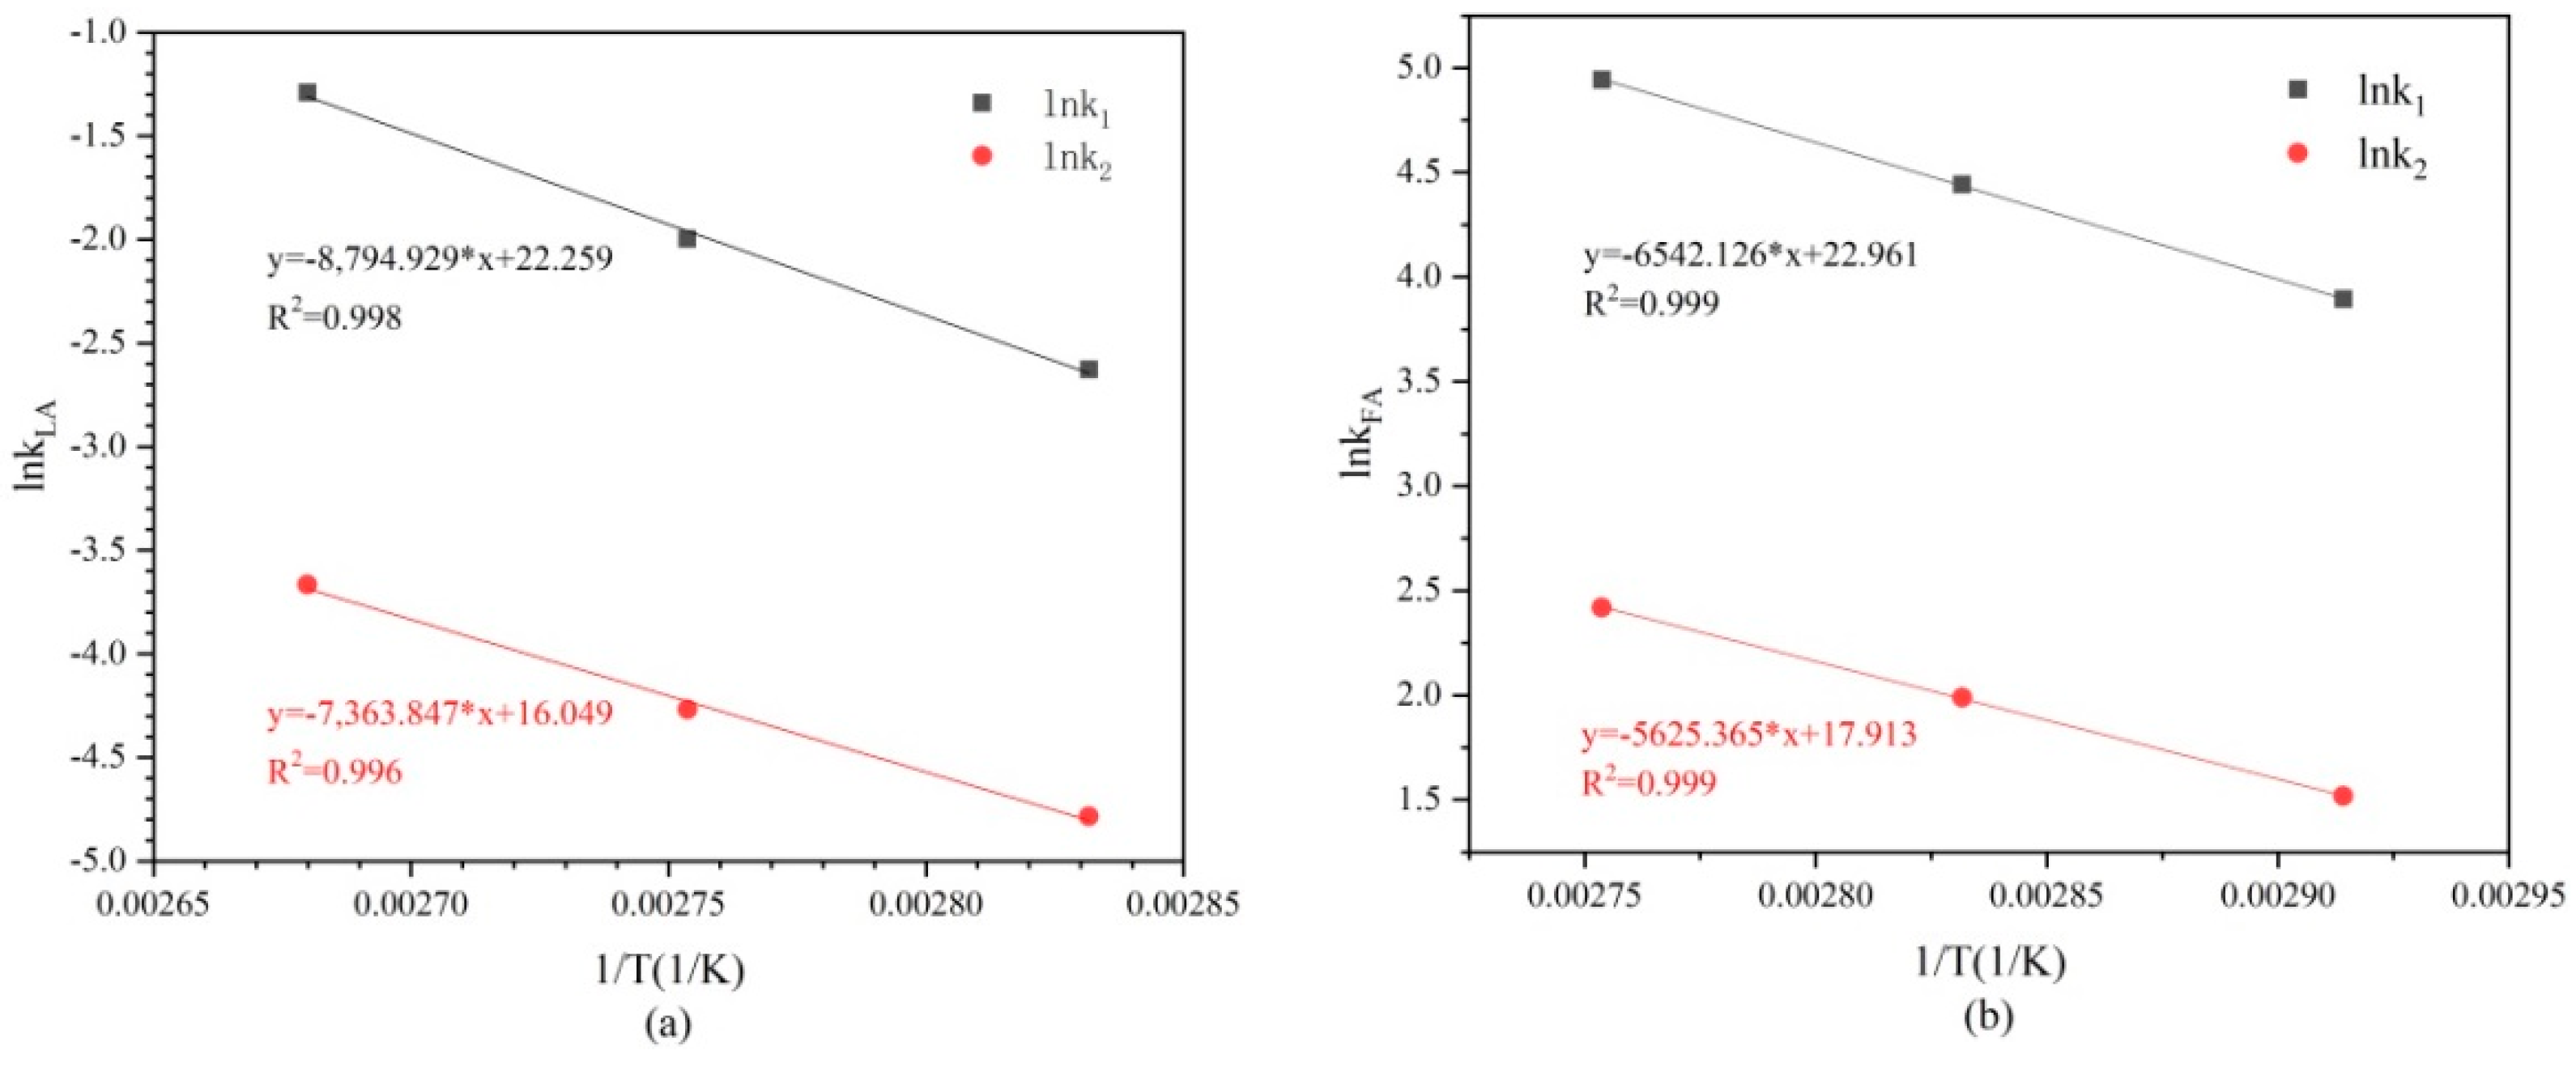
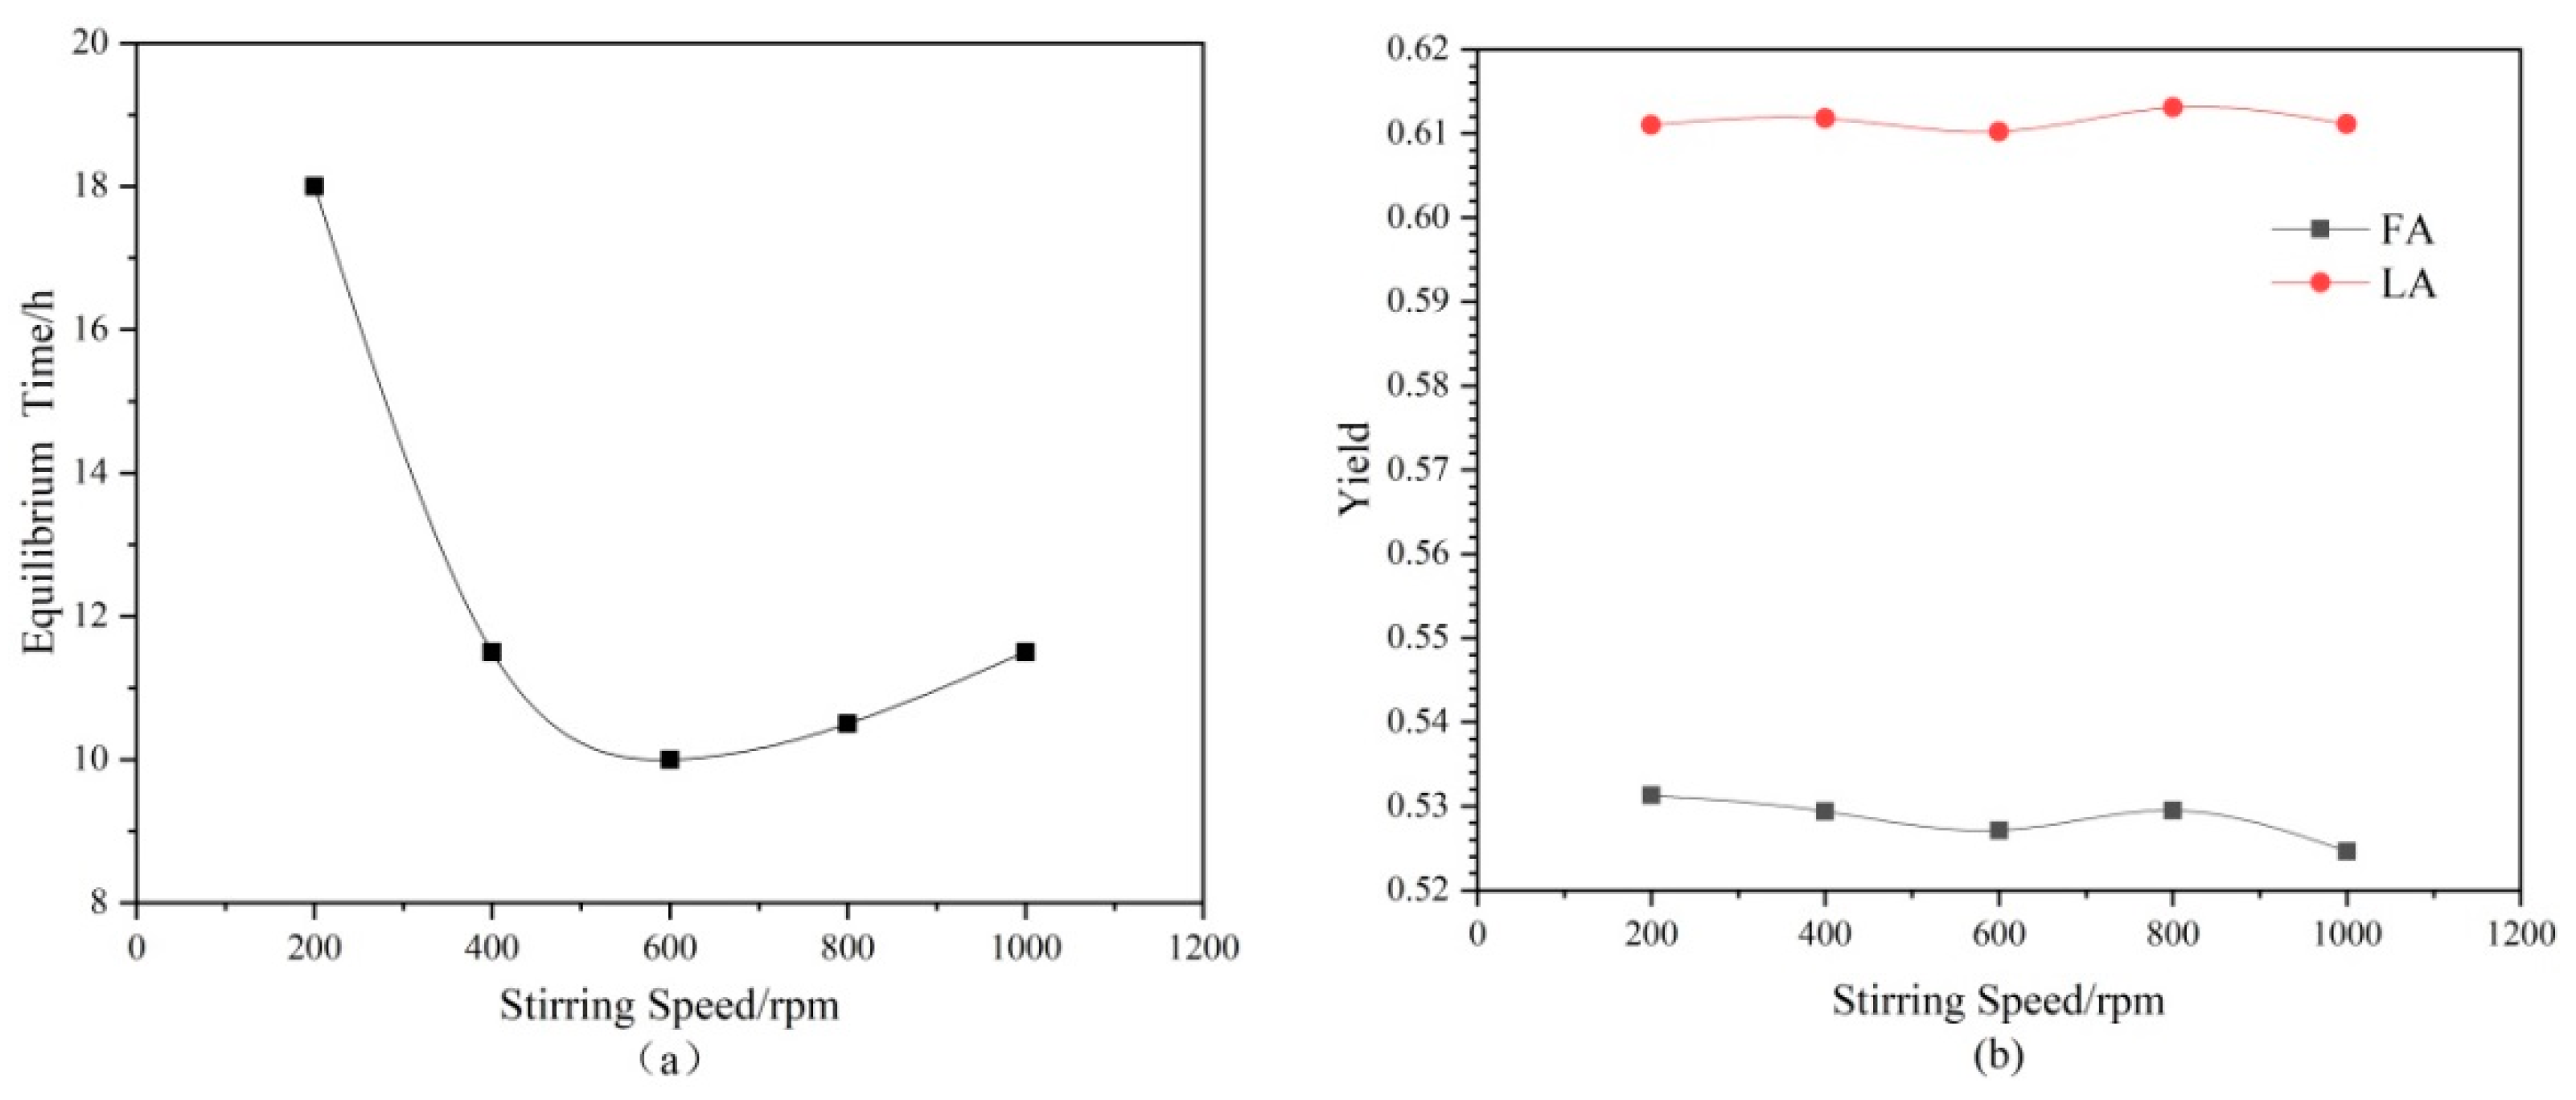
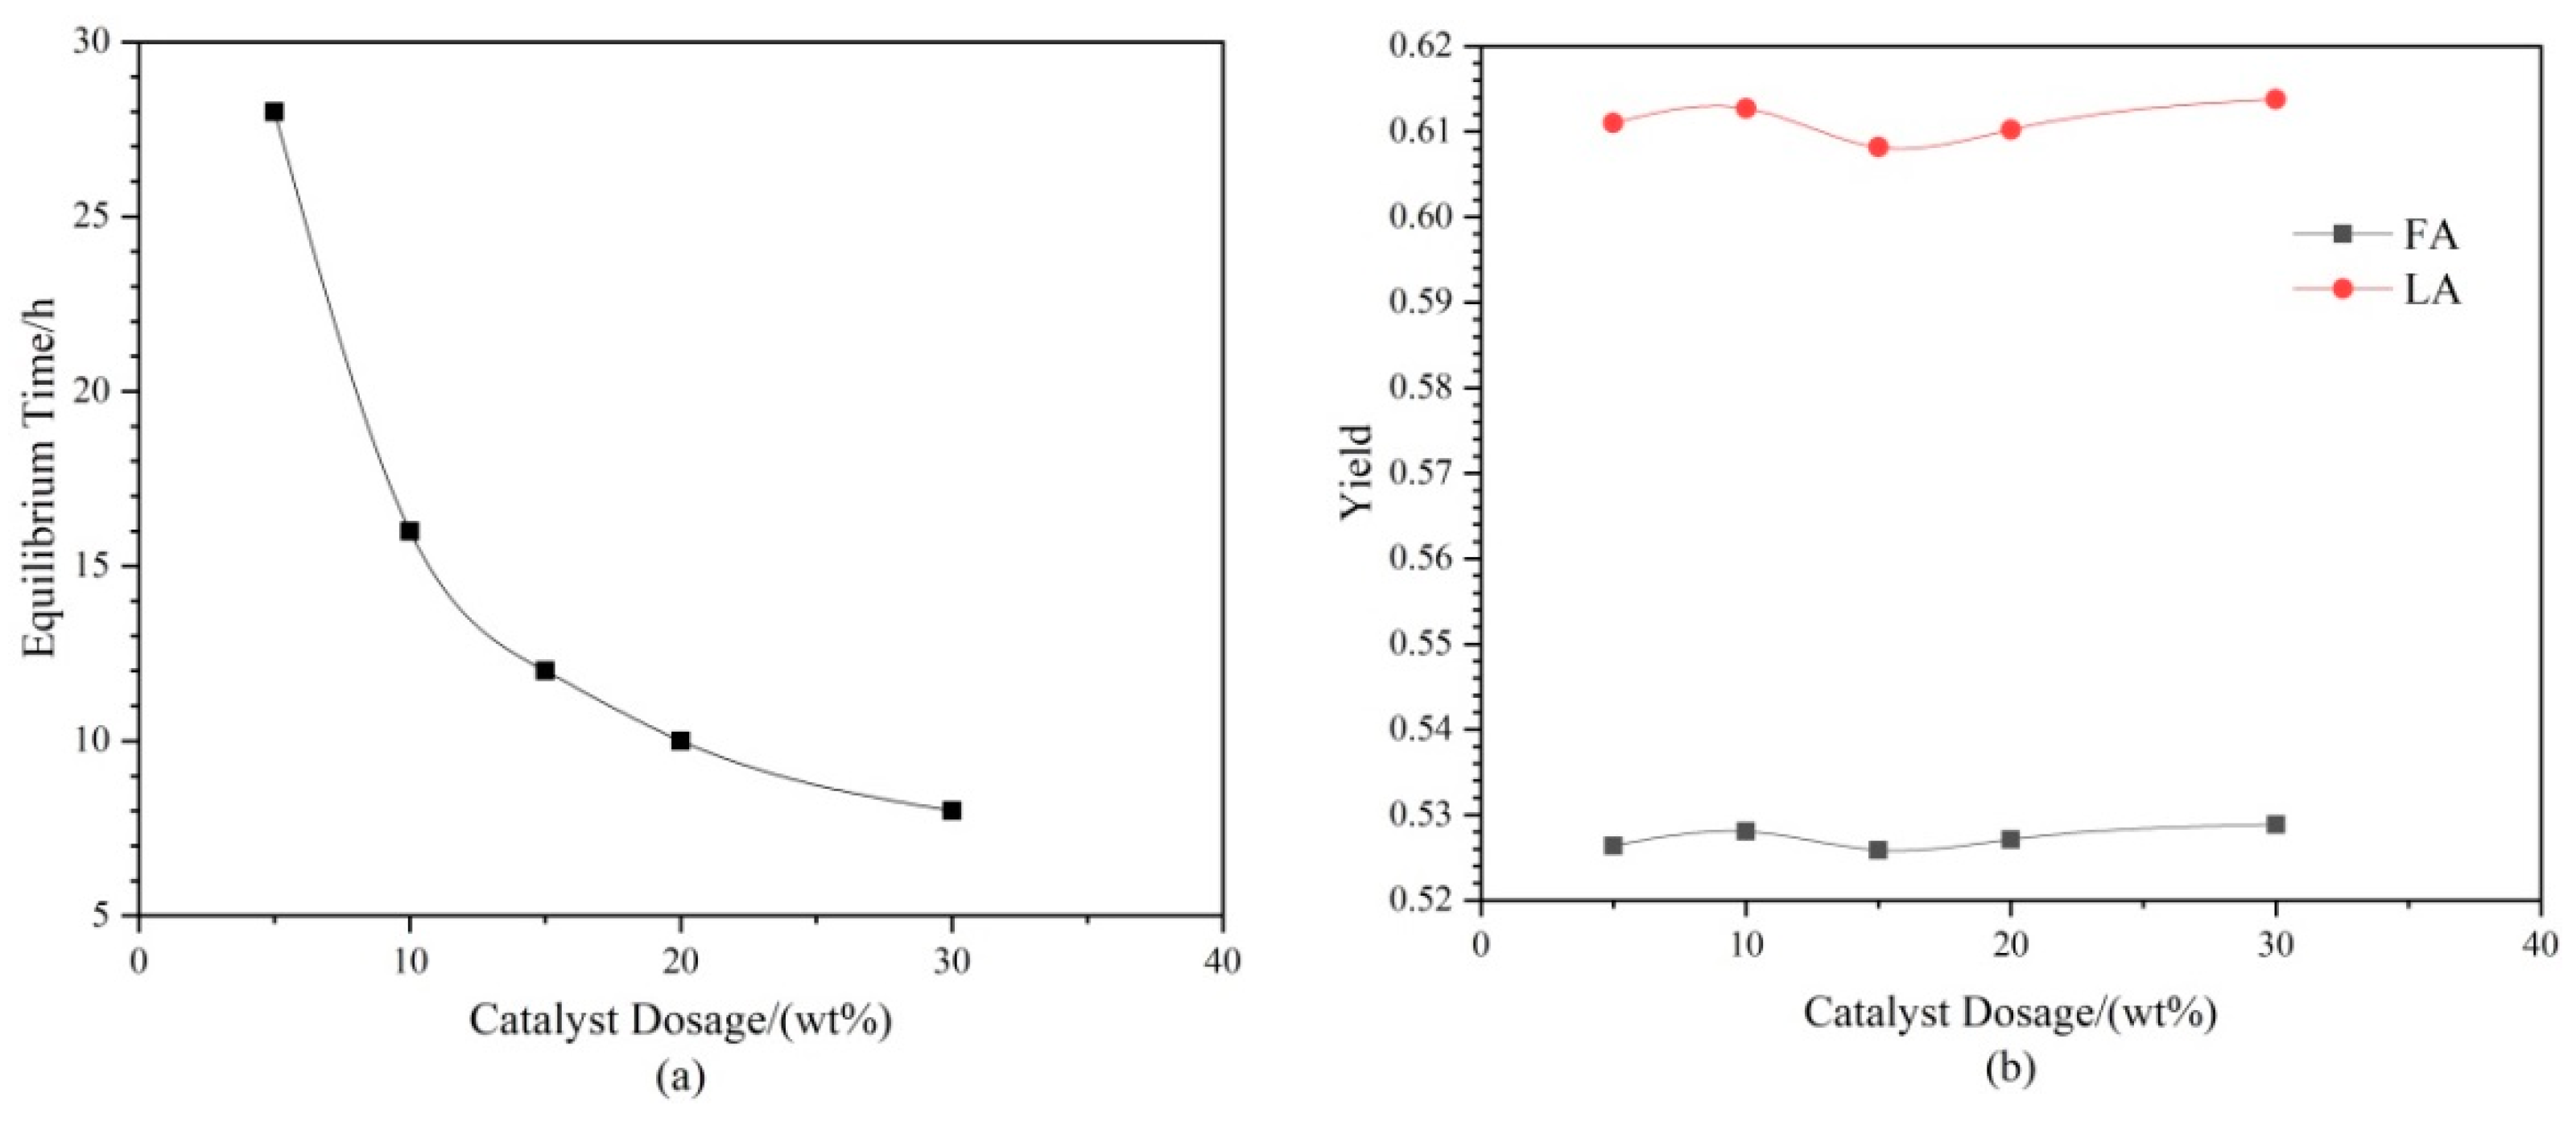
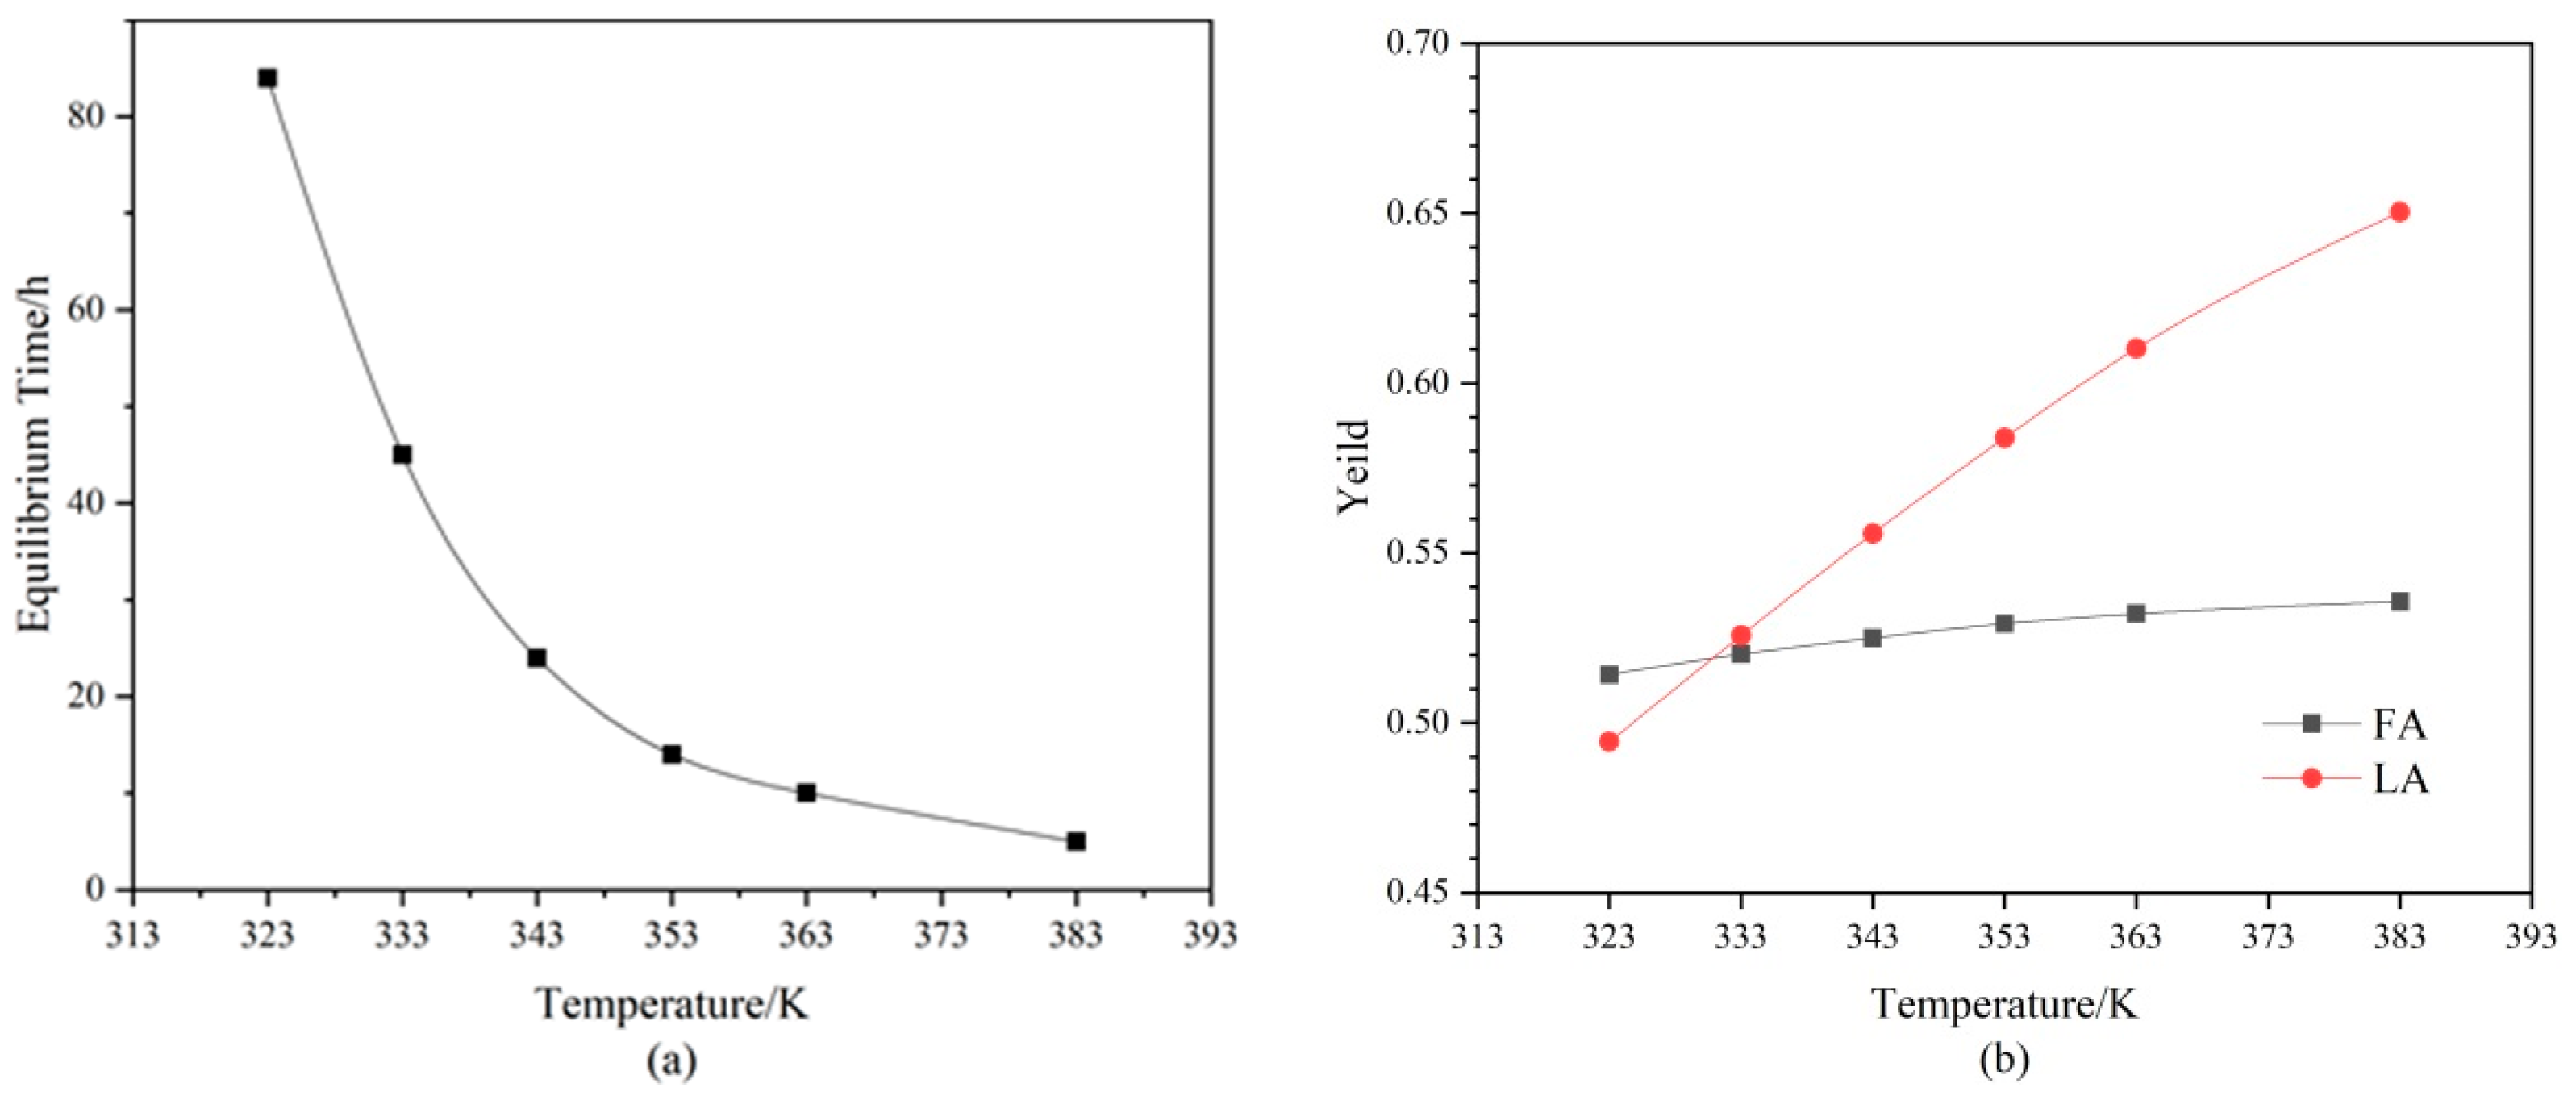
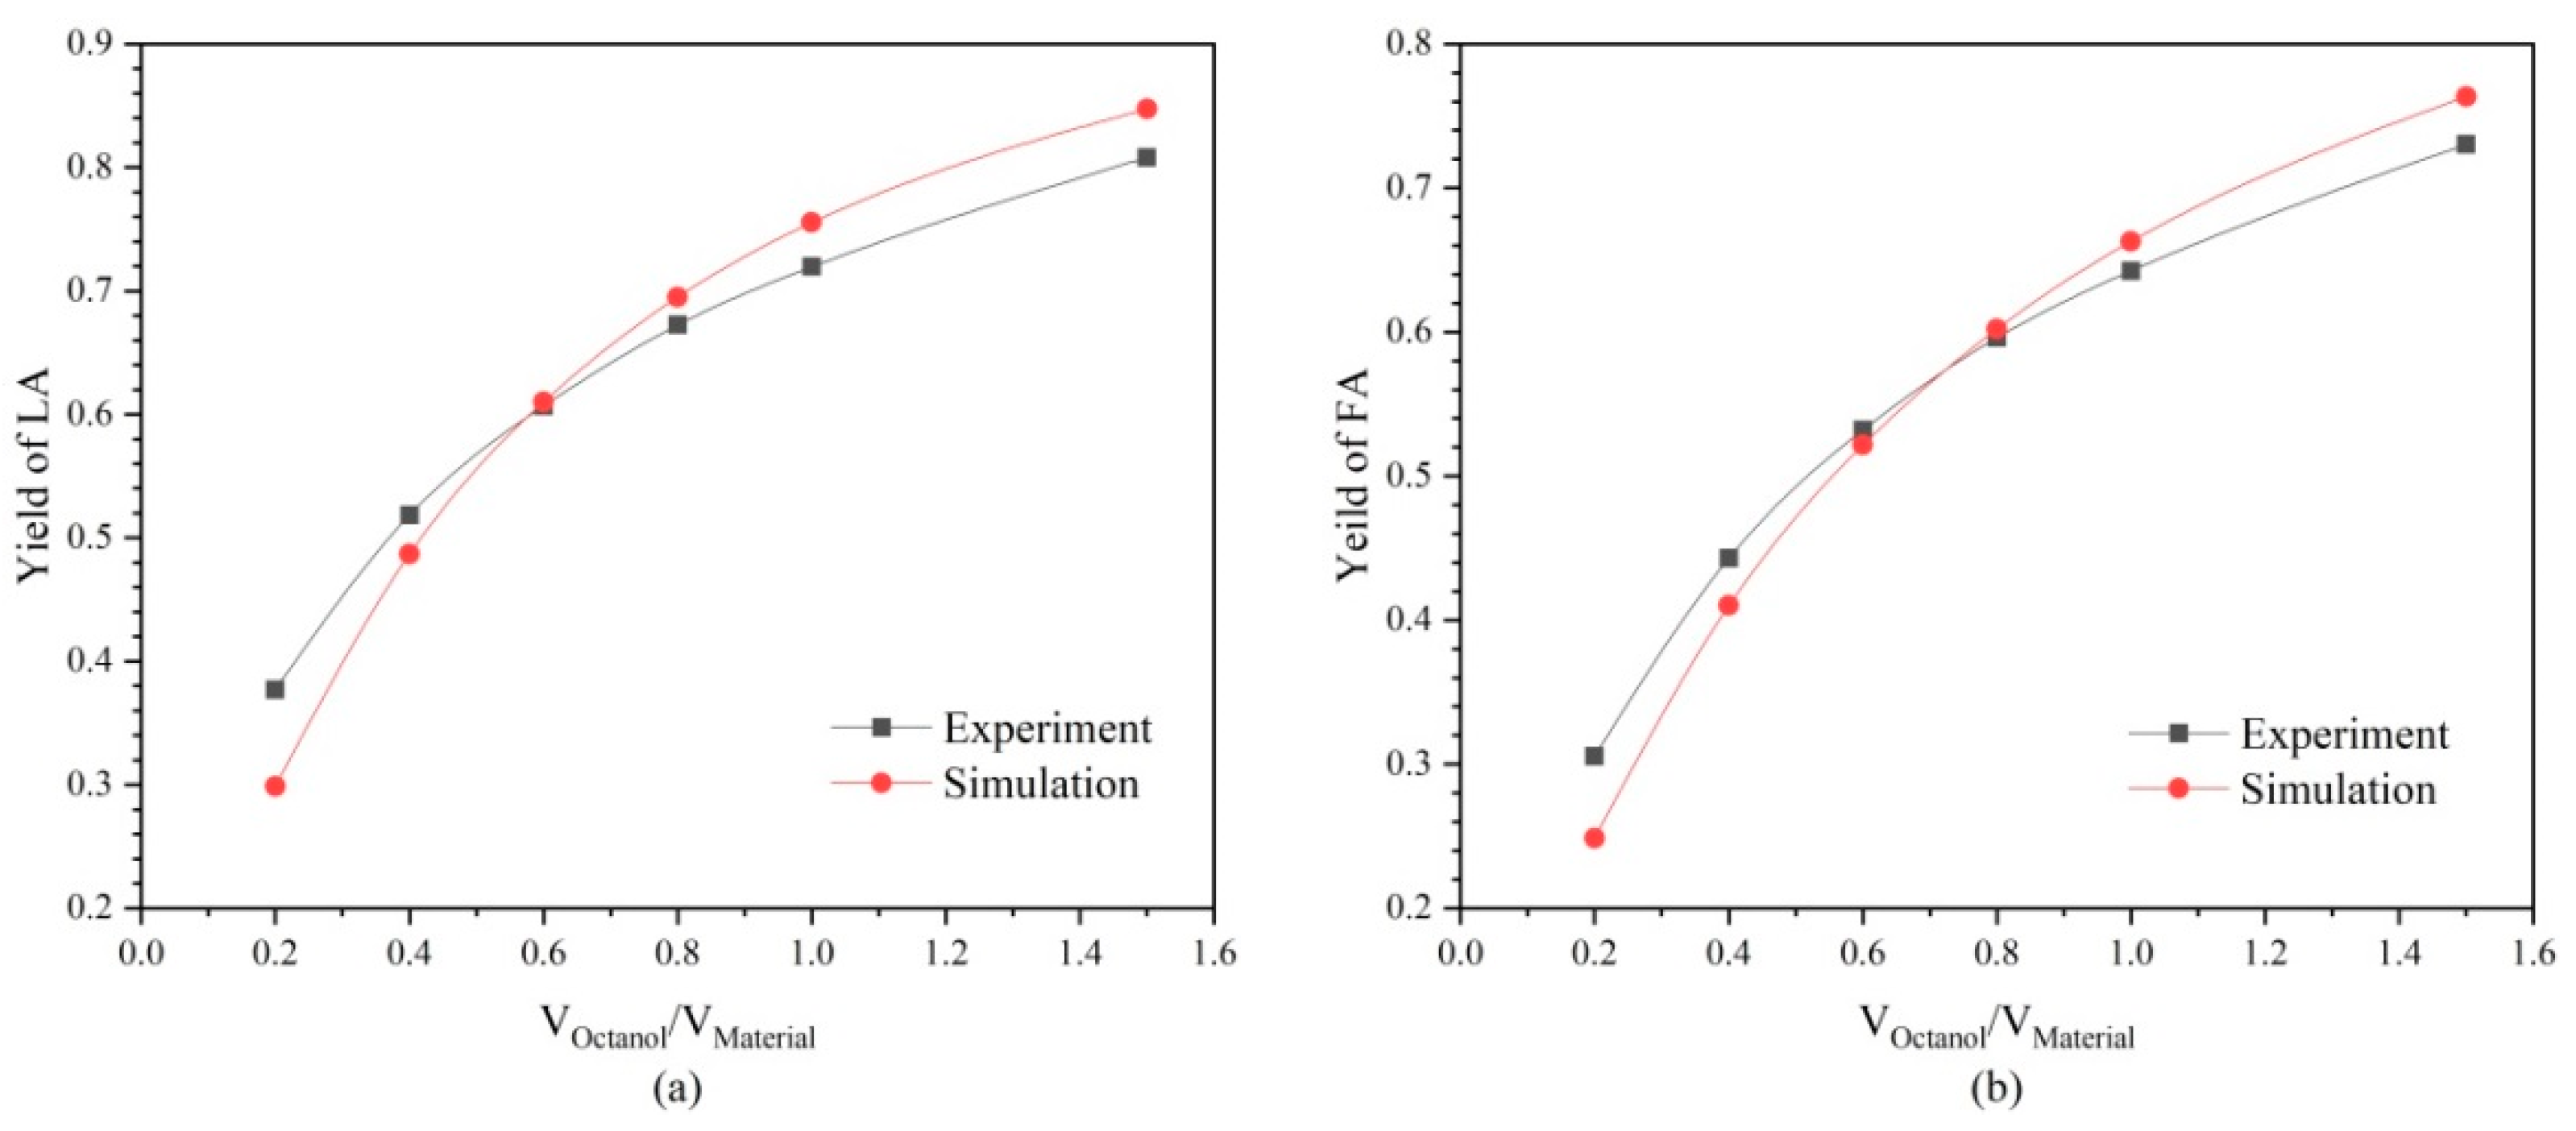
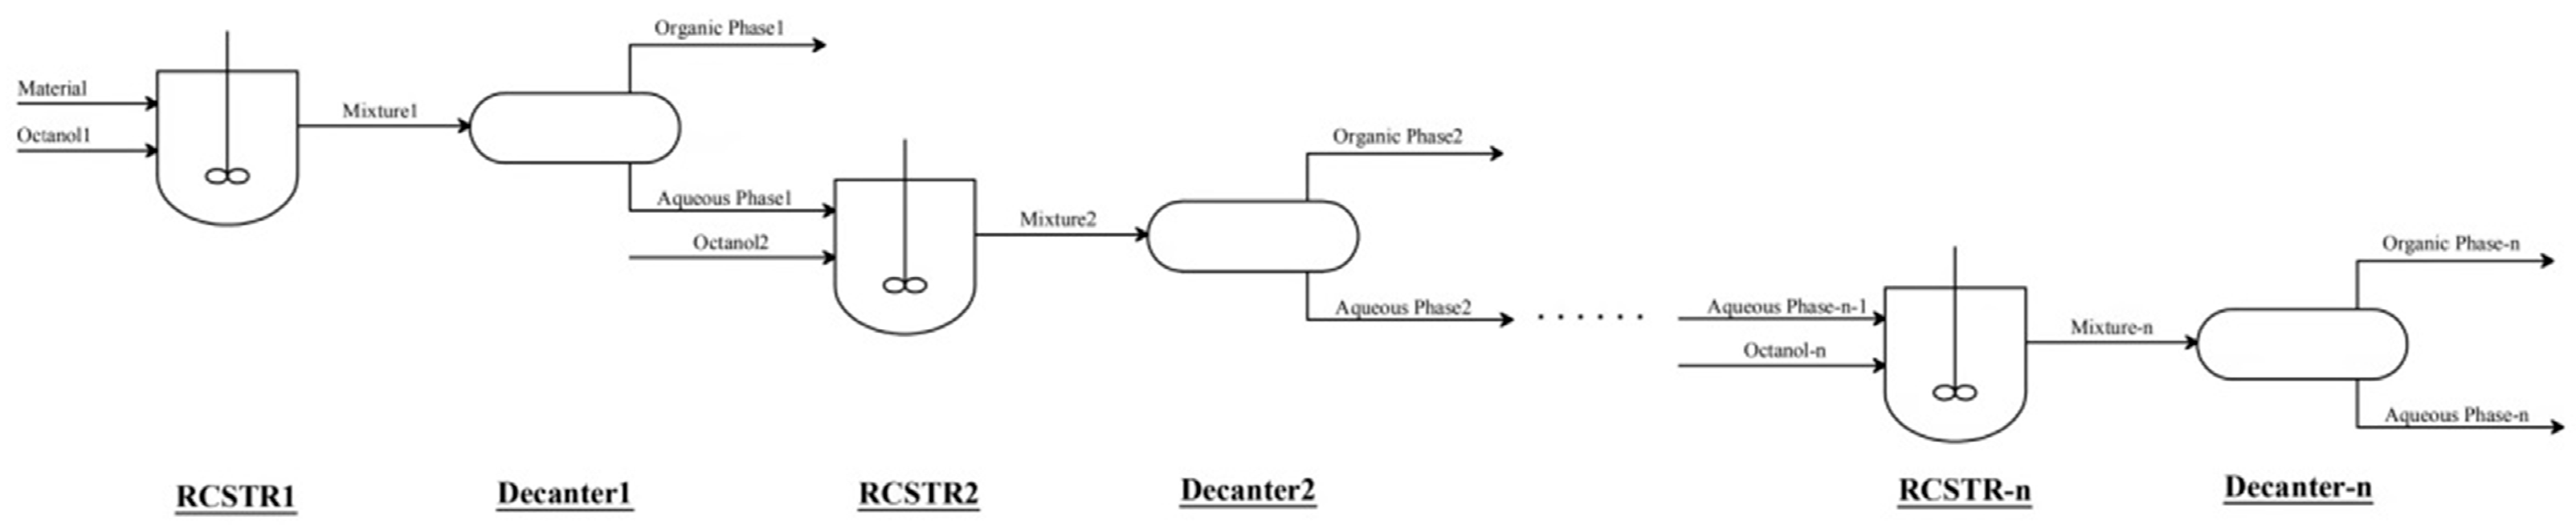
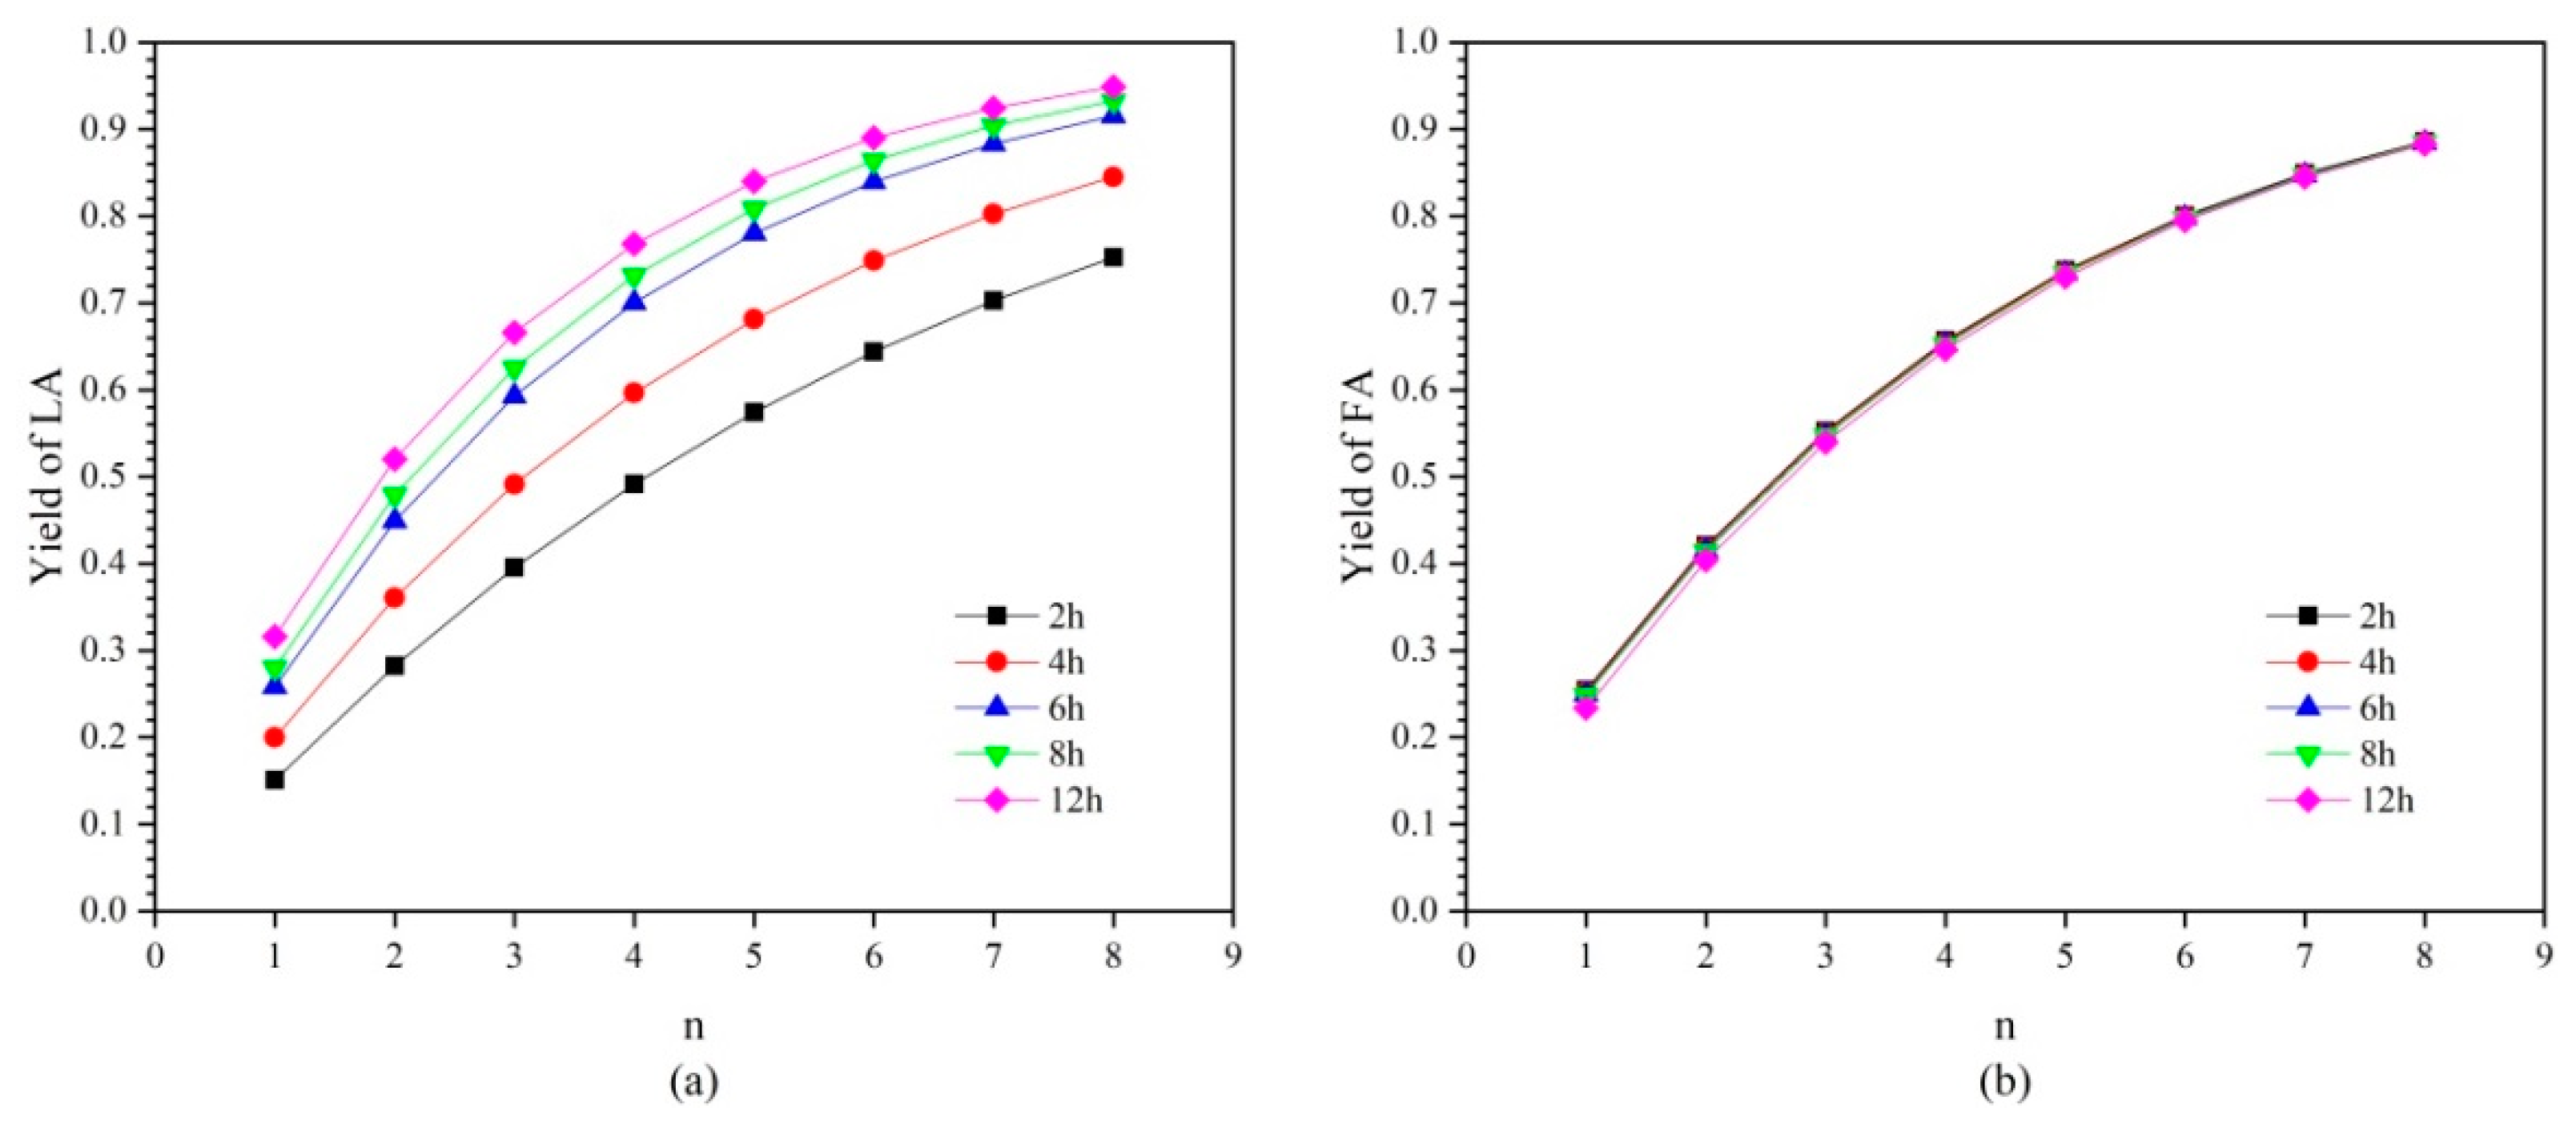
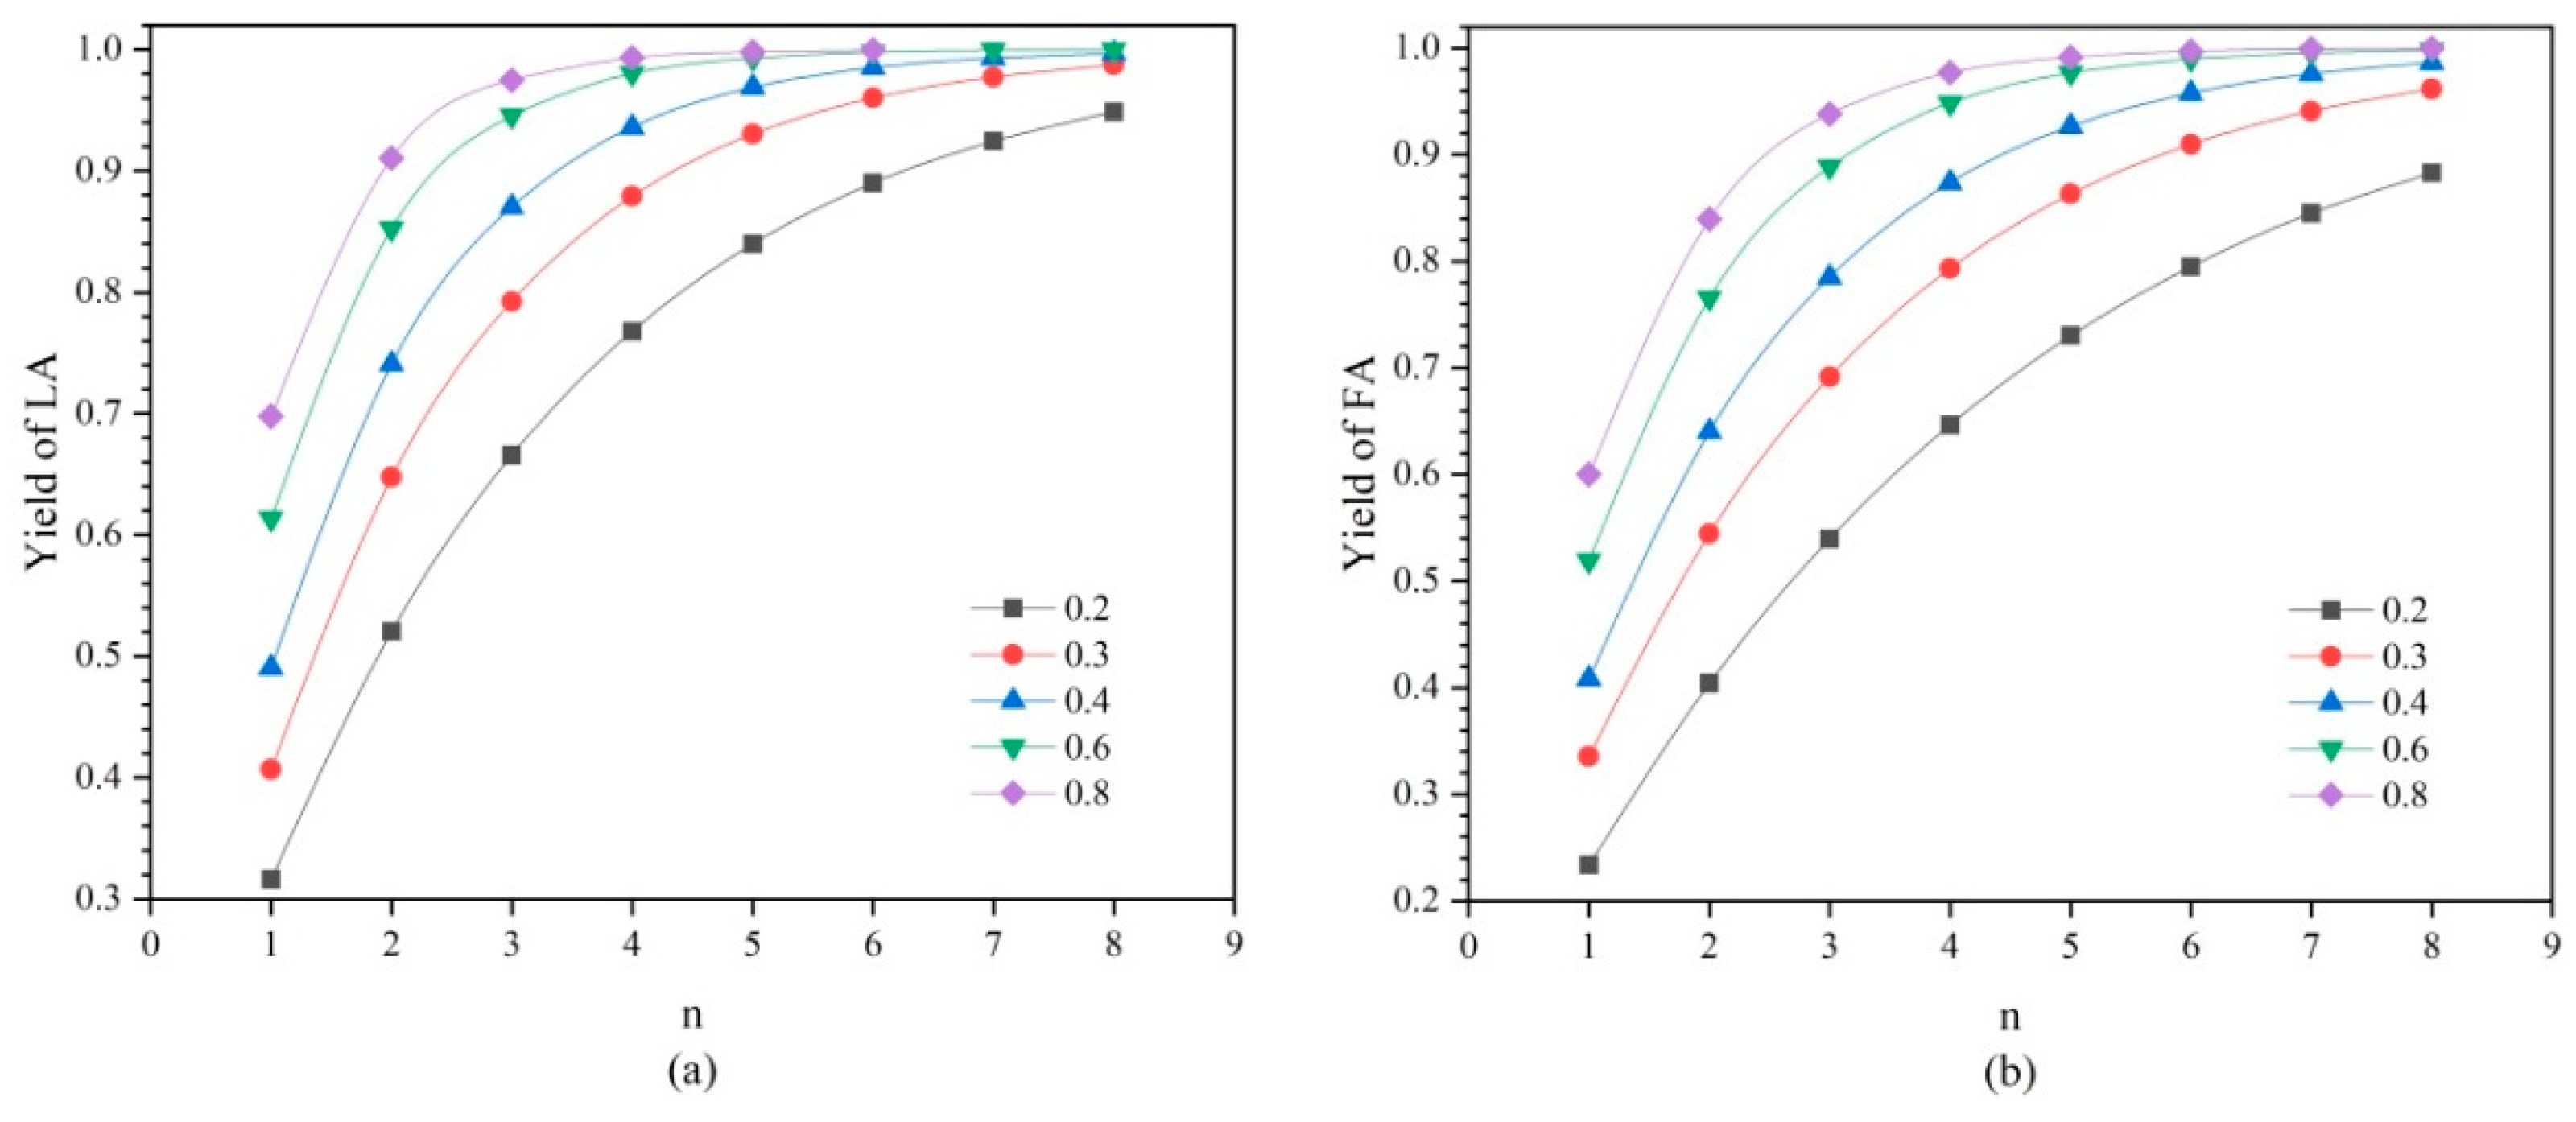
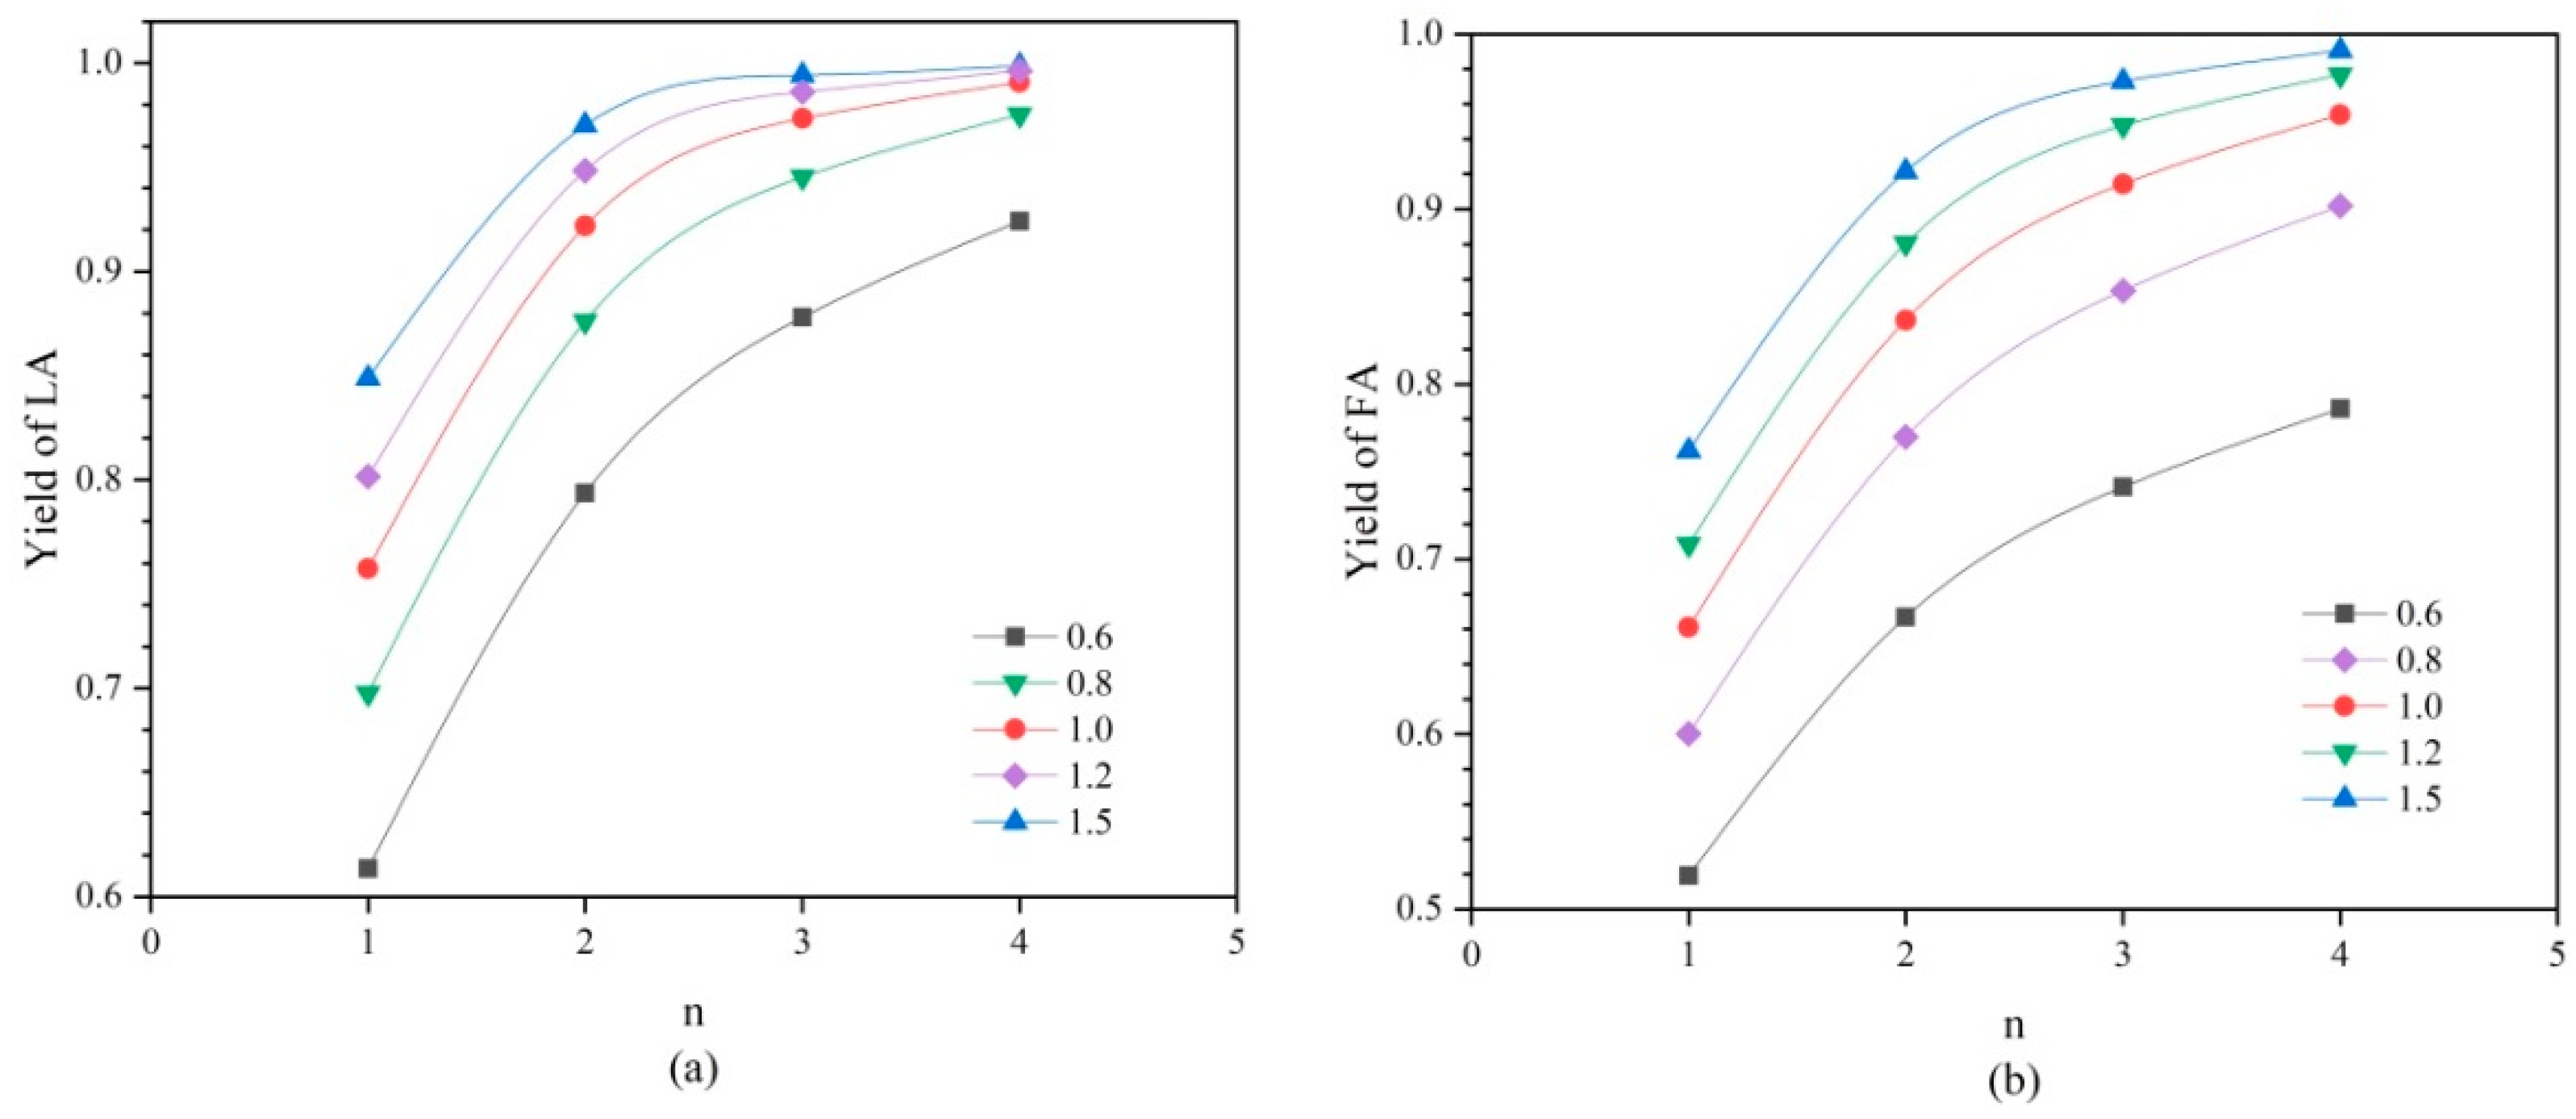
This work reports a comprehensive study on the reactive extraction of formic acid and levulinic acid, which derived from the deep hydrolysis of cellulose. First, the kinetics of formic acid and levulinic acid esterification reaction were explored, and the pre-reference factors and activation energy data of the two reactions were obtained, which provided basic data for subsequent simulation optimization. In addition, the liquid-liquid equilibrium data of the corresponding acid ester system was studied, and the corresponding thermodynamic parameters were obtained. Then, the process of reactive extraction was experimentally investigated in the current work by exploring the influence of different factors on the experiment. It is found that increasing the temperature and the amount of catalyst not only increases the yields of formic acid and levulinic acid but also shorten the time to reach equilibrium. In the end, the multi-stage crosscurrent reactive extraction and the multi-stage countercurrent reactive extraction were compared, and the optimization results of the multi-stage extraction for the reactive extraction process were obtained by Aspen Plus. Finally, multi-stage countercurrent reactive extraction is selected as the recovery method. In summary, reactive extraction can achieve the purpose of separating formic acid and levulinic acid from the system. The final yields of formic acid and levulinic acid can reach 99.1% and 99.9%, respectively.
The experimental data show that the reaction extraction method using n-octanol as the extractant can ignore the shortcoming that formic acid and water have similar boiling points, and realize the recovery of formic acid and levulinic acid in an environmentally friendly manner. At the same time, this method can also be extended to other systems for recovering carboxylic acids from aqueous solutions. In conclusion, the use of n-octanol for reactive extraction is a promising technique.

Author Contributions

Conceptualization, H.C., H.L. and X.G.; methodology, H.C., X.L., H.L., X.G. and B.D.; software, B.D.; validation, H.C. and B.D.; formal analysis, H.C.; investigation, B.D.; resources, X.L.; data curation, B.D.; writing—original draft preparation, B.D.; writing—review and editing, H.C. and B.D.; visualization, B.D.; supervision, H.C., X.L., H.L. and X.G. All authors have read and agreed to the published version of the manuscript.

Funding

This research received no external funding.

Institutional Review Board Statement

Not applicable.

Informed Consent Statement

Not applicable.

Data Availability Statement

Not applicable.

Acknowledgments

The authors acknowledge financial support from National Key Research and Development Program of China (2018YFB1501600). The authors also thank the reviewers for their insightful opinions and suggestions.

Conflicts of Interest

The authors declare no conflict of interest.

References

  1. Sudarsanam, P.; Peeters, E.; Makshina, E.V.; Parvulescu, V.I.; Sels, B.F. Advances in porous and nanoscale catalysts for viable biomass conversion. Chem. Soc. Rev. 2019, 48, 2366–2421. [Google Scholar] [CrossRef] [PubMed]
  2. Prado-Rubio, O.A.; Gasca-González, R.; Fontalvo, J.; Gómez-Castro, F.I.; Pérez-Cisneros, E.S.; Morales-Rodriguez, R. Design and evaluation of intensified downstream technologies towards feasible lactic acid bioproduction. Chem. Eng. Process.-Process Intensif. 2020, 158, 108174. [Google Scholar] [CrossRef]
  3. Isikgor, F.H.; Becer, C.R. Lignocellulosic biomass: A sustainable platform for the production of bio-based chemicals and polymers. Polym. Chem. 2015, 6, 4497–4559. [Google Scholar] [CrossRef] [Green Version]
  4. Liu, K.; Du, H.; Zheng, T.; Liu, H.; Zhang, M.; Zhang, R.; Li, H.; Xie, H.; Zhang, X.; Ma, M.; et al. Recent advances in cellulose and its derivatives for oilfield applications. Carbohydr. Polym. 2021, 259, 117740. [Google Scholar] [CrossRef] [PubMed]
  5. Manzer, L.E. Biomass Derivatives: A Sustainable Source of Chemicals. In Feedstocks for the Future; ACS Symposium Series; American Chemical Society: Washington, DC, USA, 2006; pp. 40–51. [Google Scholar]
  6. Pileidis, F.D.; Titirici, M.M. Levulinic Acid Biorefineries: New Challenges for Efficient Utilization of Biomass. ChemSusChem 2016, 9, 562–582. [Google Scholar] [CrossRef]
  7. Kang, S.; Fu, J.; Zhang, G. From lignocellulosic biomass to levulinic acid: A review on acid-catalyzed hydrolysis. Renew. Sustain. Energy Rev. 2018, 94, 340–362. [Google Scholar] [CrossRef]
  8. Mika, L.T.; Csefalvay, E.; Nemeth, A. Catalytic Conversion of Carbohydrates to Initial Platform Chemicals: Chemistry and Sustainability. Chem. Rev. 2018, 118, 505–613. [Google Scholar] [CrossRef]
  9. Djas, M.; Henczka, M. Reactive extraction of carboxylic acids using organic solvents and supercritical fluids: A review. Sep. Purif. Technol. 2018, 201, 106–119. [Google Scholar] [CrossRef]
  10. Datta, D.; Kumar, S.; Uslu, H. Status of the Reactive Extraction as a Method of Separation. J. Chem. 2015, 2015, 853789. [Google Scholar] [CrossRef]
  11. Uslu, H. Reactive Extraction of Levulinic Acid Using TPA in Toluene Solution: LSER Modeling, Kinetic and Equilibrium Studies. Sep. Sci. Technol. 2008, 43, 1535–1548. [Google Scholar] [CrossRef]
  12. Datta, D.; Marti, M.E.; Uslu, H.; Kumar, S. Extraction of levulinic acid using tri- n -butyl phosphate and tri- n -octylamine in 1-octanol: Column design. J. Taiwan Inst. Chem. Eng. 2016, 66, 407–413. [Google Scholar] [CrossRef]
  13. Eda, S.; Borra, A.; Parthasarathy, R.; Bankupalli, S.; Bhargava, S.; Thella, P.K. Recovery of levulinic acid by reactive extraction using tri-n-octylamine in methyl isobutyl ketone: Equilibrium and thermodynamic studies and optimization using Taguchi multivariate approach. Sep. Purif. Technol. 2018, 197, 314–324. [Google Scholar] [CrossRef]
  14. Yan, K.; Jarvis, C.; Gu, J.; Yan, Y. Production and catalytic transformation of levulinic acid: A platform for speciality chemicals and fuels. Renew. Sustain. Energy Rev. 2015, 51, 986–997. [Google Scholar] [CrossRef]
  15. Yasmin, S.; Sheng, W.-B.; Peng, C.-Y.; Rahman, A.-U.; Liao, D.-F.; Choudhary, M.I.; Wanga, W. Highly efficient and green esterification of carboxylic acids in deep eutectic solvents without any other additives. Synth. Commun. 2017, 48, 68–75. [Google Scholar] [CrossRef]
  16. Kanda, L.R.S.; Corazza, M.L.; Zatta, L.; Wypych, F. Kinetics evaluation of the ethyl esterification of long chain fatty acids using commercial montmorillonite K10 as catalyst. Fuel 2017, 193, 265–274. [Google Scholar] [CrossRef]
  17. Zhou, Y.; Qin, H.; Cheng, H.; Chen, L.; Zhang, B.; Qi, Z. Reactive extraction for synthesizing long chain ester butyl hexanoate intensified by deep eutectic solvent. Chin. J. Chem. Eng. 2021, 36, 120–127. [Google Scholar] [CrossRef]
  18. Ni, Z.; Li, F.; Wang, H.; Wang, S.; Gao, S.-Y. Catalytic esterification, kinetics, and cold flow properties of isobutyl palmitate. Fuel 2019, 254, 115368. [Google Scholar] [CrossRef]
  19. Mizzi, B.; Meyer, M.; Prat, L.; Augier, F.; Leinekugel-Le-Cocq, D. General design methodology for reactive liquid–liquid extraction: Application to dicarboxylic acid recovery in fermentation broth. Chem. Eng. Processing Process Intensif. 2017, 113, 20–34. [Google Scholar] [CrossRef] [Green Version]
  20. Li, L.; Zeng, T.; Wang, X.; Ye, C.; Qiu, T.; Huang, Z. Liquid-liquid equilibrium for the quaternary reaction system water + sec-butyl alcohol + sec-butyl acetate + acetic acid. Fluid Phase Equilibria 2017, 432, 70–75. [Google Scholar] [CrossRef]
  21. Madankar, C.S.; Pradhan, S.; Naik, S.N. Parametric study of reactive extraction of castor seed (Ricinus communis L.) for methyl ester production and its potential use as bio lubricant. Ind. Crops Prod. 2013, 43, 283–290. [Google Scholar] [CrossRef]
  22. Badgujar, K.C.; Badgujar, V.C.; Bhanage, B.M. A review on catalytic synthesis of energy rich fuel additive levulinate compounds from biomass derived levulinic acid. Fuel Process. Technol. 2020, 197, 106213. [Google Scholar] [CrossRef]
  23. Santhanakrishnan, A.; Shannon, A.; Peereboom, L.; Lira, C.T.; Miller, D.J. Kinetics of Mixed Ethanol/n-Butanol Esterification of Butyric Acid with Amberlyst 70 and p-Toluene Sulfonic Acid. Ind. Eng. Chem. Res. 2013, 52, 1845–1853. [Google Scholar] [CrossRef]
  24. Wen, P.; Tang, K.; Zhou, J.; Zhang, P. Simulation and analysis of multi-stage centrifugal fractional extraction process of 4-nitrobenzene glycine enantiomers. Chin. J. Chem. Eng. 2015, 23, 1774–1781. [Google Scholar] [CrossRef]
Figure 1. Kinetic data of (a) LA with various initial catalyst dosage at 363.15 K and (b) FA at 353.15 K.
Processes 10 00734 g001
Figure 2. Kinetic data of (a) LA with 20% catalyst dosage at various temperature and (b) FA with 5%.
Processes 10 00734 g002
Figure 3. Kinetic data of (a) LA with various initial LA concentrations at 363.15 K and (b) FA at 353.15 K.
Processes 10 00734 g003
Figure 4. Reaction equilibrium equations of (a) LA and (b) FA.
Processes 10 00734 g004
Figure 5. Pre-exponential factor equations of (a) LA and (b) FA.
Processes 10 00734 g005
Figure 6. Effect of stirring speed on the yields of (a) LA and (b) FA.
Processes 10 00734 g006
Figure 7. Effect of catalyst dosage on the yields of (a) LA and (b) FA.
Processes 10 00734 g007
Figure 8. Effect of temperature on the yields of (a) LA and (b) FA.
Processes 10 00734 g008
Figure 9. Effect of initial reactant ratio on the yields of (a) LA and (b) FA.
Processes 10 00734 g009
Figure 10. Reaction extraction simulation equipment diagram.
Processes 10 00734 g010
Figure 11. Comparison of experimental and simulated yields of (a) LA and (b) FA.
Processes 10 00734 g011
Figure 12. Multi-stage crosscurrent reaction extraction simulation flow chart.
Processes 10 00734 g012
Figure 13. Influence of time in single-stage reaction on yields of (a) LA and (b) FA.
Processes 10 00734 g013
Figure 14. Influence of single-stage n-octanol dosage on yield of (a) LA and (b) FA.
Processes 10 00734 g014
Figure 15. Multi-stage countercurrent reaction extraction simulation flow chart.
Processes 10 00734 g015
Figure 16. Influence of reaction time in single-stage reaction on yields of (a) LA and (b) FA.
Processes 10 00734 g016
Figure 17. Influence of n-octanol dosage on yields of (a) LA and (b) FA.
Processes 10 00734 g017
Table 1. Pre-exponential factors k i , 0 and activation energy E a , i .
k i , 0 / L · mol 1 · h 1 E a , i / kJ · mol 1
FAThe forward reaction9.372 × 10 9 54.391
The inverse reaction6.019 × 10 7 46.769
LAThe forward reaction4.645 × 10 9 73.121
The inverse reaction9.332 × 10 6 61.223
Table 2. Experimental LLE data for quaternary system FA (1) + OF (2) + OC (3) + water (4).
T/KOrganic PhaseAqueous Phase
w 1 w 2 w 4 w 1 w 2 w 3
323.150.2721 9.0697 4.48000.7077 0.0977 0.0699
0.2695 6.2367 4.68600.9778 0.0965 0.0704
0.2668 4.7568 4.86200.9313 0.0928 0.0710
0.1840 6.2020 4.62501.0274 0.1235 0.0628
0.1722 4.2382 4.88700.6709 0.1167 0.0633
0.1552 3.2248 5.11300.6237 0.1071 0.0639
343.150.2556 8.9308 4.24601.0344 0.1536 0.0853
0.2531 6.1547 4.35000.9885 0.1417 0.0859
0.2489 4.7009 4.42400.9467 0.1320 0.0867
0.1679 6.1596 4.20200.7145 0.1510 0.0856
0.1601 4.2061 4.39400.6825 0.1429 0.0861
0.1481 3.1949 4.70800.6336 0.1386 0.0869
363.150.2392 8.7733 3.89401.0414 0.2185 0.1019
0.2357 6.0693 4.00100.9996 0.1899 0.1026
0.2335 4.6590 4.45000.9602 0.1597 0.1035
0.2305 3.8032 4.67670.9158 0.1178 0.1015
0.1575 6.0188 4.04000.7189 0.2069 0.1029
0.1498 4.1583 4.10300.6892 0.1677 0.1038
Table 3. Experimental LLE data for quaternary system LA (1) + OL (2) + OC (3) + water (4).
T/KOrganic PhaseAqueous Phase
w 1 w 2 w 4 w 1 w 2 w 3
323.151.19464.15004.24601.92460.0393 0.0129
1.14243.16524.57201.76540.0345 0.0151
1.10692.56074.97301.62270.0309 0.0185
1.42082.66544.01602.17260.09090.0160
1.34042.01394.27302.00610.08360.0285
1.25591.61114.35601.87400.07180.0345
343.151.30164.13873.94301.87120.06830.0179
1.26263.16984.25301.69670.06110.0209
1.17292.53974.64101.55140.05380.0246
1.47102.58773.57102.15360.10780.0241
1.37691.94243.69001.97490.08870.0354
1.31111.51843.88001.81970.06810.0486
363.151.36424.10423.16801.82560.1102 0.0212
1.29663.12483.55301.64660.0979 0.0264
1.22812.50064.00901.49370.0847 0.0316
1.66942.80103.11702.11110.12220.0312
1.57782.10733.33201.92730.10450.0458
1.46531.65123.42201.77060.08620.0567
Table 4. UNIQUAC model parameters for FA (1)-OF (2)-OC (3)-water (4) system.
Temperature/KComponentUNIQUAC
i–j b ij / K b ji / K
323.151–2−7256.33−1723.62
1–3−522.4486.30
1–4167.835001.49
2–33743.924641.64
2–4−2012.645379.28
3–4−755.26−181.16
343.151–2−6996.06−1848.88
1–3−578.9990.29
1–4186.414707.10
2–33132.374373.08
2–4−2215.295638.73
3–4−735.32−229.53
363.151–2−8838.89−1523.04
1–3−586.1789.07
1–4233.475154.96
2–33139.474361.20
2–4−2032.745969.74
3–4−763.29−194.96
Table 5. UNIQUAC model parameters for LA (1)-OL (2)-OC (3)-water (4) system.
Temperature/KComponentUNIQUAC
i–j b ij / K b ji / K
323.151–2−1329.57−1971.15
1–3−1177.12129.23
1–4−1196.41155.72
2–3−2607.66−7372.95
2–4−1269.783265.48
343.151–2−1270.01−2615.56
1–3−1360.25135.38
1–4−1007.82137.98
2–3−3104.51−5526.77
2–4−1331.683655.33
363.151–2−1523.54−2120.39
1–3−842.02149.02
1–4−1202.69154.72
2–3−2718.24−4868.70
2–4−2018.233898.86
Table 6. Summary of conditions for levulinic acid yield reached 99%.
Time/hn Σ V Octanol / V Material Yield of LA/%Yield of FA/%
Crosscurrent1272.899.297.6
1253.099.397.7
1243.299.397.8
Countercurrent124199.195.4
1241.599.997.1
Publisher’s Note: MDPI stays neutral with regard to jurisdictional claims in published maps and institutional affiliations.

