Article

The Effect of Airfoil Camber on Pressure Fluctuation in Bidirectional Axial-Flow Pump

1
Research Center of Fluid Machinery Engineering and Technology, Jiangsu University, Zhenjiang 212013, China
2
College of Hydraulic Science and Engineering, Yangzhou University, Yangzhou 225009, China
*
Author to whom correspondence should be addressed.
Processes 2022, 10(3), 468; https://doi.org/10.3390/pr10030468
Submission received: 30 January 2022 / Revised: 21 February 2022 / Accepted: 22 February 2022 / Published: 25 February 2022
(This article belongs to the Special Issue Design and Optimization Method of Pumps)

Abstract

:
To obtain the influence of airfoil camber on the internal pressure fluctuation of a bidirectional axial-flow pump, the unsteady Reynolds time-averaged Navier–Stokes (URANS) equation was solved to predict the internal flow structure under three airfoil camber cases. The airfoil camber was quantitatively controlled by airfoil camber angle. The pressure standard deviation was used to define the local pressure fluctuation intensity (PFI) inside the impeller and guide vane. Fast Fourier transform was applied to analyze the frequency-domain characteristics of the pressure signal near the impeller–straight pipe interface and impeller–guide vanes interface. The results were validated by the external characteristic test. Under the forward condition, the area of high PFI near the outlet and leading edge of the impeller increased with a decrease in airfoil camber angle, and that near the leading edge of the guide vanes shifted to the middle section with a decrease in airfoil camber angle. The main frequency of the pressure signal near the impeller–guide vanes interface was the blade-passing frequency (BPF), and the main frequency amplitude increased with a decrease in airfoil camber angle. Under the reverse condition, the high PFI area near the inlet and the leading edge of the impeller declined with the decrease in airfoil camber angle. The main frequency of the pressure signal near the impeller–straight pipe interface and impeller–guide vanes interface was the BPF, and the main frequency amplitude decreased with a decrease in airfoil camber angle.

1. Introduction

Owing to the function of bidirectional pumping by changing the rotation direction of motors, arc bidirectional impellers have been widely used in bidirectional pump stations with large flow rate along rivers and the coasts [1,2,3]. To balance the forward and reverse hydraulic performance, the airfoil camber of the arc bidirectional impeller was designed to increase first and then decrease from the leading edge to the trailing edge, which leads to more wake flow and large-scale turbulence caused by flow separation [4] compared with a one-way impeller. The strong pressure fluctuation generated by the unstable flow structure could result in the exacerbation of vibration and high-decibel noise, and even the damage of hydraulic components [5]. Therefore, the influence of airfoil camber on pressure fluctuation should be obtained to provide a theoretical basis for the limitation of pressure pulsation in a bidirectional axial-flow pump.
At present, the combination of numerical simulations and experimental measurements is used by many scholars to study the pressure fluctuation characteristics in different kinds of pumps. In the centrifugal pump, Cui [6] found that the interference effect between the wake vortex and volute is the main source of severe pressure fluctuation, based on the detached eddy simulation method. He [7] believed that the appropriate blade-trailing cutting angle should be determined to effectively suppress the shedding vortex at the impeller outlet and reduce the pressure fluctuation. Gao [8] and Lin [9] studied the effect of the trailing edge profile on pressure fluctuation. They found that the structure of an ellipse on the pressure side, an ellipse on both sides and bionic sinusoidal tubercle can effectively decrease the wake vortex intensity and pressure pulsation. Zhang [10] designed three schemes of splitter blades and suggested that deflecting the splitter blade to the suction surface of the main blade can reduce the pressure fluctuation. In the mixed-flow pump, Li [11] used a pressure sensor to measure the pressure fluctuation and impeller axis orbit. The results showed that the hydraulic imbalance caused by the vortex and misalignment could cause the ellipse axis orbit of shaft frequency and two times the shaft frequency. Ji [12] and Tan [13], respectively, analyzed the influence of blade tip clearance radius and blade rotation angle on the frequency domain of the pressure signal. In the axial-flow pump, Yang [14,15] used time–frequency domain analysis to study the pressure pulsation characteristics at the impeller inlet, impeller outlet and guide vane outlet. The results showed that the timing effect can play a significant role in pressure fluctuation at the inlet and outlet of the impeller. Shi [16] analyzed the effect of the backflow clearance on the pressure pulsation in the full tubular pump. He found that the amplitude of pressure pulsation increased caused by clearance flow. Ma [17,18] compared the flow structure and pressure fluctuation in the bidirectional axial-flow pump and obtained the conclusions that the pressure fluctuation amplitude is higher under the reverse condition, due to the distorted impeller inflow induced by the inlet guide vane. However, there are few studies on the influence of airfoil camber on the pressure fluctuation characteristics in bidirectional axial-flow pumps, which makes designing a blade to control pressure pulsation difficult.
In order to establish the relationship between airfoil camber and pressure pulsation in the axial-flow pump, three kinds of arc bidirectional impellers with different airfoil camber were designed based on NACA 65 airfoil functions in this study. The unsteady Reynolds time-averaged Navier–Stokes (URANS) was solved to predict the internal flow structure of the bidirectional axial-flow pump. The pressure standard deviation was applied to obtain the distribution of pressure fluctuation intensity (PFI) in the impeller and guide vanes. In addition, the frequency domain of pressure signal at the inlet and outlet of the impeller was analyzed by fast Fourier transform (FFT). The research results can provide a theoretical reference for the blade design of an arc bidirectional impeller.

2. Impeller Design and Three-Dimensional Modeling

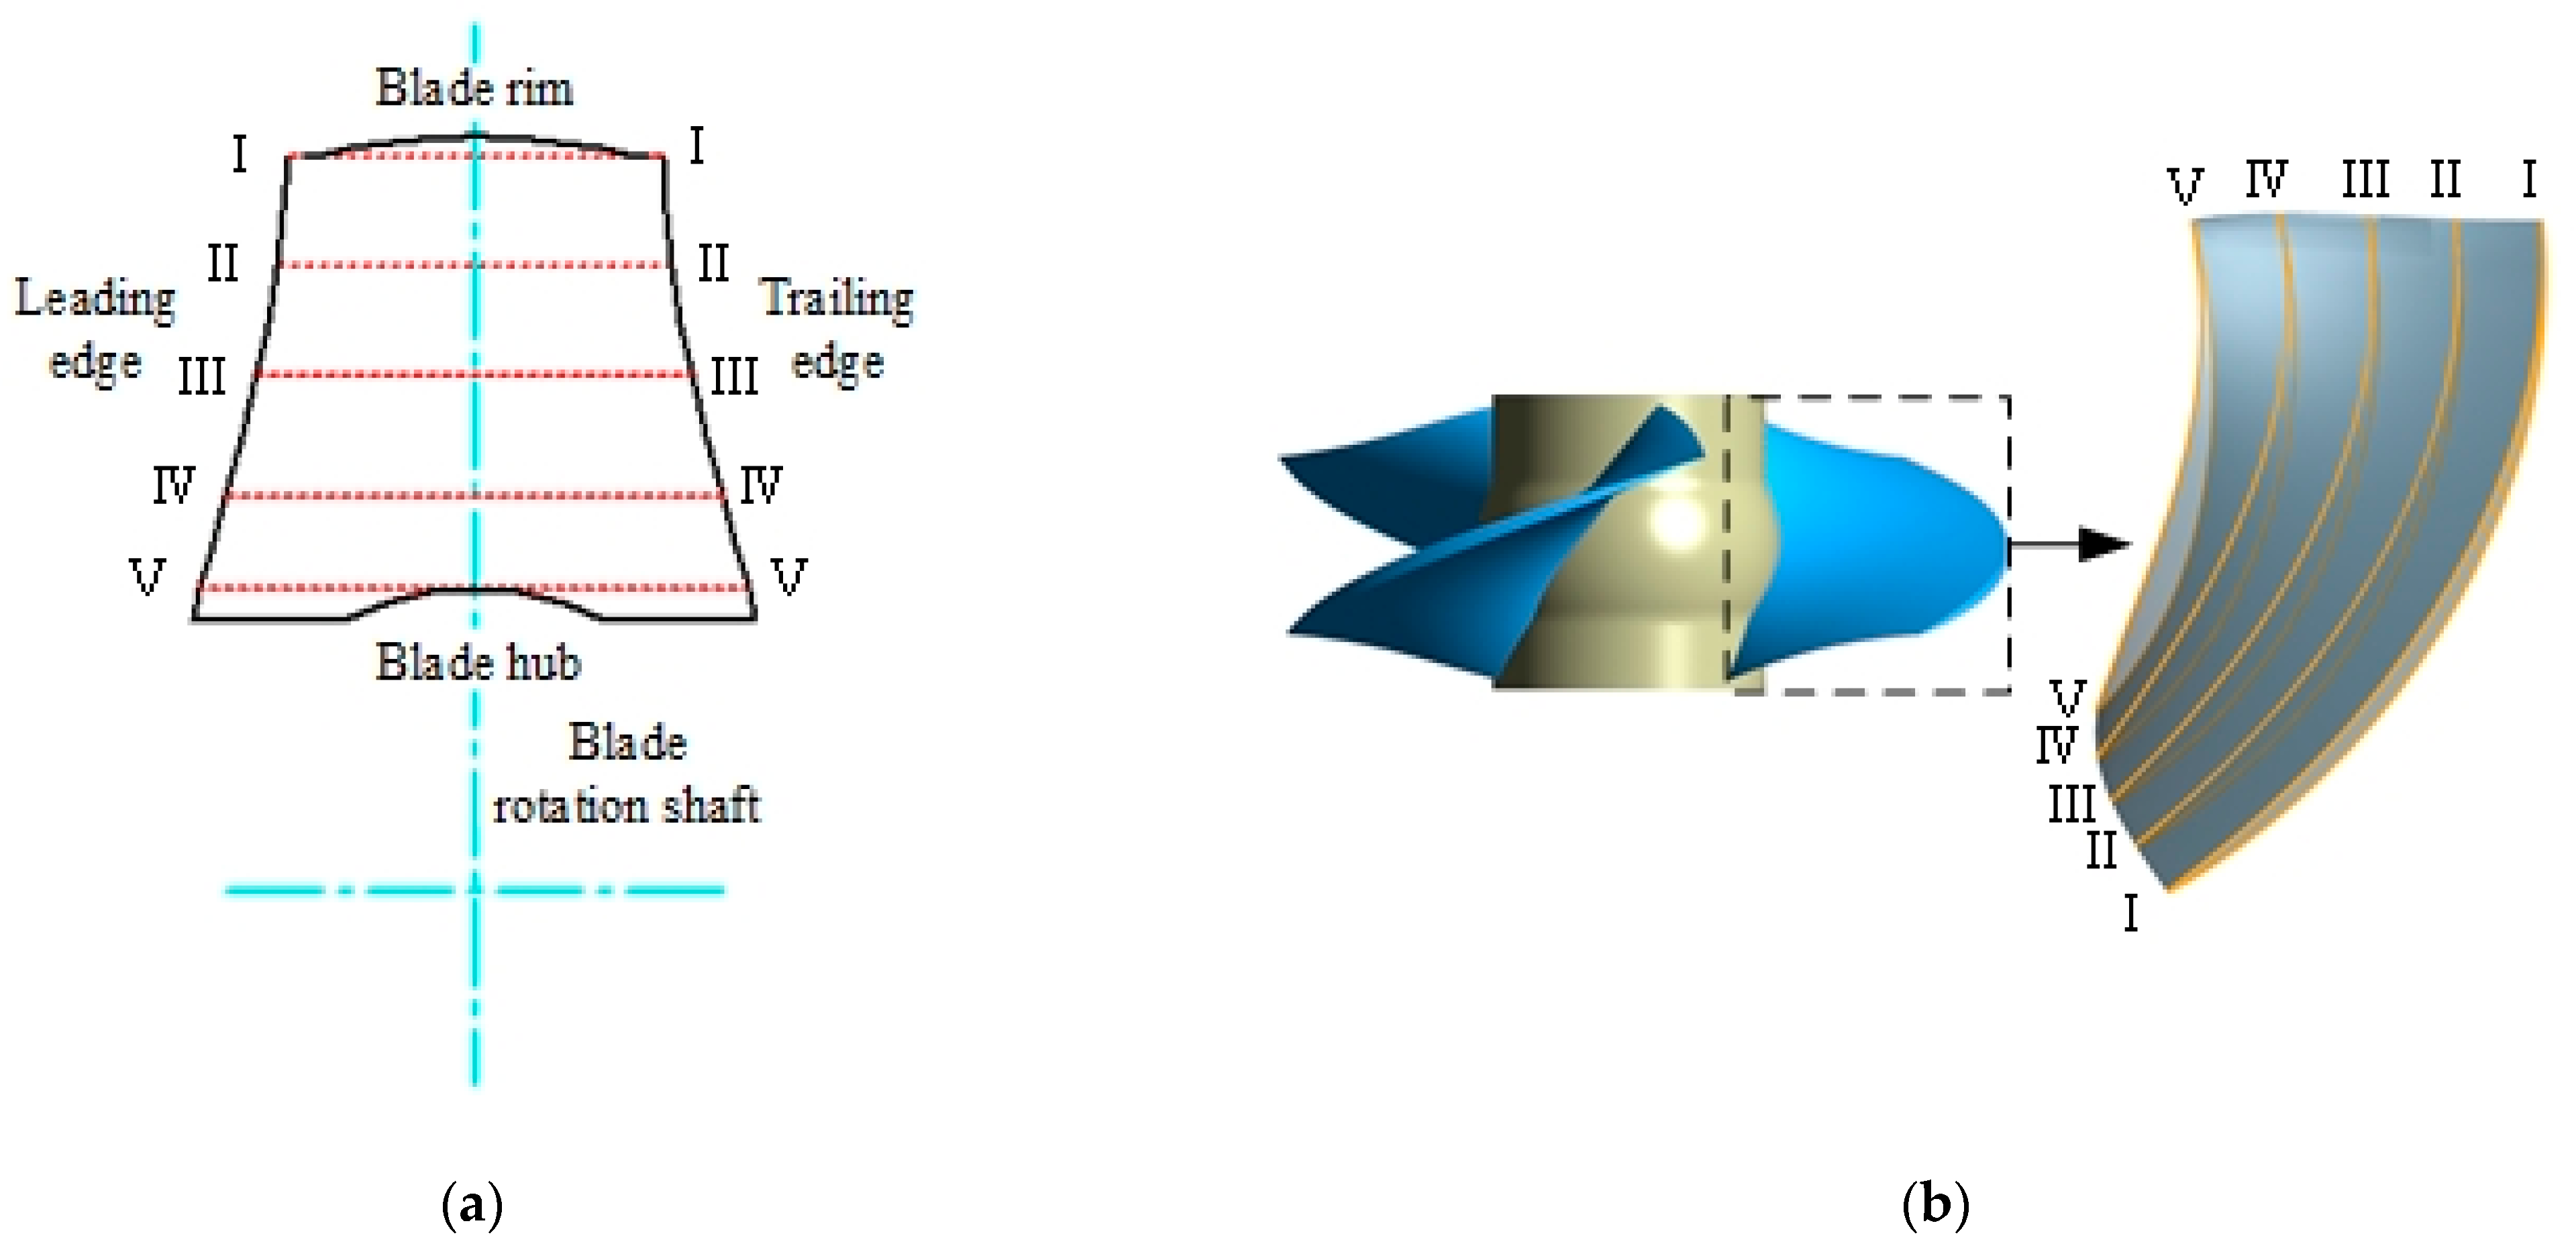
2.1. Hydraulic Design of Blade Profile

The hydraulic design of an axial-flow pump impeller is divided into the design of the meridional contour and the blade profile, as shown in Figure 1. In 1950, based on mean camber line parameterization [19,20], NACA designed the low-speed airfoil of NACA 65-series with varying camber by the cascade experiments [21,22], which contains the characteristics of the high lift coefficient and low drag coefficient. In this study, the Meridional contour remained consistent with the original model, and the impeller blade profile was determined by five NACA 65 airfoils. Figure 2 shows that the airfoil chord length L, airfoil thickness distribution, stagger angle γ and skeleton line were selected to define the airfoil. The parametric modeling of airfoils was achieved by applying the NACA 65 airfoil function as follows
y L = c fl 4 π 1 x L ln 1 x L + x L ln x L
c f l = 2 π ln ( 2 ) tan ( φ 4 )
where y and x represent the abscissa and ordinate values of the two-dimensional coordinate system, respectively. c f l is the lift coefficient. L and φ stand for the chord length and camber angle, respectively.
The skeleton line directly determines the relative camber of the airfoil, and the camber of the NACA 65 airfoil is defined by camber angle according to Equations (1) and (2). Thus, three distributions of camber angle at each section were selected to analyze the influence of airfoil camber on pressure fluctuation in the bidirectional axial-flow pump, as shown in Table 1. The maximum camber angle was at section one, while the minimum camber angle was at section five. The camber angle varied uniformly and linearly from section one to section five. Figure 3 shows the airfoil of section one for the original impeller, Case A and Case B. The airfoil camber increased with an increase in camber angle. When the camber angle was zero, the airfoil was symmetrical.

2.2. Three-Dimensional Modeling

According to the engineering requirements of head and flow rate, three blades were finally selected to form the whole impeller of the original case, Case A and Case B after completing the airfoil design, and the same guide vanes with five blades were matched with three kinds of impeller. Since the bidirectional axial-flow pump includes rotating segments and stationary segments, the computational domain needs to be segmented into multiple segments for three-dimensional modeling. Figure 4 shows that the whole pump consists of a straight pipe, impeller, guide vanes and an elbow pipe. Table 2 shows the main geometry parameters of the impeller and guide vane of Original case.

3. Numerical Simulation

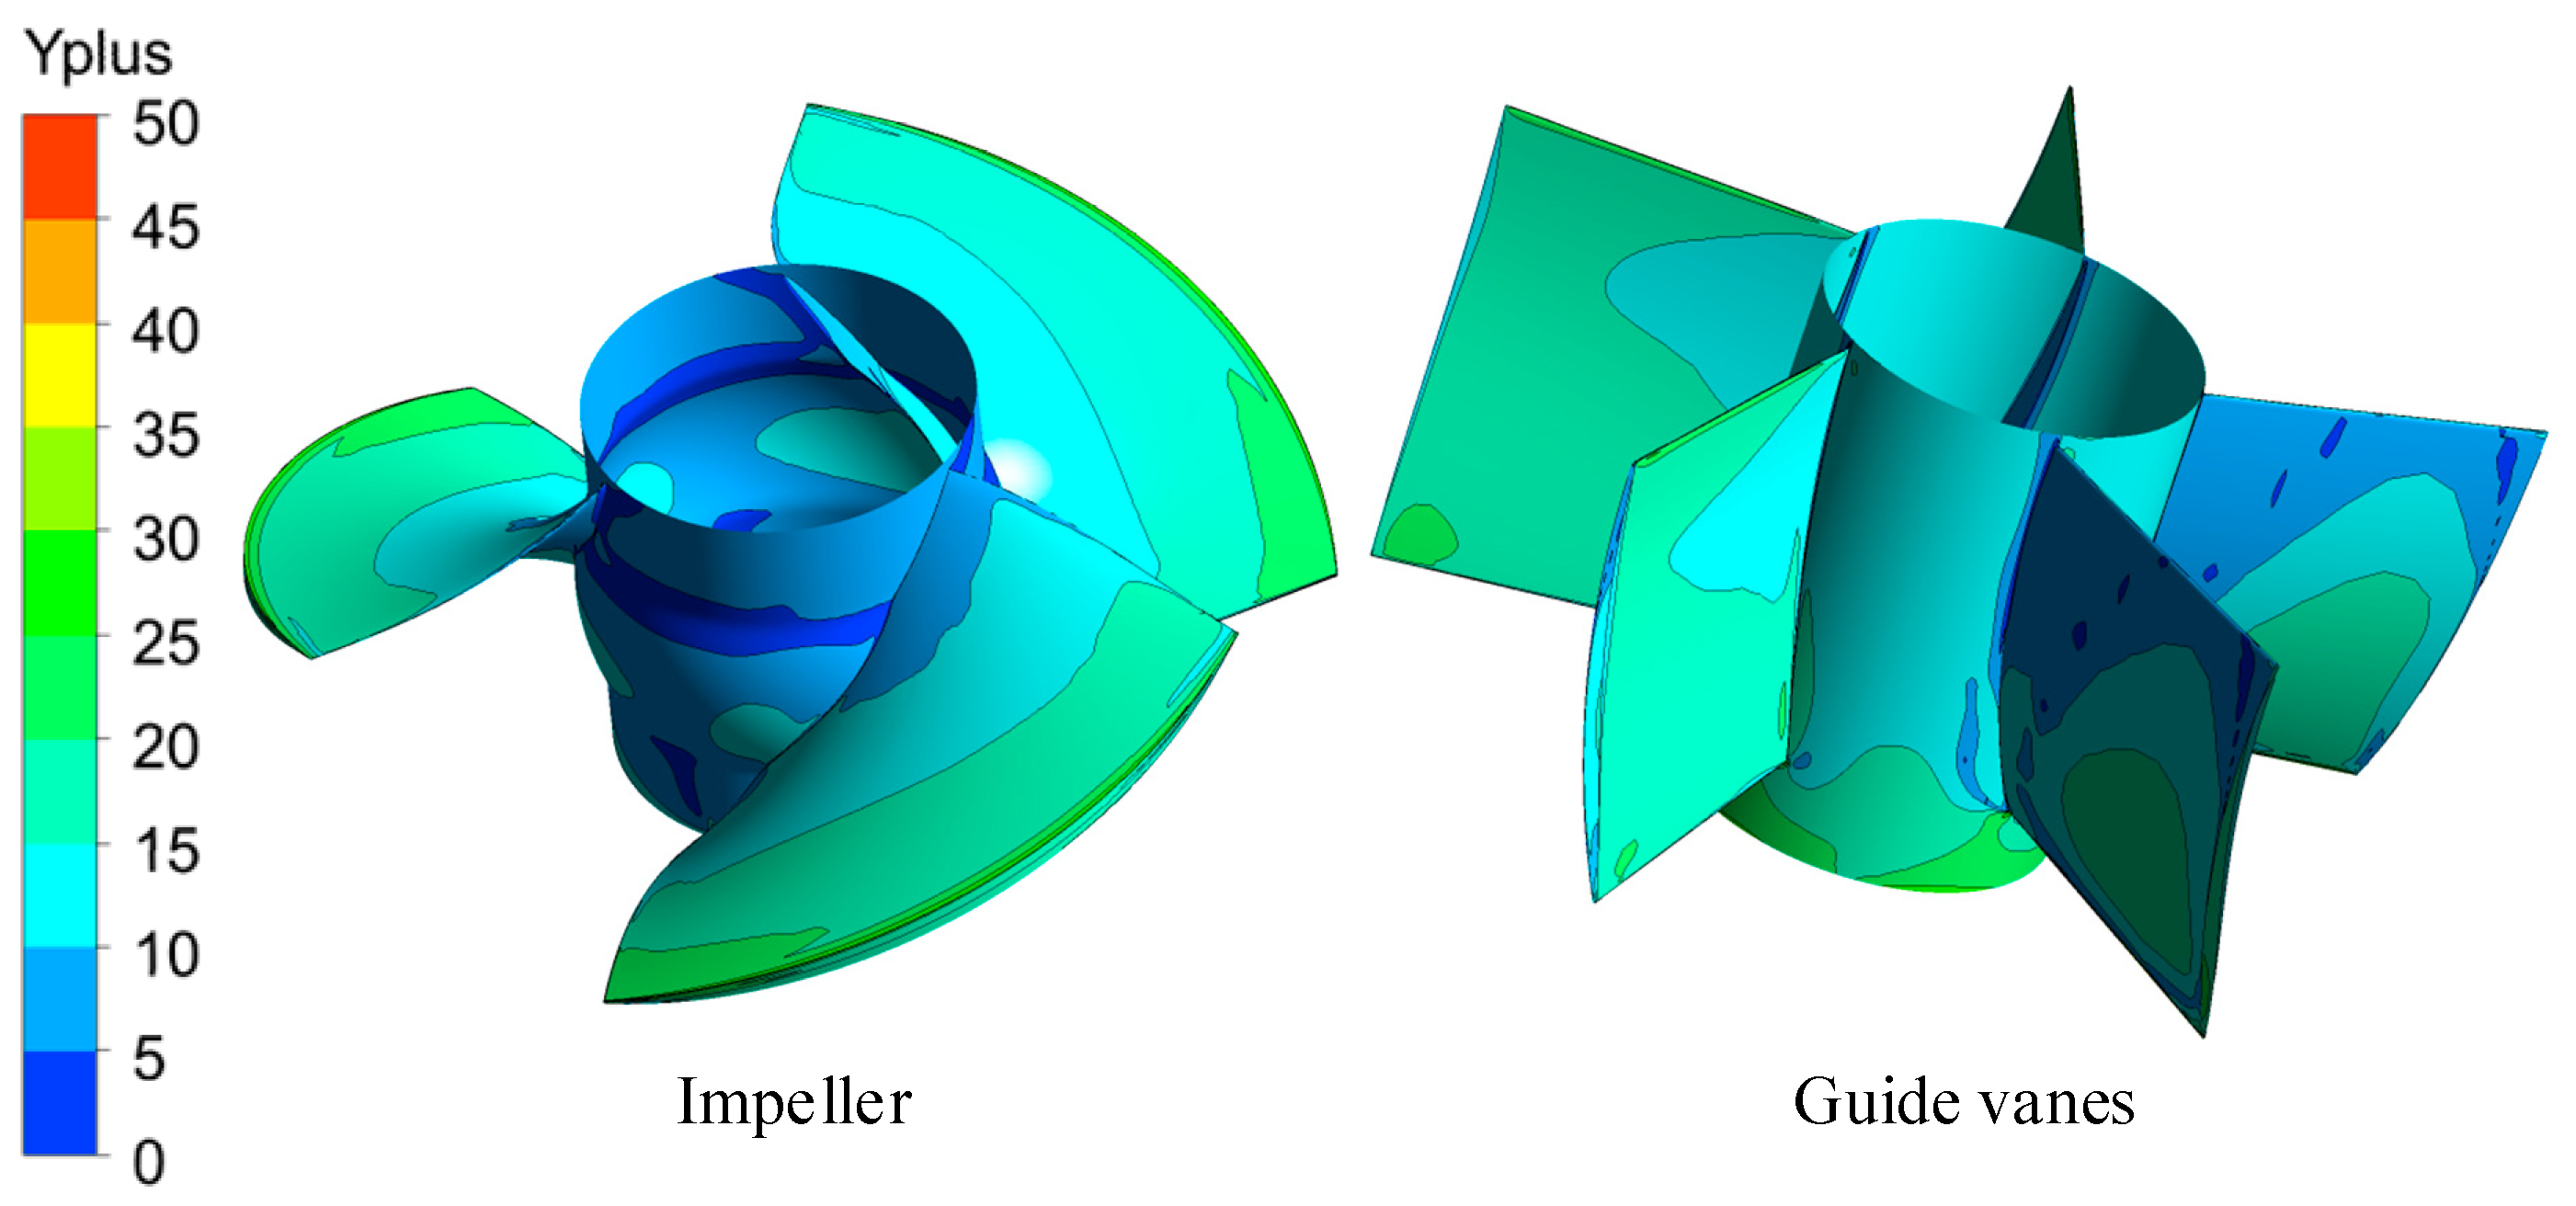
3.1. Mesh Generation

The computational domain was entirely a hexahedral grid, and the grid at all wall surfaces was refined, as shown in Figure 5. The impeller and guide vanes were generated by TurboGrid. The grids of the straight pipe and elbow pipe were generated by CFD ICEM. Figure 6 shows the grid independence analysis of the axial-flow pump. When the number of grid nodes exceeds 5.41 million, the growth rate of pump efficiency is less than 0.02% and 0.2% under forward and reverse conditions, respectively. Therefore, the total number of grid nodes was finally determined as 5.41 million. The number of grid nodes of the straight pipe, impeller, guide vanes and the elbow pipe were 909,706, 1,746,876, 1,478,235 and 950,172, respectively. In addition, the average Yplus of the straight pipe, impeller, guide vanes and the elbow pipe were 27.9, 23.4, 11.2 and 33.3, respectively. The detailed distributions of Yplus on the surface of the impeller and guide vanes are shown in Figure 7.

3.2. Boundary Condition and Governing Equation

In this study, the governing equation is the URANS equation, as shown in Equations (3) and (4) [23,24], and the turbulence model SST k-ω [25,26] was applied to enclose the equation.
v ¯ j x j = 0
( ρ v ¯ i ) t + ( ρ v ¯ i v ¯ j ) x j = p ¯ x i + x j ( μ v ¯ i x j ρ v i v i ¯ ) + ρ f i
where x i and x j represent the x, y and z direction of the three-dimensional coordinate system, respectively. v ¯ i and v ¯ j stand for time-averaged velocity components in the x, y and z direction of the three-dimensional coordinate system, respectively. ρ and p ¯ are the water density and time-averaged pressure, respectively. f i and μ stand for the source item and dynamic viscosity, respectively.
In addition, the steady calculation result was used as the initial value of the transient calculation result. The “Mass flow rate” and “Static Pressure” were adopted for the inlet and outlet conditions of the bidirectional axial-flow pump, respectively. The interface condition between the rotor and stator was set as “Transient Rotor Stator” [27], and the interface condition between stators was set as “None”. The detailed parameters of the boundary condition can be seen in Table 3.

4. Results and Discussion

4.1. Test Validation

To verify the accuracy of the numerical calculation, a bidirectional axial-flow pump external characteristic test was completed as shown in Figure 8. The test bench was double-layered and closed-type. The upper-layer height was 4.6 m and the lower-layer height was −2.6 m. The flow rate, head and shaft power of the bidirectional axial-flow pump were measured by an OPTIFLUX2000F electronic flow meter, EJA intelligent differential pressure transmitter and JCL1 torque meter, respectively. The measurement uncertainties of the flow rate, head and the shaft power are 0.2%, 0.1% and 0.14%, respectively. The measurement uncertainty of the test bench is less than 0.3%. Figure 9 shows the comparison of pump performance curves between CFD results and experimental (EXP) data. Under the forward condition, the CFD head is slightly lower than the EXP head, but the CFD efficiency is slightly higher than the EXP data. The relative deviation of efficiency under a design flow rate was less than 2%. Under the reverse condition, the CFD head and CFD efficiency under a small flow rate were slightly lower than the EXP data, but the CFD efficiency under large flow rates was higher than the EXP efficiency. The relative deviation of efficiency under the design flow rate was less than 4.5%.

4.2. Pump Performance Curves

Figure 10a shows the forward pump performance of the bidirectional axial-flow pump under three airfoil camber cases. The highest efficiency of Case A is 82.2% and the best efficiency point is 1.1 Qdes. The highest efficiencies of the original case and Case B are 79.9% and 78.2%, respectively, and the best efficiency point of these cases is 1.0 Qdes. The results show that the forward highest efficiency and best efficiency point of the bidirectional axial-flow pump decreased with the decrease in airfoil camber angle. In addition, the design head of Case A, original case and Case B are 4.1 m, 3.3 m and 3.0 m, respectively, which indicates that the forward pump head decreased with the decrease in airfoil camber angle. Figure 10b shows the reverse pump performance of the bidirectional axial-flow pump under three airfoil camber cases. The highest efficiency of Case A is 53.4%, and the best efficiency point is 1.0 Qdes. The highest efficiency and best efficiency point of the original case are 62.2% and 1.1 Qdes, respectively. The highest efficiency and best efficiency point of Case B are 64.8% and 1.1 Qdes, respectively. The highest efficiency and best efficiency point of the bidirectional axial-flow pump increased with a decrease in airfoil camber angle. In addition, the pump head increased with the decrease in airfoil camber angle and the design pump head of Case A, original case and Case B were 2.2 m, 2.9 m and 3.2 m, respectively.

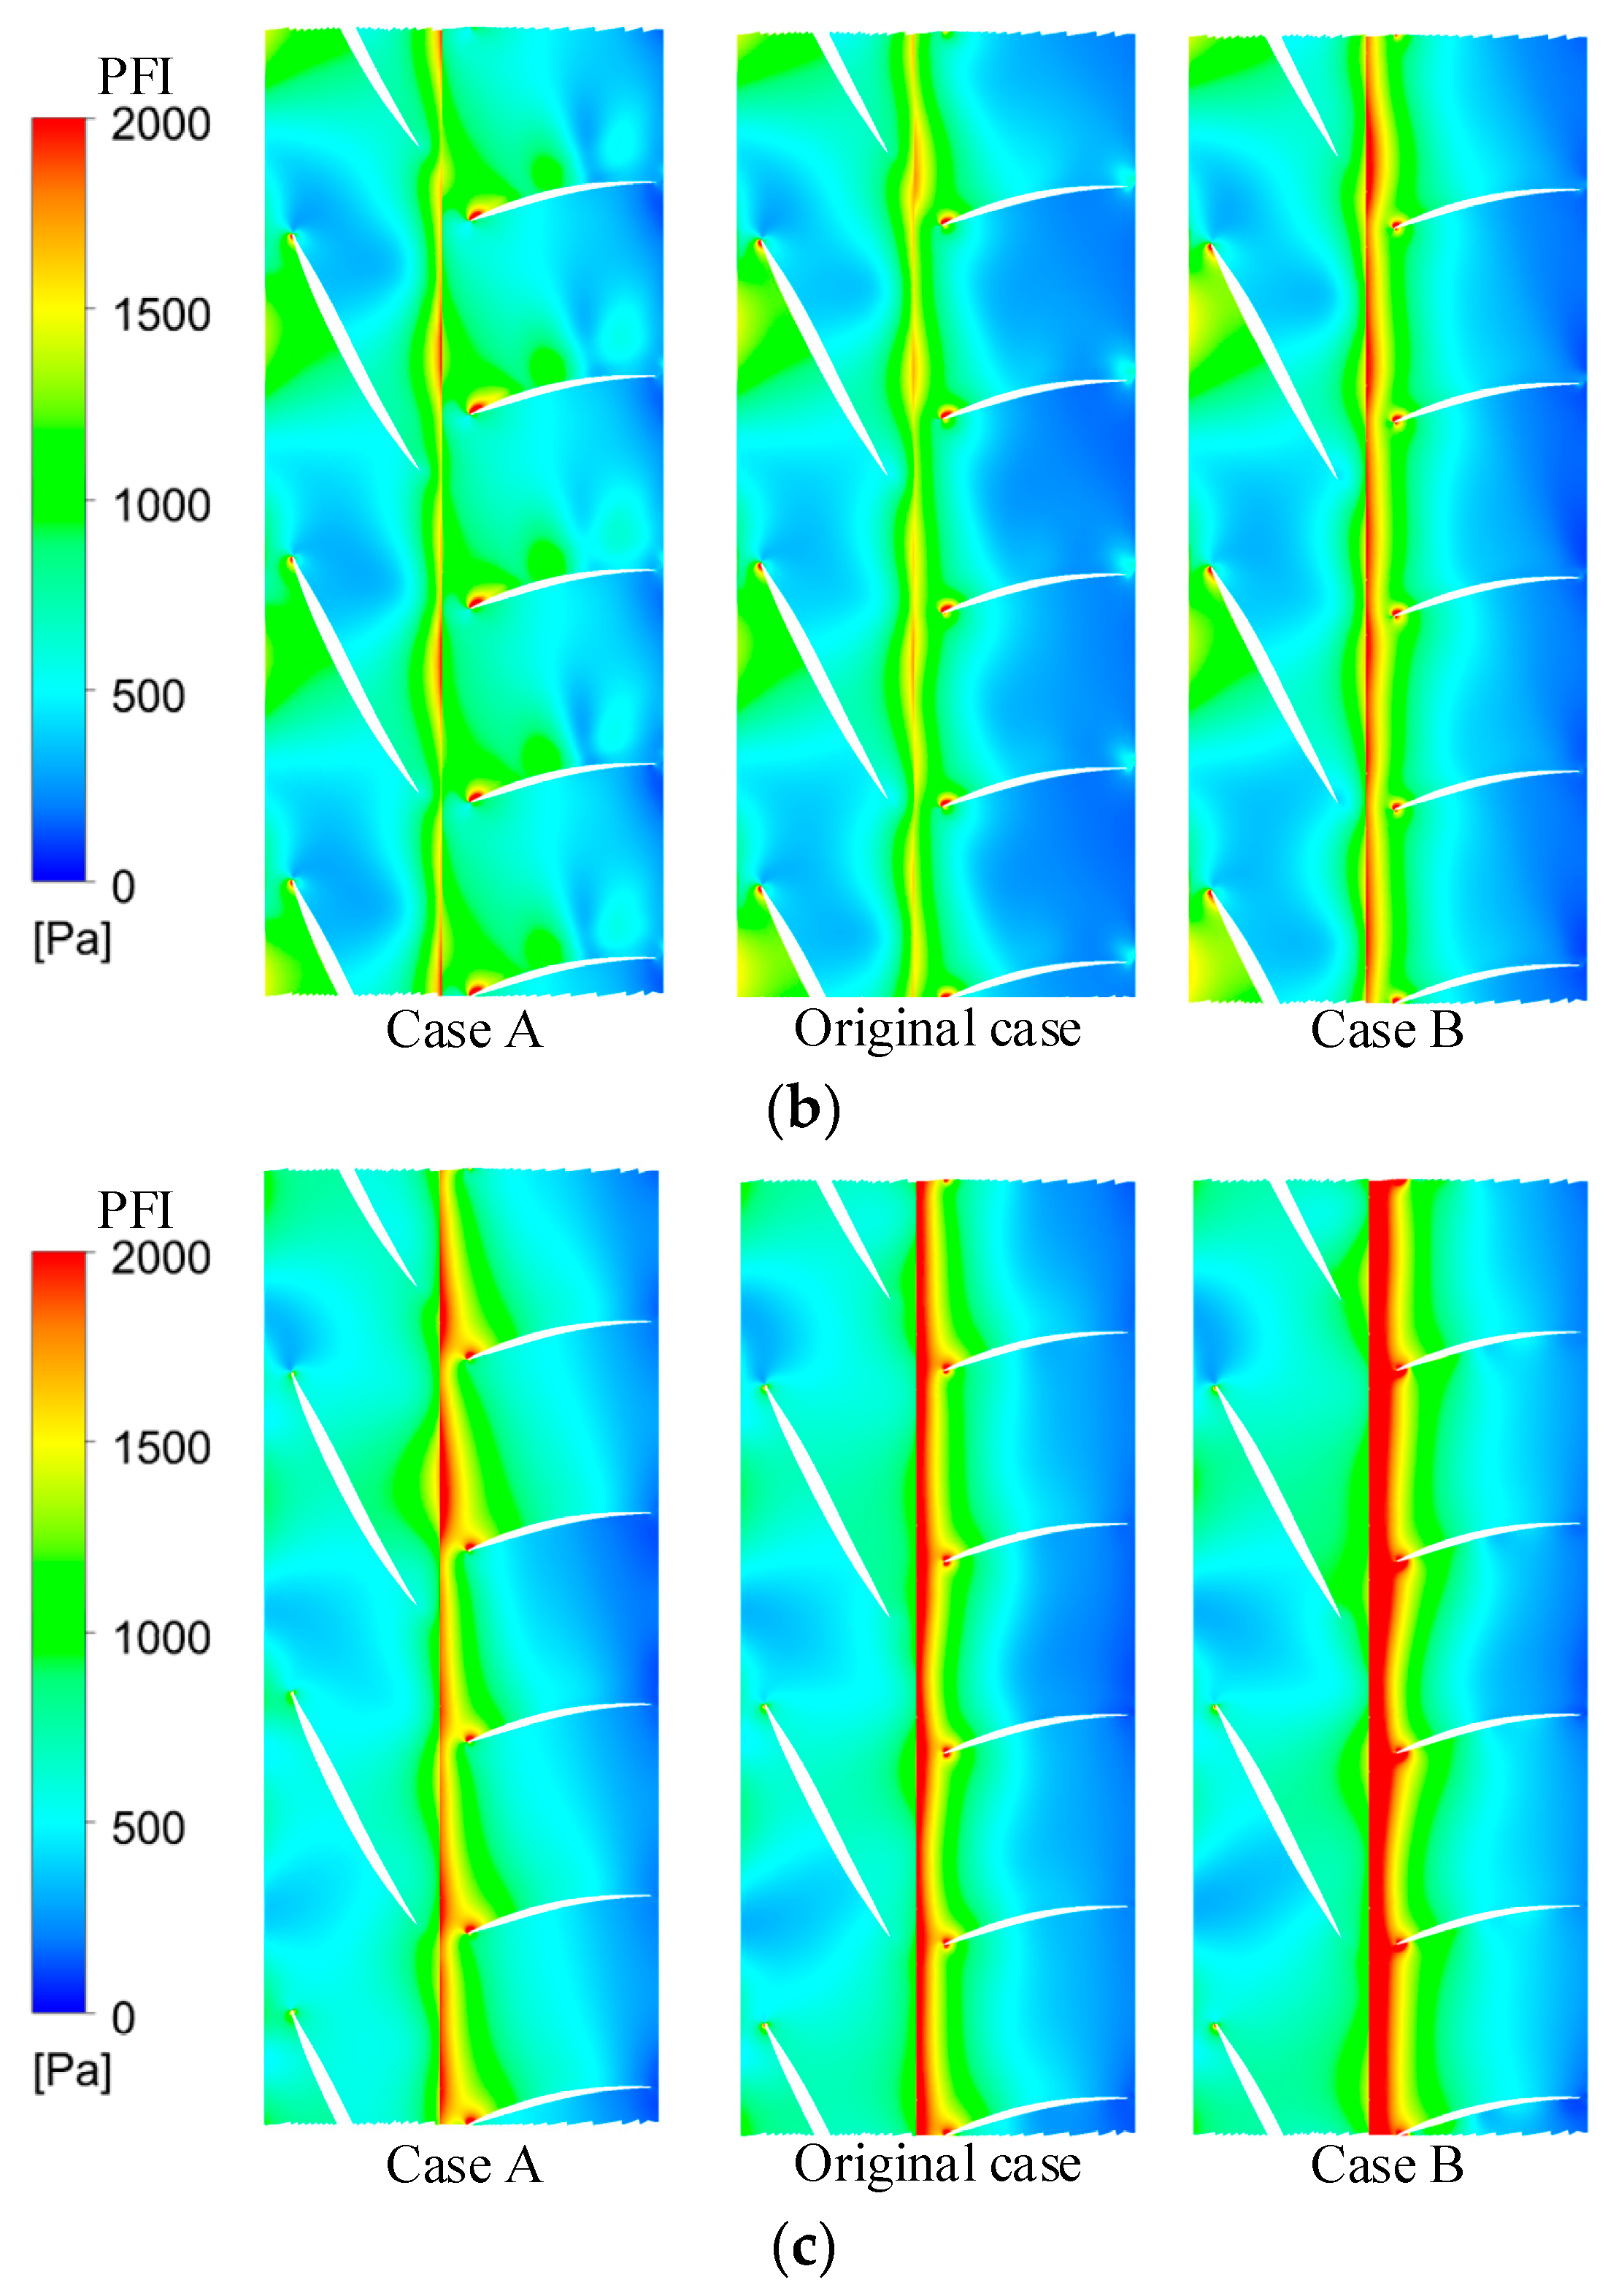
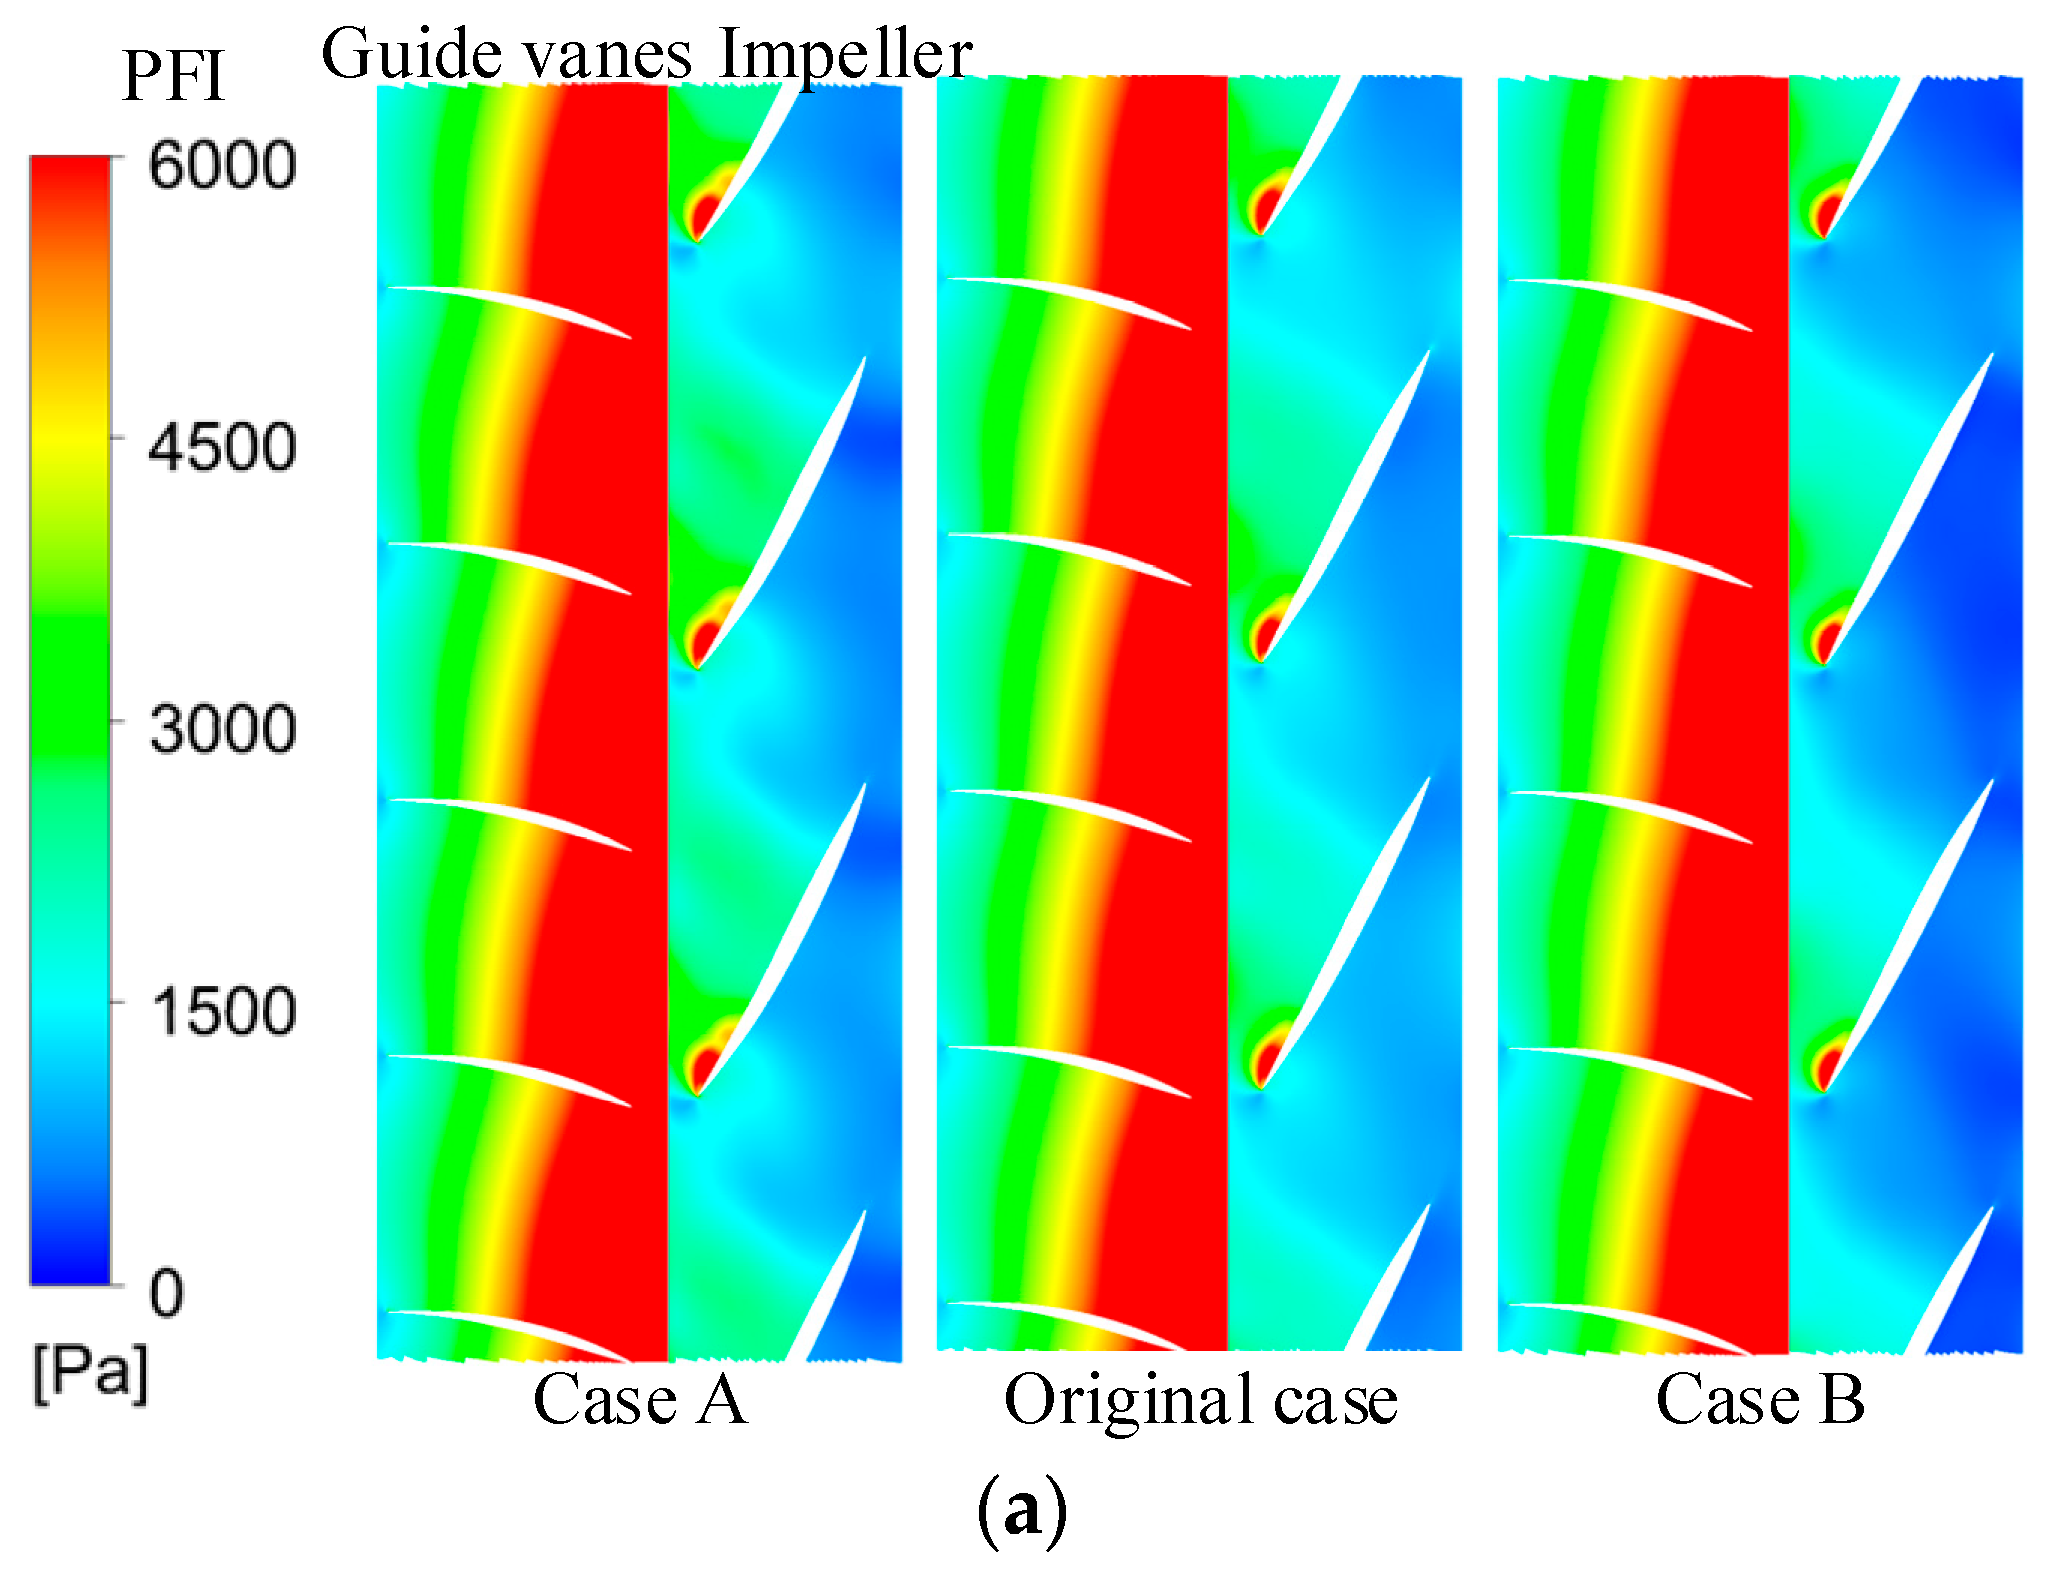
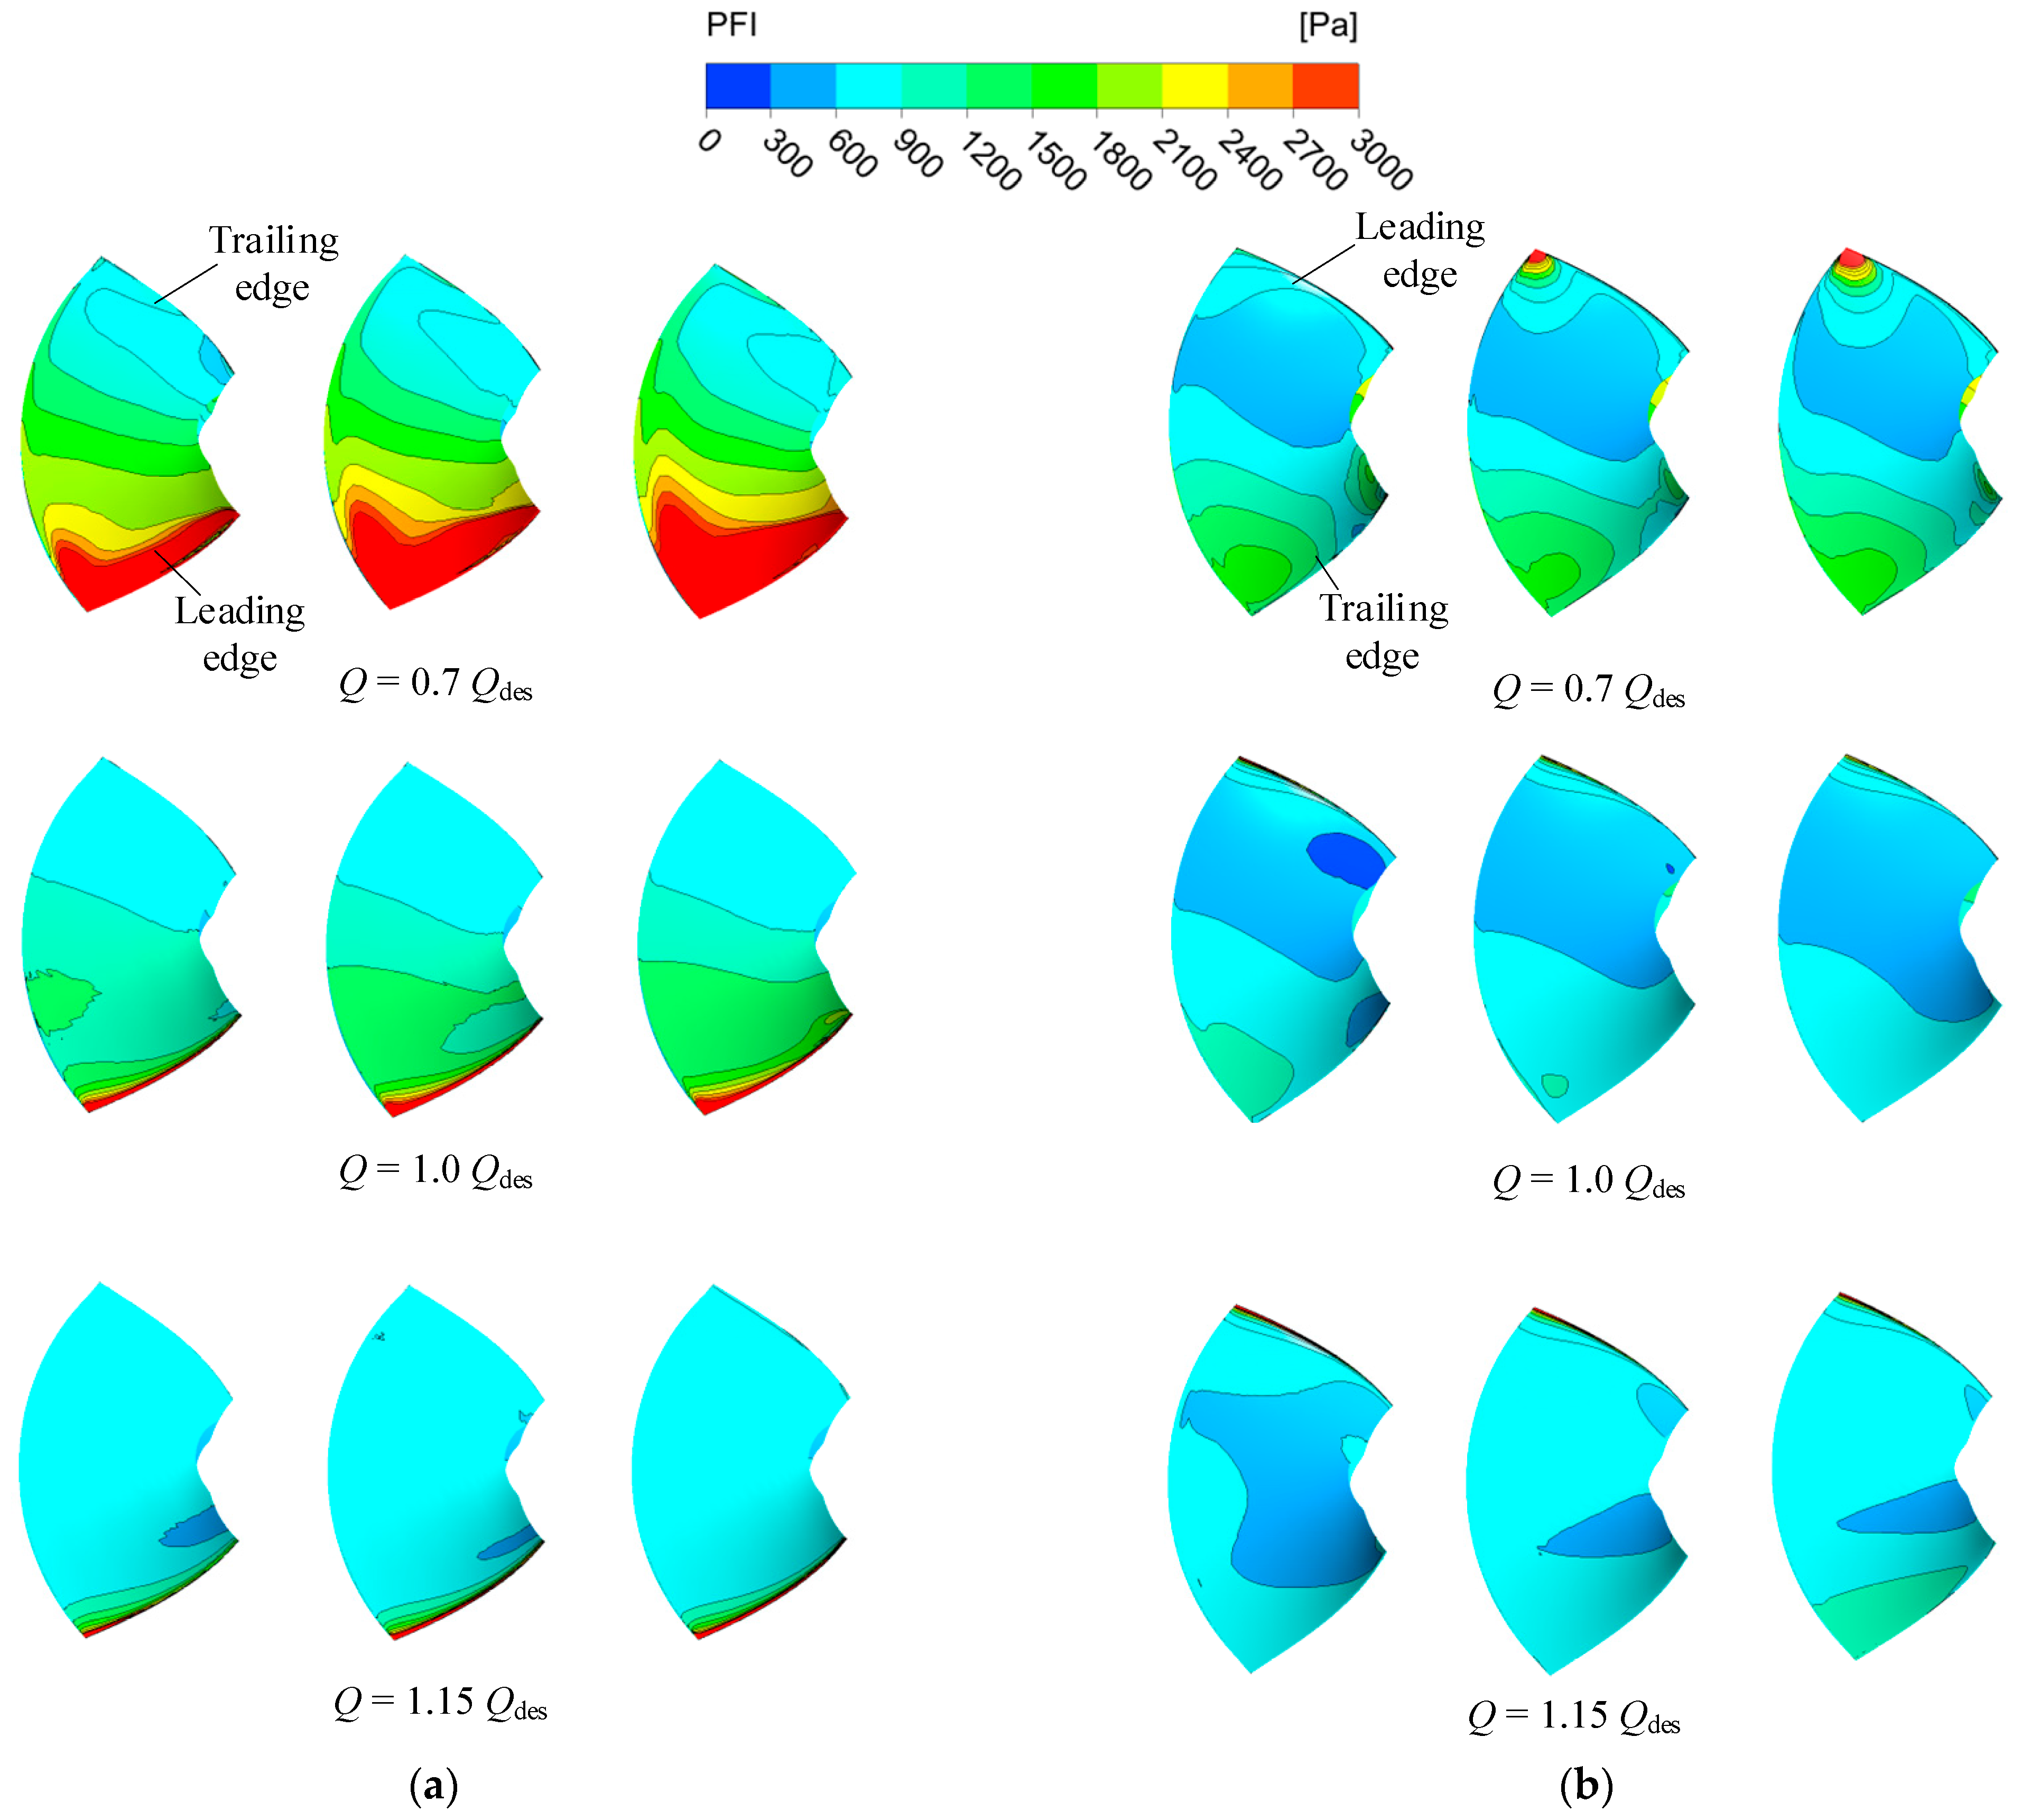
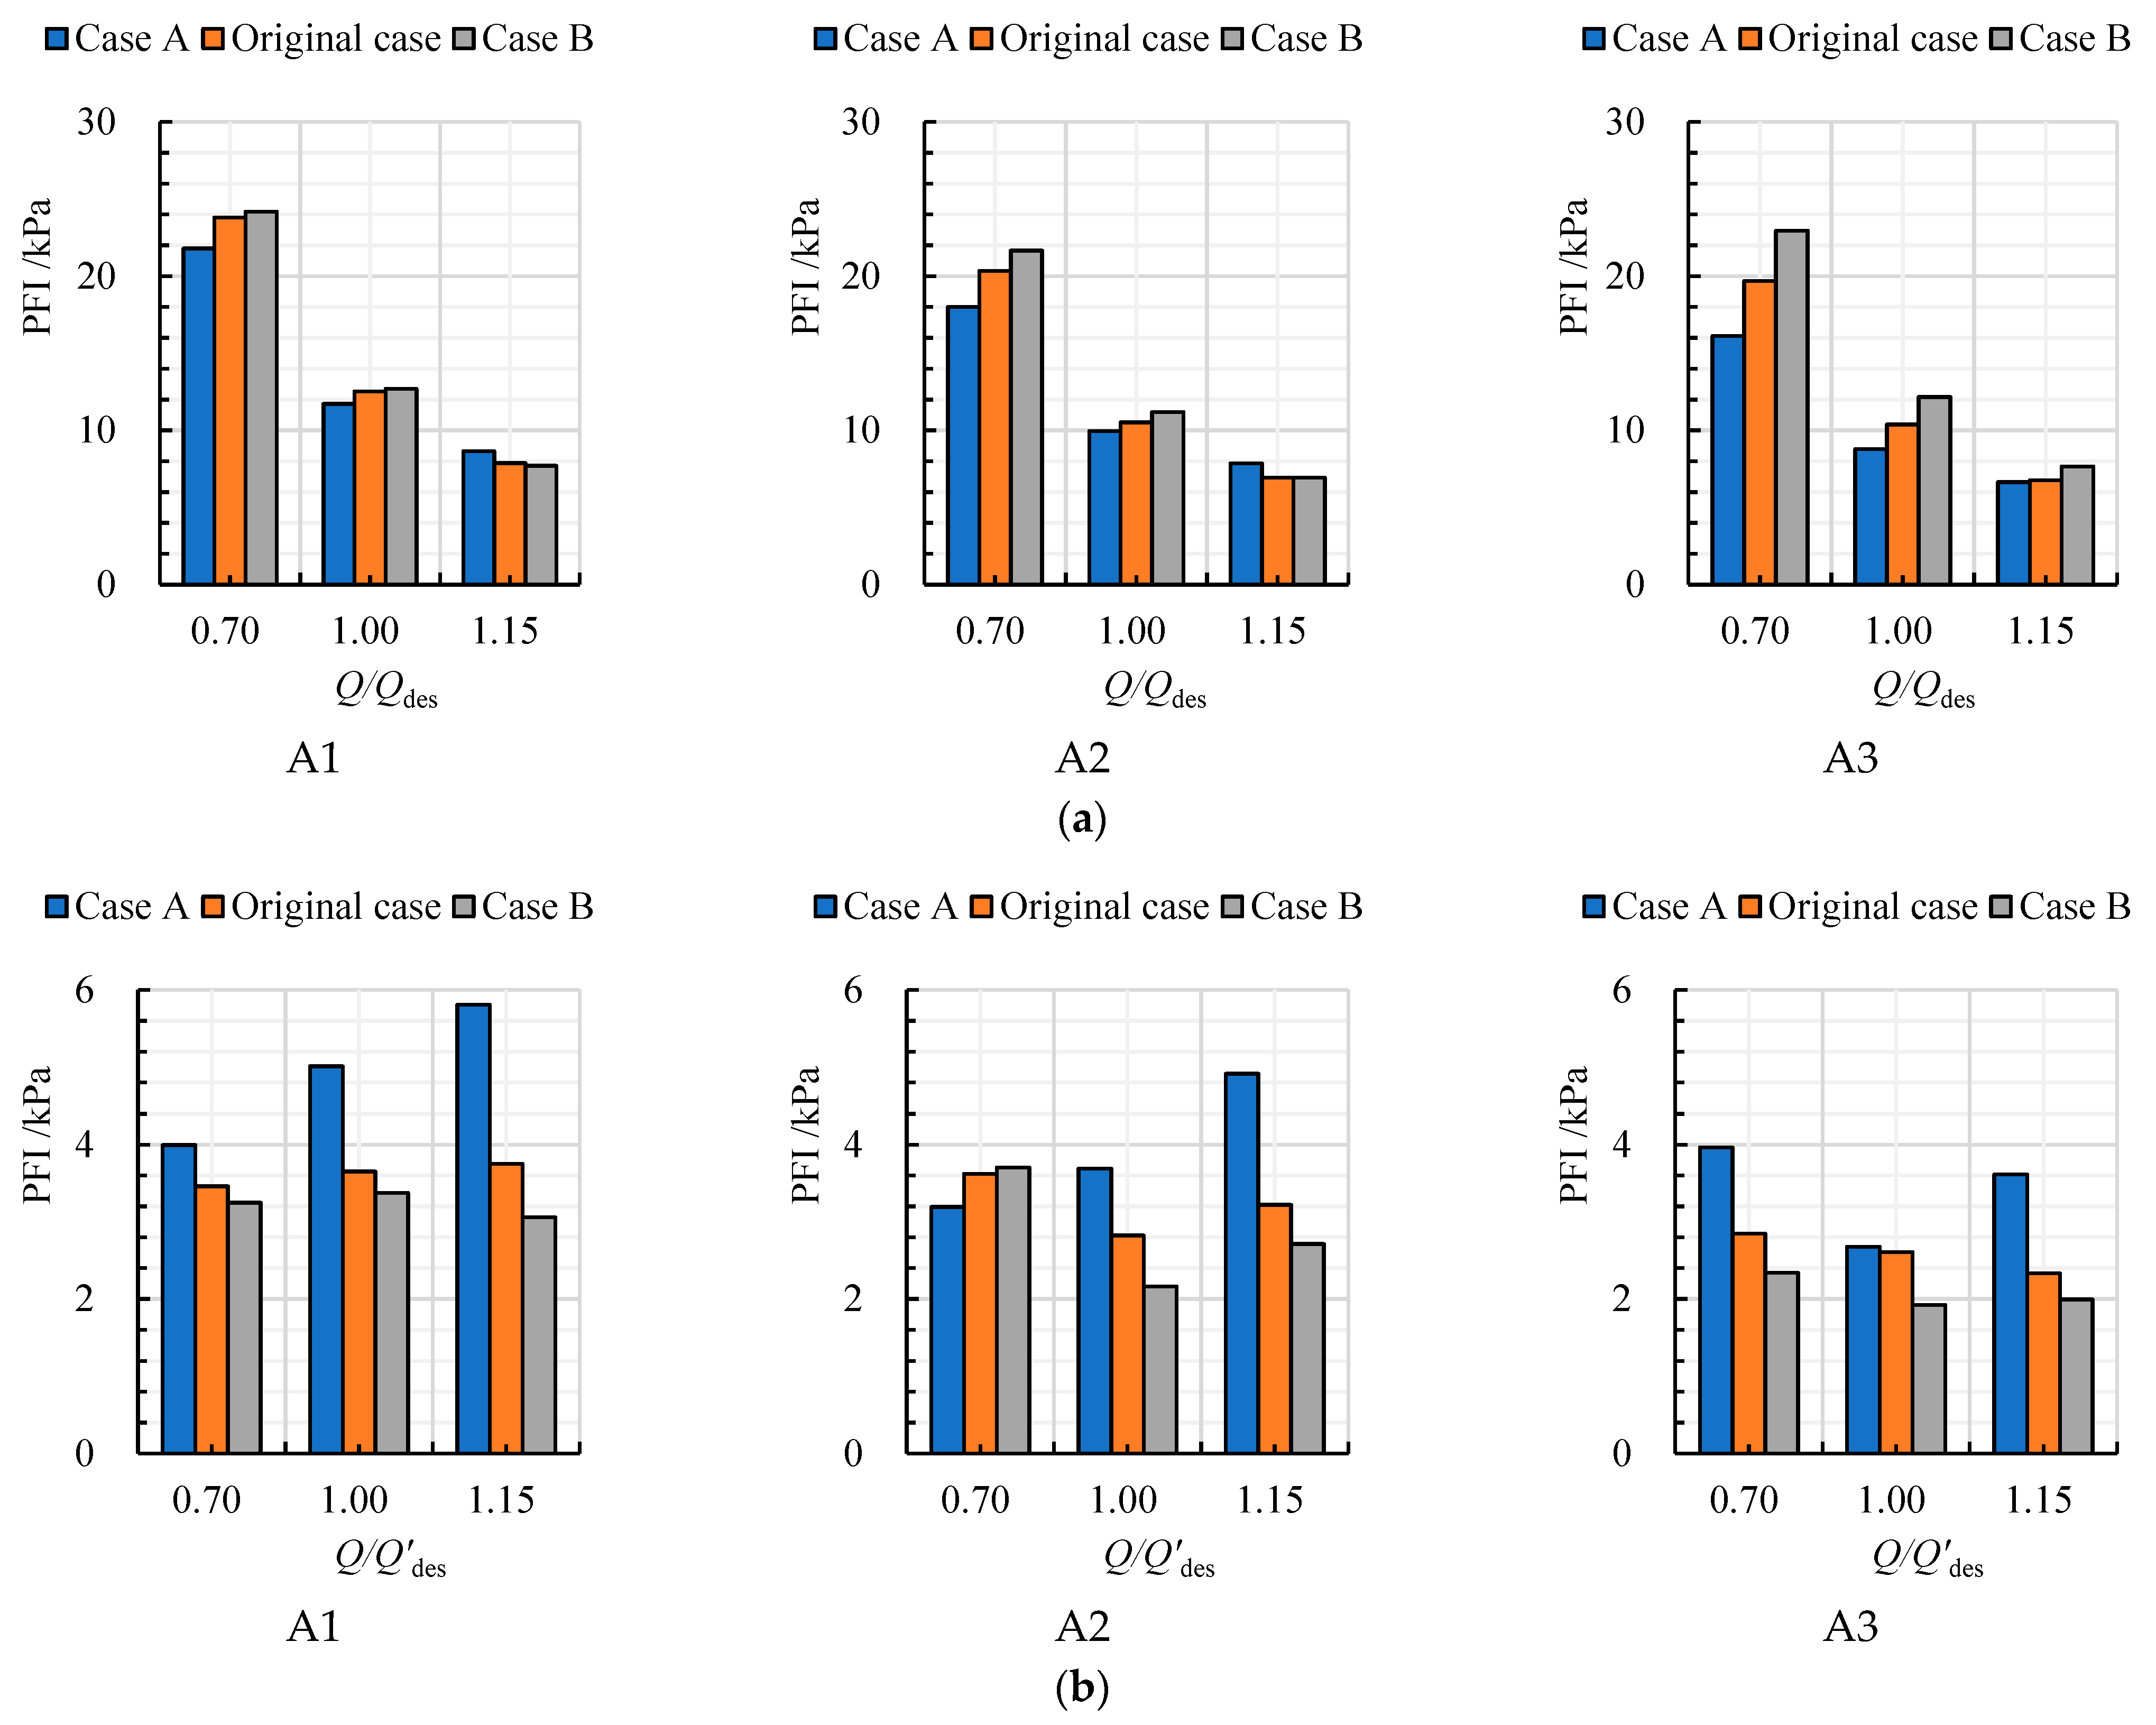
4.3. Distribution of PFI in Impeller and Guide Vanes

In this study, the PFI was defined by the pressure standard deviation, which was based on the CFD results of the last two impeller rotational cycles, and the calculation formulas were as follows
p ¯ = 1 N k = 1 N p k
PFI = 1 N k = 1 N p k p ¯ 2
where k and N stand for the serial number and the number of samples, respectively.
Figure 11 shows the distribution of PFI in the three kinds of impellers and guide vanes under different forward flow rates. When Q = 0.7 Qdes, the flow separation tends to be found at the leading edge of the blade and the guide vane due to the large inflow attack angle, thus, the PFI in these areas is high due to the fact that the backflow vortex collided with the main stream. There is also high PFI near the interface caused by the interference between the impeller and guide vane. The high PFI near the leading edge of the guide vane was mainly affected by the circumferential velocity component in the impeller outflow that decreased with the reduction in airfoil camber angle. Therefore, the high PFI near the leading edge of the guide vanes shifted to the middle side of the guide vanes with the decrease in airfoil camber angle. When Q = 1.0 Qdes, the outflow direction of the impeller matches the inlet angle of the guide vane, which resulted in only a small area of PFI near the inlet and leading edge of the guide vanes. According to Figure 10, the pump efficiency decreased with the reduction in airfoil camber angle, which indicated that the matching between the impeller and guide vanes decreased with the decrease in airfoil camber angle. Therefore, the area of high PFI increased with the decrease in airfoil camber angle. When Q = 1.15 Qdes, there was only a high PFI near the interface between the impeller and guide vanes, and the PFI area increased with the decrease in airfoil camber angle.
Figure 12 shows the distribution of PFI in the impeller and guide vanes under different reverse flow rates. Since the guide vanes were located upstream of the impeller, there was no obvious high PFI near the leading edge of the guide vanes due to the low circumferential velocity component in the inflow. However, the large area of flow separation vortices was near the trailing edge of the guide vane, and the impeller inflow condition was deteriorated, caused by the anti-arched vane of the inlet guide vanes. Thus, the large area of high PFI can be found near the trailing edge of the guide vanes and the leading edge of the impellers, and the area of these high PFI decreased with the reduction in flow rates. Since the matching between the guide vanes and the impeller increased with the reduction in airfoil camber angle, the area of high PFI near the interface decreased with the decline in airfoil camber angle.
Figure 13 shows the distribution of PFI on the suction side and pressure side of three kinds of blade under different forward flow rates. As shown in Figure 13a, the high PFI can be seen near the leading edge of the suction side due to the backwards flow caused by the large attack angle of the inflow, and the PFI decreases with the direction from the leading edge to the trailing edge. The area of high PFI near the leading edge declines with the increase in flow rates due to the fact that the attack angle of the impeller inflow becomes improved. A reduction in the airfoil camber angle also resulted in an increase in the attack angle of the impeller inflow. Therefore, the area of high PFI increases with the decrease in airfoil camber angle, and the effect of airfoil camber angle on high PFI was most obvious under Q = 0.7 Qdes. As shown in Figure 13b, the PFI on the pressure side was significantly lower than that on the suction surface. Only a small area of high PFI exists near the leading edge, and the high PFI area increases with the decrease in the airfoil camber angle. In addition, there are higher PFI near the hub and rim side of the trailing edge due to the wake vortices, and the PFI near these regions also decreases with the increase in flow rate.
Figure 14 shows the distribution of PFI on the suction side and pressure side of three kinds of blade under different reverse flow rates. As shown in Figure 14a, the high PFI can be found from the leading edge to the middle of the suction side due to the flow separation under 0.7 Qdes. The area of high PFI is significantly larger than that under the forward condition due to the disordered impeller inflow caused by the inlet guide vanes. When the flow rate gradually increased, the flow separation weakened, and thus, the high PFI area gradually decreased. The area of high PFI declines with the decrease of airfoil camber angle. As shown in Figure 14b, the PFI on the pressure side under the reverse condition is obviously larger than that under the forward condition. However, the PFI on the pressure side is lower than that on the suction side due to the fact that the interference between the impeller and guide vanes mainly affected the suction side. In addition, the effect of airfoil camber angle on the high PFI near the leading edge was not obvious.
Under the positive condition, the high PFI can be seen near the interface between the impeller and guide vanes, and the leading edge of the impeller, as shown in Figure 11. Under reverse conditions, the high PFI can be found near the interface between the impeller and guide vanes, as can be seen from Figure 12. Therefore, the monitoring points were fixed (not rotating with the impeller) near the inlet and outlet of the impeller to quantitatively analyze the influence of airfoil camber on PFI distribution, as shown in Figure 15.
Figure 16a shows the PFI on A1, A2 and A3 under three forward flow rates. When Q = 0.7 Qdes, the PFI on A1, A2 and A3 increased with the decrease in airfoil camber angle. Compared with Case A, the growth rates of Case B on A1, A2 and A3 were 11%, 20.3% and 42.3%, respectively. When Q = 1.0 Qdes, the PFI on A1, A2 and A3 also increased with the decline in camber angle, and the growth rates of Case B were 8.4%, 12.4% and 38.4%, respectively compared to Case A. However, when Q = 1.15 Qdes, the PFI on A1 and A2 reduced with the decrease in airfoil camber angle, and the decrease rates of Case B were 10.9% and 11.7%, respectively. In addition, the PFI on A3 increased with the decrease in airfoil camber angle and the growth rate of Case B was 15% compared with Case A. Figure 16b shows the PFI on A1, A2 and A3 under three reverse flow rates. The PFI on A1, A2 and A3 was obviously lower compared with that under the forward condition. When Q = 0.7 Qdes, the PFI on A1 and A3 decreased with the decline in airfoil camber angle and the decrease rates of Case B compared with Case A were 18.8% and 41.0%, respectively. However, the PFI on A2 increased with the decline in airfoil camber angle and the increase rate of Case B was 16% compared with Case A. When Q = 1.0 Qdes and 1.15 Qdes, the PFI on A1, A2 and A3 decreased with the decline in airfoil camber angle. Compared with Case A, the decrease rates of Case B were 32.7%, 41.4% and 28.1% at 1.0 Qdes, and were 47.3%, 44.8% and 44.9% at 1.15 Qdes. These results show that the effect of airfoil camber angle on PFI is most obvious at 0.7 Qdes and 1.15 Qdes.
Figure 17a shows the PFI on B1, B2 and B3 under three forward flow rates. When Q = 0.7 Qdes, the PFI on B1 skyrockets with a decrease in airfoil camber angle, and the growth rate of Case B was 544.1% compared with Case A. However, the PFI on B2 of the original case was the lowest. The PFI on B3 declined with the decrease in airfoil camber angle and the decrease rate of Case B compared with Case A was 80.2%. When Q = 1.0 Qdes and 1.15 Qdes, the PFI on B1, B2 and B3 increased with the decrease in airfoil camber angle. Compared with Case A, the growth rates of Case B were 112.4%, 111.1% and 145.8% under 1.0 Qdes, and were 71.7%, 55.4% and 78% under 1.15 Qdes. Figure 17b shows the PFI on B1, B2 and B3 under three reverse flow rates. When Q = 0.7 Qdes, the PFI on B1 increased and that on B2 and B3 declined with the decreases in airfoil camber angle. Compared with Case A, the growth rate of Case B on B1 was 14.2% and that on B2 and B3 were −13% and −36.6%. When Q = 1.0 Qdes and 1.15 Qdes, the PFI on B1, B2 and B3 increased with the decrease in airfoil camber angle. Compared with Case A, the growth rates of Case B were −1.0%, 20.5% and 37.3% under 1.0 Qdes and were 13.4%, 31.1% and 49.4% under 1.15 Qdes.

4.4. Time- and Frequency-Domain Analyses of Pressure Signal in Impeller

The PFI gradually increased along the direction from the hub to the rim of the impeller. Therefore, the pressure signals on A1 and B1 were selected as the research object, and the influence of airfoil camber on the time- and frequency-domain characteristics of these pressure signals was obtained.
Figure 18 shows the time domain of the pressure signal on A1. Under forward condition, there are six peaks in the two rotation cycles. The peak-to-peak values of three cases decreased with the increase in flow rate due to the reduction in the impeller pre-rotation effect. Case A has the lowest pressure and Case B has the highest pressure under the same rotation angle. Under the reverse condition, the peak-to-peak values of pressure are obviously lower than that under the forward condition. There are also six peaks in the two rotation cycles. However, the pressure peak and pressure valley of three cases decreased with the increase in flow rate caused by the circulation reduction in outflow. When Q = 0.7 Qdes, there is no significant difference in pressure curves between the three cases. When Q = 1.0 Qdes and 1.15 Qdes, the pressure valley of Case A is the lowest.
Figure 19 shows the time domain of the pressure signal on B1. Under the forward condition, there are six peaks in the two rotation cycles. The pressure peak is the highest under 0.7 Qdes caused by the strong interference between the impeller and guide vanes, and the pressure peak is the lowest under 1.0 Qdes due to good matching between the impeller and guide vanes. The peak-to-peak values of Case A and Case B are the lowest and highest, respectively. Under the reverse condition, the peak-to-peak values of pressure are higher than those under the forward condition caused by the distorted inflow. The peak-to-peak values of three cases decreased with the increase in flow rate due to the improvement in the inflow state. The pressure peaks of Case A and Case B are the highest and lowest, respectively.
To analyze the influence of the airfoil camber on the frequency characteristics of the pressure signal at the impeller inlet and impeller outlet, FFT was adopted. Figure 20a,b shows the frequency domain of the pressure signal on A1 under forward and reverse conditions. As shown in Figure 20a, the main frequency is the blade-passing frequency and the main frequency amplitude decreased with the increase in flow rate caused by the reduction in the impeller pre-rotation effect. Since the impeller pre-rotation effect increased with the decrease in airfoil camber angle resulting from the reduction in inlet attack angle, the main frequency amplitudes of Case A and Case B are the lowest and highest, respectively. As shown in Figure 20b, the main frequency is also the blade-passing frequency, and the main frequency amplitude increased with the increase in flow rate. Since the velocity circulation in outflow decreased with the decrease in airfoil camber angle caused by the reduction in the outlet attack angle, the main frequency amplitudes of Case A and Case B are the highest and lowest, respectively.
Figure 21a shows the frequency domain of pressure signal on B1 under the forward condition. The main frequency is the blade-passing frequency and the main frequency amplitude increased with the increase in flow rate. Since the matching between the impeller and guide vane decreased with the decrease in airfoil camber angle, the main frequency amplitudes of Case A and Case B are the lowest and the highest, respectively. Figure 21b shows the frequency domain of the pressure signal on B1 under the reverse condition. The main frequency is the blade-passing frequency and the main frequency amplitude is obviously higher than that under the forward condition due to the distorted inflow of the impeller. As the inflow state improved with the increase in flow rate, the main frequency amplitude decreased with the increase in flow rate. Under 1.0 Qdes and 1.15 Qdes, the main frequency amplitudes of Case A and Case B are the highest and lowest, which indicates that the inflow state improved with the decrease in airfoil camber angle.

5. Conclusions

In this paper, the internal flow structure of a bidirectional axial-flow pump under three airfoil camber cases was predicted by solving the URANS equation. The airfoil camber was quantitatively controlled by the airfoil camber angle. The pressure standard deviation was used to define the local PFI inside the impeller and guide vane. FFT was applied to analyze the frequency-domain characteristics of these monitor points. Some conclusions about the effect of airfoil camber on pump performance, spatial distribution of PFI and frequency-domain characteristics can be drawn:
(1)
The forward highest efficiency, best efficiency point and head declined with a decrease in airfoil camber angle, and the reverse highest efficiency, best efficiency and head increased with a decrease in airfoil camber angle.
(2)
Under the forward condition, the area of high PFI on the leading edge and outlet of the impeller increased with the decrease in airfoil camber angle due to the enhanced flow separation. Under the reverse condition, the area of high PFI on the leading edge and inlet of the impeller decreased with the decline in airfoil camber angle, which was caused by the suppressed impeller distortion inflow.
(3)
The main frequency at the inlet and outlet of the three kinds of impeller is the blade-passing frequency. Under the forward condition, the main frequency amplitude near the impeller–guide vanes interface increased with a decline in the airfoil camber angle. Under the reverse condition, the main frequency amplitude near the impeller–straight pipe interface and impeller–guide vanes interface decreased with a decrease in airfoil camber angle.
These results can provide a theoretical reference for the optimization of bidirectional arc airfoil design to ensure the stable operation of axial-flow pumps.

Author Contributions

Conceptualization, F.M.; data curation, F.M. and J.C.; methodology, F.M. and Y.L. (Yanjun Li); software, F.M.; formal analysis, F.M.; resources, F.M. and Y.L. (Yanjun Li); visualization; F.M.; project administration, Y.L. (Yanjun Li) and Y.L. (Yalin Li); supervision, Y.L. (Yanjun Li); validation, F.M. and L.X.; writing—original draft, F.M.; writing—review and editing, J.C. and L.X. All authors have read and agreed to the published version of the manuscript.

Funding

This research was funded by National Natural Science Foundation of China (Grant No. 51809120).

Conflicts of Interest

The authors declare no conflict of interest.

Nomenclature

Q (m3/s)Flow rate
Q des (m3/s)Forward design flow rate
Q des Reverse design flow rate
H (m)Pump head
η (%)Pump efficiency
c f l Lift coefficient
L (m)Chord length
φ (°)Camber angle
v ¯ (m/s)Time-averaged velocity
p ¯ (Pa)Time-averaged pressure
ρ (kg/m3)Water density
f i Source item
μ (Pa·s)Dynamic viscosity
3DThree-dimensional
URANSUnsteady Reynolds time-averaged Navier–Stokes
CFDComputational fluid dynamics
EXPExperiment
PFIPressure fluctuation intensity
BPFBlade-passing frequency
FFTFast Fourier transform

References

  1. Xie, R.; Wu, Z.; He, Y.; Tang, F.; Xie, C.; Tu, L. Optimization research on passage of bidirectional shaft tubular pump. Trans. Chin. Soc. Agric. Mach. 2015, 46, 68–74. [Google Scholar]
  2. Shi, L.; Liu, X.; Tang, F.; Yao, Y.; Xie, R.; Zhang, W. Design optimization and experimental analysis of bidirectional shaft tubular pump device. Trans. Chin. Soc. Agric. Mach. 2016, 47, 85–91. [Google Scholar]
  3. Mao, N.; Kang, C.; Zhu, Y.; Zhang, W. Performance prediction and internal flow analysis of the reversible axial-flow pump unit. Mach. Electron. 2016, 34, 3–7+12. [Google Scholar]
  4. Ma, P.F.; Wang, J.; Wang, H.F. Investigation of performances and flow characteristics of two bi-directional pumps with different airfoil blades. Sci. China Technol. Sci. 2018, 61, 1588–1599. [Google Scholar] [CrossRef]
  5. Luo, X.; Ye, W.; Huang, R.; Wang, Y.; Du, T.; Huang, C. Numerical investigations of the energy performance and pressure fluctuations for a waterjet pump in a non-uniform inflow. Renew. Energy 2020, 153, 1042–1052. [Google Scholar] [CrossRef]
  6. Cui, B.; Zhang, Y.; Huang, Y. Analysis of the Pressure Pulsation and Vibration in a Low-Specific-Speed Centrifugal Pump. J. Fluids Eng. 2021, 143, 021201. [Google Scholar] [CrossRef]
  7. Cui, B.; Li, W.; Zhang, C. Effect of blade trailing edge cutting angle on unstable flow and vibration in a centrifugal pump. J. Fluids Eng. 2020, 142, 101203. [Google Scholar] [CrossRef]
  8. Gao, B.; Zhang, N.; Li, Z.; Ni, D.; Yang, M. Influence of the blade trailing edge profile on the performance and unsteady pressure pulsations in a low specific speed centrifugal pump. J. Fluids Eng. 2016, 138, 051106. [Google Scholar] [CrossRef]
  9. Lin, Y.; Li, X.; Li, B.; Jia, X.-Q.; Zhu, Z. Influence of Impeller Sinusoidal Tubercle Trailing-Edge on Pressure Pulsation in a Centrifugal Pump at Nominal Flow Rate. J. Fluids Eng. 2021, 143, 091205. [Google Scholar] [CrossRef]
  10. Zhang, J.; Li, G.; Mao, J.; Yuan, S.; Qu, Y.; Jia, J. Numerical investigation of the effects of splitter blade deflection on the pressure pulsation in a low specific speed centrifugal pump. Proc. Inst. Mech. Eng. Part A J. Power Energy 2020, 234, 420–432. [Google Scholar] [CrossRef]
  11. Li, W.; Ji, L.; Shi, W.; Yang, Y.; Awais, M.; Wang, Y.; Xu, X. Correlation research of rotor–stator interaction and shafting vibration in a mixed-flow pump. J. Low Freq. Noise Vib. Act. Control. 2020, 39, 72–83. [Google Scholar] [CrossRef]
  12. Ji, L.; Li, W.; Shi, W.; Zhou, L.; Agarwal, R. Experimental study of pressure pulsation in a mixed-flow pump with different tip clearances based on wavelet analysis. Shock. Vib. 2020, 2020, 9041686. [Google Scholar] [CrossRef]
  13. Lei, T.; Zhiyi, Y.; Yun, X.; Yabin, L.; Shuliang, C. Role of blade rotational angle on energy performance and pressure fluctuation of a mixed-flow pump. Proc. Inst. Mech. Eng. Part A J. Power Energy 2017, 231, 227–238. [Google Scholar] [CrossRef]
  14. Yang, F.; Chang, P.; Hu, W.; Mao, B.; Liu, C.; Li, Z. Numerical Study on Pressure Pulsation in a Slanted Axial-Flow Pump Device under Partial Loads. Processes 2021, 9, 1404. [Google Scholar] [CrossRef]
  15. Yang, F.; Chang, P.; Yuan, Y.; Li, N.; Xie, R.; Zhang, X.; Lin, Z. Analysis of Timing Effect on Flow Field and Pulsation in Vertical Axial Flow Pump. J. Mar. Sci. Eng. 2021, 9, 1429. [Google Scholar] [CrossRef]
  16. Shi, L.; Yuan, Y.; Jiao, H.; Tang, F.; Cheng, L.; Yang, F.; Jin, Y.; Zhu, J. Numerical investigation and experiment on pressure pulsation characteristics in a full tubular pump. Renew. Energy 2021, 163, 987–1000. [Google Scholar] [CrossRef]
  17. Ma, P.; Wang, J.; Li, H. Numerical analysis of pressure pulsation for a bidirectional pump under positive and reverse operation. Adv. Mech. Eng. 2014, 6, 730280. [Google Scholar] [CrossRef] [Green Version]
  18. Ma, P.; Wang, J. An analysis on the flow characteristics of bi-directional axial-flow pump under reverse operation. Proc. Inst. Mech. Eng. Part A J. Power Energy 2017, 231, 239–249. [Google Scholar] [CrossRef]
  19. Baofeng, T.; Kai, Z.; Jun, H. Investigation on performance of compressor cascade with tubercle leading edge blade. Int. J. Turbo Jet-Engines 2020, 37, 295–303. [Google Scholar] [CrossRef]
  20. Shi, L.; Fu, L.; Xia, Y.; Tang, F.; Sun, D.; Zhai, L. Influence of Maximum Airfoil Camber Position on Hydraulic Performance of Axial-flow Pump. Trans. Chin. Soc. Agric. Mach. 2018, 49, 148–154. [Google Scholar]
  21. Medic, G.; Zhang, V.; Wang, G.; Joo, J.; Sharma, O.P. Prediction of transition and losses in compressor cascades using large-eddy simulation. J. Turbomach. 2016, 138, 121001. [Google Scholar] [CrossRef]
  22. Lieblein, S. Incidence and deviation-angle correlations for compressor cascades. J. Basic Eng. 1960, 82, 575–584. [Google Scholar] [CrossRef]
  23. Zhang, F.; Appiah, D.; Hong, F.; Zhang, J.; Yuan, S.; Adu-Poku, K.A.; Wei, X. Energy loss evaluation in a side channel pump under different wrapping angles using entropy production method. Int. Commun. Heat Mass Transf. 2020, 113, 104526. [Google Scholar] [CrossRef]
  24. Shi, L.; Zhu, J.; Tang, F.; Wang, C. Multi-Disciplinary optimization design of axial-flow pump impellers based on the approximation model. Energies 2020, 13, 779. [Google Scholar] [CrossRef] [Green Version]
  25. Wang, Y.; Zhang, W.; Huang, D.; Jiang, S.; Chen, Y. Numerical Study on Vortex Structures and Loss Characteristics in a Transonic Turbine with Various Squealer Tips. Energies 2022, 15, 1018. [Google Scholar] [CrossRef]
  26. Mai, T.D.; Ryu, J. Effects of Damaged Rotor Blades on the Aerodynamic Behavior and Heat-Transfer Characteristics of High-Pressure Gas Turbines. Mathematics 2021, 9, 627. [Google Scholar] [CrossRef]
  27. Liu, Y.; Tan, L. Tip clearance on pressure fluctuation intensity and vortex characteristic of a mixed flow pump as turbine at pump mode. Renew. Energy 2018, 129, 606–615. [Google Scholar] [CrossRef]
Figure 1. (a) Meridional contour and (b) blade profile of bidirectional axial-flow impeller.
Processes 10 00468 g001
Figure 2. Design diagram of bidirectional impeller based on NACA 65 airfoil.
Processes 10 00468 g002
Figure 3. The airfoil of three camber cases.
Processes 10 00468 g003
Figure 4. Three-dimensional modeling of original case.
Processes 10 00468 g004
Figure 5. The hexahedral mesh.
Processes 10 00468 g005
Figure 6. Grid independence analysis under (a) forward condition and (b) reverse condition.
Processes 10 00468 g006
Figure 7. The Yplus distribution of computational domain.
Processes 10 00468 g007
Figure 8. The structure of test bench. (1: high-pressure tank, 2: bidirectional axial-flow pump, 3: low-pressure tank, 4: valve, 5: valve, 6: valve).
Processes 10 00468 g008
Figure 9. Comparison of CFD and experiment (EXP) results of original case under (a) forward and (b) reverse condition.
Processes 10 00468 g009
Figure 10. The pump performance of three airfoil cambers under (a) forward and (b) reverse condition.
Processes 10 00468 g010
Figure 11. The distribution of PFI in the passage of impeller and guide vanes under (a) 0.7 Qdes, (b) 1.0 Qdes and (c) 1.15 Qdes. (Span = 0.5).
Processes 10 00468 g011aProcesses 10 00468 g011b
Figure 12. The distribution of PFI in the passage of impeller and guide vanes under (a) 0.7 Qdes, (b) 1.0 Qdes and (c) 1.15 Qdes. (Span = 0.5).
Processes 10 00468 g012aProcesses 10 00468 g012b
Figure 13. The distribution of PFI on (a) suction side and (b) pressure side of three kinds of blade under forward condition.
Processes 10 00468 g013
Figure 14. The distribution of PFI on (a) suction side and (b) pressure side of three kinds of blade under reverse condition.
Processes 10 00468 g014
Figure 15. The position of monitoring points.
Processes 10 00468 g015
Figure 16. The distribution of PFI on A1, A2, A3 of three cases under (a) forward condition and (b) reverse condition.
Processes 10 00468 g016
Figure 17. The distribution of PFI on B1, B2, B3 of three cases under (a) forward condition and (b) reverse condition.
Processes 10 00468 g017
Figure 18. The time domain of pressure signal on A1 of three cases under (a) forward condition and (b) reverse condition.
Processes 10 00468 g018aProcesses 10 00468 g018b
Figure 19. The time domain of pressure signal on B1 of three cases under (a) forward and (b) reverse conditions.
Processes 10 00468 g019aProcesses 10 00468 g019b
Figure 20. The frequency domain of pressure signal on A1 of three cases under (a) forward and (b) reverse conditions.
Processes 10 00468 g020aProcesses 10 00468 g020b
Figure 21. The frequency domain of pressure signal on B1 of three cases under (a) forward condition and (b) reverse condition.
Processes 10 00468 g021aProcesses 10 00468 g021b
Table 1. Distribution of airfoil camber angle on different radius sections.
Airfoil Case Φ 1 Φ 2 Φ 3 Φ 4 Φ 5
Case A18151296
Original case7.65.83.920.2
Case B00000
Table 2. Main geometry and design parameters of Original case.
ParameterUnitValue
Forward design flow ratem3/s0.34
Reverse design flow ratem3/s0.28
Rotation speedr/min1350
Number of impeller blades-3
Impeller diametermm300
Hub diameter of impellermm120
Tip clearance radiusmm0.2
Number of guide vane-5
Hub diameter of guide vanesmm108
Table 3. Main parameters of boundary condition for transient calculation.
ParametersValue
Time step0.00037037 s
Total time0.5333 s
Roughness of impeller0.0125 mm
Roughness of guide vanes0.0125 mm
Roughness of straight pipe0.05 mm
Roughness of elbow0.05 mm
Maximum number of coefficient loops10
Residual target of convergence criteria0.0001
Publisher’s Note: MDPI stays neutral with regard to jurisdictional claims in published maps and institutional affiliations.

