
Enabling Total Process Digital Twin in Sugar Refining through the Integration of Secondary Crystallization Influences

Abstract
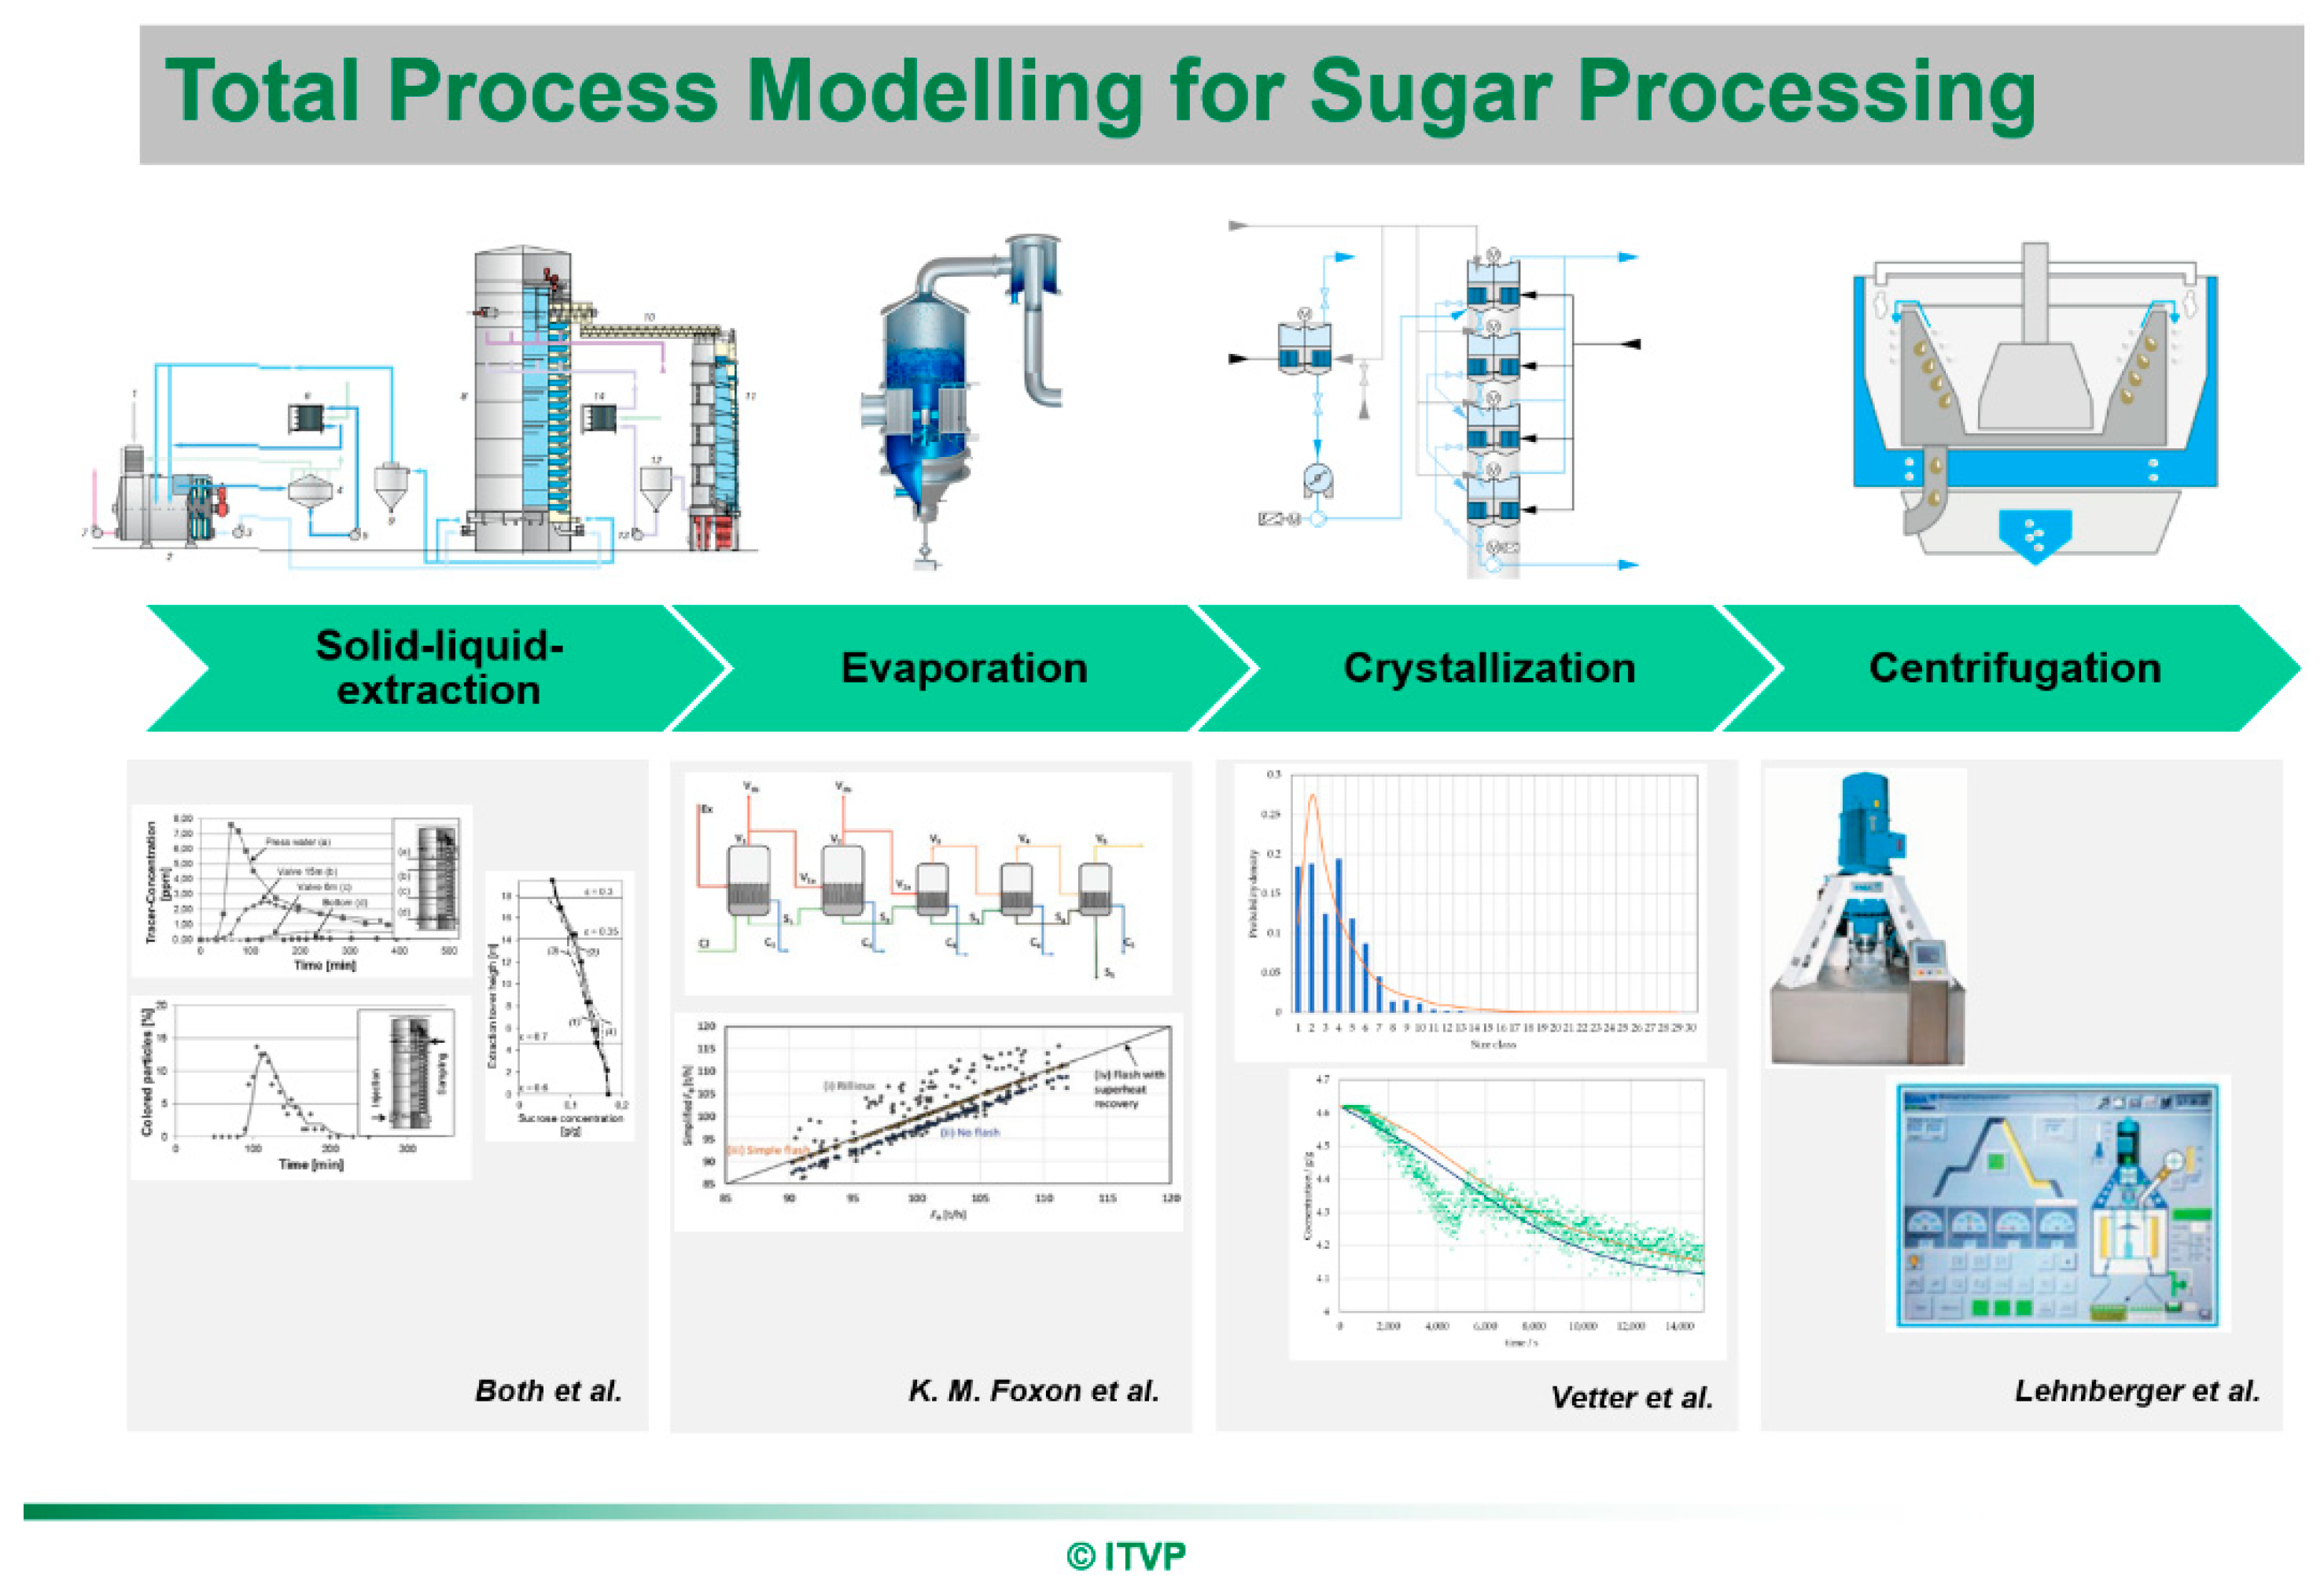
:1. Introduction
2. Materials and Methods
2.1. Materials
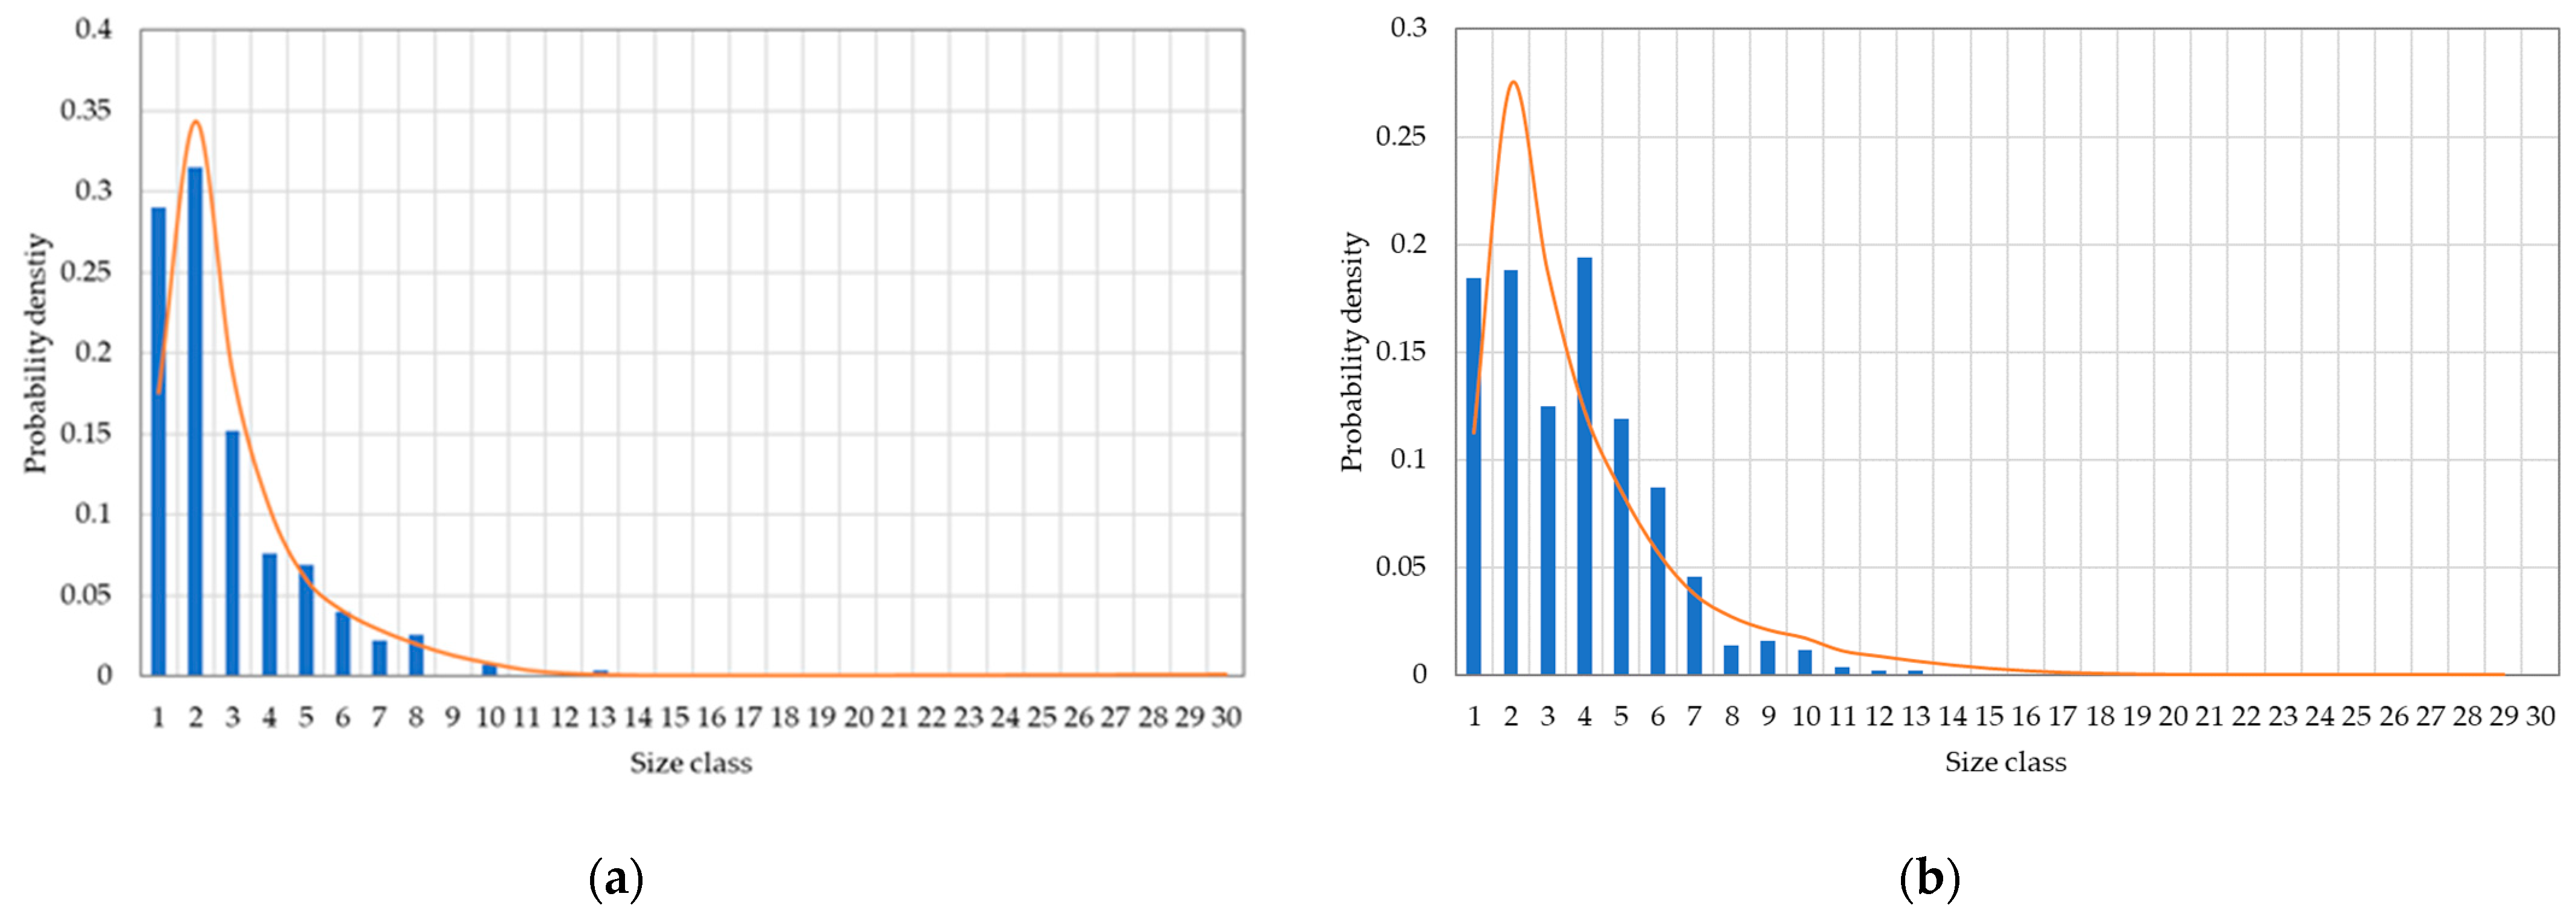
2.2. Size Distribution
2.3. Crystallization
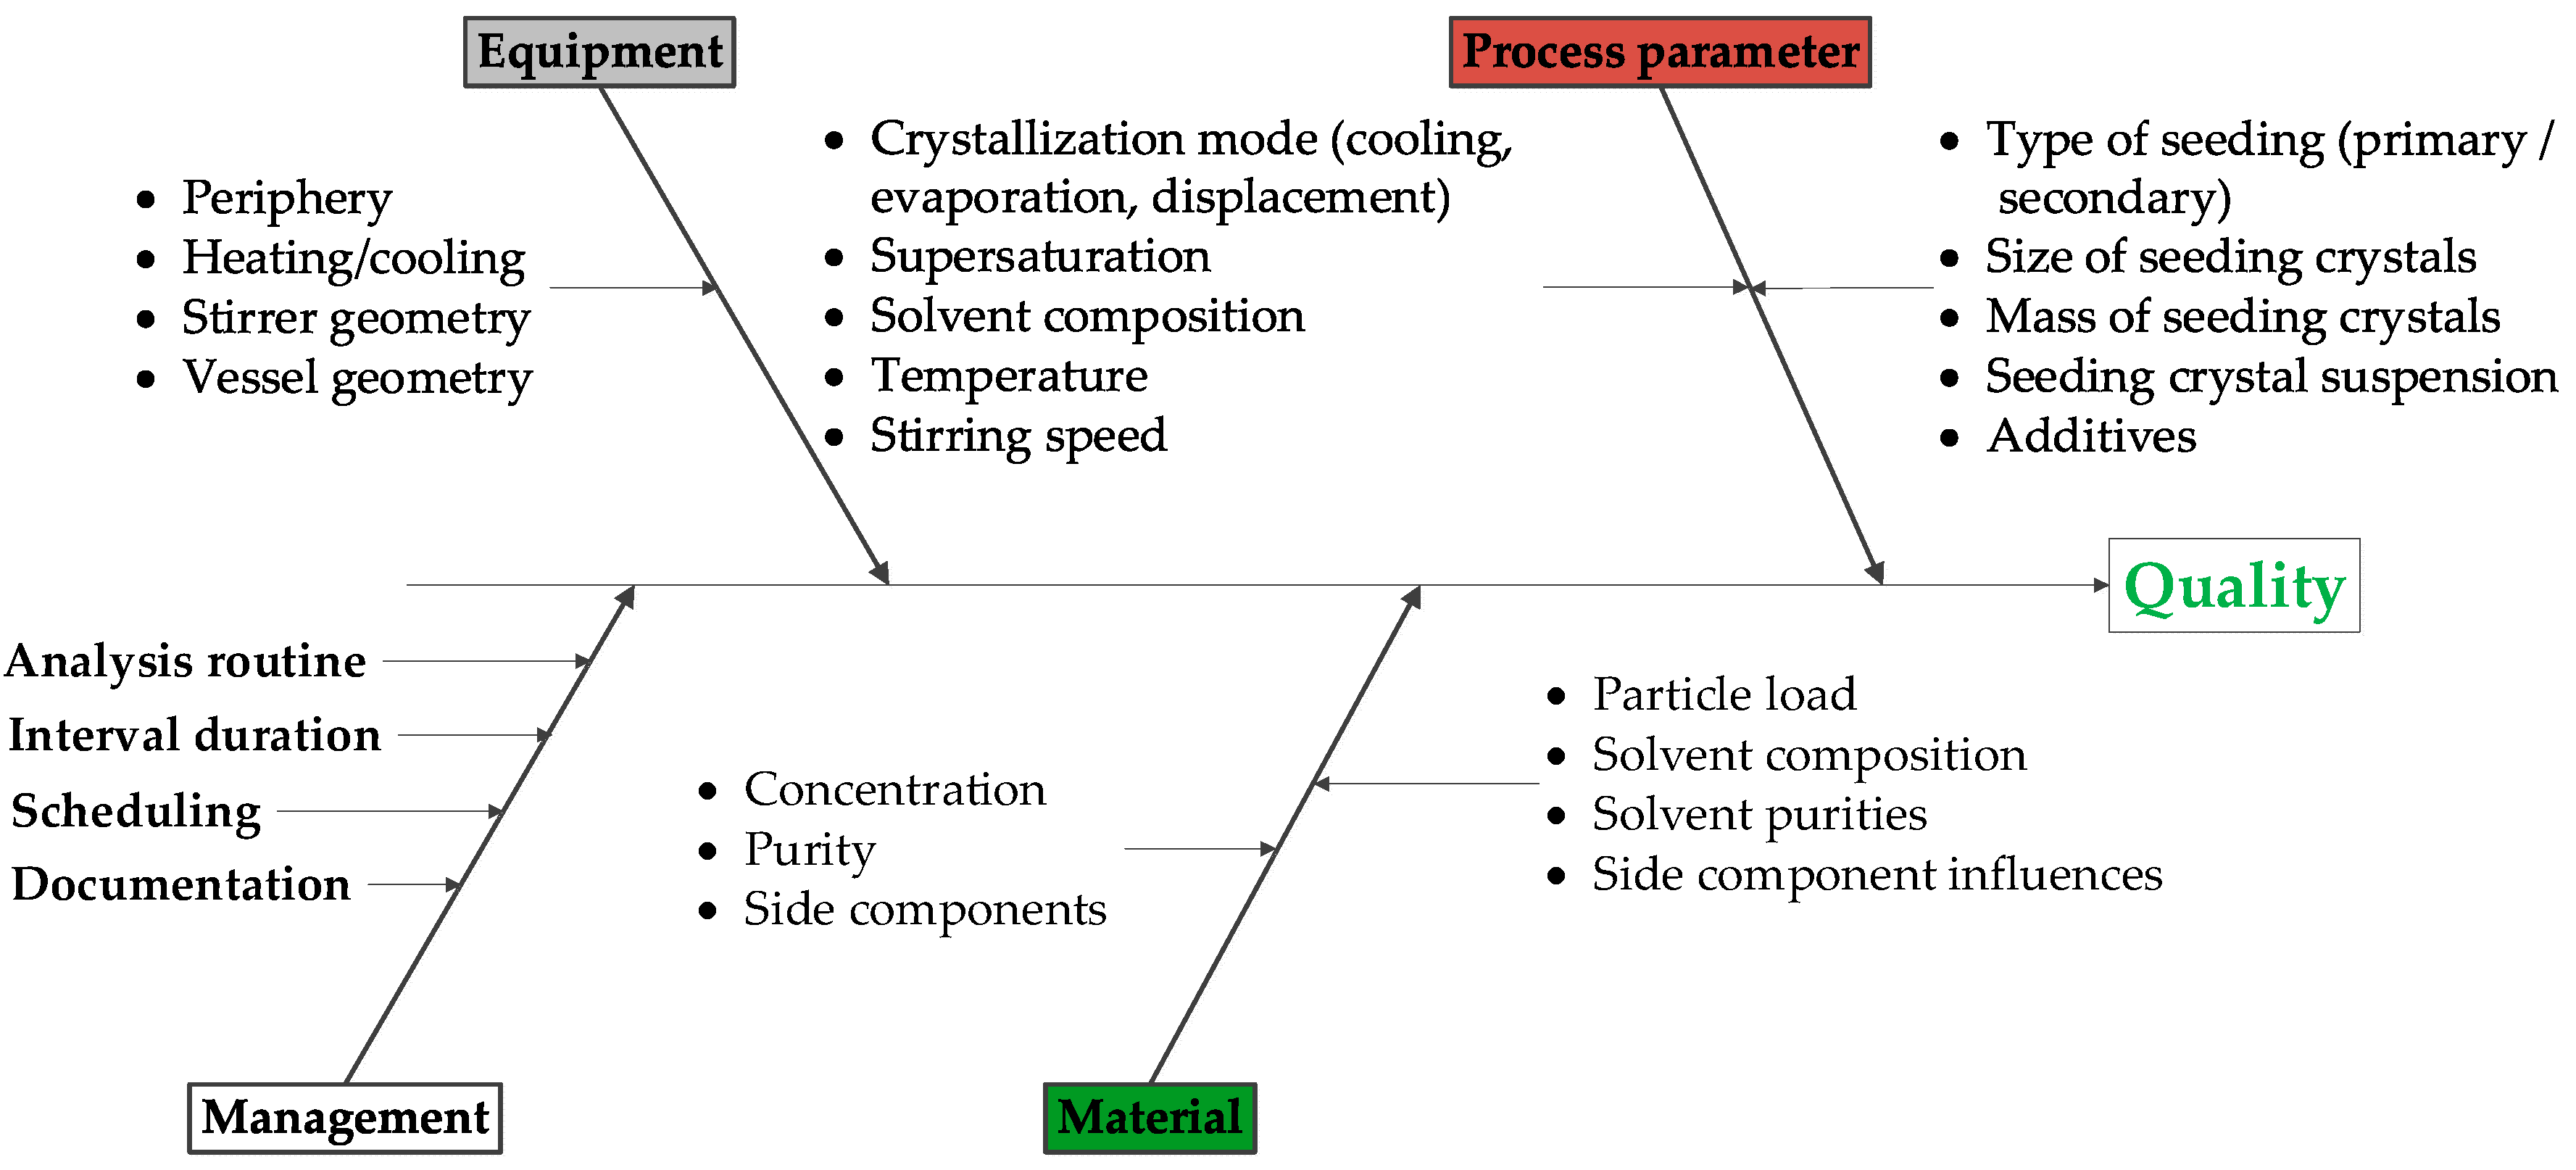
2.4. Design of Experiments (DoE)
2.5. Modeling of Crystallization
2.6. Parameter Determination and Model Solution
3. Results
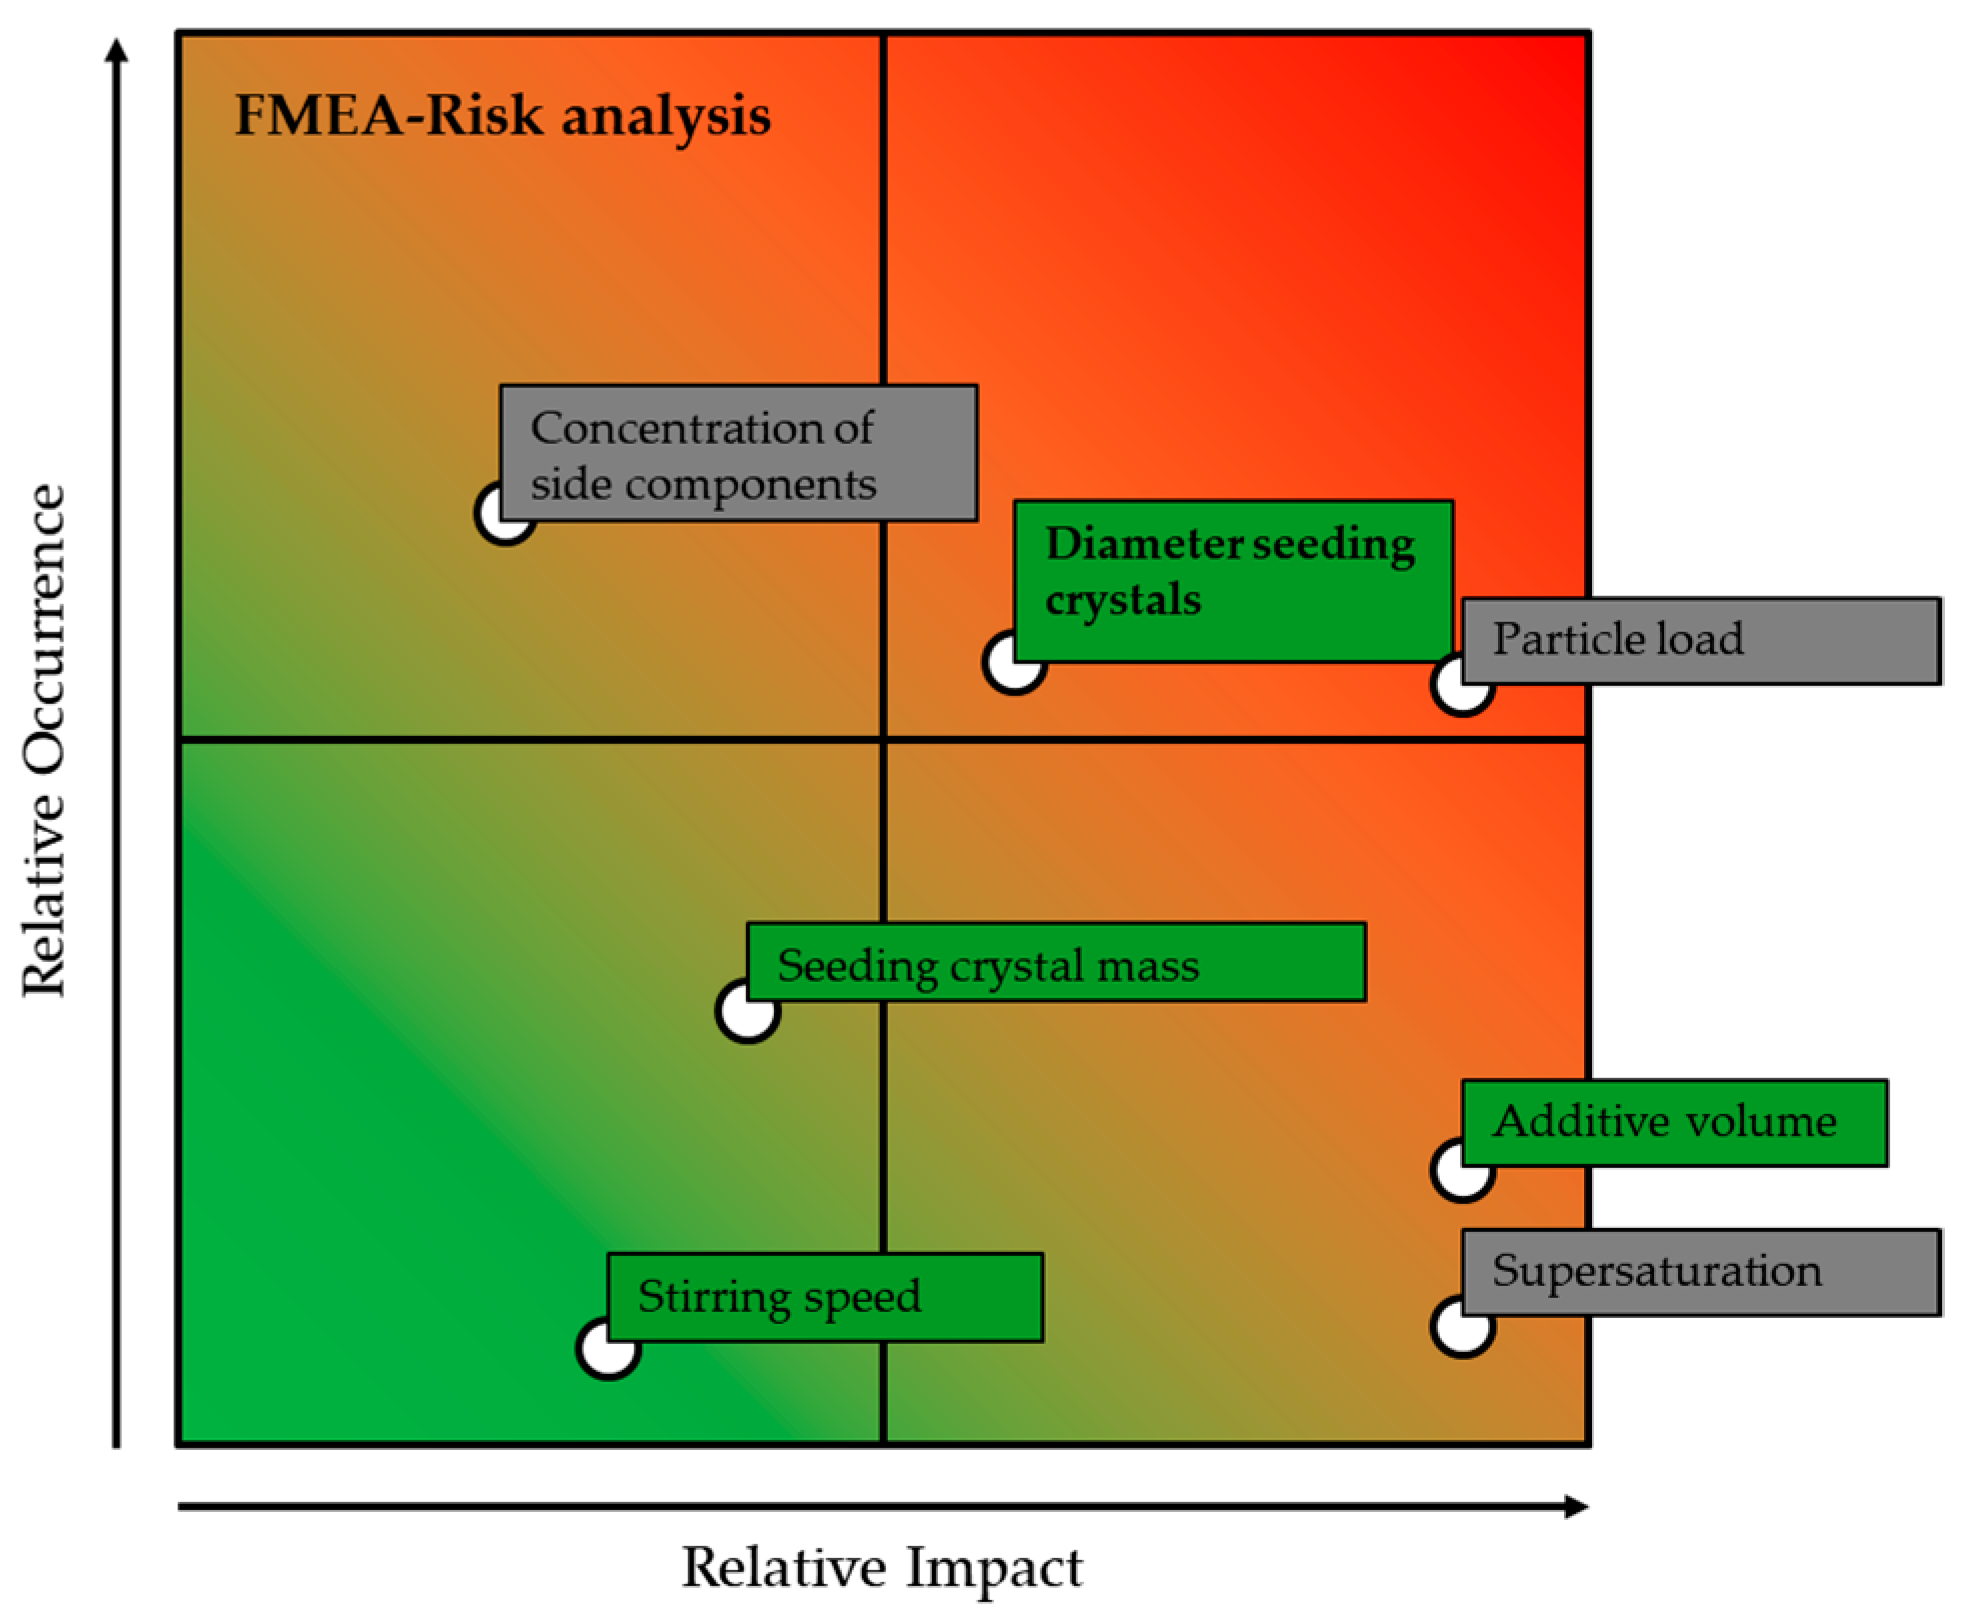
3.1. Design of Experiments
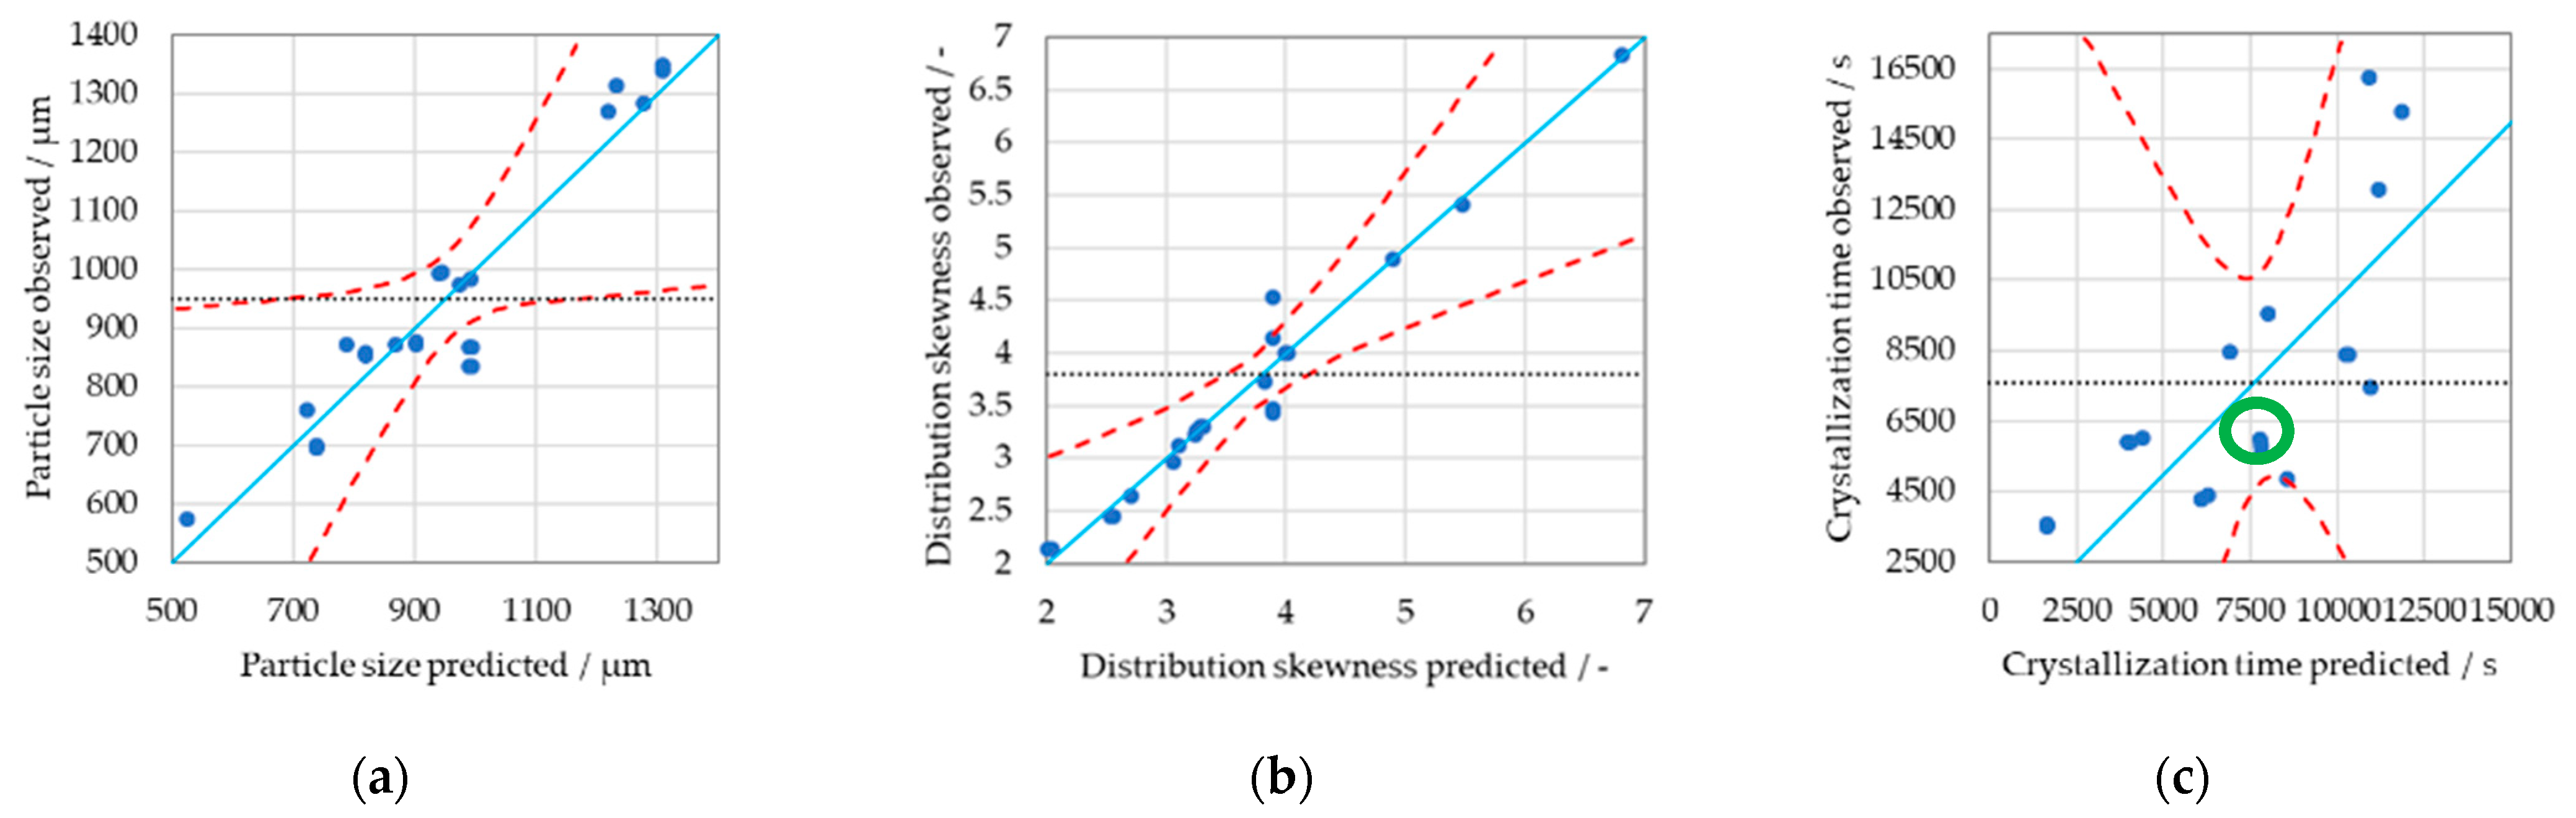
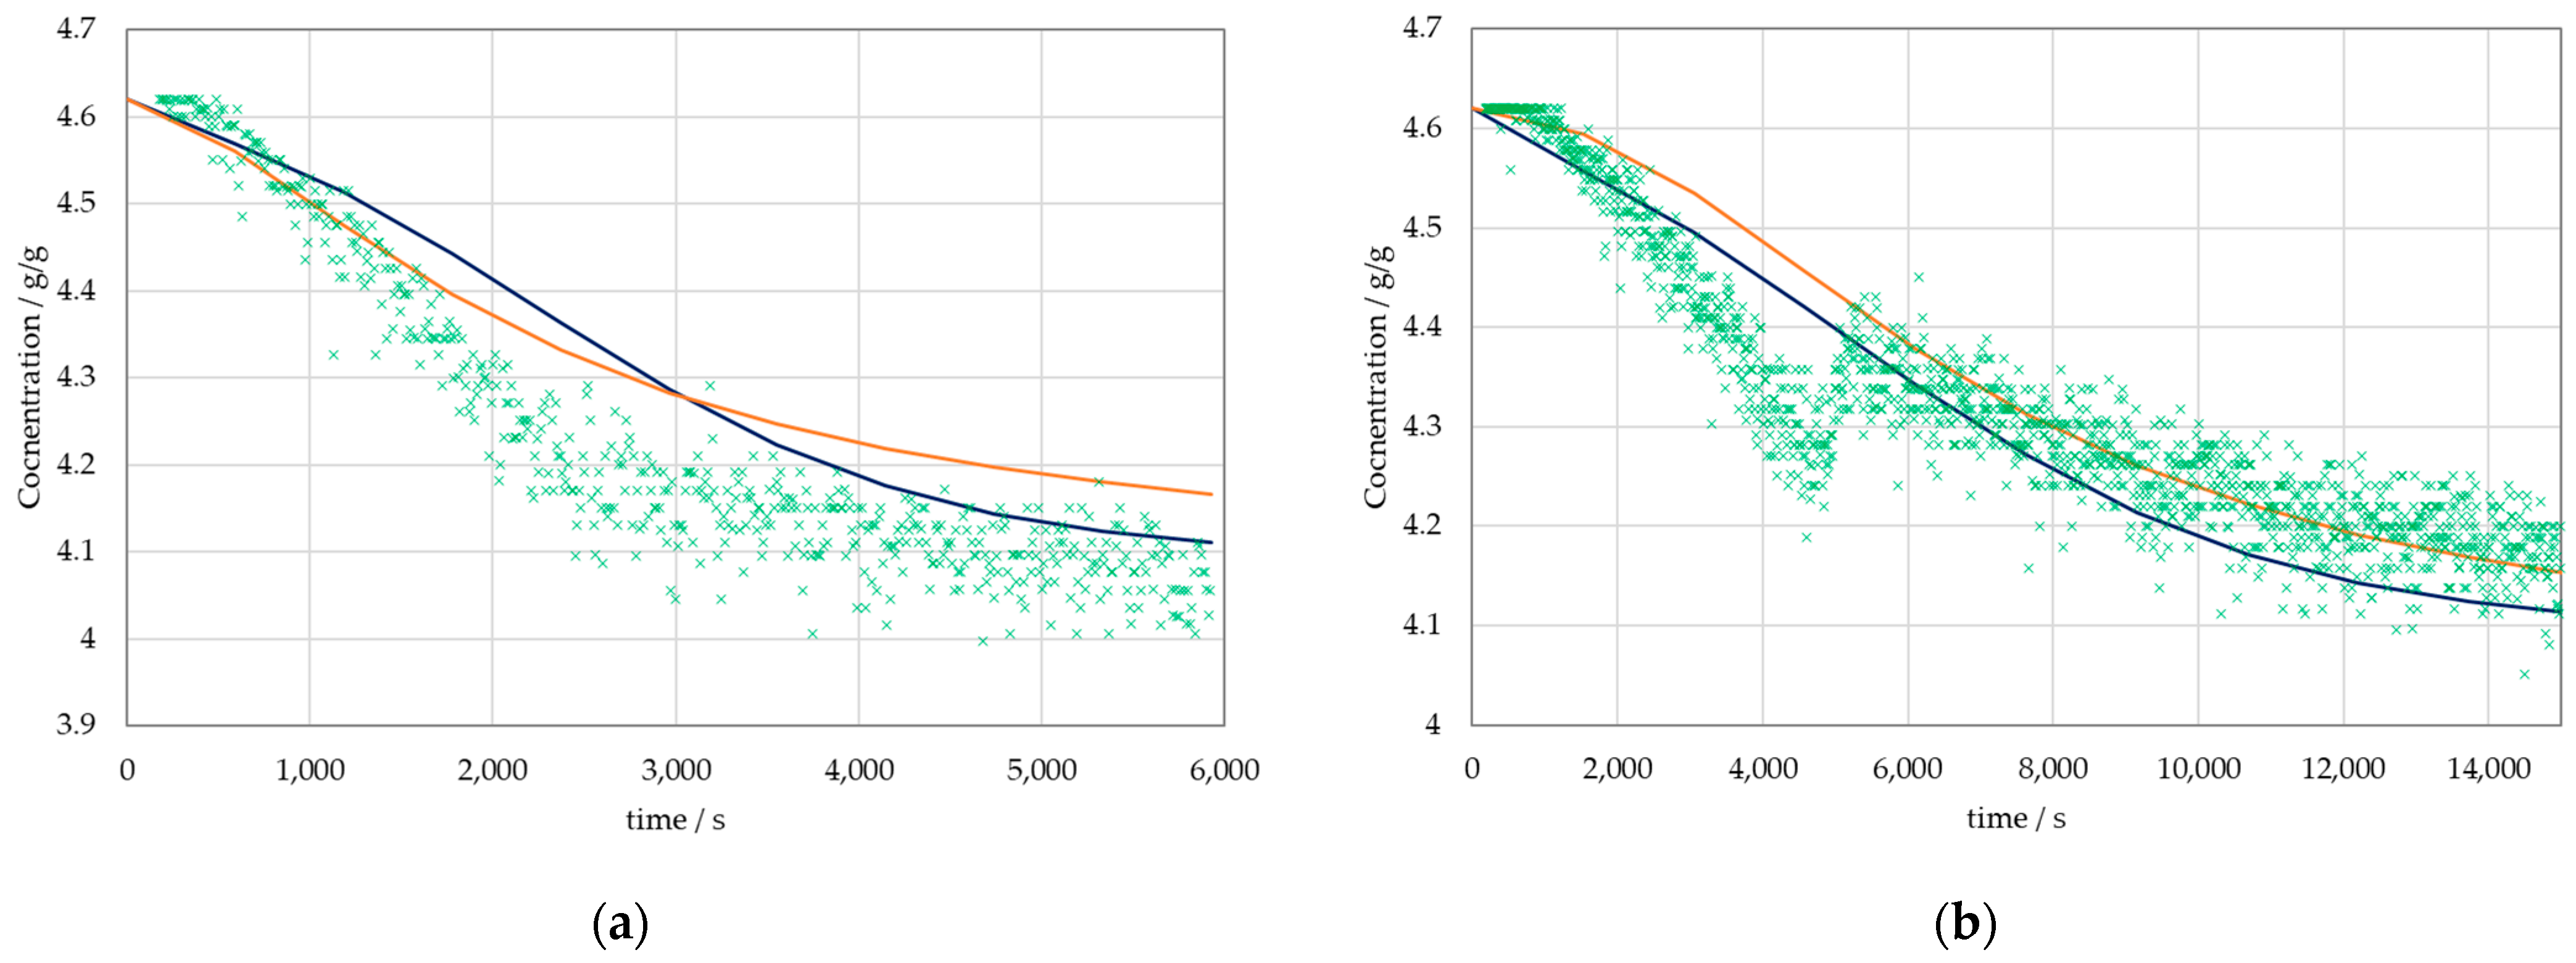
3.2. Results of the Physico-Chemical Model
4. Discussion
Author Contributions
Funding
Data Availability Statement
Acknowledgments
Conflicts of Interest
References
- McCabe, W.L.; Smith, J.C.; Harriott, P. Unit Operations of Chemical Engineering, 7th ed.; McGraw-Hill Higher Education: Boston, MA, USA, 2005; ISBN 0-07-284823-5. [Google Scholar]
- SUSlick, K.S. Kirk-Othmer Encyclopedia of Chemical Technology; Wiley: New York, NY, USA, 2013; ISBN 9780471238966. [Google Scholar]
- Lambert, C.; Laulan, B.; Decloux, M.; Romdhana, H.; Courtois, F. Simulation of a sugar beet factory using a chemical engineering software (ProSimPlus®) to perform Pinch and exergy analysis. J. Food Eng. 2018, 225, 1–11. [Google Scholar] [CrossRef]
- Mazaeda, R.; Merino, A.; de Prada, C.; Acebes, F. Hybrid modelling of batch centrifuges as part of a generic object oriented beet Sugar Mill library. Simul. Model. Pract. Theory 2012, 22, 123–145. [Google Scholar] [CrossRef]
- Gleiss, M.; Hammerich, S.; Kespe, M.; Nirschl, H. Development of a Dynamic Process Model for the Mechanical Fluid Separation in Decanter Centrifuges. Chem. Eng. Technol. 2018, 41, 19–26. [Google Scholar] [CrossRef] [Green Version]
- Kelly, F.H.C. Raw Sugar Quality; Congress of International Society of Sugar Cane Technologists: Durban, South Africa, 1974. [Google Scholar]
- Ditz, R.; Gerard, D.; Hagels, H.; Igl, N.; Schäffler, M.; Schulz, H.; Stürtz, M.; Tegtmeier, M.; Treutwein, J.; Strube, J. Proposal towards a New Comprehensive Research Focus: Position Paper of the ProcessNet-Subject Division Plant Based Extracts—Products and Processes and the European Working Group on Phytoextracts—Products and Processes; DECHEMA: Frankfurt, Germany, 2017. [Google Scholar]
- Huter, M.; Schmidt, A.; Mestmäcker, F.; Sixt, M.; Strube, J. Systematic and Model-Assisted Process Design for the Extraction and Purification of Artemisinin from Artemisia annua L.—Part IV: Crystallization. Processes 2018, 6, 181. [Google Scholar] [CrossRef] [Green Version]
- Both, S.; Eggersglüß, J.; Lehnberger, A.; Schulz, T.; Schulze, T.; Strube, J. Optimizing Established Processes like Sugar Extraction from Sugar Beets—Design of Experiments versus Physicochemical Modeling. Chem. Eng. Technol. 2013, 36, 2125–2136. [Google Scholar] [CrossRef]
- Soares, R.M.; Câmara, M.M.; Feital, T.; Pinto, J.C. Digital Twin for Monitoring of Industrial Multi-Effect Evaporation. Processes 2019, 7, 537. [Google Scholar] [CrossRef] [Green Version]
- Foxon, K.M. An evaporator station model for estimating exhaust steam conversion and consumption. In ISJ's World Sugar Yearbook; 2021; pp. 20–31. Available online: https://internationalsugarjournal.com/paper-author/km-foxon/ (accessed on 10 February 2022).
- Lehnberger, A. IIoT for batch centrifugals—Initial results. In ISJ's World Sugar Yearbook; 2021; pp. 86–90. Available online: https://internationalsugarjournal.com/paper/iiot-for-batch-centrifugals-initial-results/ (accessed on 10 February 2022).
- Mersmann, A.; Braun, B.; Löffelmann, M. Prediction of crystallization coefficients of the population balance. Chem. Eng. Sci. 2002, 57, 4267–4275. [Google Scholar] [CrossRef]
- David, R.; Marchal, P.; Marcant, B. Modelling of agglomeration in industrial crystallization from solution. Chem. Eng. Technol. 1995, 18, 302–309. [Google Scholar] [CrossRef]
- Schmok, K. Modelling of mechanism of agglomeration of KCl crystallization. Cryst. Res. Technol. 1988, 23, 967–972. [Google Scholar] [CrossRef]
- Laloue, N.; Couenne, F.; Le Gorrec, Y.; Kohl, M.; Tanguy, D.; Tayakout-Fayolle, M. Dynamic modeling of a batch crystallization process: A stochastic approach for agglomeration and attrition process. Chem. Eng. Sci. 2007, 62, 6604–6614. [Google Scholar] [CrossRef]
- Codan, L.; Eckstein, C.F.; Mazzotti, M. Growth Kinetics of S—Mandelic Acid in Aqueous Solutions in the Presence of R -Mandelic Acid. Cryst. Growth Des. 2013, 13, 652–663. [Google Scholar] [CrossRef]
- Lucke, M.; Koudous, I.; Sixt, M.; Huter, M.J.; Strube, J. Integrating crystallization with experimental model parameter determination and modeling into conceptual process design for the purification of complex feed mixtures. Chem. Eng. Res. Des. 2018, 133, 264–280. [Google Scholar] [CrossRef]
- Sixt, M.; Uhlenbrock, L.; Strube, J. Toward a Distinct and Quantitative Validation Method for Predictive Process Modelling—On the Example of Solid-Liquid Extraction Processes of Complex Plant Extracts. Processes 2018, 6, 66. [Google Scholar] [CrossRef] [Green Version]
- Kassing, M.; Jenelten, U.; Schenk, J.; Hänsch, R.; Strube, J. Combination of Rigorous and Statistical Modeling for Process Development of Plant-Based Extractions Based on Mass Balances and Biological Aspects. Chem. Eng. Technol. 2012, 35, 109–132. [Google Scholar] [CrossRef]
- Zogg, M. Einführung in Die Mechanische Verfahrenstechnik: Mit 29 Tabellen und 32 Berechnungsbeispielen, 3rd ed.; Überarb, A., Ed.; Teubner: Stuttgart, Germany, 1993; ISBN 3-519-16319-5. [Google Scholar]
- Stieß, M. Verfahrenstechnik in Beispielen; Draxler, J., Siebenhofer, M., Eds.; Springer Fachmedien Wiesbaden: Wiesbaden, Germany, 2014; ISBN 978-3-658-02739-1. [Google Scholar]
- Uhlenbrock, L.; Jensch, C.; Tegtmeier, M.; Strube, J. Digital Twin for Extraction Process Design and Operation. Processes 2020, 8, 866. [Google Scholar] [CrossRef]
- Huter, M. Modellunterstützte Prozessauslegung Unterschiedlicher Grundoperationen am Beispiel von Kontinuierlicher Ultrafiltration und Absatzweiser Kristallisation. Ph.D. Dissertation, Technische Universität Clausthal, Clausthal-Zellerfeld, Germany, November 2020. [Google Scholar]
- Hofmann, G. Kristallisation in der Industriellen Praxis; Wiley-VCH: Hoboken, NJ, USA, 2007; ISBN 9783527608881. [Google Scholar]
- Schuchmann, H.; Szembek, M.; Grüneberg, M.; Schubert, H. Einfluss von Partikeleigenschaften und Prozessparameter auf das Strahlagglomerieren von Getränkepulvern. LWT Food Sci. Technol. 1994, 27, 350–357. [Google Scholar] [CrossRef]
- Ramkrishna, D. Population Balances: Theory and Applications to Particulate Systems in Engineering; Academic Press: San Diego, CA, USA, 2000; ISBN 978-0-12-576970-9. [Google Scholar]
- Bergs, T.; Gierlings, S.; Auerbach, T.; Klink, A.; Schraknepper, D.; Augspurger, T. The Concept of Digital Twin and Digital Shadow in Manufacturing. Procedia CIRP 2021, 101, 81–84. [Google Scholar] [CrossRef]


| Parameter | Lower Limit | Upper Limit |
|---|---|---|
| Term | Parameter | Std.-Error | t-Value | Prob > |t| | |
|---|---|---|---|---|---|
| Additive volume | 0.816514 | 0.122635 | 6.66 | 0.0012 * |  |
| Diameter seeding crystals (SC) | 0.768486 | 0.122635 | 6.27 | 0.0015 * | |
| Mass SC * Diameter SC | −0.76224 | 0.122635 | −6.22 | 0.0016 * | |
| RPM * additive volume | 0.494736 | 0.122635 | 4.03 | 0.0100 * | |
| Mass SC | −0.38546 | 0.110978 | −3.47 | 0.0178 * | |
| RPM * mass SC | 0.345264 | 0.122635 | 2.82 | 0.0373 * | |
| Additive volume * diameter SC | 0.317236 | 0.122635 | 2.59 | 0.0490 * | |
| Additive volume * Mass SC | 0.089736 | 0.122635 | 0.73 | 0.4972 | |
| RPM | −0.07651 | 0.122635 | −0.62 | 0.56 | |
| RPM * diameter SC | −0.02724 | 0.122635 | −0.22 | 0.833 |
| Term | Parameter | Std.-Error | t-Value | Prob > |t| | |
|---|---|---|---|---|---|
| Diameter Seeding crystals (SC) | 166.9049 | 37.74014 | 4.42 | 0.0069 * |  |
| Additive volume * Diameter SC | 151.0299 | 37.74014 | 4 | 0.0103 * | |
| Mass SC | −95.2148 | 34.15285 | −2.79 | 0.0385 * | |
| RPM * Mass SC | −99.2799 | 37.74014 | −2.63 | 0.0465 * | |
| Additive Volume | 81.84507 | 37.74014 | 2.17 | 0.0823 | |
| RPM * Diameter SC | 76.22007 | 37.74014 | 2.02 | 0.0994 | |
| RPM | 66.90493 | 37.74014 | 1.77 | 0.1365 | |
| Additive volume * Mass SC | −31.7201 | 37.74014 | −0.84 | 0.4390 | |
| Mass SC * Diameter SC | −2.02993 | 37.74014 | −0.05 | 0.9592 | |
| RPM * Additive Volume | 1.77993 | 37.74014 | 0.05 | 0.9642 |
| Parameter | Value 0 mL | Value 1 mL | Value 2 mL |
|---|---|---|---|
| Λ | |||
| Value 0 mL | Value 1 mL | Value 2 mL | |
|---|---|---|---|
| RMSE | |||
| F-test |
Publisher’s Note: MDPI stays neutral with regard to jurisdictional claims in published maps and institutional affiliations. |
© 2022 by the authors. Licensee MDPI, Basel, Switzerland. This article is an open access article distributed under the terms and conditions of the Creative Commons Attribution (CC BY) license (https://creativecommons.org/licenses/by/4.0/).
Share and Cite
Vetter, F.L.; Strube, J. Enabling Total Process Digital Twin in Sugar Refining through the Integration of Secondary Crystallization Influences. Processes 2022, 10, 373. https://doi.org/10.3390/pr10020373
Vetter FL, Strube J. Enabling Total Process Digital Twin in Sugar Refining through the Integration of Secondary Crystallization Influences. Processes. 2022; 10(2):373. https://doi.org/10.3390/pr10020373
Chicago/Turabian StyleVetter, Florian Lukas, and Jochen Strube. 2022. "Enabling Total Process Digital Twin in Sugar Refining through the Integration of Secondary Crystallization Influences" Processes 10, no. 2: 373. https://doi.org/10.3390/pr10020373