Article

Effects of Novel Extraction Strategies on the Recovery of Phenolic Compounds and Associated Antioxidant Properties from Buckwheat Hull (Fagopyrum esculentum)

1
Department of Food Chemistry & Technology, Teagasc Food Research Centre, Ashtown, D15 DY05 Dublin, Ireland
2
School of Biosystems and Food Engineering, University College Dublin, Belfield, D04 V1W8 Dublin, Ireland
3
Moylish Park Campus, The Technological University of the Shannon: Midlands Midwest, V94 EC5T Limerick, Ireland
*
Author to whom correspondence should be addressed.
Processes 2022, 10(2), 365; https://doi.org/10.3390/pr10020365
Submission received: 23 December 2021 / Revised: 3 February 2022 / Accepted: 5 February 2022 / Published: 14 February 2022
(This article belongs to the Special Issue Phenolic Profiling and Antioxidant Capacity in Agrifood Products)

Abstract

:
This study investigated the effects of novel extraction technologies, including ultrasound-assisted extraction (UAE), microwave-assisted extraction (MAE), pulsed electric field (PEF), high-pressure processing (HPP), enzyme-assisted extraction (EAE), and conventional extraction, on the recovery of phenolic compounds and associated antioxidant properties from buckwheat hull (Fagopyrum esculentum). Initially, twenty-four extraction strategies were investigated. Based on the results of the total phenolic content and antioxidant properties (DPPH and FRAP), twelve strategies (i.e., US (n = 2), PEF (n = 1), MW (n = 4), HPP (n = 4), and a control method) were selected for phenolic profiling carried out using liquid chromatography-mass spectrometry (LC-MS). Forty-one phenolic compounds were identified in the extracts, and a scanning electron microscope (SEM) analysis was also carried out on the treated residues to analyze the surface damage post-treatments. The results showed that samples treated with US (16.14 ± 0.06), PEF (9.94 ± 0.02), MW (12.63 ± 0.13), and HPP (21.76 ± 0.78) contained the highest total phenolic content (mg GAE/100 mg of DW). In the case of the antioxidant activities, the highest DPPH activities were obtained using HPP, MAE, and UAE, while no clear pattern was recorded in the case of FRAP activities. The highest DPPH and FRAP activities observed were 80.91 ± 0.22% and 23.98 ± 0.2 mg Trolox equivalents/100 mg, respectively. Additionally, the LC-MS results identified eleven different groups of phenolic compounds in buckwheat hull extracts, including anthocyanin, flavanol, flavanones, flavones, flavonol, phenolic acids, isoflavones, lignans, and quinones.

1. Introduction

Buckwheat is the most ideal gluten-free pseudo-cereal natively grown in Northern China with a nutritional content higher than that of wheat or rice grain [1]. It belongs to the Polygonaceae family, and the two most cultivated species are Fagopyrum esculentum and Fagopyrum tataricum. Buckwheat grains are dehulled and processed into groats and flour before human consumption [2]. During the dehulling process, a significant amount of hull is generated as a byproduct of buckwheat processing [3]. These hulls are rich in proteins (5.13–5.68%), fats (0.50–0.81%), minerals (1.88–2.06%), starch (0.15–2.26%), and carbohydrates (91.72–92.19%) [4]. They also contain a plethora of bioactive compounds—specifically, phenolic groups, including anthocyanin, flavanol, flavanones, flavones flavonols, phenolic acid, etc. In addition its antioxidant level is three-fold higher (63.20–66.50 μmol Trolox/g) than barley, triticale bran, and dehusked oats [5]. Thus, buckwheat hull is considered an excellent source of phenolic and antioxidant compounds. It also possesses a higher phenolic content (434–525 mg chlorogenic acid/100 g) and antioxidant properties compared to buckwheat groats; however, limited extraction studies have been reported on buckwheat hull [4,6,7,8].
Buckwheat hulls have been used as pillow fillers; however, due to their significant levels of bioactive compounds and their bioactivities, including antidiabetic, antioxidant, antitumor, anticancer, and anti-inflammation, they are increasingly employed in nutraceutical and pharmaceutical applications [9,10]. Due to their antimicrobial properties, they are used as a natural preservative in food formulations [11]. Flavonoids extracted from buckwheat hulls have been used to breakdown advanced glycation end-products, thereby improving the diabetic nephropathy [12]. Similarly, in another study [13], it was reported that flavonoids extracted from the buckwheat hull can be used to treat diabetes. They also lower the level of TG, TC, vLDL-c, and FFA in the serum and both TG and TC levels in the liver [13]. Another study investigated the antioxidative and antiglycation activity of buckwheat hull tea infusion [14].
Several conventional extraction strategies have been employed to extract bioactive compounds from plant samples. However, these strategies have several drawbacks, including high energy consumption, long extraction times, and low extraction yields. To address these limitations, novel extraction strategies, including UAE, MAE, PEF, HPP, and EAE, have been investigated and combined with organic solvents for the extraction of bioactive compounds from plant matrices. Organic solvents used for extraction include ethanol, acetone, methanol, and water as they play a major role in enhancing extraction yields from a particular plant matrix depend on the bioactive targeted [9]. Post-extraction treatment soluble solids are extracted from the solvent while the residue can be sustainably used as animal feed or fertilizer.
The application of novel extraction strategies improves the extraction yield and reduces the treatment time. Limited studies have been published on the application of novel strategies for extraction of phenolic compounds from buckwheat hull, except for an ultrasonication method combined with eutectic solvents for the extraction of rutin from a buckwheat hull, where a 9.5-mg/g rutin extraction with a 95% extraction efficiency was reported [15]. In another study, quercetin and kaempferol were extracted and isolated from buckwheat hull using organic solvent extraction methods, however the reported extraction yield was low [16]. This study investigated the effects of novel extraction strategies on the recovery of phenolic compounds from buckwheat hull.

2. Material and Methods

2.1. Buckwheat Hull

Buckwheat hulls were procured in February 2021 by a private grain processing company in Novisad, Serbia. Samples were stored at −20 °C in Teagasc Food Research Centre, Ashtown, Ireland prior to extraction.

2.2. Chemicals and Solvents

All standards, reagents, and chemicals, including gallic acid (purity 99%) 6-hydroxy-2,5,7,8-tetramethylchromane-2-carboxylic acid (Trolox), 1,1-diphenyl-2-picryl-hydrazyl (DPPH), Folin–Ciocalteau reagent, Ferric chloride, aluminum chloride, sodium nitrite, sodium carbonate, sodium hydroxide, and HPLC grade solvents (ethanol and methanol), were purchased from Sigma-Aldrich Chemical Co. (Steinheim, Germany).

2.3. Extraction Procedures

Extractions were initiated as reported in a published method [17], with minor modifications. Initially, buckwheat hull samples were cleaned to remove dust, dirt, and stone grits. Samples were rehydrated with distilled water at a dilution ratio of 1:20 w/v to facilitate recovery of phenolic compounds. After rehydration, samples were placed in a shaker (Thermo Fisher Scientific MAXQ6000, Thermo Fisher Scientific, Life Technology Ltd., London, UK) for 30 min at 160 rpm at 22 °C before extraction. The rehydrated samples were then subjected to the conventional and novel extraction strategies, as illustrated in Figure 1. All extraction procedures were carried out in duplicate with two repetitions (n = 4). Distilled water was employed in all extraction procedures.

2.3.1. Novel Extraction Procedures

Twenty-one extraction protocols were developed employing novel extraction procedures, including six UAE conditions using an UIP500 hdT ultrasonic probe (500 W, 20 kHz, Hielscher Ultrasound technology, Teltow, Germany) at a sonication amplitude of 100% for two time durations (10 and 30 min) at three temperatures (4 °C, 40 °C, and 22 °C). For MAE, a microwave oven (Panasonic NN-CF778S0, Bracknell, UK; 2450 MHz) at low power (LP) and high power (HP) (250 and 1000 W) for two different time durations (i.e., 10 and 60 s) were employed [18]. In the case of PEF extraction, four different treatments were carried out using a 5-kW HVP ELCRACK 5 (DIL, Quakenbrück, Germany) unit the operating in batch mode. PEF equipment was set to generate electric pulses of near rectangular shape at a 200-Hz frequency at 10 kJ of energy input. The electric pulses were applied in a parallel plate treatment chamber of 16 cm2, consisting of two stainless steel parallel electrodes (4 × 4 cm). Combinations of two electrode voltages (12 and 24 kV), which resulted in electric strengths of 3–6 kV/cm at two pulse width settings (5 and 9 μs), were used. All the treatments were carried out at 22 °C, and post-treatment, a temperature rise of 2 to 3 °C was observed. Four HPP extraction protocols were carried out at HPP Tolling Facility (Dublin, Ireland) using an 200-L Hiperbaric HPP (Hiperbaric, Burgos, Spain) at two pressure levels: 200 and 400 MPa, along with two time durations (4 and 8 min). EAE was carried out using three different enzymes, including β-glucosidase (2%, 4 h, 50 °C, 4–7 pH), Viscozyme (7.5%, 60 °C, 5.2 pH) and Cellulase (0.7%, 75 min, 55 °C, 5.3 pH). Control samples were subjected to 160 rpm for 30 min at 22 °C [19].

2.3.2. Conventional Extraction Procedures

Three different conventional extraction protocols were investigated. Initially, as illustrated in Figure 1, buckwheat hull was rehydrated in 1:20 (5-g BWH in 100-mL distilled water) for 30 min. In the first conventional protocol, samples were subjected to rehydration over 24 h. The second and third conventional protocols included shaking at 160 rpm for 1 h and stirring at 160 rpm for 1 h at 22 °C, respectively.

2.4. Extraction Yield

After the extraction processes, all samples were centrifuged at 10,000× g for 15 min at 4 °C. The supernatants and residues (pellet) were collected separately and freeze-dried. The dried extracts were stored at −20 °C before characterization analysis. The yield of the buckwheat hull extract was calculated as follows:
Yield (%) = W1/W0 × 100%
where W0 is the mass of buckwheat hull (g, dry basis), and W1 is the mass of freeze-dried extract (g).

2.5. Phytochemical Analyses

All phytochemical analyses of freeze-dried extracts were carried out in triplicate with three replicates (n = 6).

2.5.1. Total Phenolic Content (TPC)

The total phenolic in dried extracts from buckwheat hull was determined as reported by Zhu et al. [18], with minor modifications on the Folin–Ciocalteu procedure. Initially, 100 µL of an aliquot from the diluted sample (1 mg/mL) and standard (0–0.5 mg/mL gallic acid) was mixed with 2 mL of sodium carbonate (Na2CO3 solution, 2% w/v) and vortexed for two min. Then, 100 µL of 1-M Folin–Ciocalteau reagent was added, and the mixture was incubated in dark at 22 °C for 30 min. The absorption for the reaction was recorded at 720 nm using a UV–Vis spectrophotometer (Epoch 2, Biotek, SA), and the results were expressed as mg GAE/100 mg dried extracts of buckwheat hull.

2.5.2. DPPH Radical-Scavenging Assay

The DPPH free radical scavenging activity test was carried out as reported by Altemimi et al. [20] with minor modifications. Approximately, 1 mg of dried extract was diluted in 0.1 M of citrate phosphate buffer with 0.3% of Triton X-100. From the aliquot mixture, 190 µL was pipetted out in plate well and the absorbance at 515 nm was measured using a UV–Vis spectrophotometer. Afterward, an aliquot of 10 µL of a 2-mM methanolic DPPH reagent was added to each plate well. Then, the DPPH plate was mildly vortexed and incubated in dark for the reaction to take place at 22 °C for 30 min. DPPH inhibiting activity was calculated based on the absorbance readings at 515 nm using a UV–Vis spectrophotometer before and after DPPH reagent reaction.

2.5.3. Ferric Reducing Antioxidant Power (FRAP) Assay

Ferric reducing antioxidant power (FRAP) assay was based on the method reported by Marco et al. [17] with minor modifications. The reaction was initiated by mixing 280 µL of FRAP working solution with 20 µL of the test compound (sample, blanks, and STD). The samples were incubated at 37 °C in the dark for 30 min, and the absorbance at 593 nm was measured using a UV–Vis spectrophotometer. The FRAP values were expressed as µM Trolox equivalents (TE)/mg of dried extracts.

2.6. Liquid Chromatography-Mass Spectroscopy Analysis (LC-MS)

Screening of phenolic compounds from dried extracts of buckwheat hull was carried out using LC-MS (Agilent make 1200 Series) and auto-sampler (G1329B Agilent Automatic liquid sampler) coupled with a G6520A Quadrupole time of flight mass spectrometer (MSQ-TOF) equipped with a Z spray™ electrospray ionization (ESI) source (Agilent, Columbus, OH, USA). Initially, phenolic extraction was achieved by homogenously mixing the extracts with methanol (100%) followed by further ultrasonication for 30 min at room temperature. Post-treatment samples were subjected to centrifugation at 10,000× g for 10 °C for 20 min. After centrifugation and layer separation, the supernatant was filtered using 0.20 µm PVDF filters and diluted ten times before injection. Injection volume was set to 5 µL and Zorbax Eclipse XDB-C18 column (50 mm × 2.1 mm i.d.), particle size 1.8µm was employed (Agilent, Columbus, Ohio, USA). Mobile phases were water acidified with 0.1% formic acid in water (solvent A) and methanol (solvent B) with a flow rate of 0.300 mL/min. The elution was achieved with the following gradient; 0–2.0 min, 15% B; 2.0–7.0 min, 65% B; 7.0–8.0 min, 99% B; 0.8–13.0 min, 99% B; 13.0–15.0 min, 5% B, following the procedure provided by Lopes et al. with minor modification [21]. The negative mode of ESI was operated with the following MS/MS parameters including the capillary voltage. 3.0 kV; extractor voltage of 3.0 V; gas source temperature at 130 °C and de-solvation gas temperature at 325 °C. Nitrogen was used both as the de-solvation gas and the cone gas, with flow rates setting at 130 L h−1 and 11 L min−1, respectively. Phenolic compounds were screened by comparing their mass spectra, retention indices (Kovats index), and above 40% of relative abundance of acceptance was matched criteria of those of standards and was compared with the NIST mass spectral data system/library.
From the LC-MS data, phenolic compounds were quantitatively (number of compounds) and qualitatively (relative concentration of compound and phenolic group) analyzed for the samples with the highest phenolic content based on TPC results. The relative concentration (RC) of each compound in each extract was calculated as below:
RC   %   = ( C / TC ) × 100
where “C” is the peak area of each compound, and “TC” is the total peak area of all compounds in each extract.
Furthermore, all the detected compounds were categorized based on high or low molecular weight, molecular formula, and phenolic groups (i.e., anthocyanin, flavanol, flavanones, flavones, flavonol, phenolic acids, isoflavones, lignans, and quinones). Each compound’s molecular formula and weight data was verified from the ChemSpider (http://www.chemspider.com/, accessed on 21 October 2021) and PubChem (https://pubchem.ncbi.nlm.nih.gov, accessed on 21 October 2021) databases. The relative concentration of each phenolic group (RC-PG) in each extract was calculated as below:
RC-PG   ( % ) = ( G / TRG ) × 100
where ‘PG’ is the total peak area of compounds in each phenolic group and ‘TRG’ is the total peak area of all phenolic groups in each extract by following the protocols provided by Noore et al. [22] with minor modifications.

2.7. Scanning Electron Microscopy

The effect of novel extraction technology on the surface structure of buckwheat hull was observed using scanning electron microscopy (SEM) Regulus 8230 (Hitachi Ltd., Tokyo, Japan) as method reported by Murtey et al. [23]. After centrifugation and freeze-drying processes, residues of buckwheat hulls were stored at 4 °C for SEM analysis. Sample preparation for SEM analysis included four steps: (a) fixation, where one tiny particle of buckwheat hull (3 mm × 3 mm) was subjected to fixation in 2.5% glutaraldehyde using 0.1 M phosphate buffer (pH 7.4) at 4 °C for 12 h. After fixation samples were rinsed three times in phosphate buffer and then rinsed using deionized water for 15 min; (b) post-fixation, where prefixed samples were treated with osmium tetroxide for 6 h in the same buffer and then were rinsed for three times with phosphate buffer followed by deionized water rinsing for 15 min; (c) dehydration, where fixed samples were dehydrated in series of alcohol with ascending concentration levels (i.e., 30%, 50%, 70%, 80%, 90% and 100% of ethanol) for 15 min per concentration; (d) critical drying using nitrogen gas. After these steps the fixed sample was ready to be observed and was placed on double-sided carbon tape mounted on an aluminum stub. Samples were then kept in a vacuum chamber for gold coating for 2 min and post-gold-coating samples were analyzed under SEM.

2.8. Statistical Analysis

Each experiment was conducted in triplicate. Results are shown in mean ± standard deviation. Minitab version 17 (Minitab, LLC, Harrisburg, PA, USA) was used to perform statistical analysis on the experimental data. The effects of conventional and novel techniques on extraction yield, TPC, FRAP, and DPPH were analyzed using one-way variance (ANOVA) performed on each parameter using Post Hoc with Tukey’s HSD test. Different letters indicate significant differences (p ≤ 0.05) in both tables and graphs. Pearson’s correlation matrix was prepared using GraphPad Prism 9.1.0 (GraphPad, San Diego, CA, USA) to analyze the relationships between the number of phenolic compounds identified with the novel treatments implemented. The total variances of buckwheat hull extracts from different extraction strategies were also analyzed using MATLAB 2020b (The MathWorks, Natick, MA, USA) for principal component analysis (PCA).

3. Results and Discussion

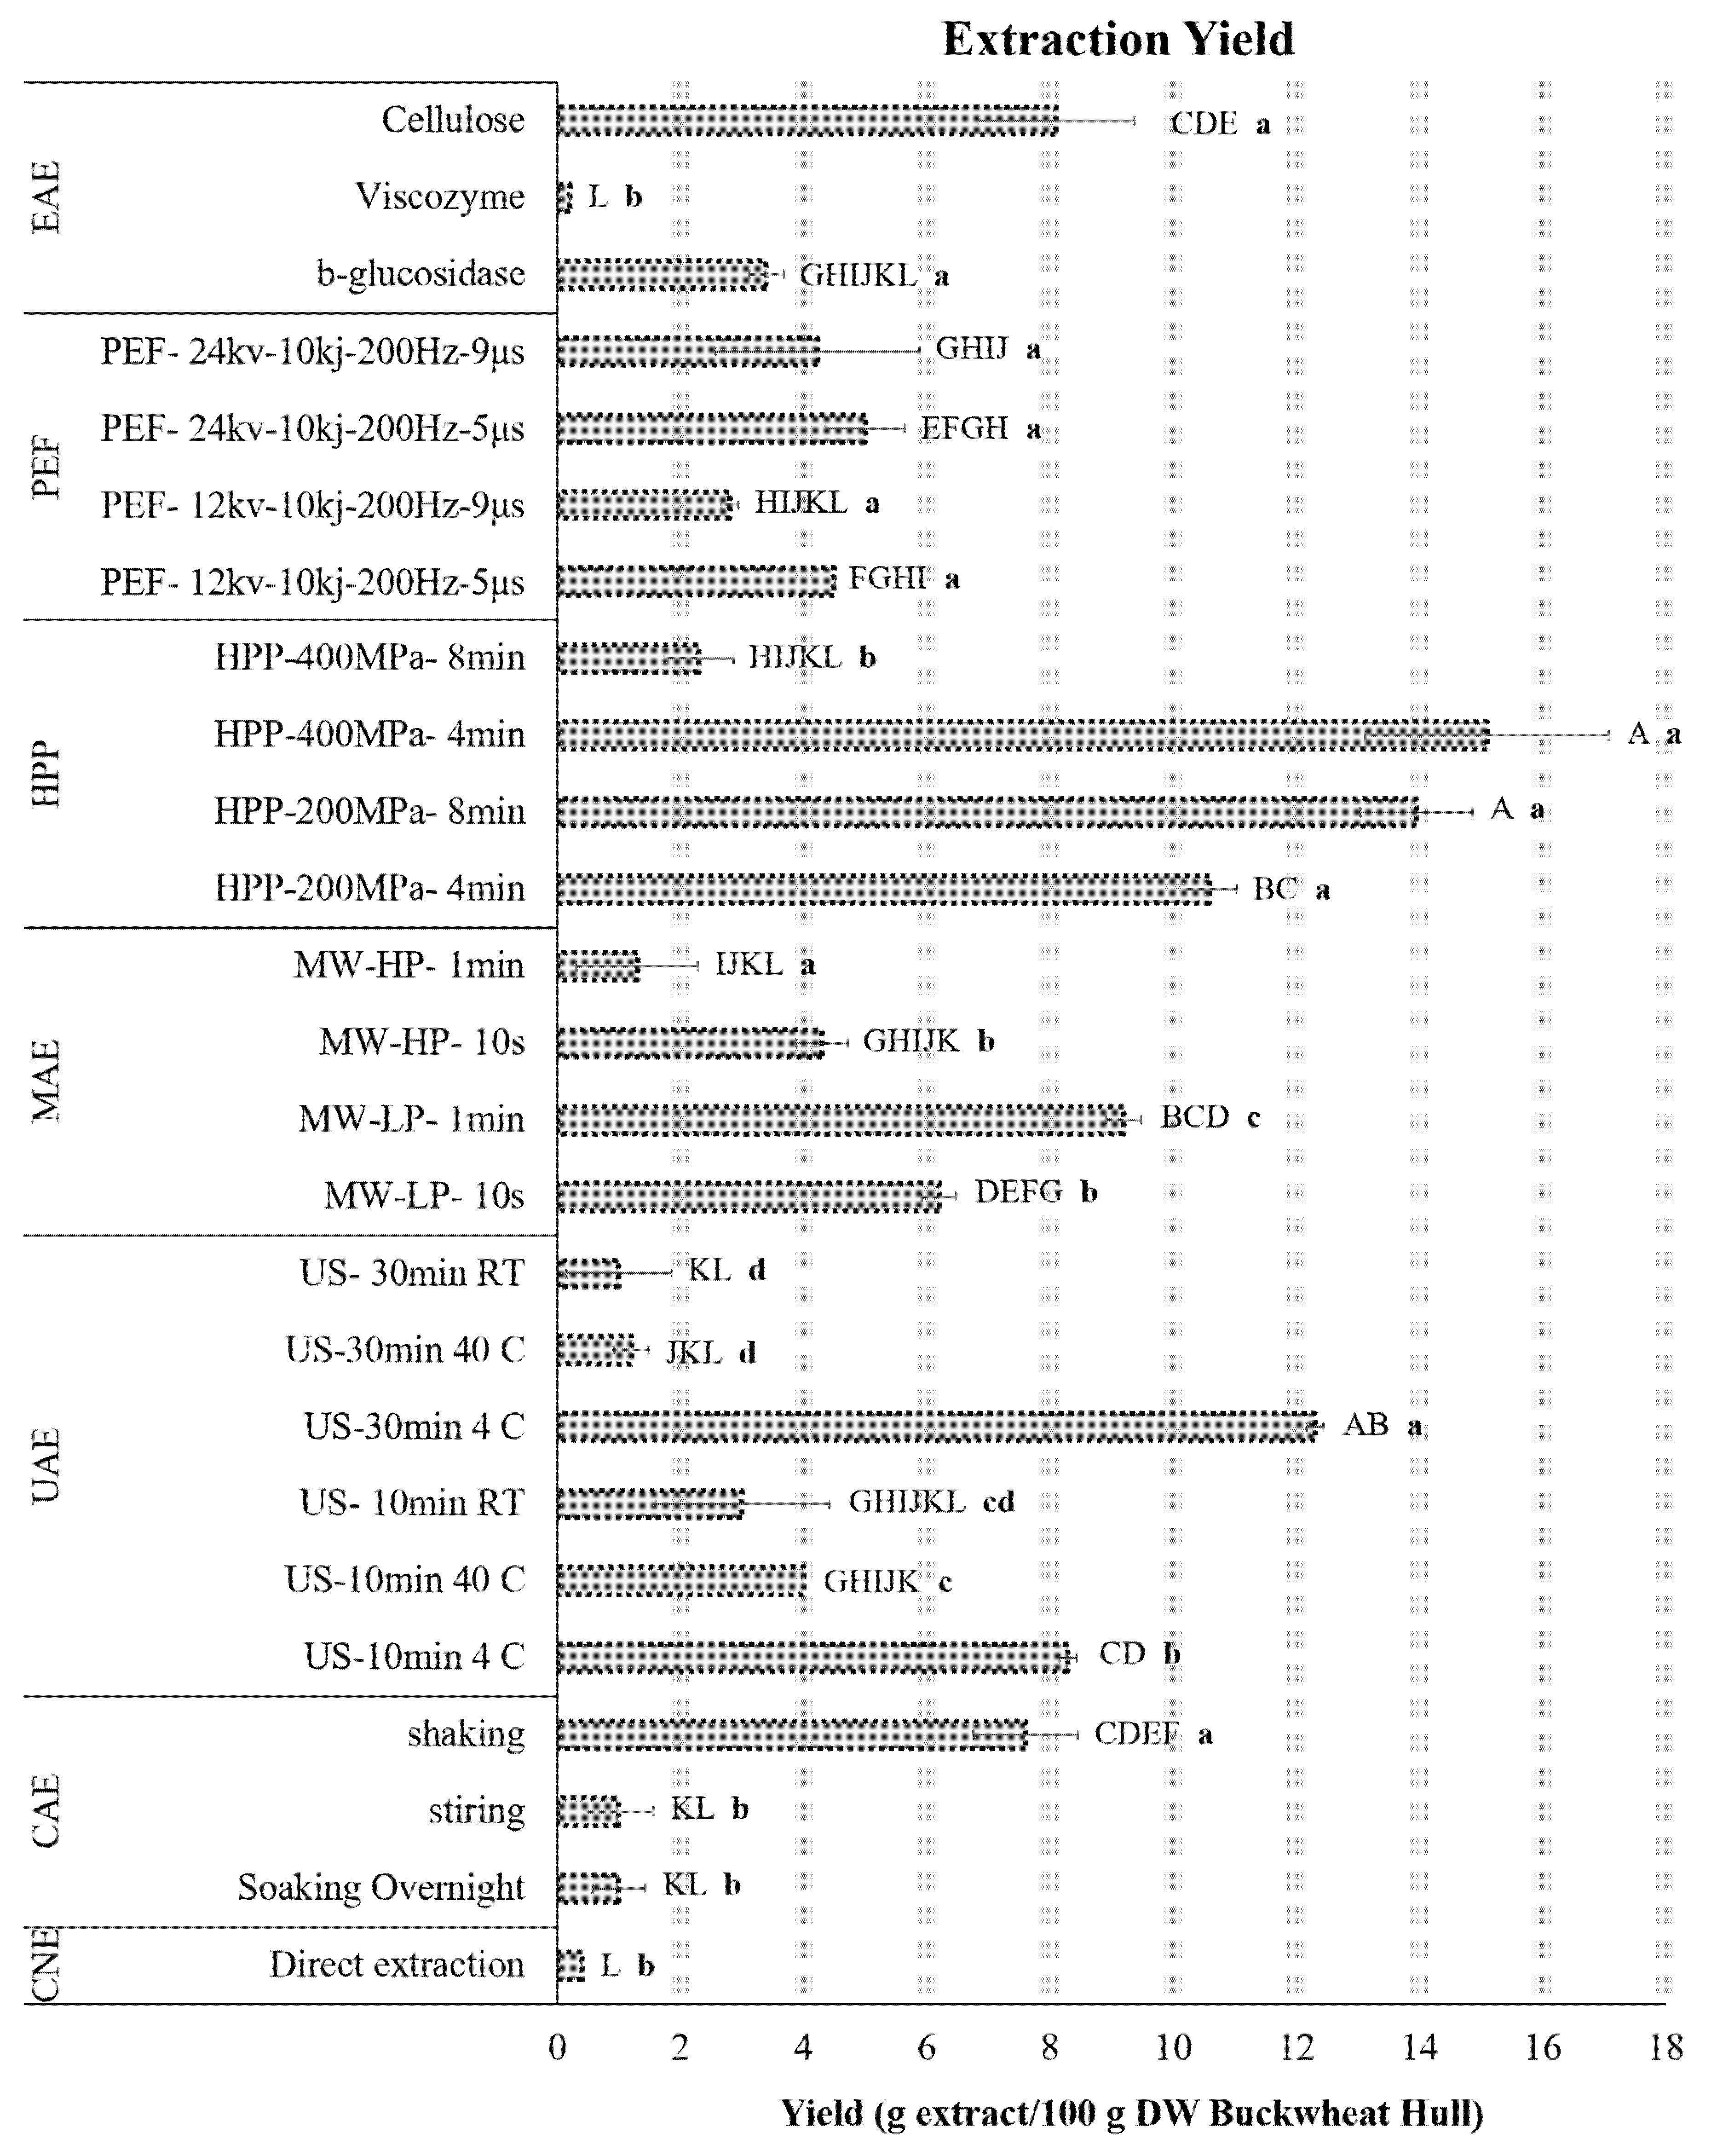
3.1. Effects of Novel Extraction Strategies on Recovery Yields of Buckwheat Extracts

Comparison of the phenolic contents of buckwheat hull extracts between samples extracted using conventional and novel extraction strategies was investigated. The total soluble solid content was estimated and expressed as extraction yield in g/100 g of buckwheat hull dry mass. It can be observed in Figure 2 that HPP (15.10 ± 1.98 g/100 g) treated samples resulted in the highest amount of total soluble solids compared to the conventional and control methods treated samples, where the total soluble solid extraction was limited to 7.60 ± 0.85 and 0.40 ± 0.02 g/100 g, respectively.
In the case of EAE, three types of enzymes namely cellulase, β-glucosidase, and viscozyme were employed and the maximum amount of extraction yield (8.10 ± 1.27 g/100 g) was recorded for the samples treated with cellulase. It can be observed that the yields from use of cellulase and β-glucosidase enzymes were similar to each other and much higher than the yields observed using viscozyme. Enzymes are considered a sustainable source for enhancing the level of bioactive extraction from plant matrices [24,25,26]. The cell wall of a plant matrix comprises cellulose, pectin, hemicellulose, and many phytochemicals along with polysaccharides bounded with hydrogen or hydrophobic bonds. Several enzymes including cellulase, hemicellulase, β-glucosidase are employed to hydrolyze these bonds, thereby softening the structure of the cell wall which improved the level of phenolic extraction [27]. Martillanes et al. [28] employed EAE for the extraction of phenolic compounds from rice bran. They used cellulase at an optimized condition (i.e., 35 °C, pH 3.0, 4 h and cellulase concentration 1.0%) and reported an extraction yield of 3.45 ± 0.9 to 14.3 ± 2.2 mg ferulic acid/100 g without cellulase and with cellulase, respectively [28]. Similarly, Wang et al. [29] optimized extraction of polyphenols from passion fruits using cellulase enzyme and reported that the level of antioxidants and polyphenols was increased 1.5–2 fold compared to convention extraction protocols [29].
In this study, the yields obtained using β-glucosidase (3.40 ± 0.28 g/100 g) and viscozyme (0.20 ± 0.01 g/100 g) extraction strategies were extremely low; hence they are not considered as effective strategies for the extraction of phytochemicals from Buckwheat hulls. However, Diaz-suarez et al. concluded that viscozyme was the best treatment method for the extraction of oil from Ricinus communis seeds compared with other enzymes including cellulase, pectinase, and hemicellulase at optimized conditions (2% of Viscozyme L; pH 4 and 50 °C)
PEF is considered as a novel/green strategy for the extraction of polyphenols from plant matrices, where samples are treated using a series of electric pulses of an amplified electric field in short treatment durations of 1 to 8 s and at low temperatures (22 °C to 25 °C). It causes polarization of cells in a membrane which results in the formation of pores thereby enabling the diffusion of bioactive compounds from the inner cell matrix to the outside solvent matrix [30]. PEF has been used for the extraction of phytochemicals from plant matrices including grapes pomace [31], orange peel [32] apple pomace [33], pomegranate peel [34], and twigs of tea [35]. However, the efficiency of the extraction depends upon several parameters including electrode voltage, pulse width, frequency, and energy input. In this study, four different PEF extraction strategies were investigated to obtain the extracts. The results showed no significant differences between the yields using these four PEF extraction strategies. However, PEF extraction yields ranging from 2.80 ± 0.14 to 5.00 ± 0.64 g/100 g were significantly different from the control yield level (0.40 ± 0.02 g/100 g). No significant effect on buckwheat hull extraction was observed under different electric strengths (3–6 kV/cm), In another study, PEF was used for crude aqueous extraction from brown alga (Laminaria digitate) with a 15% improvement in extraction yield [36].
HPP is a nonthermal technique for enzyme inactivation, microbial decontaminating, and bioactive extraction. It has been ubiquitously used for the extraction of polyphenols from plant matrices. It tends to alter the cell structure causing damage/deformation in the cell membrane, thereby causing the secondary metabolites to defuse by the principle of mass transfer, even though bioactive compounds are low molecular weight compounds including polyphenols, vitamins, and pigments [37]. Several groups of phenolic compounds are extracted using HPP. Altuner et al. improved the level of phenolic content extracted from Maclura pomifera [38], whereas anthocyanin extraction from grape pomace was enhanced by 6 fold using HPP [39]. In this study, four different protocols were employed along with the control method for the extraction of phenolic compounds. Interestingly, results indicated accelerated yields in samples treated using HPP when compared with those extracted using the control method. Briefly, samples treated at 400 MPa for 4 min showed the highest yield (15.10 ±1.98 g/100 g) compared with the yields (13.95 ± 0.92, 10.60 ± 0.42, and 2.30 ± 0.57 g/100 g) from the treatments at 200 MPa for 8 min, 200 MPa for 4 min and 400 MPa for 8 min, respectively. This suggests that the extraction yield is positively correlated to the pressure applied during the treatment time. The extraction yield can be furtherly improved by the modification of the combination of applied pressure and treatment time. Additionally, no significant difference was found in the extraction yields after the treatments of 200 MPa for 4 min and 8 min, which suggests that treatment time does not play an important role influencing the extraction yield at low pressure. Strati et al. reported the carotenoid extraction from tomatoes was strongly dependent on the applied pressure (700 MPa) and treatment time duration (10 min). Compared with the conventional yield (i.e., 2%), a much higher carotenoid extraction yield (64%) was achieved when a high pressure (700 MPa) was applied during the treatment [40].
MAE or UAE is considered as one of the most reliable technologies for the extraction of bioactive compounds due to its extraction procedures, including low solvent consumption and rapid extraction time with high compound recovery. MAE or UAE has been employed for the extraction of several bioactive compounds (e.g., anthocyanin, flavanol, flavanones, flavones, flavonol, phenolic acids, etc.) from fruits, nuts, and plant leaves, etc. [41]. In the present study, phenolic compounds were extracted from buckwheat hull employing both MAE and UAE strategies. Samples treated with microwave low power for 1 min and 10 s resulted in enhanced extraction yields (9.20 ± 0.28, 6.20 ± 0.72 g/100 g, respectively) compared to the control yield (0.40 ± 0.02 g/100 g). The results demonstrated that the microwave power is inversely proportional to the extraction yield. However, the extraction yield increases with the increase of treatment time.
The extraction yield based on an optimized UAE extraction protocol (for 10 min treatment at 4 °C) improved by up to two-fold (12.30 ± 0.14 g/100 g) compared to using MAE. Additionally, UAE was carried out under six different protocols, as shown in Figure 2. The results showed the maximum extraction yield can be achieved at 4 °C due to the degradation of bioactive compounds at high temperatures. Likewise, some research [41] showed that the degradation of many phenolic compounds, including pigments, occurred at a high temperature (ca. 80 °C). UAE has also been reported for phenolic compound extraction from tomatoes (Li et al., 2021, Proestos & Komaitis 2008) and grapes at a controlled temperature range of 20–50 °C (Carrera et al., 2021), with yields of four to six-fold of those obtained using conventional extraction observed.
Overall, in this study, the highest extraction yield was obtained from HPP-treated samples. The lowest extraction yield was observed in control and conventionally treated samples. For the three conventional extraction treatment protocols shown in Figure 2, the highest extraction yield was achieved using the shaking method. This suggests that shaking the rehydrated samples in a sealed vessel helps to break down the plant cell matrix, thereby improving the extraction yield. Similarly, Reference [42] reported that a continuous shaking method was employed for the extraction of bioactive compounds with two to three-fold extraction yield obtained compared to the direct aqueous extraction yield.

3.2. Total Phenolic Content (TPC)

The total phenolic content (TPC) and antioxidant activities (FRAP and DPPH) of the extracts obtained using novel extraction strategies were analyzed, and the values are shown in Table 1. It can be seen that extracts obtained from EAE (Viscozyme), HPP (200 MPa for 8 min), and UAE (30 min @ 4 °C) treatments contain significantly high levels of TPC content (i.e., 22.28 ± 0.53, 21.75 ± 0.78, and 16.14 ± 0.06 mg GAE/100 mg of DW), respectively, as compared to control samples (4.92 ± 0.07 mg GAE/100 mg of DW). Samples treated with the convention method were also analyzed, and the samples soaked for 24 h contained a higher TPC level (13.88 ± 0.08 mg GAE/100 mg of DW) than those obtained using stirring and shaking (i.e., 11.36 ± 0.08 and 0.26 ± 0.52 08 mg GAE/100 mg of DW). In the case of PEF and MAE treatments, TPC values in a range of 9.94–7.73 and 12.63–4.7608 mg GAE/100 mg of DW were observed, respectively. Therefore, it can be concluded that HPP is the best strategy for the extraction of TPC from buckwheat hull. Extraction conditions such as extraction time, dilution ratio, and energy input play a major role in the recovery of phenolic compounds. The TPC of buckwheat hull was reported [43] to be 3.06 ± 0.02 g GAE/100 g of DW, which is even lower than the TCP content extracted using the control method in this study.

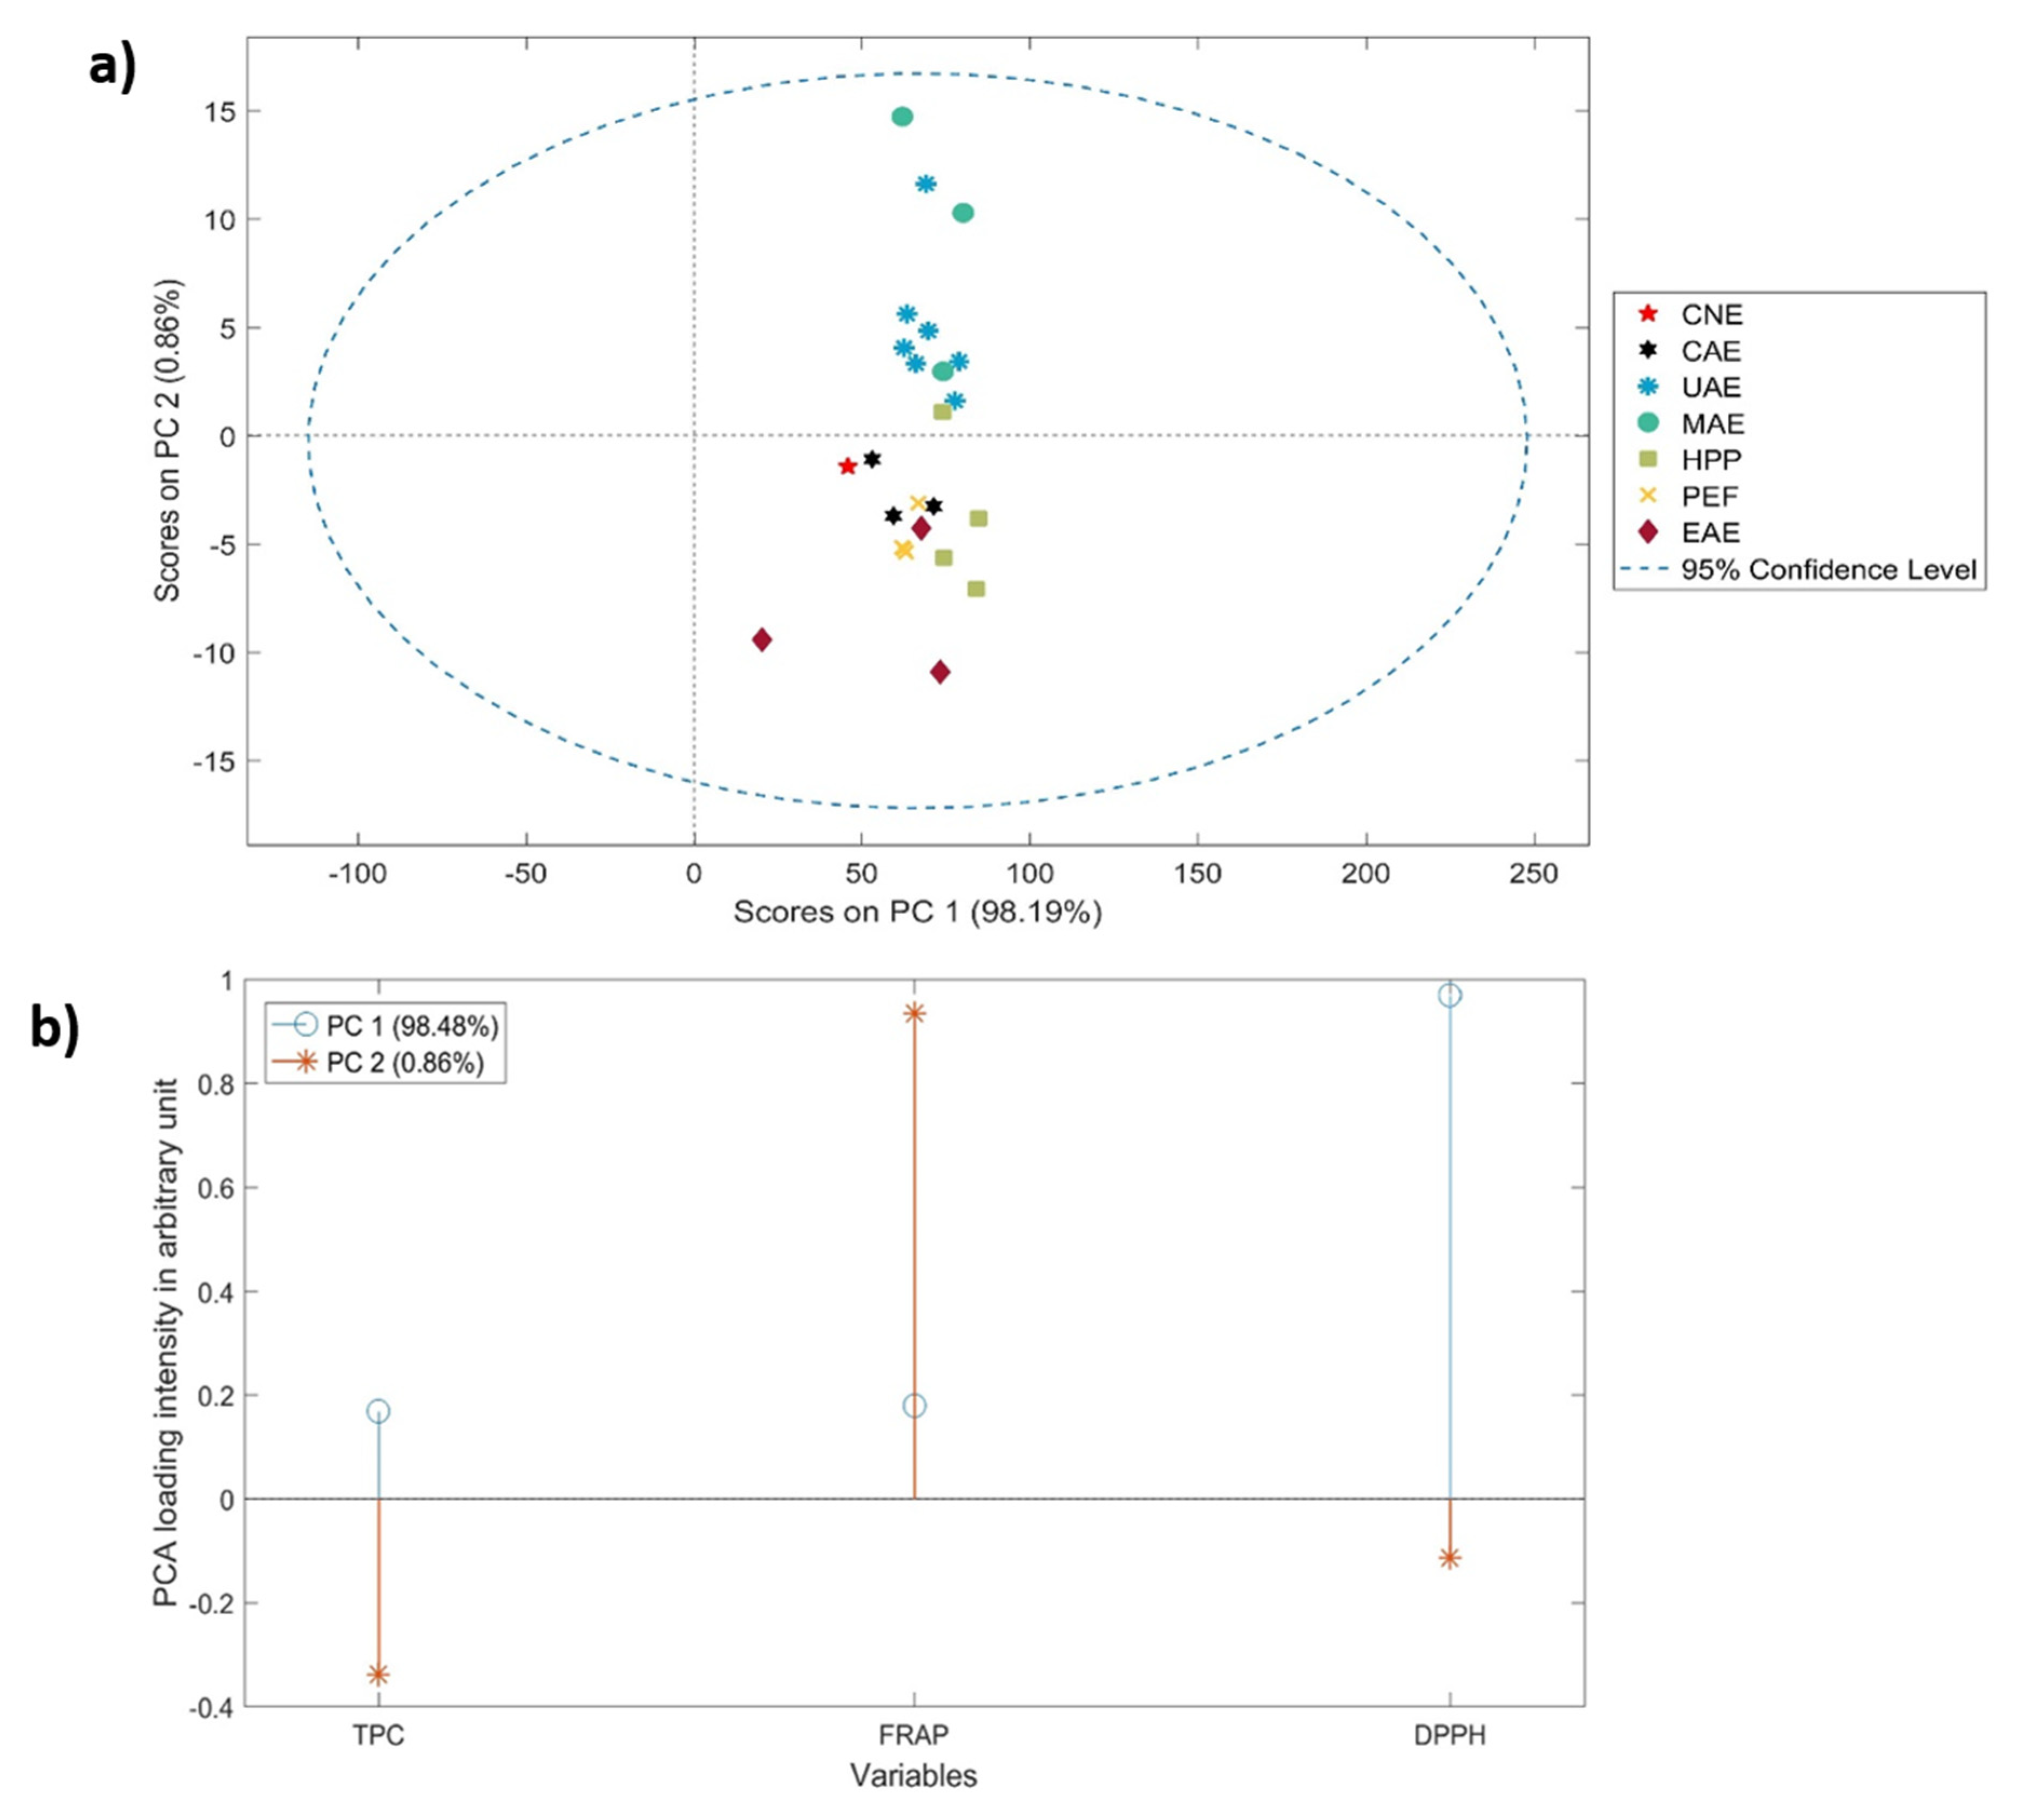
3.3. Antioxidant Analyses

It has been reported that antioxidant compounds in buckwheat are present in the outer layer of the grain or hull, which is used as a functional food ingredient, as it is rich in antioxidants. Many research studies have reported that bread prepared with buckwheat hull formulation along with wheat grain possess higher antioxidant and phenolic compounds [44,45]. In this study, the effects of novel extraction strategies on the antioxidant properties of extracts obtained from buckwheat hull were examined, and the results indicated a large increase in the levels of both DPPH and FRAP compared to those from the control samples (Table 1). The maximum percentage of DPPH was recorded for the samples treated using HPP (80.91 ± 0.22%), followed by MAE, UAE, and EAE of 77.80 ± 0.05%, 73.77 ± 0.06%, and 72.11 ± 0.11%, respectively, which were significantly different (p  <  0.05) from the control and conventional treatments (i.e., 45.55 ± 0.74%, 51.65 ± 0.44%, and −69.68 ± 0.94%, respectively). For FRAP tests, the maximum activity (i.e., 25.28 ± 0.04-mM TE/mg DW extracts) was observed in samples treated with MAE, while the lowest (i.e., 4.39 ± 0.00-mM TE/mg DW extracts) was found during enzyme-assisted extraction. This study suggests that the extraction level of antioxidants from buckwheat hull can be significantly improved by using novel extraction strategies. Limited studies have been reported on the novel extraction of antioxidants from buckwheat hull; however, the conventional extraction of antioxidants from buckwheat hull with 19.91 ± 0.79% DPPH was reported by Steadman et al. [46].
Table 1. Total phenolic content (TPC) and antioxidant (FRAP and DPPD) activity of buckwheat hull extracts obtained from different extraction strategies (i.e., control (CNE), conventional-assisted extraction (CAE), ultrasound-assisted extraction (UAE), microwave-assisted extraction (MAE), high-pressure processing (HPP), pulsed electric fields (PEF), and enzyme-assisted extraction (EAE) treatments).
Extraction StrategiesTPC (mg GAE/100 mg DW Extract)FRAP (mM TE/mg DW Extracts)DPPH (%)
CNEDirect extraction4.92 ± 0.07 MN d5.09 ± 0.05 O d45.55 ± 0.74 L d
CAESoaking Overnight13.88 ± 0.08 DEF a9.36 ± 0.10 K a69.68 ± 0.94 EF a
stirring9.29 ± 0.52 IJ b8.01 ± 0.02 L b51.65 ± 0.44 K c
shaking11.36 ± 0.08 GH b7.52 ± 0.14 M c57.39 ± 0.52 J b
UAEUS-10 min 4 °C15.89 ± 0.08 BC a17.00 ± 0.14 E c73.77 ± 0.06 C a
US-10 min 40 °C15.98 ± 0.04 BC a17.20 ± 0.29 E c62.15 ± 0.09 H d
US-10 min RT4.72 ± 0.14 MN c14.73 ± 0.05 GH e61.88 ± 0.07 H d
US-30 min 4 °C16.14 ± 0.06 BC a20.34 ± 0.34 D b64.62 ± 0.07 G c
US-30 min 40 °C6.24 ± 0.83 LM c22.18 ± 0.03 C a66.15 ± 0.08 G b
US-30 min RT13.24 ± 0.96 EF b16.16 ± 0.08 F d59.45 ± 0.02 I e
MAEMW-LP-10 s4.76 ± 0.10 MN b14.34 ± 0.06 H d77.80 ± 0.05 B a
MW-LP-1 min4.88 ± 0.19 MN b25.28 ± 0.04 A a57.82 ± 0.14 IJ c
MW-HP-10 s12.63 ± 0.13 FG a16.29 ± 0.00 F c71.16 ± 0.93 DE b
MW-HP-1 min11.50 ± 0.59 G a23.98 ± 0.00 B b76.37 ± 0.63 B a
HPPHPP-200 MPa-4 min15.85 ± 0.07 BC bc9.13 ± 0.00 K d71.68 ± 0.12 D b
HPP-200 MPa-8 min21.76 ± 0.78 A a11.36 ± 0.08 J c79.88 ± 0.12 A a
HPP-400 MPa-4 min17.36 ± 0.05 B b13.31 ± 0.03 I b80.91 ± 0.22 A a
HPP-400 MPa-8 min14.91 ± 0.30 CD c14.95 ± 0.07 G a71.14 ± 0.45 DE b
PEFPEF-12 kv-10 kj-200 Hz-5 μs7.73 ± 0.12 KL b7.01 ± 0.01 N a66.17 ± 0.10 G a
PEF-12 kv-10 kj-200 Hz-9 μs9.94 ± 0.02 HI a4.86 ±0.00 O b62.38 ± 0.78 H b
PEF-24 kv-10 kj-200 Hz-5 μs7.31 ± 0.26 KL b4.21 ± 0.01 P d61.75 ± 0.10 H b
PEF-24 kv-10 kj-200 Hz-9 μs7.94 ± 0.18 JK b4.34 ± 0.01 P c62.02 ± 0.18 H b
EAEb-glucosidase4.50 ± 0.21 N c4.39 ± 0.00 P a68.10 ± 0.95 F b
Viscozyme14.70 ± 0.18 CDE b0.88 ± 0.04 R c16.80 ± 0.33 M c
Cellulase22.28 ± 0.53 A a2.52 ± 0.00 Q b72.11 ± 0.11 CD a
Each value is a mean of three replicates with the standard deviation (Mean ± SD). Different capital letters (A–N) labeled indicate significant differences (p < 0.05) among all the strategies, whereas different small letters (a–e) labeled show the significant differences (p < 0.05) existing between the treatments of each strategy.
The principal component analysis (PCA) was also carried out to describe the similarity or differences between the extracts obtained using different extraction strategies based on the results of the TPC, DPPH, and FRAP assay tests. Figure 3a shows the score plot of PC1 vs. PC2, which explained 94.19% and 0.86% of the total sample variances, respectively. It can be observed that samples are mainly distributed along the PC2 loading direction, while all the samples are located inside the Hotelling’s T2 ellipse with a 95% confidence level. It demonstrates the samples extracted using different extraction strategies sharing the most similarity on TPC, DPPH, and FRAP contents along the PC1 loading direction; the sample distribution of PC1 shown in Figure 3a was decided by the high loading intensity of the DPPH results, as shown in Figure 3b. While it also can be observed that sample clusters of different extraction strategies are aligned towards the PC2 loading direction, the sample distribution was mainly influenced by the FRAP results, as shown in Figure 3b. Based on the Euclidean distances shown in between the samples in Figure 3a, it can be concluded that samples extracted using the PEF and HPP methods are located closer to the CNE and CAE samples with relatively shorter Euclidean distances than the other extracts, which demonstrates the similarities in the results of TPC, DPPH, and FRAP, especially on the results of FRAP between the PEF and HPP samples with the CNE and CAE samples.

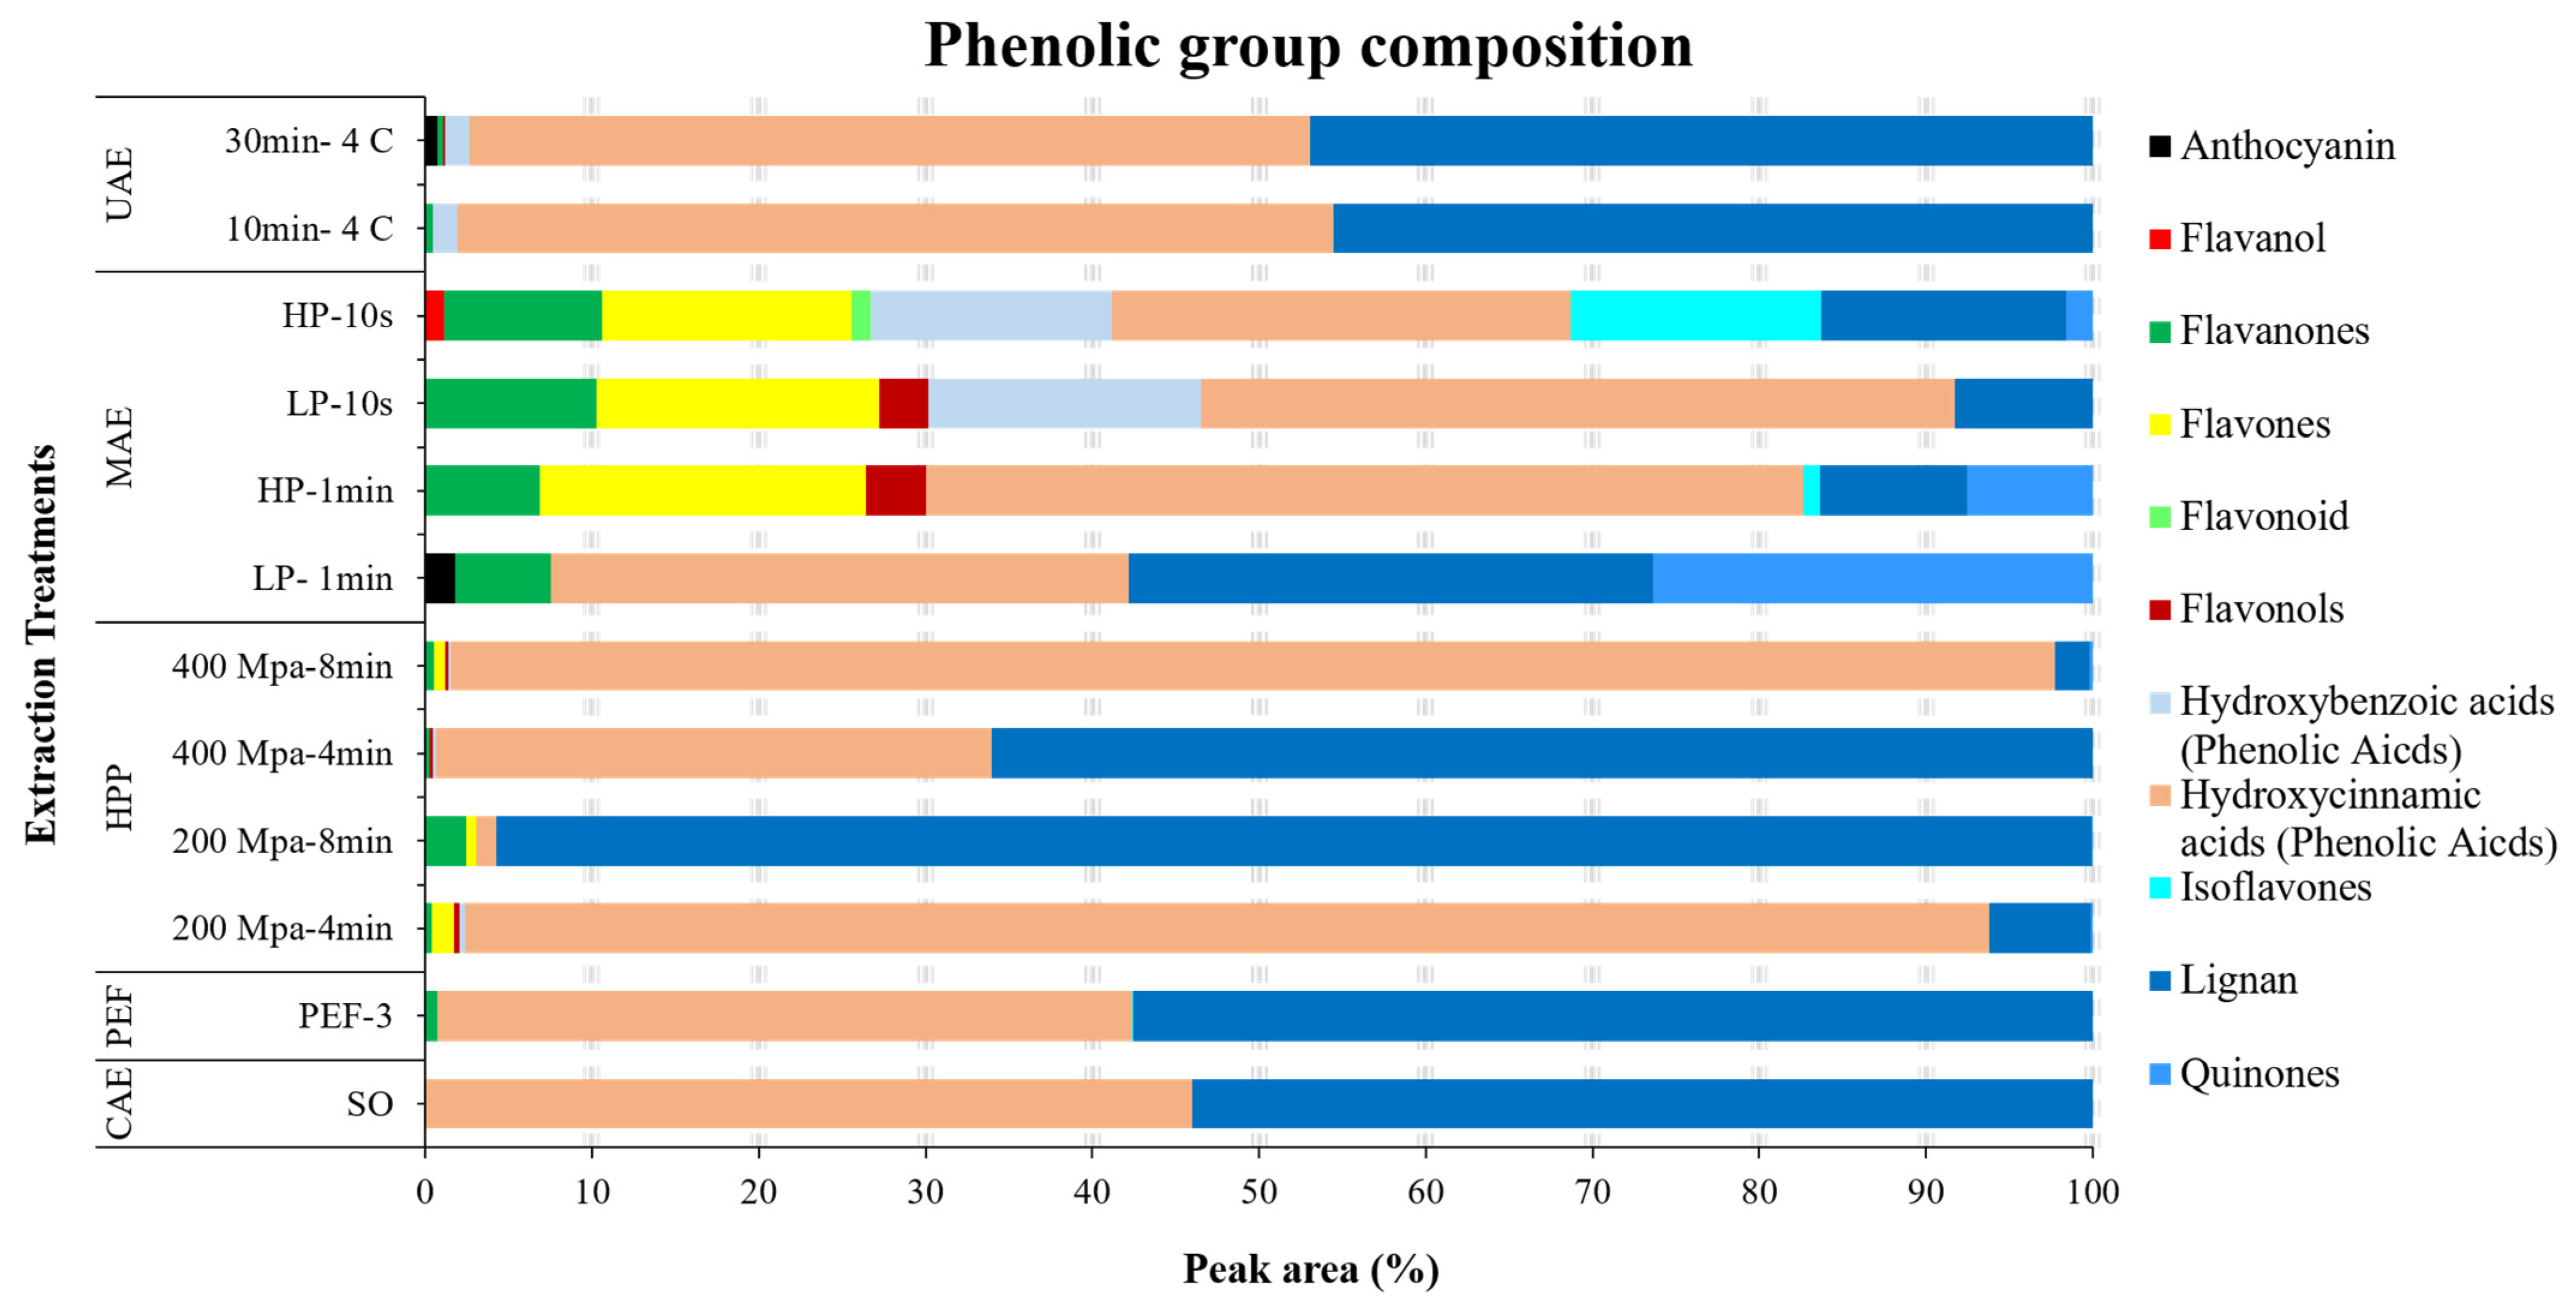
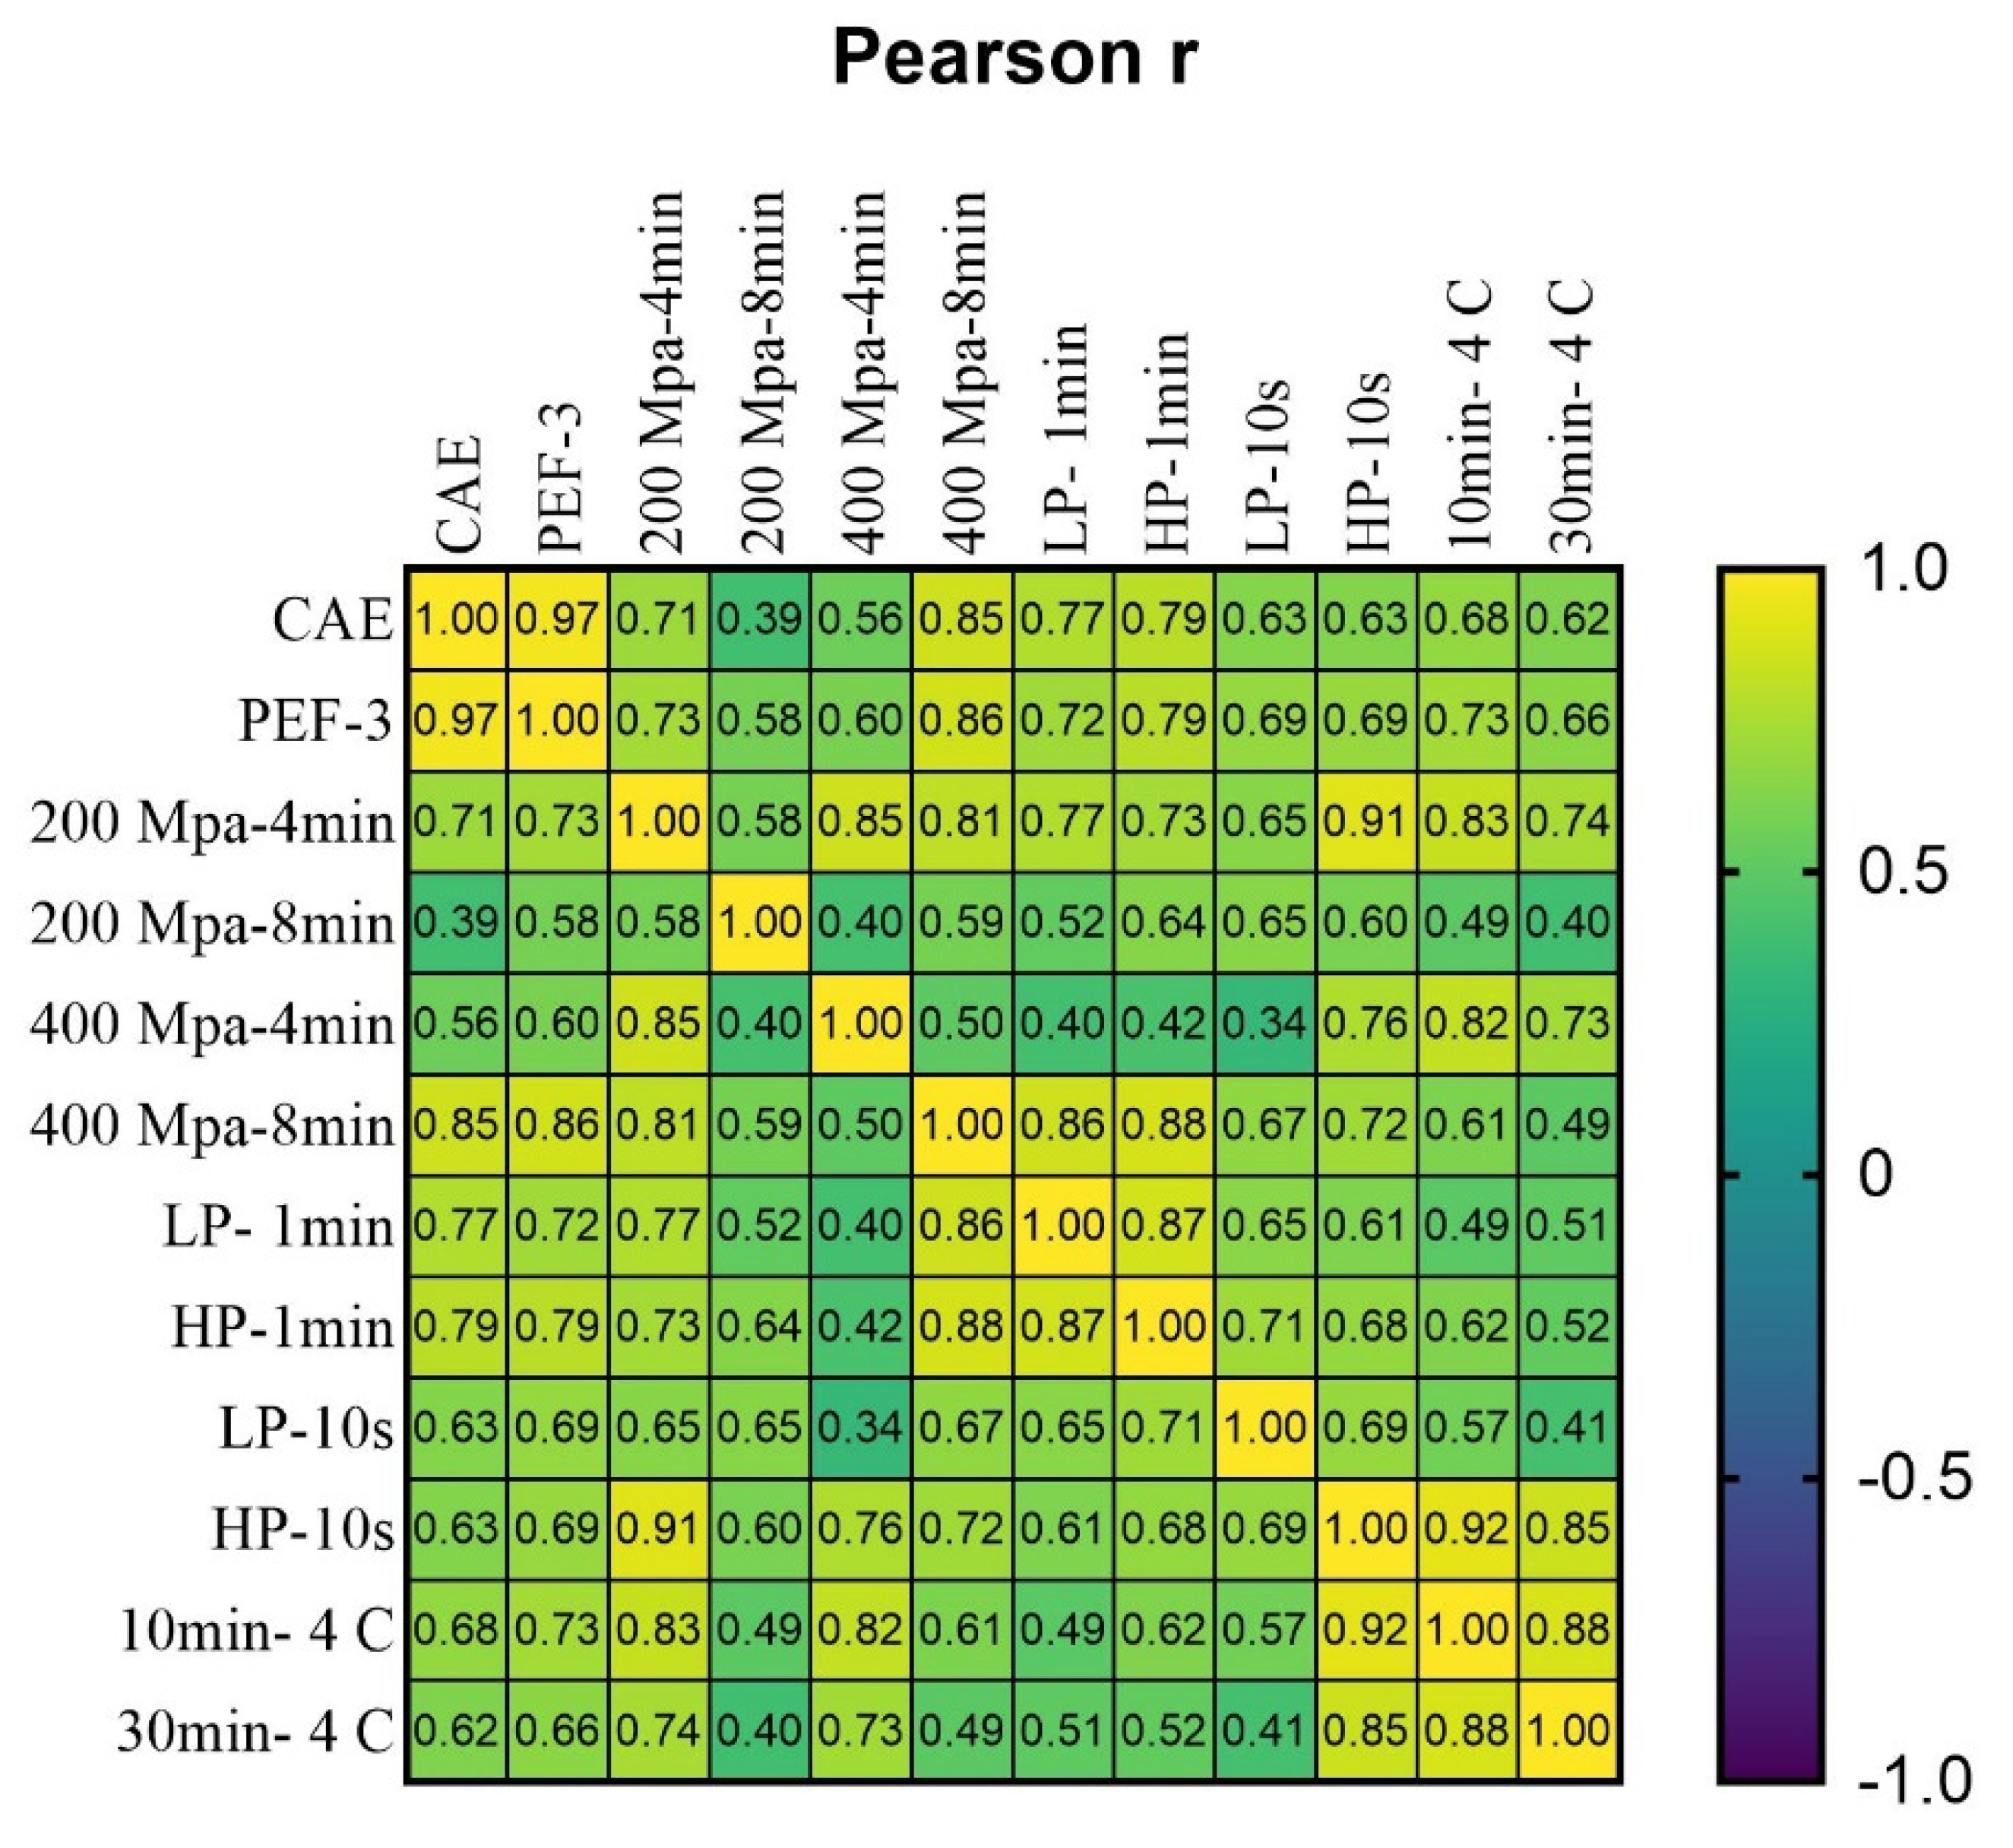
3.4. Phenolic Profile

According to the previously published studies, the LC-ESI-TOF spectrometry method was employed for phenolic profiling from buckwheat flour [47]. In this study, post-treatment extracts obtained from buckwheat hull were selected for phenolic profiling using LC-MS based on its TPC content. Samples comprising a rich TCP content were selected and analyzed to investigate the effect of novel extraction strategies on phenolic profiles. Forty-one compounds were identified in total, which was similar to the previously published report where the total number of compounds identified was forty-four using HPLC with mass spectroscopy [48]. Samples treated with HPP and MAE contained a maximum number of phenolic compounds (7–13 and 10–13, respectively) compared to conventional treatment (5), while samples treated with PEF (9) and UAE (7 and 8) resulted in a small number of phenolic compounds, as illustrated in Table 2. Additionally, ten different types of phenolic groups were identified, including anthocyanin, flavanol, flavanones, flavones, flavonol, phenolic acids, isoflavones, lignan, and quinones. Up to seven phenolic groups were identified in samples extracted using HPP, MAE, and UAE. On the other hand, compounds identified in three zones, including major, minor, and trace concentration levels, were based on the qualitative data of relative concentrations (i.e., >50%, >10%, and <10%). Compounds with major concentration levels include Isoacitrein, Isoacitretin, and Broussonin C, while compounds including Apigenin 6-C-glucoside, 6-Geranylnaringenin, Gallic acid, 5–8′-dehydrodiferulic acid, p-Coumaric acid 4-O-glucoside, 4-Vinylsyringol, Genistin, and Pterostilbene were identified on a minor level. A trace level of compounds includes 6-Geranylnaringenin, p-Coumaric acid 4-O-glucoside, 4-Vinylsyringol, Quercetine-3-O-xylosyl, isoacitrein, 6-Gingerol, Genistin, Pterostilbene, caffeic acid, and catechin. Interestingly, the concentration of phenolic compounds was more prominent in samples extracted using HPP, MAW, and UAE when compared to conventional treatments. These results were in agreement with a previously published study where compounds including Isoorientin and Isovitexin were found in high concentrations while Quercetine was known to be present in a trace concentration level [49,50]. In addition, the concentration level of each phenolic group was also calculated based on its qualitative data (relative concentration %), as illustrated in Figure 4. Samples extracted using novel extraction strategies comprise more phenolic groups, including anthocyanin, flavanol, flavanones, flavones, flavonol, phenolic acids, and isoflavones, but at lower concentration levels, whereas the CAE samples were only limited in two phenolic groups (i.e., lignan and quinones) but at higher concentration levels. Therefore, it can be concluded that novel extraction technology can help to enhance the extraction of specific phenolic compounds.
The relationship between extraction strategies was also analyzed based on the numbers of compounds identified in each phenolic group. The Pearson correlation matrix is illustrated in Figure 5. The results demonstrated that samples treated with HPP (200 MPa for 8 min) had a significantly weak relationship (R = 0.39) with CAE compared to all the other extraction strategies investigated, including MAE (R 0.63 to 0.77) and UAE (R 0.62 to 0.68). Further research is required to modify the protocols to amplify the variations in the strategies, thereby enhancing the number of phenolic compounds.

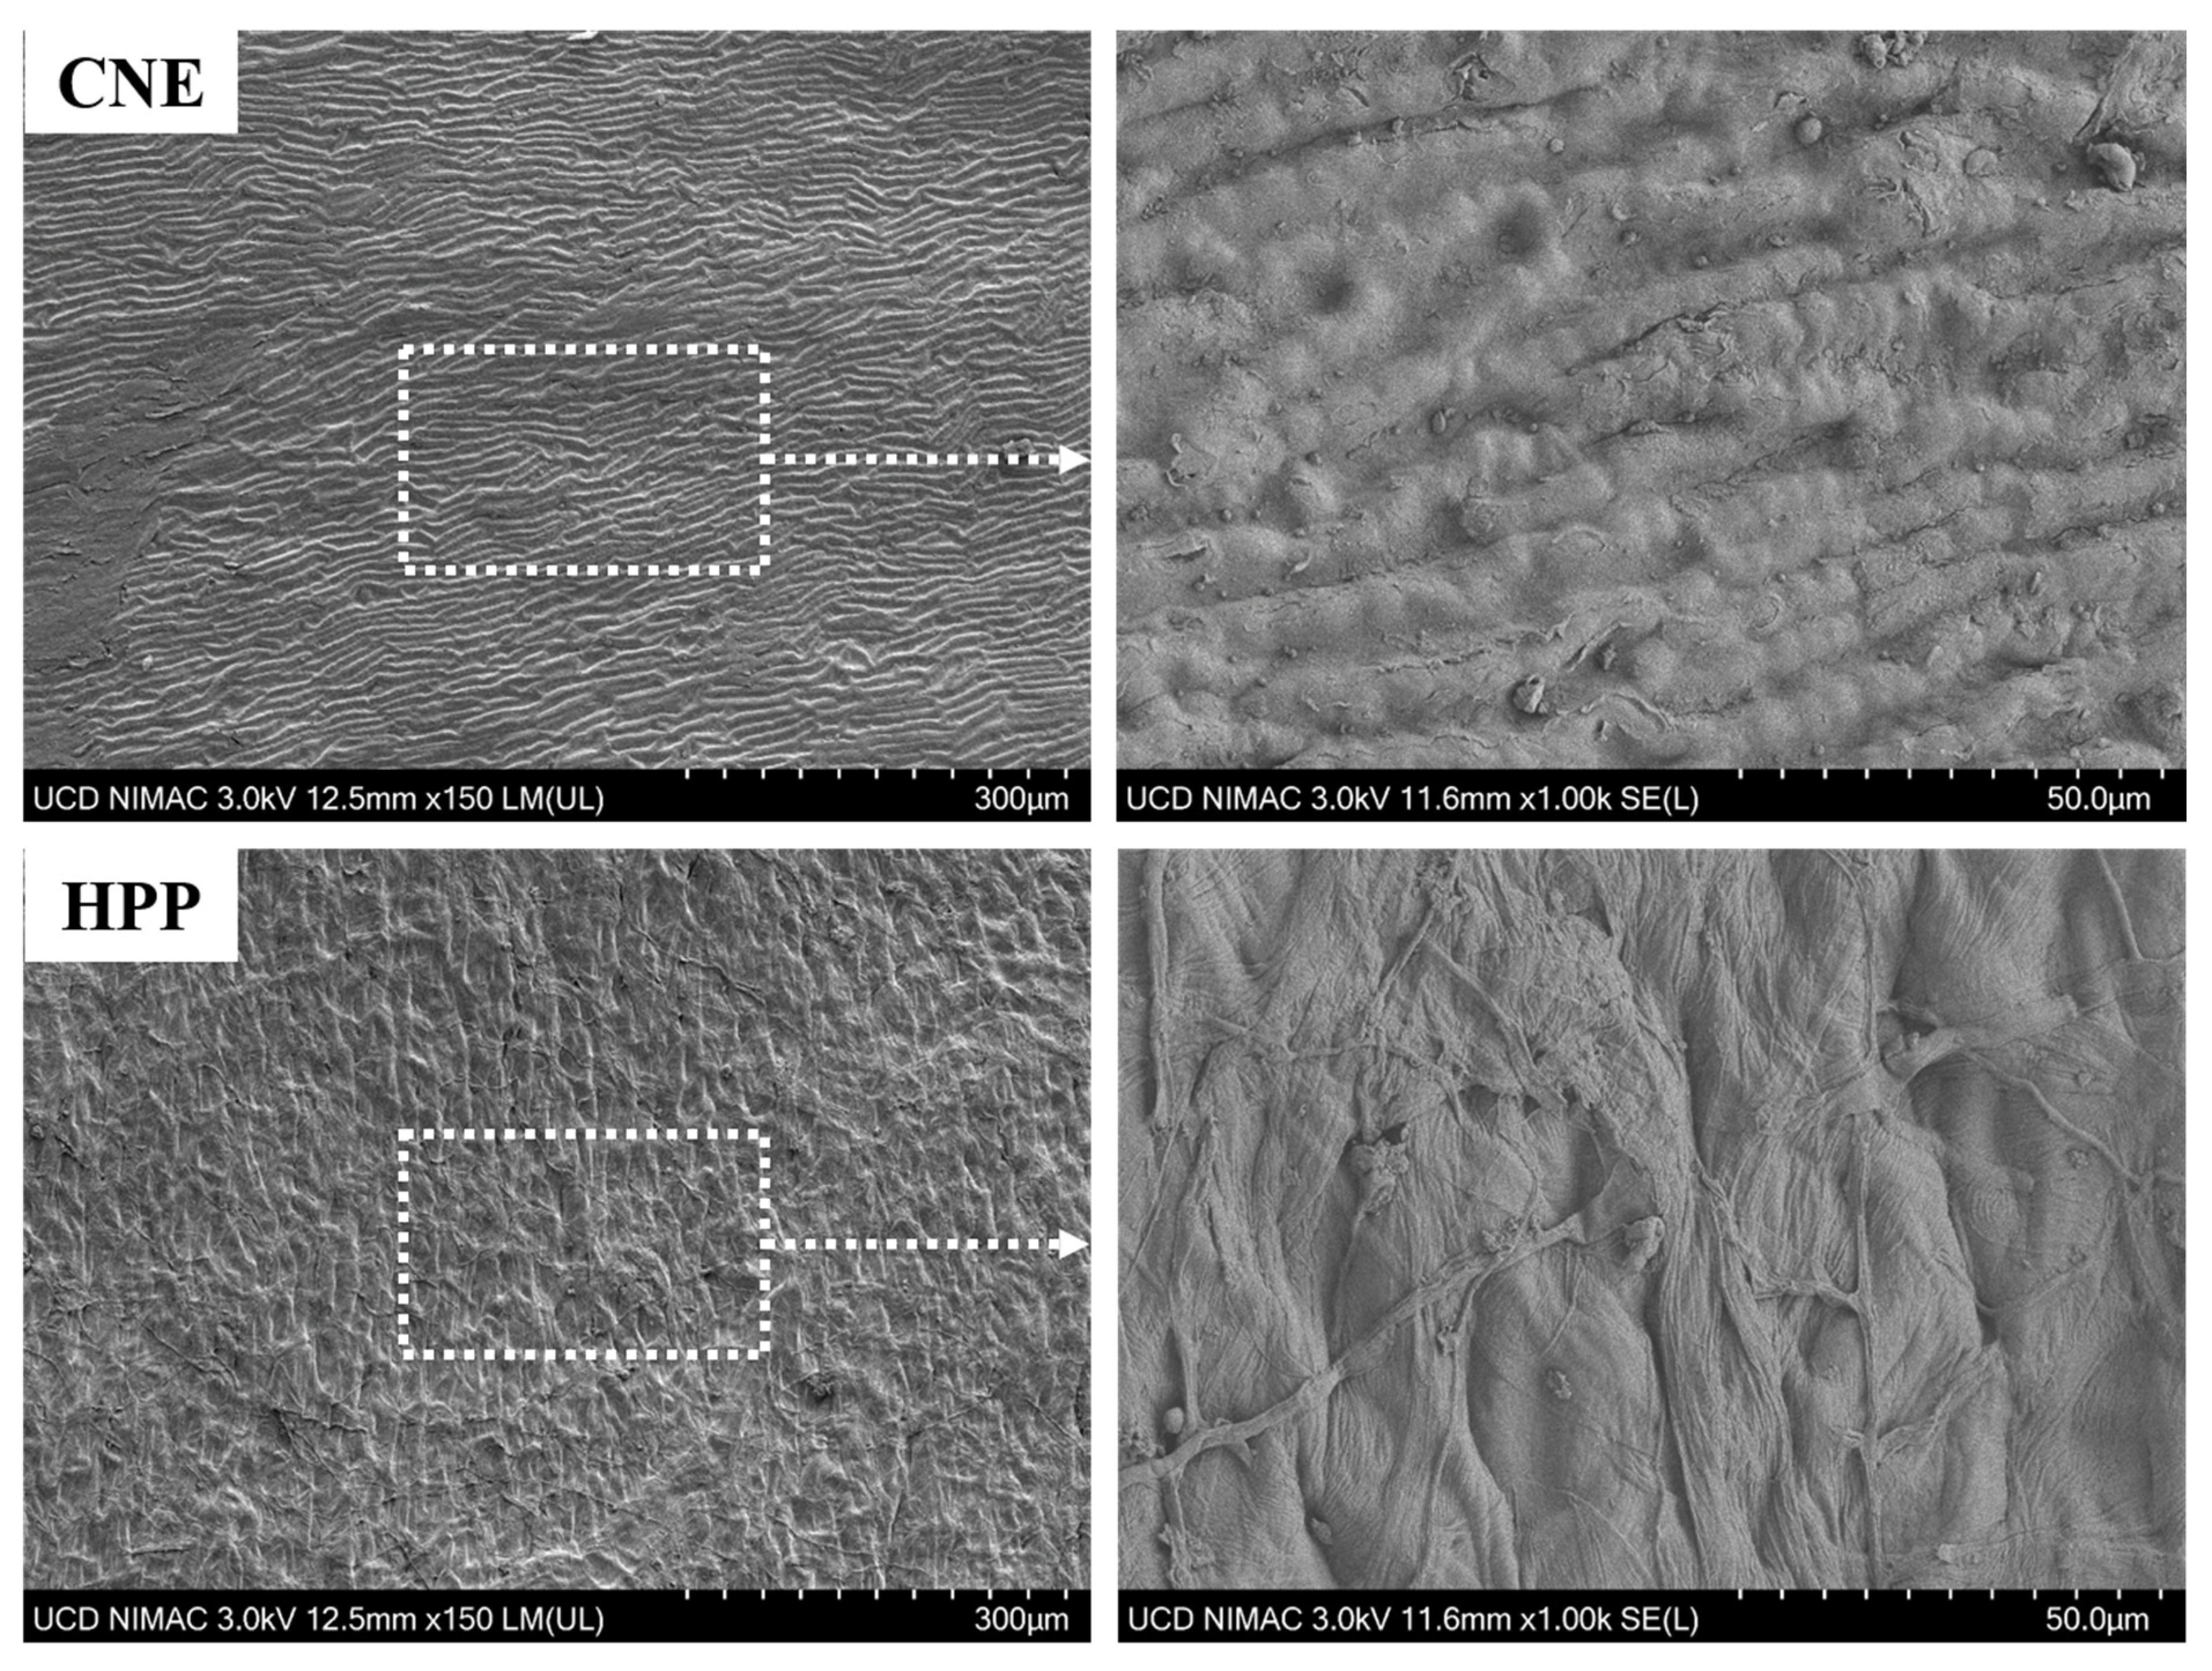
3.5. Microstructure Characteristics of Buckwheat Hull

Based on the results of TPC, DPPH, FRAP, and phenolic profile, residues of the most promising treatments were selected and prepared for SEM imaging. SEM images were acquired to investigate the structural appearance of buckwheat hull before and after novel treatments. Figure 6 shows the untreated samples (CNE) with a gradients structure aligned with small fiber threads. In the ultra-zoom image of CNE, it can be seen that each fiber thread structure contains circular globular projections attached in a chain. However, in the case of HPP-treated sample residues, a clear variation in its structure can be observed. The fiber thread structure has been corroded with irregular cracks, and the globular structure has been degraded into a root-like structure in the ultra-zoom image. However, some previously published studies on the structural images of buckwheat hull did not match with the observations reported in this study [51,52]. However, a recent study reported that the structure of buckwheat hull is similar to small line folds with irregular lamellar projections [53], which is in agreement with the current study. It can be concluded that the relatively higher phenolic concentration levels found in extracts using HPP compared to the other extracts are due to the maximum damage that occurred to its cellular structure.

4. Conclusions

Extraction yield, TPC, DPPH, FRAP, and phenolic profile significantly varied among the buckwheat hull extracts obtained using selected novel strategies. The results suggested that the extraction parameters and strategies employed played a major role in enhancing the level of phenolic compound extraction from buckwheat hull. Overall, samples extracted using HPP had the highest extraction yield and antioxidant properties. However, the highest content of TPC was recorded in EAE samples. In addition, irrespective of the extraction technique employed, ligan and quinone groups were found in high amounts, while the anthocyanin and flavone contents were low. However, anthocyanins and flavones were only identified in samples extracted using novel strategies, whereas conventional and control samples were limited to ligan and quinone groups of phenolic compounds. Further studying is required to enhance the extraction level of phenolic compounds and to investigate the sensory and color properties of the buckwheat hull extracts to confirm their suitability for food formulation applications.

Author Contributions

S.N., C.O. and B.K.T.: work design. S.N., A.J. and B.K.: experimentation. S.N. and M.Z.: data analysis. S.N., M.Z., C.O. and B.K.T.: manuscript preparation. All authors have read and agreed to the published version of the manuscript.

Funding

This research was financially supported by the BiOrbic SFI Bioeconomy Research Centre, which is funded by Ireland’s European Structural and Investment Programmes, Science Foundation Ireland (16/RC/3889) and the European Regional Development Fund.

Institutional Review Board Statement

Not applicable.

Informed Consent Statement

Not applicable.

Data Availability Statement

Not applicable.

Acknowledgments

We are grateful to UCD for their collaboration.

Conflicts of Interest

The authors declare that they have no known competing financial interests or personal relationships that could have appeared to influence the work reported in this paper.

References

  1. Ohnishi, O. Search for the wild ancestor of buckwheat III. The wild ancestor of cultivated common buckwheat, and of tatary buckwheat. Econ. Bot. 1998, 52, 123–133. [Google Scholar] [CrossRef]
  2. Liu, Q.; Yao, H. Antioxidant activities of barley seeds extracts. Food Chem. 2007, 102, 732–737. [Google Scholar] [CrossRef]
  3. Lee, L.-S.; Choi, E.-J.; Kim, C.-H.; Sung, J.-M.; Kim, Y.-B.; Seo, D.-H.; Choi, H.-W.; Choi, Y.-S.; Kum, J.-S.; Park, J.-D. Contribution of flavonoids to the antioxidant properties of common and tartary buckwheat. J. Cereal Sci. 2016, 68, 181–186. [Google Scholar] [CrossRef]
  4. Dziadek, K.; Kopeć, A.; Pastucha, E.; Piątkowska, E.; Leszczyńska, T.; Pisulewska, E.; Witkowicz, R.; Francik, R. Basic chemical composition and bioactive compounds content in selected cultivars of buckwheat whole seeds, dehulled seeds and hulls. J. Cereal Sci. 2016, 69, 1–8. [Google Scholar] [CrossRef]
  5. Zduńczyk, Z.; Flis, M.; Zieliński, H.; Wróblewska, M.; Antoszkiewicz, Z.; Juśkiewicz, J. In vitro antioxidant activities of barley, husked oat, naked oat, triticale, and buckwheat wastes and their influence on the growth and biomarkers of antioxidant status in rats. J. Agric. Food Chem. 2006, 54, 4168–4175. [Google Scholar] [CrossRef]
  6. Holasova, M.; Fiedlerova, V.; Smrcinova, H.; Orsak, M.; Lachman, J.; Vavreinova, S. Buckwheat—The source of antioxidant activity in functional foods. Food Res. Int. 2002, 35, 207–211. [Google Scholar] [CrossRef]
  7. Lu, L.; Murphy, K.; Baik, B.K. Genotypic variation in nutritional composition of buckwheat groats and husks. Cereal Chem. 2013, 90, 132–137. [Google Scholar] [CrossRef]
  8. Sedej, I.; Sakač, M.; Mandić, A.; Mišan, A.; Tumbas, V.; Čanadanović-Brunet, J. Buckwheat (Fagopyrum esculentum Moench) grain and fractions: Antioxidant compounds and activities. J. Food Sci. 2012, 77, C954–C959. [Google Scholar] [CrossRef]
  9. Mackėla, I.; Andriekus, T.; Venskutonis, P.R. Biorefining of buckwheat (Fagopyrum esculentum) hulls by using supercritical fluid, Soxhlet, pressurized liquid and enzyme-assisted extraction methods. J. Food Eng. 2017, 213, 38–46. [Google Scholar] [CrossRef]
  10. Kim, S.-H.; Cui, C.-B.; Kang, I.-J.; Kim, S.Y.; Ham, S.-S. Cytotoxic effect of buckwheat (Fagopyrum esculentum Moench) hull against cancer cells. J. Med. Food 2007, 10, 232–238. [Google Scholar] [CrossRef]
  11. Čabarkapa, I.S.; Sedej, I.J.; Sakač, M.B.; Šarić, L.Č.; Plavšić, D.V. Antimicrobial activity of buckwheat (Fagopyrum esculentum Moench) hulls extract. Food Process. Qual. Saf. 2008, 35, 159–163. [Google Scholar]
  12. Li, T.; Yang, Y.; Wang, X.; Dai, W.; Zhang, L.; Piao, C. Flavonoids derived from buckwheat hull can break advanced glycation end-products and improve diabetic nephropathy. Food Funct. 2021, 12, 7161–7170. [Google Scholar] [CrossRef]
  13. Li, P.; Tang, Y.; Liu, L.; Wang, D.; Zhang, L.; Piao, C. Therapeutic potential of buckwheat hull flavonoids in db/db mice, a model of type 2 diabetes. J. Funct. Foods 2019, 52, 284–290. [Google Scholar] [CrossRef]
  14. Zielinska, D.; Szawara-Nowak, D.; Zielinski, H. Antioxidative and anti-glycation activity of buckwheat hull tea infusion. Int. J. Food Prop. 2013, 16, 228–239. [Google Scholar] [CrossRef]
  15. Huang, Y.; Feng, F.; Jiang, J.; Qiao, Y.; Wu, T.; Voglmeir, J.; Chen, Z.-G. Green and efficient extraction of rutin from tartary buckwheat hull by using natural deep eutectic solvents. Food Chem. 2017, 221, 1400–1405. [Google Scholar] [CrossRef]
  16. Yang, X.; Lv, Y.-P. Purification, characterization, and DNA damage protection of active components from tartary buckwheat (Fagopyrum tataricum) hull. Food Sci. Biotechnol. 2015, 24, 1959–1966. [Google Scholar] [CrossRef]
  17. Garcia-Vaquero, M.; Ravindran, R.; Walsh, O.; O’Doherty, J.; Jaiswal, A.K.; Tiwari, B.K.; Rajauria, G. Evaluation of Ultrasound, Microwave, Ultrasound–Microwave, Hydrothermal and High Pressure Assisted Extraction Technologies for the Recovery of Phytochemicals and Antioxidants from Brown Macroalgae. Mar. Drugs 2021, 19, 309. [Google Scholar] [CrossRef]
  18. Zhu, X.; Zhang, Z.; Hinds, L.M.; Sun, D.-W.; Tiwari, B.K. Applications of ultrasound to enhance fluidized bed drying of Ascophyllum Nodosum: Drying kinetics and product quality assessment. Ultrason. Sonochem. 2021, 70, 105298. [Google Scholar] [CrossRef]
  19. Li, Y.; Zhao, M.; Gomez, L.P.; Senthamaraikannan, R.; Padamati, R.B.; O’Donnell, C.P.; Tiwari, B.K. Investigation of enzyme-assisted methods combined with ultrasonication under a controlled alkali pretreatment for agar extraction from Gelidium sesquipedale. Food Hydrocoll. 2021, 120, 106905. [Google Scholar] [CrossRef]
  20. Altemimi, A.B.; Al-Hilphy, A.R.; Abedelmaksoud, T.G.; Aboud, S.A.; Badwaik, L.S.; Noore, S.; Pratap-Singh, A. Infrared Radiation Favorably Influences the Quality Characteristics of Key Lime Juice. Appl. Sci. 2021, 11, 2842. [Google Scholar] [CrossRef]
  21. Lopes, A.P.; Galuch, M.B.; Petenuci, M.E.; Oliveira, J.H.; Canesin, E.A.; Schneider, V.V.A.; Visentainer, J.V. Quantification of phenolic compounds in ripe and unripe bitter melons (Momordica charantia) and evaluation of the distribution of phenolic compounds in different parts of the fruit by UPLC–MS/MS. Chem. Pap. 2020, 74, 2613–2625. [Google Scholar] [CrossRef]
  22. Noore, S.; Ramesh, G.; Vendan, S.E.; Nagaraju, V. Persistence and diffusion behaviour of chlorpyrifos in five different species of vegetables: A comparative analysis. Ecotoxicol. Environ. Saf. 2021, 217, 112208. [Google Scholar] [CrossRef]
  23. Murtey, M.D.; Ramasamy, P. Sample preparations for scanning electron microscopy–life sciences. Mod. Electron Microsc. Phys. Life Sci. 2016, 161–185. [Google Scholar]
  24. Miron, T.; Herrero, M.; Ibáñez, E. Enrichment of antioxidant compounds from lemon balm (Melissa officinalis) by pressurized liquid extraction and enzyme-assisted extraction. J. Chromatogr. A 2013, 1288, 1–9. [Google Scholar] [CrossRef] [Green Version]
  25. Fernández, K.; Vega, M.; Aspé, E. An enzymatic extraction of proanthocyanidins from País grape seeds and skins. Food Chem. 2015, 168, 7–13. [Google Scholar] [CrossRef]
  26. Teles, A.S.C.; Chávez, D.W.H.; Coelho, M.A.Z.; Rosenthal, A.; Gottschalk, L.M.F.; Tonon, R.V. Combination of enzyme-assisted extraction and high hydrostatic pressure for phenolic compounds recovery from grape pomace. J. Food Eng. 2021, 288, 110128. [Google Scholar] [CrossRef]
  27. Sharif, T.; Bhatti, H.N.; Bull, I.D.; Bilal, M. Recovery of high-value bioactive phytochemicals from agro-waste of mango (Mangifera indica L.) using enzyme-assisted ultrasound pretreated extraction. Biomass Convers. Biorefin. 2021, 2021, 1–9. [Google Scholar] [CrossRef]
  28. Martillanes, S.; Ayuso-Yuste, M.C.; Bernalte, M.J.; Gil, M.V.; Delgado-Adámez, J. Cellulase-assisted extraction of phenolic compounds from rice bran (Oryza sativa L.): Process optimization and characterization. J. Food Meas. Charact. 2021, 15, 1719–1726. [Google Scholar] [CrossRef]
  29. Wang, W.; Gao, Y.-T.; Wei, J.-W.; Chen, Y.-F.; Liu, Q.-L.; Liu, H.-M. Optimization of Ultrasonic Cellulase-Assisted Extraction and Antioxidant Activity of Natural Polyphenols from Passion Fruit. Molecules 2021, 26, 2494. [Google Scholar] [CrossRef]
  30. Donsì, F.; Ferrari, G.; Pataro, G. Applications of pulsed electric field treatments for the enhancement of mass transfer from vegetable tissue. Food Eng. Rev. 2010, 2, 109–130. [Google Scholar] [CrossRef]
  31. Balasa, A.; Toepfl, S.; Knorr, D. Impact of pulsed electric field treatment on polyphenolic content of grapes. In Control Applications in Post-Harvest and Processing Technology (CAPPT 2006); Leibniz Institute of Agricultural Engineering and Bio-economy e.V.: Potsdam, Germany, 2006; p. 169. [Google Scholar]
  32. Luengo, E.; Álvarez, I.; Raso, J. Improving the pressing extraction of polyphenols of orange peel by pulsed electric fields. Innov. Food Sci. Emerg. Technol. 2013, 17, 79–84. [Google Scholar] [CrossRef]
  33. Wiktor, A.; Sledz, M.; Nowacka, M.; Rybak, K.; Chudoba, T.; Lojkowski, W.; Witrowa-Rajchert, D. The impact of pulsed electric field treatment on selected bioactive compound content and color of plant tissue. Innov. Food Sci. Emerg. Technol. 2015, 30, 69–78. [Google Scholar] [CrossRef]
  34. Rajha, H.N.; Abi-Khattar, A.-M.; El Kantar, S.; Boussetta, N.; Lebovka, N.; Maroun, R.G.; Louka, N.; Vorobiev, E. Comparison of aqueous extraction efficiency and biological activities of polyphenols from pomegranate peels assisted by infrared, ultrasound, pulsed electric fields and high-voltage electrical discharges. Innov. Food Sci. Emerg. Technol. 2019, 58, 102212. [Google Scholar] [CrossRef]
  35. Zderic, A.; Zondervan, E.; Meuldijk, J. Breakage of cellular tissue by pulsed electric field: Extraction of polyphenols from fresh tea leaves. Chem. Eng. Trans. 2013, 32, 1795–1800. [Google Scholar]
  36. Einarsdóttir, R.; Þórarinsdóttir, K.A.; Aðalbjörnsson, B.V.; Guðmundsson, M.; Marteinsdóttir, G.; Kristbergsson, K. The effect of pulsed electric field-assisted treatment parameters on crude aqueous extraction of Laminaria digitata. J. Appl. Phycol. 2021, 33, 3287–3296. [Google Scholar] [CrossRef]
  37. Knorr, D. Effects of high-hydrostatic-pressure processes on food safety and quality. Food Technol. 1993, 47, 156–161. [Google Scholar]
  38. Altuner, E.M.; Işlek, C.; Çeter, T.; Alpas, H. High hydrostatic pressure extraction of phenolic compounds from Maclura pomifera fruits. Afr. J. Biotechnol. 2012, 11, 930–937. [Google Scholar]
  39. Corrales, M.; Toepfl, S.; Butz, P.; Knorr, D.; Tauscher, B. Extraction of anthocyanins from grape by-products assisted by ultrasonics, high hydrostatic pressure or pulsed electric fields: A comparison. Innov. Food Sci. Emerg. Technol. 2008, 9, 85–91. [Google Scholar] [CrossRef]
  40. Strati, I.F.; Gogou, E.; Oreopoulou, V. Enzyme and high pressure assisted extraction of carotenoids from tomato waste. Food Bioprod. Process. 2015, 94, 668–674. [Google Scholar] [CrossRef]
  41. Noore, S.; Rastogi, N.K.; O’Donnell, C.; Tiwari, B. Novel bioactive extraction and nano-encapsulation. Encyclopedia 2021, 1, 632–664. [Google Scholar] [CrossRef]
  42. Younas, U.; Iqbal, S.; Bashir, R.; Sajjad, N.; Saeed, Z.; Pervaiz, M.; Hassan, F.; Ali, F.; Ibrahim, S.; Batool, F. An Eco-Friendly Approach for the Extraction of Antioxidant Components from Artemisia Annua Leaves Using Response Surface Methodology. Pol. J. Environ. Stud. 2021, 30, 4827–4833. [Google Scholar] [CrossRef]
  43. Guo, X.-D.; Wu, C.-S.; Ma, Y.-J.; Parry, J.; Xu, Y.-Y.; Liu, H.; Wang, M. Comparison of milling fractions of tartary buckwheat for their phenolics and antioxidant properties. Food Res. Int. 2012, 49, 53–59. [Google Scholar] [CrossRef]
  44. Lin, L.-Y.; Liu, H.-M.; Yu, Y.-W.; Lin, S.-D.; Mau, J.-L. Quality and antioxidant property of buckwheat enhanced wheat bread. Food Chem. 2009, 112, 987–991. [Google Scholar] [CrossRef]
  45. Hemery, Y.M.; Anson, N.M.; Havenaar, R.; Haenen, G.R.; Noort, M.W.; Rouau, X. Dry-fractionation of wheat bran increases the bioaccessibility of phenolic acids in breads made from processed bran fractions. Food Res. Int. 2010, 43, 1429–1438. [Google Scholar] [CrossRef]
  46. Steadman, K.J.; Burgoon, M.S.; Lewis, B.A.; Edwardson, S.E.; Obendorf, R.L. Minerals, phytic acid, tannin and rutin in buckwheat seed milling fractions. J. Sci. Food Agric. 2001, 81, 1094–1100. [Google Scholar] [CrossRef]
  47. Verardo, V.; Arráez-Román, D.; Segura-Carretero, A.; Marconi, E.; Fernandez-Gutierrez, A.; Caboni, M.F. Determination of free and bound phenolic compounds in buckwheat spaghetti by RP-HPLC-ESI-TOF-MS: Effect of thermal processing from farm to fork. J. Agric. Food Chem. 2011, 59, 7700–7707. [Google Scholar] [CrossRef]
  48. Kim, S.-J.; Zaidul, I.; Suzuki, T.; Mukasa, Y.; Hashimoto, N.; Takigawa, S.; Noda, T.; Matsuura-Endo, C.; Yamauchi, H. Comparison of phenolic compositions between common and tartary buckwheat (Fagopyrum) sprouts. Food Chem. 2008, 110, 814–820. [Google Scholar] [CrossRef]
  49. Zhang, W.; Zhu, Y.; Liu, Q.; Bao, J.; Liu, Q. Identification and quantification of polyphenols in hull, bran and endosperm of common buckwheat (Fagopyrum esculentum) seeds. J. Funct. Foods 2017, 38, 363–369. [Google Scholar] [CrossRef]
  50. Przybylski, R.; Lee, Y.; Eskin, N. Antioxidant and radical-scavenging activities of buckwheat seed components. J. Am. Oil Chem. Soc. 1998, 75, 1595. [Google Scholar] [CrossRef]
  51. Li, K.; Zhang, Y.; Dang, Y.; Wei, H.; Wang, Q. Removal of Cr (VI) from aqueous solutions using buckwheat (Fagopyrum esculentum Moench) hull through adsorption-reduction: Affecting factors, isotherm, and mechanisms. CLEAN–Soil Air Water 2014, 42, 1549–1557. [Google Scholar] [CrossRef]
  52. Kulokas, M.; Praspaliauskas, M.; Pedišius, N. Investigation of buckwheat hulls as additives in the production of solid biomass fuel from straw. Energies 2021, 14, 265. [Google Scholar] [CrossRef]
  53. Yu, K.; Zhang, Z.; Liang, J.; Liang, C. Natural biomass-derived porous carbons from buckwheat hulls used as anode for lithium-ion batteries. Diam. Relat. Mater. 2021, 119, 108553. [Google Scholar] [CrossRef]
Figure 1. Schematic workflow of the bioactive extraction protocols employed to obtain phenolic extracts from buckwheat hull.
Processes 10 00365 g001
Figure 2. Extraction yields of buckwheat hull extracts using twenty-four extraction strategies, including the control (CNE), conventional-assisted extraction (CAE), ultrasound-assisted extraction (UAE), microwave-assisted extraction (MAE), high-pressure processing (HPP), pulsed electric fields (PEF), and enzyme assisted extraction (EAE) treatments and one control. (Note: results are expressed as the mean ± standard deviation). Extraction yields of extraction strategies that share similar capital letters (A–L) are not significantly different from each other. Whereas small letters (a–d) represent a significant difference between variations in the protocols of each treatment (p < 0.05).
Processes 10 00365 g002
Figure 3. (a) Principal component analysis (PCA) score plot of PC1 and PC2; (b) PCA loading intensity plots based on the contents of the total phenolic content (TPC), and antioxidants (DPPH and FRAP) detected in the buckwheat hull extracts using different extraction strategies.
Processes 10 00365 g003
Figure 4. Composition of the phenolic groups identified in the extract obtained from buckwheat hull employing extraction strategies, including conventional-assisted extraction (CAE-SO (soaking)), pulsed electric fields (PEF-3 (PEF-24 kV-10 KJ-200 Hz-5 μs)), high-pressure processing (HPP), microwave-assisted extraction (MAE), and ultrasound-assisted extraction (UAE) treatments.
Processes 10 00365 g004
Figure 5. Pearson correlation matrix of several compounds identified in each phenolic group in extracts obtained from buckwheat hull. The sign of the correlations is color-coded (yellow = + and deep blue = −) and the strength of the correlations (1 to –1) relates to the depth of each color. Abbreviations in the figure are as follows: conventional-assisted extraction-soaking (SO); pulsed electric fields-24 kV-10 KJ-200 Hz-5 μs (PEF-3) high-pressure processing (200 MPa-4 min, 200 MPa-8 min, 400 MPa-4 min, and 400 MPa-8 min); microwave-assisted extraction (LP-1 min, HP-1 min, LP-10 s, and HP 10 s); and ultrasound-assisted extraction (10 min 4 °C; 30 min 4 °C).
Processes 10 00365 g005
Figure 6. Scanning electron micrographs of the surface structure of Buckwheat hull before and after novel extraction at magnifications—300 µm and 50 µm.
Processes 10 00365 g006
Table 2. A summary of the phenolic compounds and their relative concentrations estimated in buckwheat hull extracts using CAE, PEF, HPP, MAE, and UAE extraction strategies.
Phenolic ProfileRelative Concentration (%)
GroupsCompound NameRT (min)CAEPEFHPPMAEUAE
SOPEF-3200 Mpa-4 min200 Mpa-8 min400 Mpa-4 min400 Mpa-8 minLP-1 minHP-1 minLP-10 sHP-10 s10 min- 4 °C30 min- 4 °C
AnthocyaninPelargonidin0.33-----------0.74
Pelargonidin 3-O-(6″-succinyl-glucoside)9.47------1.82-----
Flavanol(+)-Catechin 3-O-gallate0.39--------1.14---
(−)-Epicatechin 3-O-gallate0.39--------1.14---
FlavanonesApigenin 6-C-glucoside0.39--1.30.61---19.614.9616.94--
Pongamoside B9.45---1.42--------
O-Methylovaliflavanone C15.55---0.48--------
6-Geranylnaringenin15.57-0.720.410.540.250.545.746.869.4510.270.490.31
FlavonesDihydroquercetin 3-O-rhamnoside0.4-------3.59----
Apigenin-6-glucoside0.4-----0.62------
FlavonolsKaempferol 3-O-glucuronid0.38--0.31---------
Pyrogallol0.39- 0.39 0.180.18 0.39
Syringetin-3-glucuronide0.4-----------0.13
Quercetine 3-O-acetyl-rhamnoside0.42----0.210.21------
Quercetine-3-O-xylosyl15.3---------2.95--
Hydroxybenzoic acids (Phenolic acid)Gallic acid0.39--------14.516.361.031.45
6-Gingerol12.8-------9.64----
Hydroxycinnamic acids (Phenolic Acids)Oleuropein-aglycone0.38-0.06----------
Ferulic acid0.39--0.45---5.17-----
Caffeic acid0.39--0.88---5.55-----
5–8′-Dehydrodiferulic acid0.41-----0.55-19.113.116.39--
5–8′-Dehydroferulic acid0.41--1.280.61--------
p-Coumaric acid 4-O-glucoside0.41-------17.83----
o-Coumaric acid0.44------4.65-7.522.85--
Daidzin6.3-------0.98----
4-Vinylsyringol8.721.250.961.290.581.711.319.256.056.923.121.21.75
Carnosol10.44---------2.81--
isoacitrein11.58----------51.32-
Isoacitretin11.9544.7440.6287.44 31.694.35-----48.65
IsoflavonesGenistin0.41--------14.96---
Broussonin C9.4752.5555.864.0194.8364.280.47---0.7944.3445.16
Glycitin15.33-0.07----------
LignanPterostilbene8.731.270.981.320.591.771.319.196.277.13 1.221.8
Todolactol A8.87-0.17----------
9-Azabicyclo [1.3.3]nonane,1H-indazole-3-carboxamide deriv.9.43-------5.64----
Conidendrin9.57-------1.17----
Secoisolariciresinol10.110.190.570.740.26-0.293.971.47.577.51--
Estra-1,3,5(10),16-tetran-3-ol benzoate15.15------8.3-----
QuinonesN-(p-Hydroxyphenethyl) actinidine9.47------24.49-----
O-Desmethylquinidine12.81--------1.62---
Sinapine15.13--0.160.08-0.191.881.88----
The total number of compounds detected5913107111113121078
RT—Retention Time; CAE—Conventional-Assisted Extraction; SO—Soaking; PEF-3—Pulsed Electric Field (PEF—24 kv-10 kj-200 Hz-5 μs); HPP—High-Pressure Processing; MAE—Microwave-assisted extraction; UAE—Ultrasound-assisted extraction.
Publisher’s Note: MDPI stays neutral with regard to jurisdictional claims in published maps and institutional affiliations.

