
Heat Transfer Models for Dense Pulverized Particle Jets


Abstract
:1. Introduction
2. Heat Transfer Modeling in Lagrangian Parcels
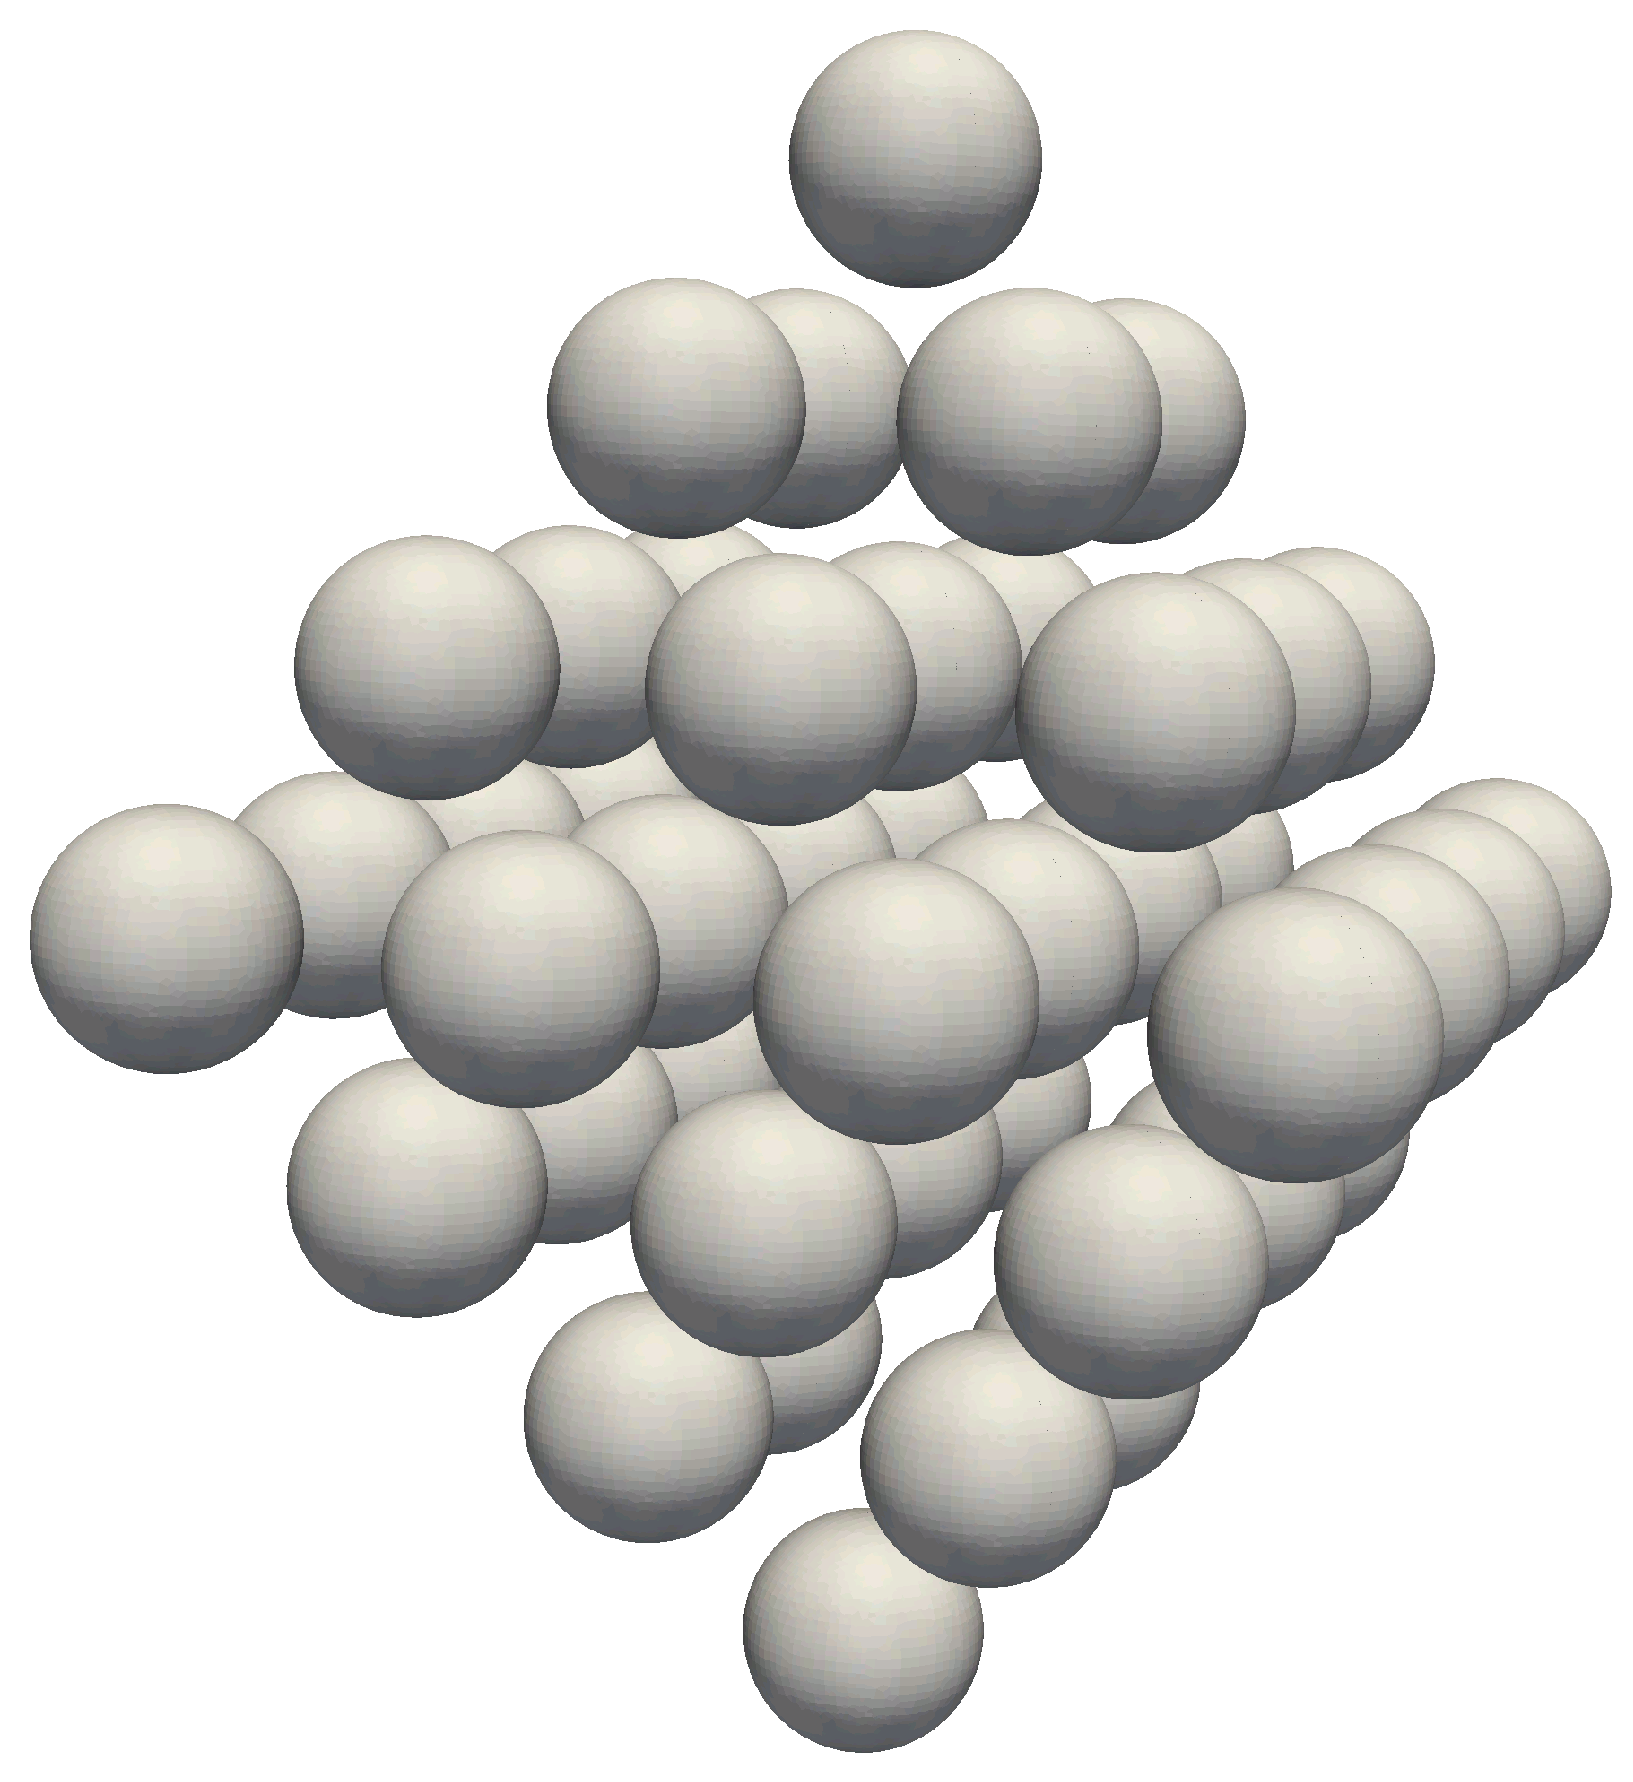
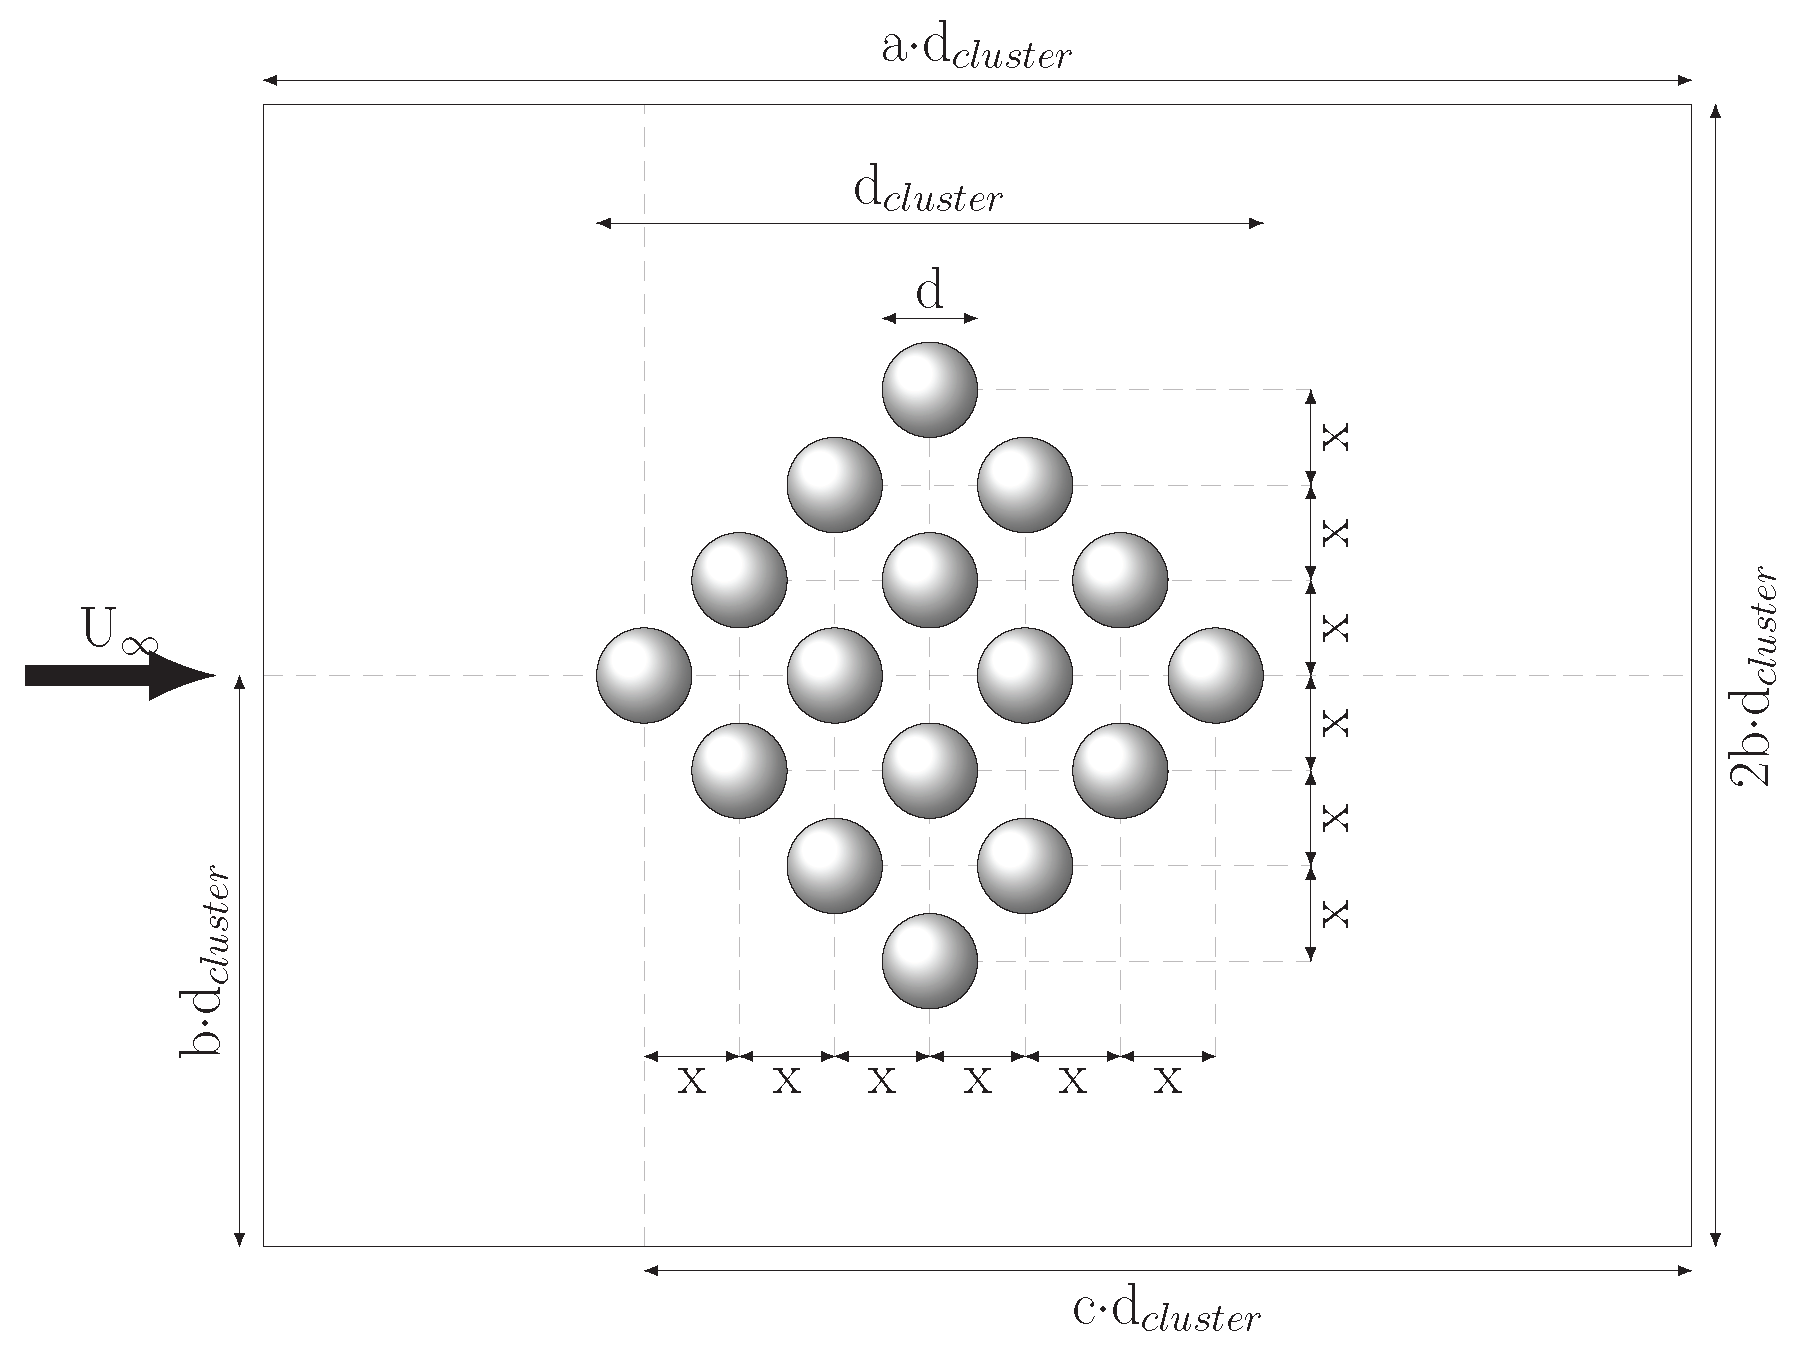
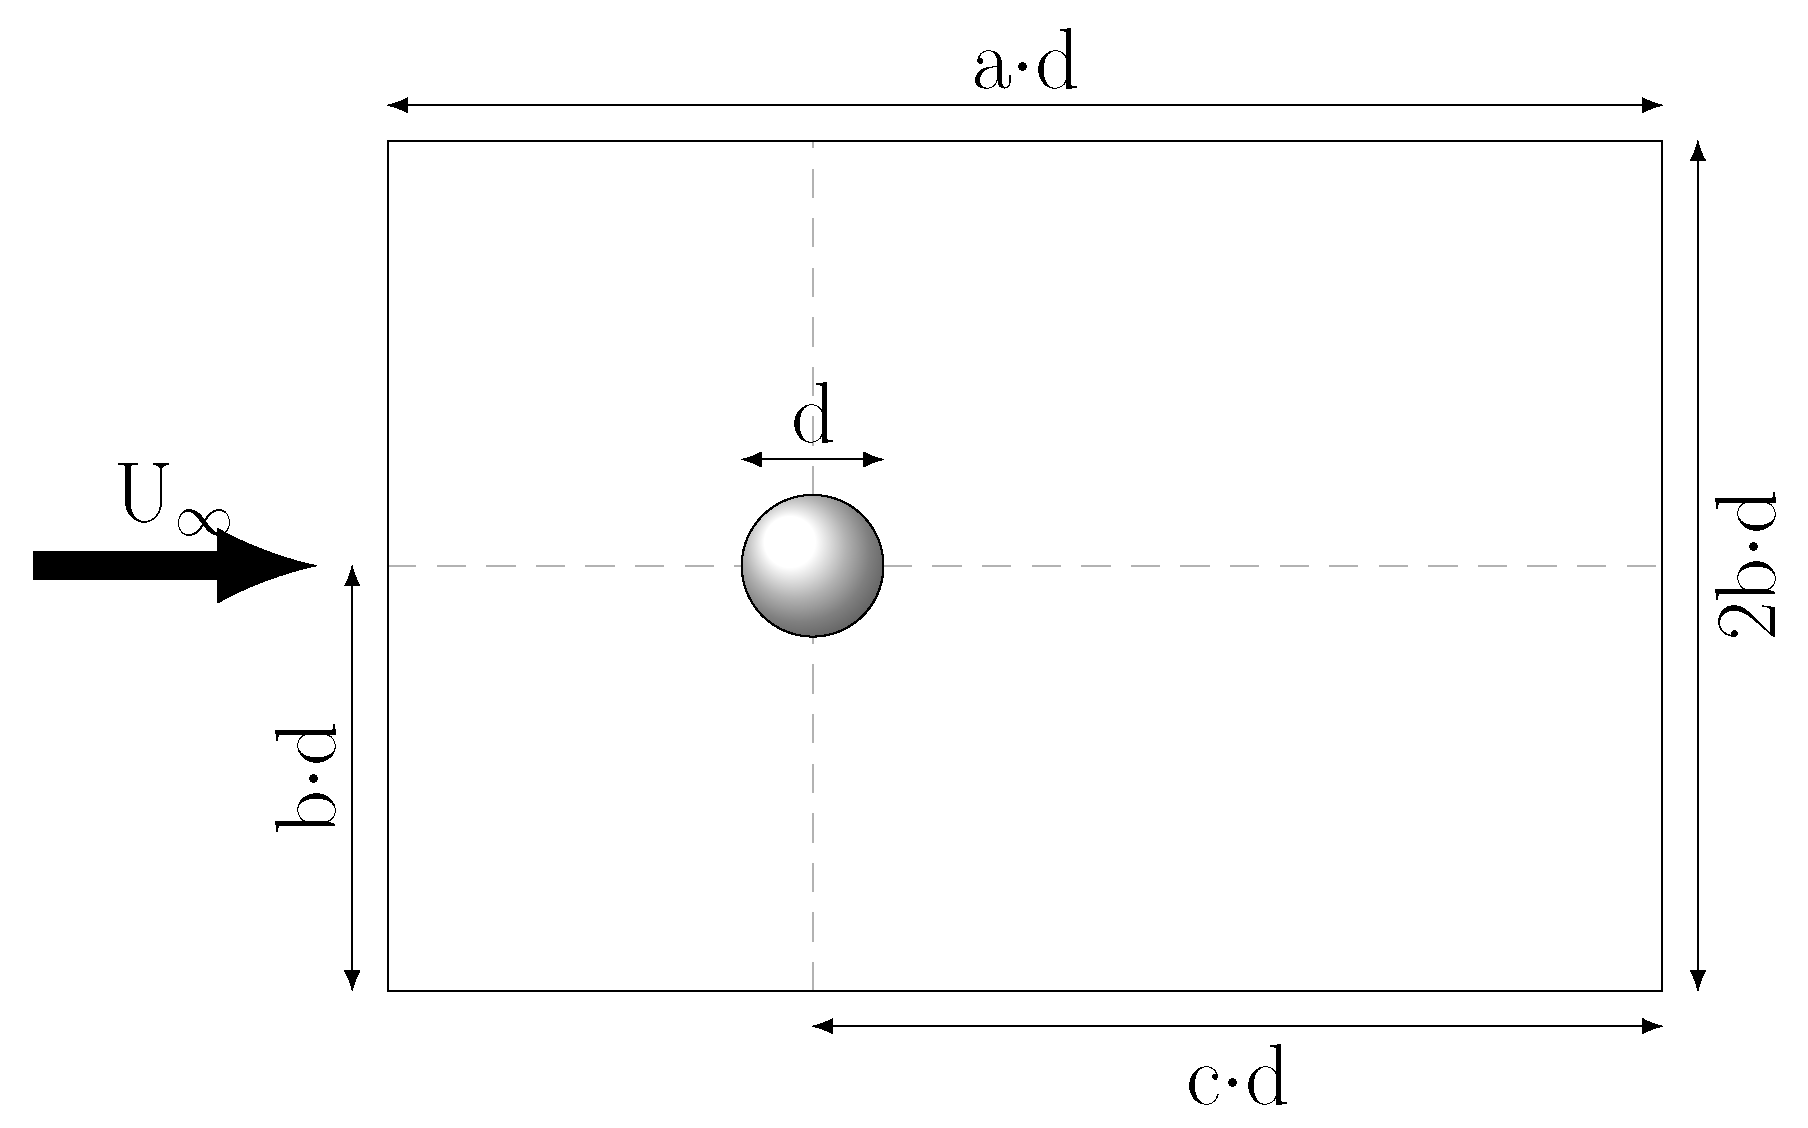
3. Synthetic Particle Cluster
 ) and red (
  ) graphs in Figure 3 and Figure 4). The additional radiative heat flux causes faster heat-up, while the flow independent radiative heat flux can explain the decreasing temperature variations. These results are in line with the findings of Haugen [12], Forgber and Radl [15].
4. Single Sphere Reference Cases
- size equivalent case (SE)
- mass equivalent case (ME),
- surface area equivalent case (AE), and
- surface area and mass equivalent case (AME).
5. Cluster Heat Transfer Models
5.1. Projected Surface Area Correction
5.2. Convective Heat Transfer Model
5.2.1. Multiple Linear Regression Approach (MLR)
5.2.2. Lévêque Approach (GLE)
Drag Coefficient
Nusselt Number
5.3. Comparison with Random Cluster Simulations
5.4. Comparison of Nusselt Correlations from Literature
6. Euler–Lagrangian Validation Simulations
6.1. Convective Heat Transfer Model Validation
6.2. Projected Surface Area Correction Validation
7. Summary and Conclusions
Author Contributions
Funding
Data Availability Statement
Acknowledgments
Conflicts of Interest
Symbols
Latin Symbols
| symbol | unit | description |
| A | [m2] | area |
| cp | [Jkg−1K−1] | specific heat capacity |
| d | [m] | diameter |
| d32 | [m] | Sauter diameter |
| e | [Jkg−1] | specific internal energy |
| Ff | [N] | drag force |
| f (φ) | [-] | radiation correction function |
| G | [Wm−2] | incident radiation |
| hconv | [Wm−2K−1] | convective heat transfer coefficient |
| I | [Wm−2] | radiative intensity |
| k | [-] | shape parameter of the Weibull distribution |
| L | [m] | length scale |
| m | [kg] | mass |
| Np | [-] | number of particles |
| Nu | [-] | Nusselt number |
| Pr | [-] | Prandtl number |
| Q | [W] | integral heat flux |
| R | [-] | coefficient of determination |
| ReP | [-] | particle Reynolds number |
| t | [s] | time |
| U | [ms−1] | velocity |
| x | [-] | distribution parameter |
| xf | [-] | frictional drag force share |
Greek Symbols
| symbol | unit | description |
| ε | [-] | emissivity |
| κ | [Wm−1K−1] | thermal conductivity |
| λ | [-] | scale parameter of the Weibull distribution |
| µ | [Pas] | dynamic viscosity |
| ν | [m2s−1] | kinematic viscosity |
| φ | [-] | void fraction |
| ρ | [kgm−3] | density |
| σ | [Wm−2K−4] | Stefan-Boltzmann constant |
| ξ | [-] | drag coefficient |
| ξf | [-] | drag coefficient due to fluid friction |
Subscripts
| symbol | description |
| C | cluster |
| conv | convective |
| GLE | Generalized Lévêque equation |
| h | hydraulic |
| ∞ | bulk fluid |
| MLR | multiple linear regression |
| P | particle |
| R | projected/illuminated |
| rad | radiative |
| rel | relative |
| S | surface |
Appendix A. Grid Independence Study
Appendix A.1. Synthetic Cluster

| Scaling Factors | = 2.058 | |||||
|---|---|---|---|---|---|---|
| id | a | b | c | (-) | Error (% of 4) | Error (% of 6) |
| 1 | 2.66 | 1.25 | 1.83 | 1.649 | 10.49 | 24.48 |
| 2 | 2.66 | 2.5 | 1.83 | 1.503 | 0.66 | 13.41 |
| 3 | 2.66 | 3.75 | 1.83 | 1.492 | 0.03 | 12.63 |
| 4 | 2.66 | 5 | 1.83 | 1.492 | - | 12.66 |
| 5 | 7 | 3.75 | 5.33 | 1.358 | - | 2.47 |
| 6 | 12 | 3.75 | 10 | 1.325 | - | - |
| Cell Size | (-) | Deviation (%) | (-) | Deviation (%) |
|---|---|---|---|---|
| −50% | 2.2341 | −0.62 | 0.3283 | −0.43 |
| −20% | 2.2257 | −0.25 | 0.3288 | −0.58 |
| base | 2.2202 | - | 0.3269 | - |
| +20% | 2.2122 | 0.36 | 0.3250 | 0.58 |
| +50% | 2.2059 | 0.65 | 0.3242 | 0.83 |
Appendix A.2. Representative Particle
| Scaling Factors | = 2.058 | = 51.469 | |||||||
|---|---|---|---|---|---|---|---|---|---|
| id | a | b | c | (-) | Error (% of 5) | (-) | (-) | Error (% of 5) | (-) |
| 1 | 15 | 4 | 11 | 15.353 | 6.65 | 15.153 | 1.579 | 2.38 | 1.569 |
| 2 | 19 | 6 | 13 | 14.765 | 2.57 | 1.556 | 0.88 | ||
| 3 | 23 | 8 | 15 | 14.586 | 1.33 | 1.549 | 0.42 | ||
| 4 | 27 | 10 | 17 | 14.474 | 0.55 | 1.546 | 0.21 | ||
| 5 | 37 | 15 | 22 | 14.394 | - | 1.542 | - | ||
| Cell Size | (-) | Deviation (%) | (-) | Error (%) | (-) | Deviation (%) | (-) | Error (%) | |
|---|---|---|---|---|---|---|---|---|---|
| −50% | 1.530 | 1.21 | 1.567 | 2.51 | 5.687 | −1.1 | 5.279 | −7.72 | |
| −20% | 1.545 | 0.24 | 1.567 | 1.55 | 5.639 | −0.25 | 5.279 | −6.82 | |
| base | 1.548 | - | 1.567 | 1.31 | 5.625 | - | 5.279 | −6.55 | |
| +20% | 1.550 | −0.11 | 1.567 | 1.21 | 5.618 | 0.12 | 5.279 | −6.45 | |
| +100% | 1.553 | −0.28 | 1.567 | 1.04 | 5.612 | 0.23 | 5.279 | −6.30 |
References
- Prokhorov, D.A.; Piralishvili, S.A. Numerical simulation of pulverized coal combustion and comparison with in-furnace measurements. AIP Conf. Proc. 2020, 2211, 040008. [Google Scholar] [CrossRef]
- Zheng, J.; Liu, P.; Shen, Z. Simulation of Turbulent Combustion in a Large Pulverized Coal Boiler Based on Turbulent Radiation Interaction and the Modified Soot Model. ACS Omega 2020, 5, 23822–23835. [Google Scholar] [CrossRef] [PubMed]
- Kuang, S.; Li, Z.; Yu, A. Review on Modeling and Simulation of Blast Furnace. Steel Res. Int. 2018, 89, 1700071. [Google Scholar] [CrossRef]
- Abhale, P.B.; Viswanathan, N.N.; Saxén, H. Numerical modelling of blast furnace—Evolution and recent trends. Miner. Process. Extr. Metall. 2020, 129, 166–183. [Google Scholar] [CrossRef]
- Konrad, K. Dense-phase pneumatic conveying: A review. Powder Technol. 1986, 49, 1–35. [Google Scholar] [CrossRef]
- Cai, L.; Liu, S.; Pan, X.; Guiling, X.; Xiaoping, C.; Changsui, Z. Influence of carbonaceous powders on flow characteristics of dense-phase pneumatic conveying at high pressure. Exp. Therm. Fluid Sci. 2014, 58, 121–130. [Google Scholar] [CrossRef]
- Liang, C.; Xu, P.; Xu, G.; Chen, X.; Zhao, C.; Duan, L. Comparison on Flow Characteristics of Dense-phase Pneumatic Conveying of Biomass Powder and Pulverized coal at High Pressure. Energy Source Part A Recover. Util. Environ. Eff. 2015, 37, 583–589. [Google Scholar] [CrossRef]
- Jin, Y.; Lu, H.; Guo, X.; Gong, X. Application of CPFD method in the simulation of vertical dense phase pneumatic conveying of pulverized coal. Powder Technol. 2019, 357, 343–351. [Google Scholar] [CrossRef]
- Puttinger, S.; Holzinger, G.; Pirker, S. Investigation of highly laden particle jet dispersion by the use of a high-speed camera and parameter-independent image analysis. Powder Technol. 2013, 234, 46–57. [Google Scholar] [CrossRef]
- Zhong, W.; Yu, A.; Zhou, G.; Xie, J.; Zhang, H. CFD simulation of dense particulate reaction system: Approaches, recent advances and applications. Chem. Eng. Sci. 2016, 140, 16–43. [Google Scholar] [CrossRef]
- Zhou, L. Theory and Modeling of Dispersed Multiphase Turbulent Reacting Flows; Butterworth-Heinemann: Oxford, UK, 2018. [Google Scholar]
- Haugen, N.E.L.; Mitchell, R.E. Modeling radiation in particle clouds: On the importance of inter-particle radiation for pulverized solid fuel combustion. Heat Mass Transf. 2015, 51, 991–999. [Google Scholar] [CrossRef] [Green Version]
- Liberman, M.A.; Kleeorin, N.; Rogachevskii, I.; Haugen, N.E.L. Multipoint radiation induced ignition of dust explosions: Turbulent clustering of particles and increased transparency. Combust. Theory Model. 2018, 22, 1084–1102. [Google Scholar] [CrossRef] [Green Version]
- Banko, A.J.; Villafañe, L.; Kim, J.H.; Esmaily, M.; Eaton, J.K. Stochastic modeling of direct radiation transmission in particle-laden turbulent flow. J. Quant. Spectrosc. Radiat. Transf. 2019, 226, 1–18. [Google Scholar] [CrossRef]
- Forgber, T.; Radl, S. A novel approach to calculate radiative thermal exchange in coupled particle simulations. Powder Technol. 2018, 323, 24–44. [Google Scholar] [CrossRef]
- Bermúdez, A.; Ferrín, J.; Liñán, A.; Saavedra, L. Numerical simulation of group combustion of pulverized coal. Combust. Flame 2011, 158, 1852–1865. [Google Scholar] [CrossRef] [Green Version]
- Haugen, N.E.L.; Krüger, J.; Mitra, D.; Løvås, T. The effect of turbulence on mass transfer rates of small inertial particles with surface reactions. J. Fluid Mech. 2018, 836, 932–951. [Google Scholar] [CrossRef] [Green Version]
- Krüger, J.; Haugen, N.E.L.; Løvås, T. Correlation effects between turbulence and the conversion rate of pulverized char particles. Combust. Flame 2017, 185, 160–172. [Google Scholar] [CrossRef]
- Krüger, J.; Haugen, N.E.; Mitra, D.; Løvås, T. The effect of turbulent clustering on particle reactivity. Proc. Combust. Inst. 2017, 36, 2333–2340. [Google Scholar] [CrossRef] [Green Version]
- Skinner, F.D.; Smoot, L.D. Heterogeneous Reactions of Char and Carbon. In Pulverized-Coal Combustion and Gasification: Theory and Applications for Continuous Flow Processes; Smoot, L.D., Pratt, D.T., Eds.; Springer: Boston, MA, USA, 1979; Chapter 9; pp. 149–167. [Google Scholar] [CrossRef]
- Bösenhofer, M.; Wartha, E.M.; Jordan, C.; Feilmayr, C.; Stocker, H.; Hauzenberger, F.; Rieger, J.; Tjaden, S.; Walk, A.; Harasek, M. Suitability of pulverised coal testing facilities for blast furnace applications. Ironmak. Steelmak. 2020, 47, 574–585. [Google Scholar] [CrossRef] [Green Version]
- Tavassoli, H.; Kriebitzsch, S.; van der Hoef, M.; Peters, E.; Kuipers, J. Direct numerical simulation of particulate flow with heat transfer. Int. J. Multiph. Flow 2013, 57, 29–37. [Google Scholar] [CrossRef]
- Tenneti, S.; Sun, B.; Garg, R.; Subramaniam, S. Role of fluid heating in dense gas-solid flow as revealed by particle-resolved direct numerical simulation. Int. J. Heat Mass Transf. 2013, 58, 471–479. [Google Scholar] [CrossRef]
- Sun, B.; Tenneti, S.; Subramaniam, S. Modeling average gas-solid heat transfer using particle-resolved direct numerical simulation. Int. J. Heat Mass Transf. 2015, 86, 898–913. [Google Scholar] [CrossRef] [Green Version]
- Municchi, F.; Radl, S. Consistent closures for Euler–Lagrange models of bi-disperse gas-particle suspensions derived from particle-resolved direct numerical simulations. Int. J. Heat Mass Transf. 2017, 111, 171–190. [Google Scholar] [CrossRef]
- Singhal, A.; Cloete, S.; Radl, S.; Quinta-Ferreira, R.; Amini, S. Heat transfer to a gas from densely packed beds of monodisperse spherical particles. Chem. Eng. J. 2017, 314, 27–37. [Google Scholar] [CrossRef]
- Singhal, A.; Cloete, S.; Radl, S.; Quinta-Ferreira, R.; Amini, S. Heat transfer to a gas from densely packed beds of cylindrical particles. Chem. Eng. Sci. 2017, 172, 1–12. [Google Scholar] [CrossRef]
- Esteghamatian, A.; Hammouti, A.; Lance, M.; Wachs, A. Particle resolved simulations of liquid/solid and gas/solid fluidized beds. Phys. Fluids 2017, 29, 033302. [Google Scholar] [CrossRef]
- Thiam, E.I.; Masi, E.; Climent, E.; Simonin, O.; Vincent, S. Particle-resolved numerical simulations of the gas–solid heat transfer in arrays of random motionless particles. Acta Mech. 2019, 230, 541–567. [Google Scholar] [CrossRef] [Green Version]
- Lei, H.; Zhu, L.T.; Luo, Z.H. Study of filtered interphase heat transfer using highly resolved CFD–DEM simulations. AICHE J. 2020, e17121. [Google Scholar] [CrossRef]
- Rauchenzauner, S.; Schneiderbauer, S. A dynamic Spatially Averaged Two-Fluid Model for heat transport in moderately dense gas-particle flows. Phys. Fluids 2020, 32, 063307. [Google Scholar] [CrossRef]
- Gnielinski, V. Wärme- und Stoffübertragung in Festbetten. Chem. Ing. Tech. 1980, 52, 228–236. [Google Scholar] [CrossRef]
- Achenbach, E. Heat and flow characteristics of packed beds. Exp. Therm. Fluid Sci. 1995, 10, 17–27. [Google Scholar] [CrossRef]
- Crowe, C.T.; Smoot, L.D. Multicomponent Conservation Equations. In Pulverized-Coal Combustion and Gasification: Theory and Applications for Continuous Flow Processes; Smoot, L.D., Pratt, D.T., Eds.; Springer: Boston, MA, USA, 1979; Chapter 2; pp. 15–54. [Google Scholar] [CrossRef]
- Naruse, I.; Inada, T. Advanced Pulverized Coal Injection Technology and Blast Furnace Operation; Characteristics of Pulverized Coal Combustion; Elsevier Science Ltd.: Oxford, UK, 2000; pp. 15–35. [Google Scholar]
- Cai, J.; Handa, M.; Modest, M.F. Eulerian–Eulerian multi-fluid methods for pulverized coal flames with nongray radiation. Combust. Flame 2015, 162, 1550–1565. [Google Scholar] [CrossRef] [Green Version]
- Wu, B.; Roy, S.P.; Zhao, X.; Modest, M.F. Effect of multiphase radiation on coal combustion in a pulverized coal jet flame. J. Quant. Spectrosc. Radiat. Transf. 2017, 197, 154–165. [Google Scholar] [CrossRef] [Green Version]
- Will, J.; Kruyt, N.; Venner, C. An experimental study of forced convective heat transfer from smooth, solid spheres. Int. J. Heat Mass Transf. 2017, 109, 1059–1067. [Google Scholar] [CrossRef]
- Ellendt, N.; Lumanglas, A.; Moqadam, S.I.; Mädler, L. A model for the drag and heat transfer of spheres in the laminar regime at high temperature differences. Int. J. Therm. Sci. 2018, 133, 98–105. [Google Scholar] [CrossRef]
- Whitaker, S. Forced convection heat transfer correlations for flow in pipes, past flat plates, single cylinders, single spheres, and for flow in packed beds and tube bundles. AIChE J. 1972, 18, 361–371. [Google Scholar] [CrossRef]
- Modest, M.F. Radiative Heat Transfer, 3rd ed.; Academic Press: New York, NY, USA, 2013. [Google Scholar]
- Modest, M.F.; Haworth, D.C. Radiative Heat Transfer in Turbulent Combustion Systems; Springer International Publishing: Cham, Switzerland, 2016. [Google Scholar] [CrossRef]
- Trivic, D.N.; Djordjevic, B.; Grbavcic, Z.B. Influence of particles size and concentration in particles cloud radiation by Mie theory. In Proceedings of the International Thermal Science Seminar Bled, Bled, Slovenia, 11–14 June 2000; Begellhouse: Danbury, CT, USA, 2000. [Google Scholar] [CrossRef]
- Squires, K.D.; Eaton, J.K. Preferential concentration of particles by turbulence. Phys. Fluids A Fluid Dyn. 1991, 3, 1169–1178. [Google Scholar] [CrossRef]
- Balachandar, S.; Eaton, J.K. Turbulent Dispersed Multiphase Flow. Annu. Rev. Fluid Mech. 2010, 42, 111–133. [Google Scholar] [CrossRef]
- Weller, H.G.; Tabor, G.; Jasak, H.; Fureby, C. A tensorial approach to computational continuum mechanics using object-oriented techniques. Comput. Phys. 1998, 12, 620–631. [Google Scholar] [CrossRef]
- Ferrer, P.M.; Causon, D.; Qian, L.; Mingham, C.; Ma, Z. A multi-region coupling scheme for compressible and incompressible flow solvers for two-phase flow in a numerical wave tank. Comput. Fluids 2016, 125, 116–129. [Google Scholar] [CrossRef] [Green Version]
- Kiss, M.; Bösenhofer, M.; Schatzl, M.; Harasek, M. Region Coupling Algorithms in OpenFoam. In Proceedings of the 16th Minisymposium Verfahrenstechnik and 7th Partikelforum, Vienna, Austria, 21–22 September 2020; TU Wien: Vienna, Austria, 2020; p. DiV2–(01). [Google Scholar] [CrossRef]
- Babich, A.; Senk, D.; Born, S. Interaction between Co-injected Substances with Pulverized Coal into the Blast Furnace. ISIJ Int. 2014, 54, 2704–2712. [Google Scholar] [CrossRef] [Green Version]
- Grosshandler, W.L. RADCAL: A Narrow-Band Model for Radiation–Calculations in a Combustion Environment; Technical Note 1402; National Institute of Standards and Technology (NIST): Gaithersburg, MD, USA, 1993.
- Narayanaswamy, A.; Chen, G. Thermal near-field radiative transfer between two spheres. Phys. Rev. B 2008, 77, 075125. [Google Scholar] [CrossRef] [Green Version]
- Song, B.; Fiorino, A.; Meyhofer, E.; Reddy, P. Near-field radiative thermal transport: From theory to experiment. AIP Adv. 2015, 5, 053503. [Google Scholar] [CrossRef] [Green Version]
- Krishnendu, G.S.; Jayakumar, J.S. CFD Analysis of Combined Thermal Radiation and Conjugate Heat Transfer in a 3D FFS. In Materials, Design, and Manufacturing for Sustainable Environment; Mohan, S., Shankar, S., Rajeshkumar, G., Eds.; Springer: Singapore, 2021; pp. 835–850. [Google Scholar]
- Sinn, C.; Kranz, F.; Wentrup, J.; Thöming, J.; Wehinger, G.D.; Pesch, G.R. CFD Simulations of Radiative Heat Transport in Open-Cell Foam Catalytic Reactors. Catalysts 2020, 10, 716. [Google Scholar] [CrossRef]
- Verderio Junior, S.A.; Scalon, V.L.; Avallone, E.; Mioralli, P. Numerical validation of viewFactor and FVDOM radiation models of OpenFOAM® and application in the study of food furnaces. Ingeniare-Rev. Chil. Ing. 2018, 26, 546–556. [Google Scholar] [CrossRef] [Green Version]
- Smith, G.P.; Golden, D.M.; Frenklach, M.; Moriarty, N.W.; Eiteneer, B.; Goldenberg, M.; Bowman, C.T.; Hanson, R.K.; Song, S.; Gardiner, W.C., Jr.; et al. GRI-Mech 3.0. 2018. Available online: http://combustion.berkeley.edu/gri-mech/ (accessed on 12 December 2021).
- Duan, Z.; He, B.; Duan, Y. Sphere Drag and Heat Transfer. Sci. Rep. 2015, 5, 12304. [Google Scholar] [CrossRef] [Green Version]
- Martin, H. A theoretical approach to predict the performance of chevron-type plate heat exchangers. Chem. Eng. Process. Process. Intensif. 1996, 35, 301–310. [Google Scholar] [CrossRef]
- Freedman, D. Statistical Models: Theory and Practice; Cambridge University Press: Cambridge, NY, USA, 2009. [Google Scholar]
- Cohen, J.; Cohen, P.; West, S.G.; Aiken, L.S. Applied Multiple Regression/Correlation Analysis for the Behavioral Sciences; Routledge: London, UK, 2013. [Google Scholar] [CrossRef]
- Martin, H. The generalized Lévêque equation and its use to predict heat or mass transfer from fluid friction. In Proceedings of the 20th National Heat Transfer Conference, Maratea, Italy, 27–29 June 2002; pp. 21–29. [Google Scholar]
- Brauer, H. Impuls-, Stoff- und Wärmetransport durch die Grenzfläche kugelförmiger Partikeln. Chem. Ing. Tech. 1973, 45, 1099–1103. [Google Scholar] [CrossRef]
- Weibull, W. A Statistical Theory of Strength of Materials; Ingeniörs Vetenskaps Akademiens Handlingar, Royal Swedish Institute for Engineering Research: Stockholm, Sweden, 1939; No. 151; pp. 5–45. [Google Scholar]
- Papoulis, A.; Pillai, S.U. Probability, Random Variables, and Stochastic Processes, 4th ed.; McGraw-Hill Series in Electrical and Computer Engineering; McGraw-Hill: Boston, MA, USA, 2002. [Google Scholar]
- Gunn, D. Transfer of heat or mass to particles in fixed and fluidised beds. Int. J. Heat Mass Transf. 1978, 21, 467–476. [Google Scholar] [CrossRef]
- Deen, N.G.; Peters, E.; Padding, J.T.; Kuipers, J. Review of direct numerical simulation of fluid–particle mass, momentum and heat transfer in dense gas-solid flows. Chem. Eng. Sci. 2014, 116, 710–724. [Google Scholar] [CrossRef]
- Monchaux, R.; Bourgoin, M.; Cartellier, A. Preferential concentration of heavy particles: A Voronoï analysis. Phys. Fluids 2010, 22, 103304. [Google Scholar] [CrossRef] [Green Version]
- Petersen, A.J.; Baker, L.; Coletti, F. Experimental study of inertial particles clustering and settling in homogeneous turbulence. J. Fluid Mech. 2019, 864, 925–970. [Google Scholar] [CrossRef] [Green Version]
- Falkinhoff, F.; Obligado, M.; Bourgoin, M.; Mininni, P.D. Preferential Concentration of Free-Falling Heavy Particles in Turbulence. Phys. Rev. Lett. 2020, 125, 064504. [Google Scholar] [CrossRef] [PubMed]
- Constant, E.; Favier, J.; Meldi, M.; Meliga, P.; Serre, E. An immersed boundary method in OpenFOAM Verification and validation. Comput. Fluids 2017, 157, 55–72. [Google Scholar] [CrossRef]
- Farazi, S.; Sadr, M.; Kang, S.; Schiemann, M.; Vorobiev, N.; Scherer, V.; Pitsch, H. Resolved simulations of single char particle combustion in a laminar flow field. Fuel 2017, 201, 15–28. [Google Scholar] [CrossRef]
- Jayawickrama, T.R.; Haugen, N.E.L.; Babler, M.U.; Chishty, M.; Umeki, K. The effect of Stefan flow on the drag coefficient of spherical particles in a gas flow. Int. J. Multiph. Flow 2019, 117, 130–137. [Google Scholar] [CrossRef]
- Richter, A.; Nikrityuk, P.A. Drag forces and heat transfer coefficients for spherical, cuboidal and ellipsoidal particles in cross flow at sub-critical Reynolds numbers. Int. J. Heat Mass Transf. 2012, 55, 1343–1354. [Google Scholar] [CrossRef]
- Safronov, D.; Kestel, M.; Nikrityuk, P.; Meyer, B. Particle resolved simulations of carbon oxidation in a laminar flow. Can. J. Chem. Eng. 2014, 92, 1669–1686. [Google Scholar] [CrossRef]
- Schubert, H. Handbuch der Mechanischen Verfahrenstechnik, 1st ed.; Wiley-VCH: Zürich, Switzerland, 2012. [Google Scholar]

 ): convective and radiative region coupling; blue ( ): convective region coupling.
): convective and radiative region coupling; blue ( ): convective region coupling.
): convective and radiative region coupling; blue ( ): convective region coupling. ): convective and radiative region coupling; blue ( ): convective region coupling.
): convective and radiative region coupling; blue ( ): convective region coupling.
): convective and radiative region coupling; blue ( ): convective region coupling.


 ) given by Equation (13) and simulation data (●). The relative errors of Equation (13) compared to CFD-simulated data is presented in (b).
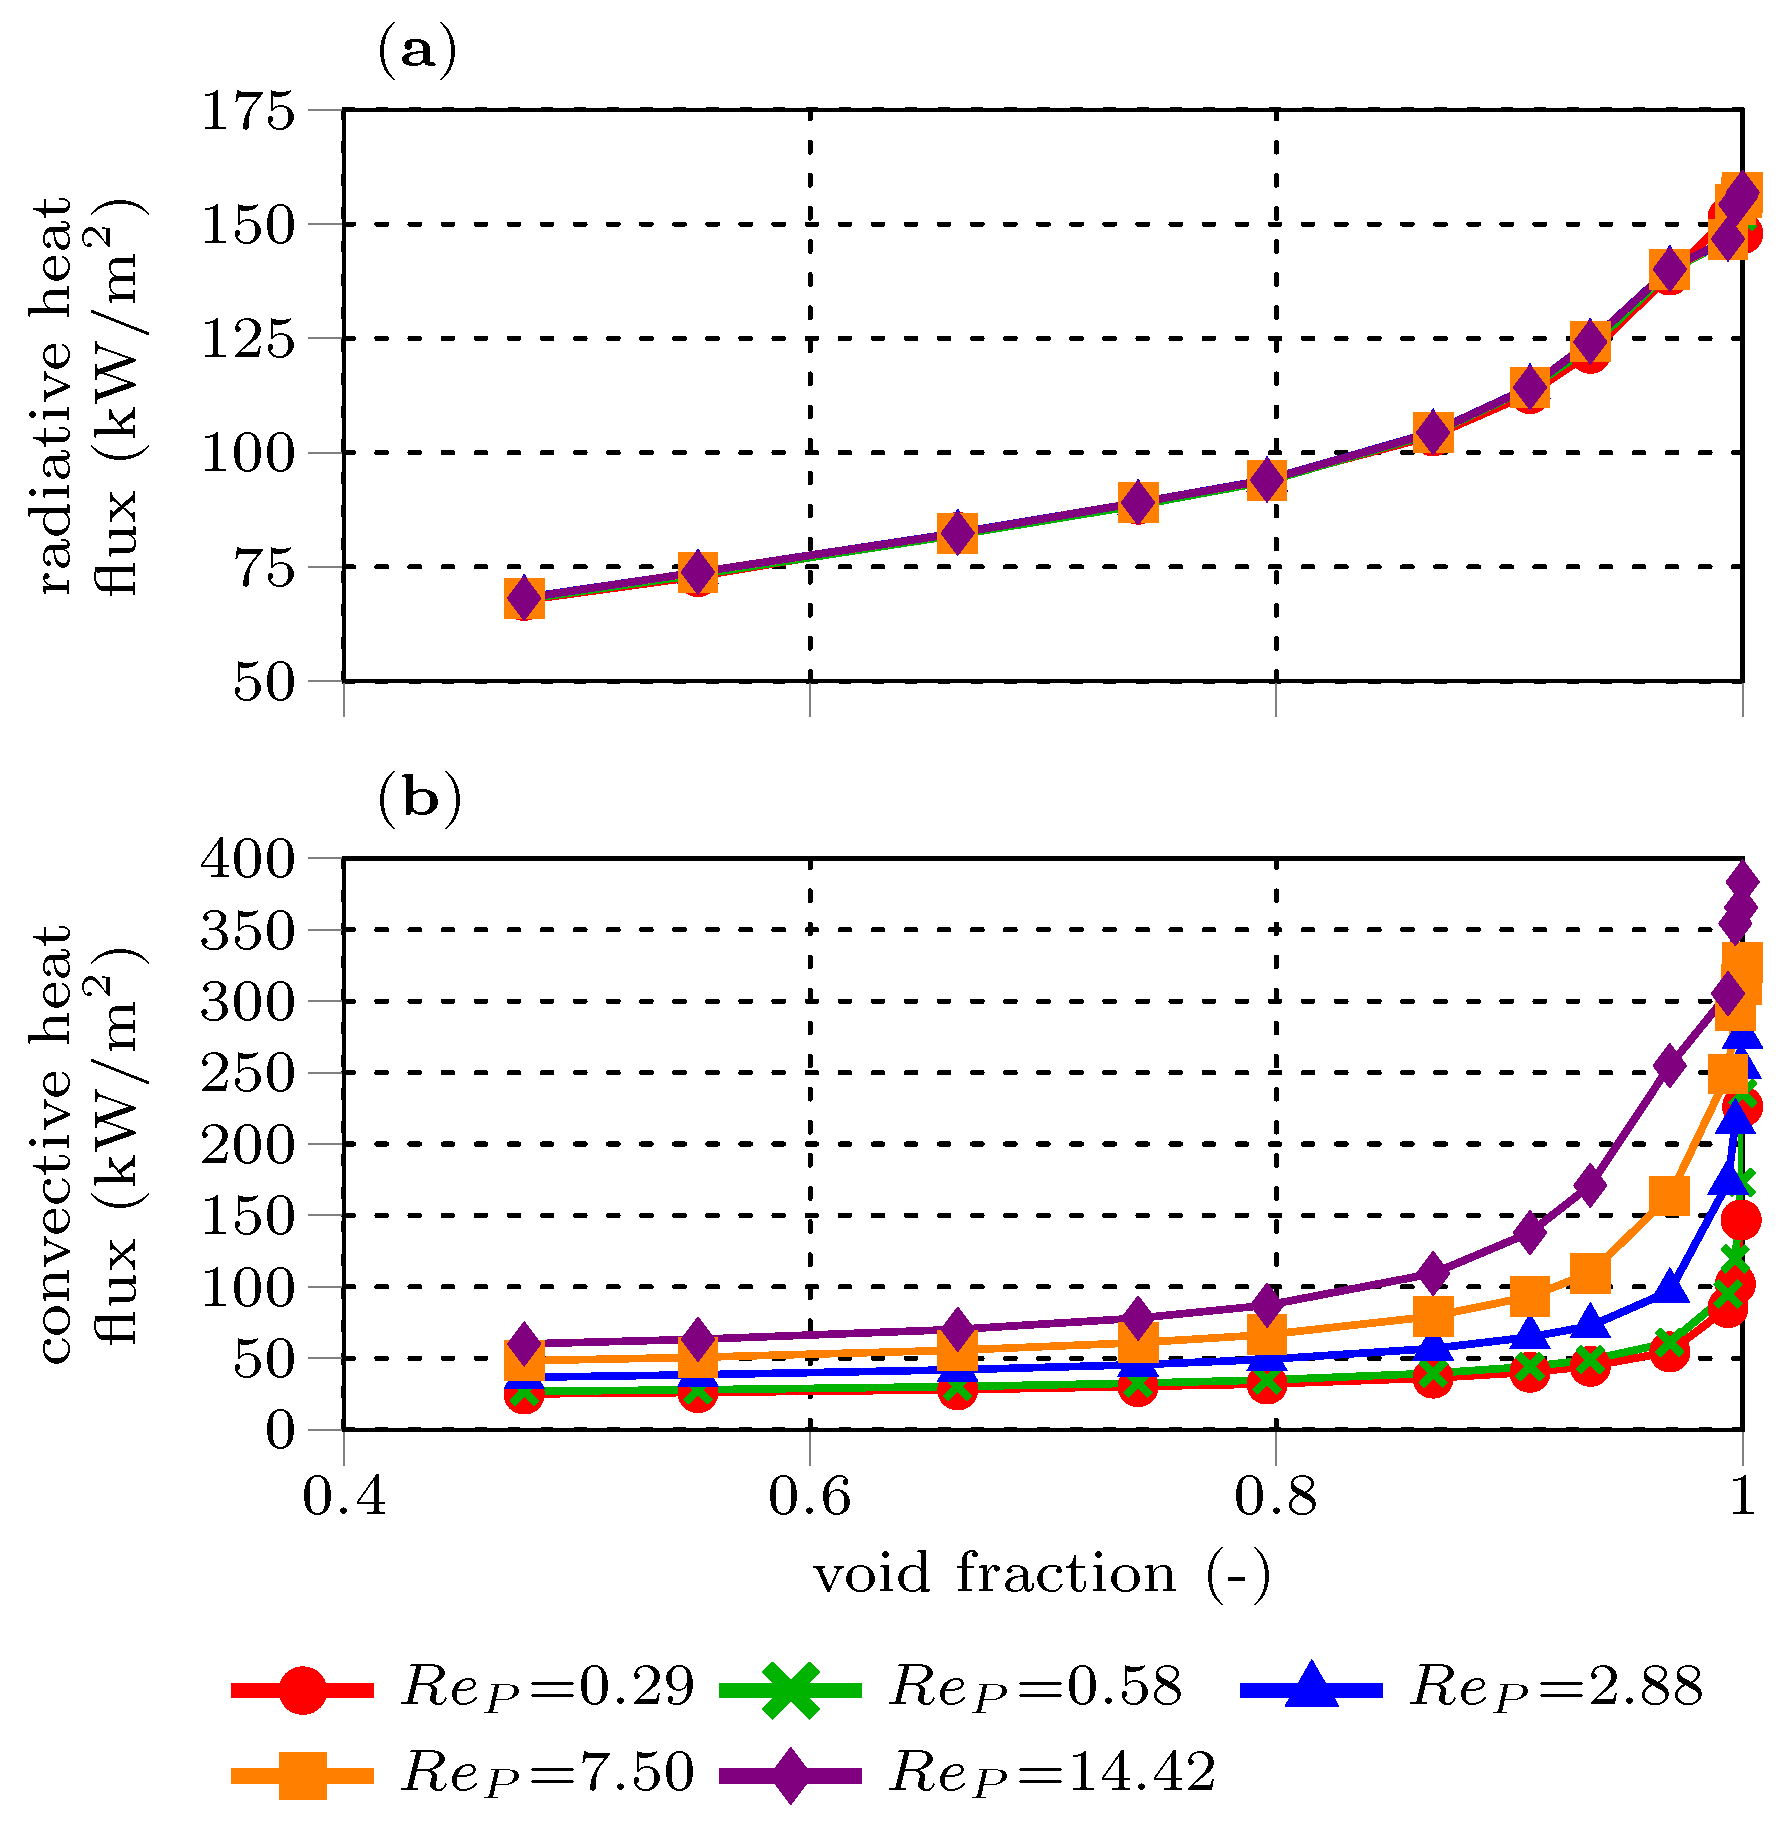
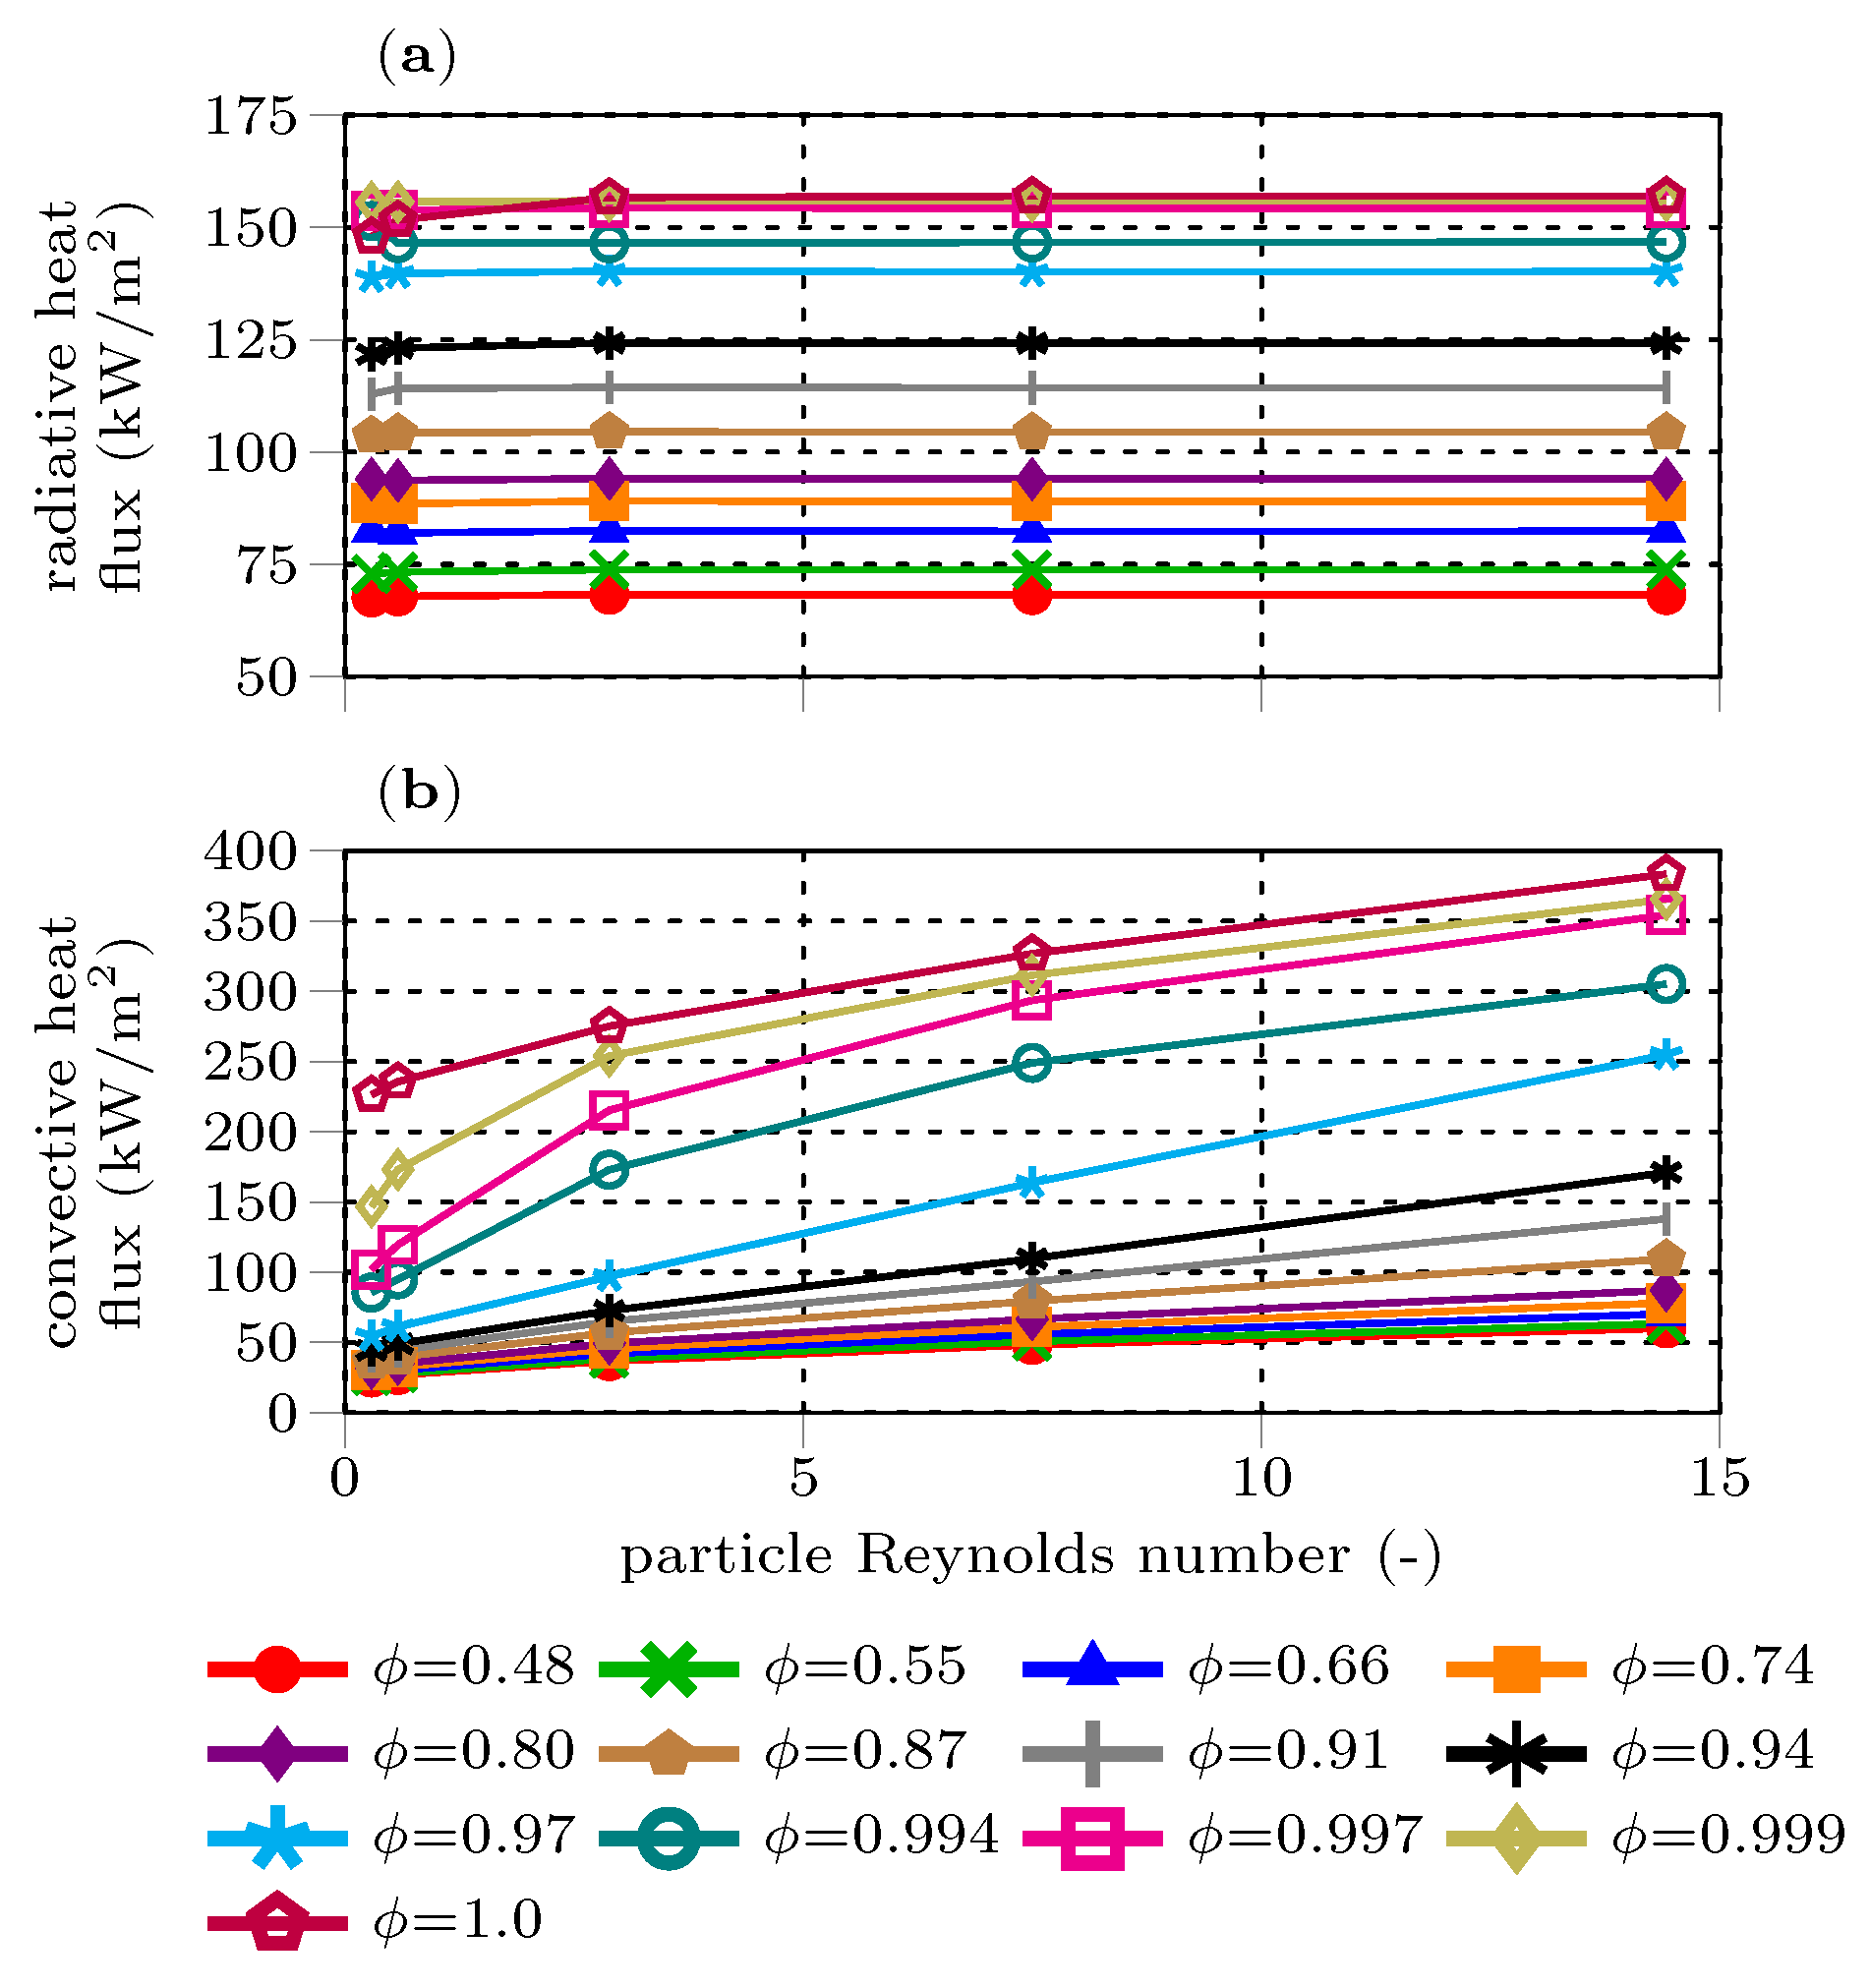
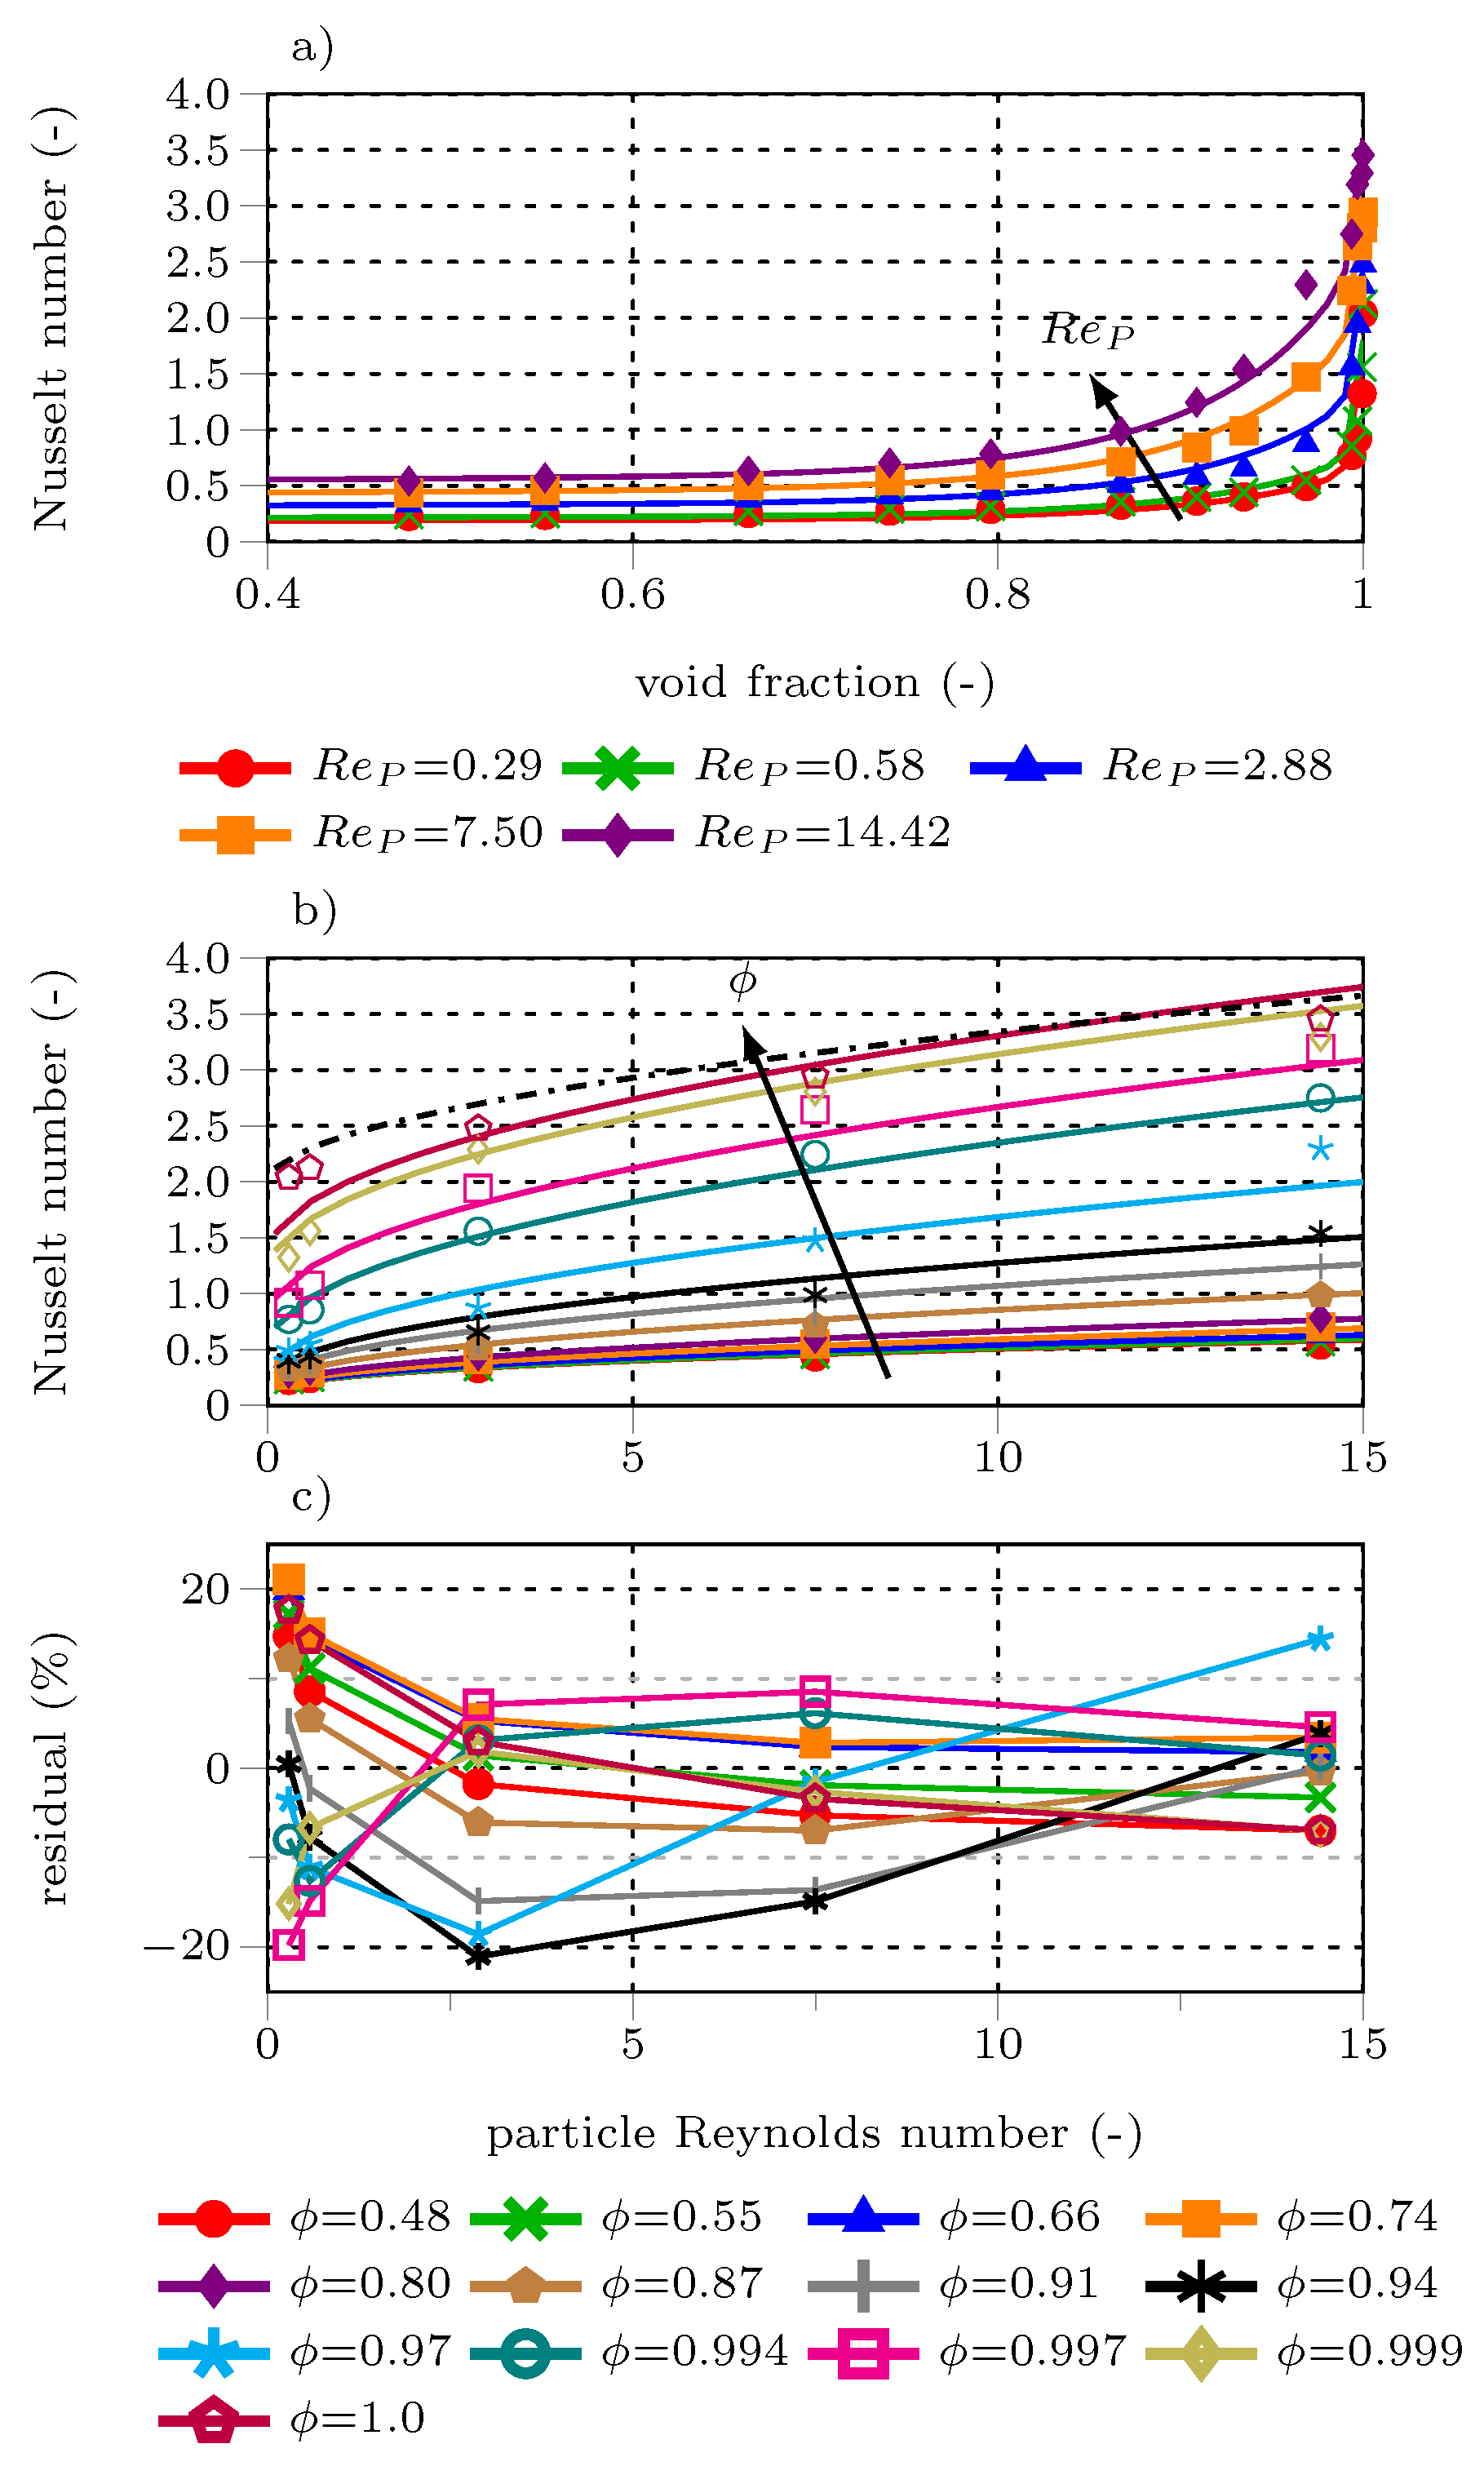
 ) Equation (16) with simulation data (●) versus the cluster void fraction (a) and particle Reynolds number (b). The relative errors of Equation (16) compared to CFD-simulated data are presented in (c).
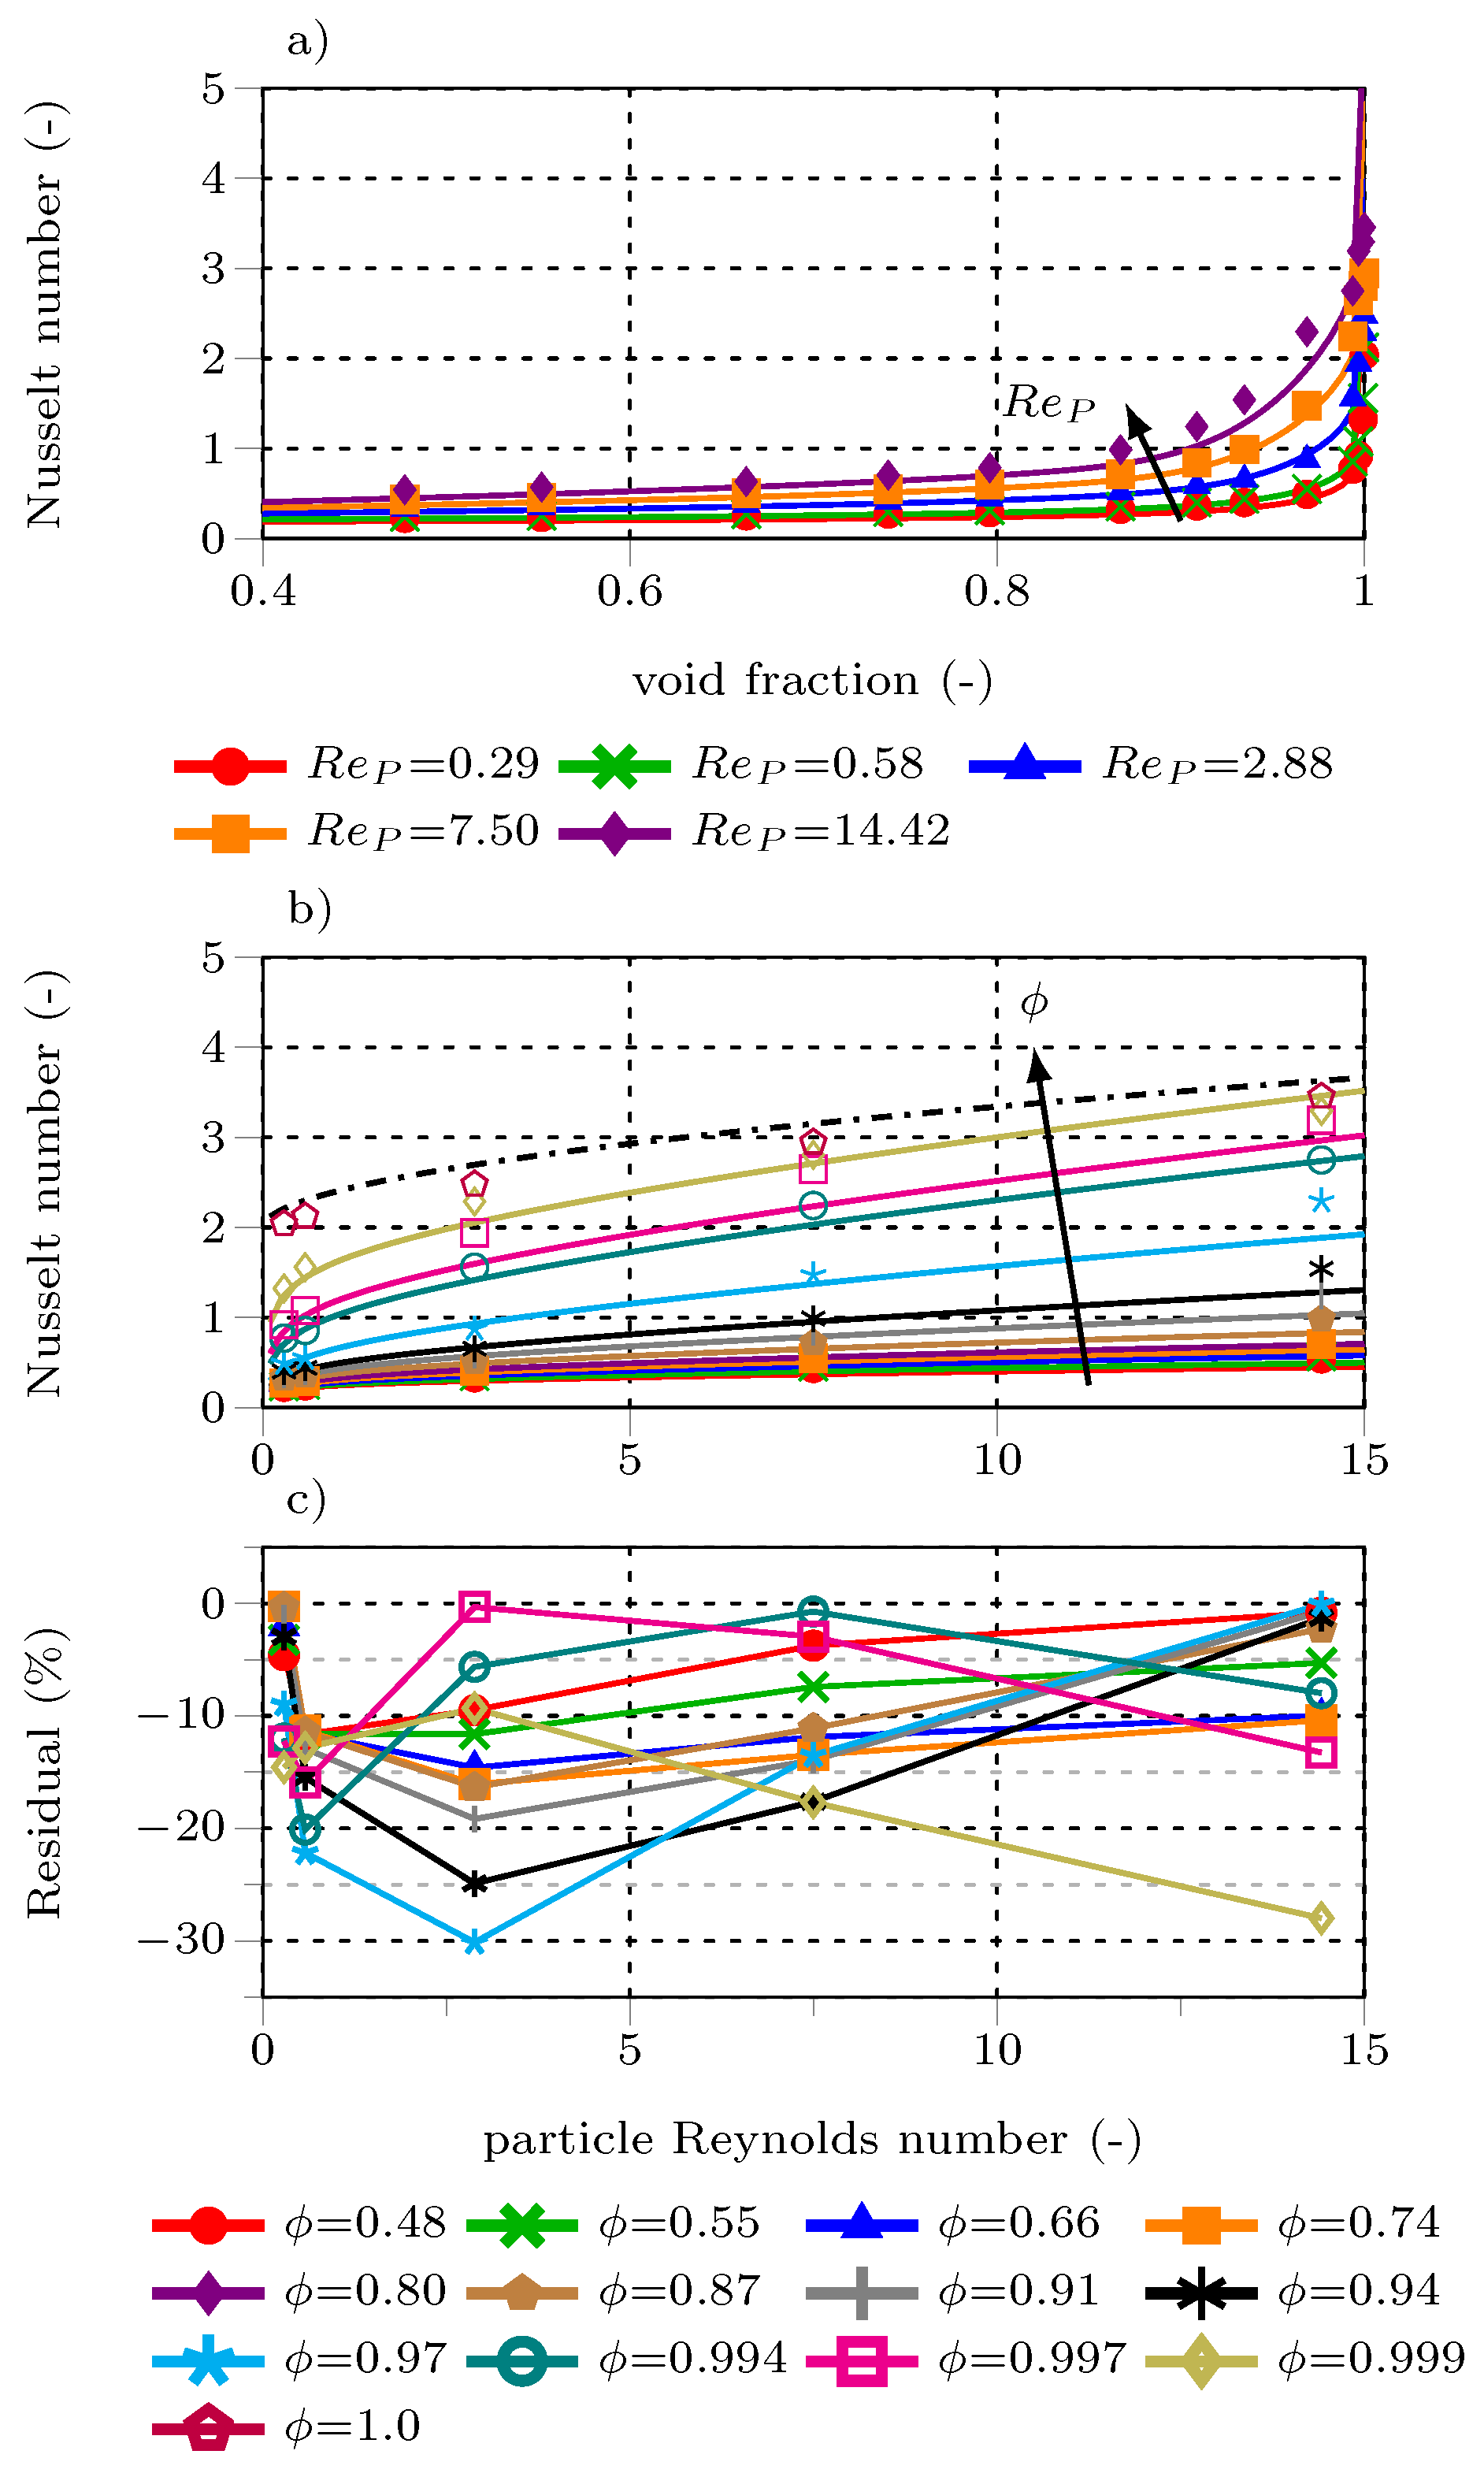
 ) with simulation data (●) and [61] ( ) versus the cluster void fraction (a) and particle Reynolds number (b). The relative errors of Equation (19) compared to CFD-simulated data is presented in (c).
 ) with simulation data (●) and the drag coefficient according to Brauer [62] ( ) versus the cluster void fraction (a) and particle Reynolds number (b). The relative errors of Equation (20) compared to CFD-simulated data is presented in (c).
) with simulation data (●) and the drag coefficient according to Brauer [62] ( ) versus the cluster void fraction (a) and particle Reynolds number (b). The relative errors of Equation (20) compared to CFD-simulated data is presented in (c).
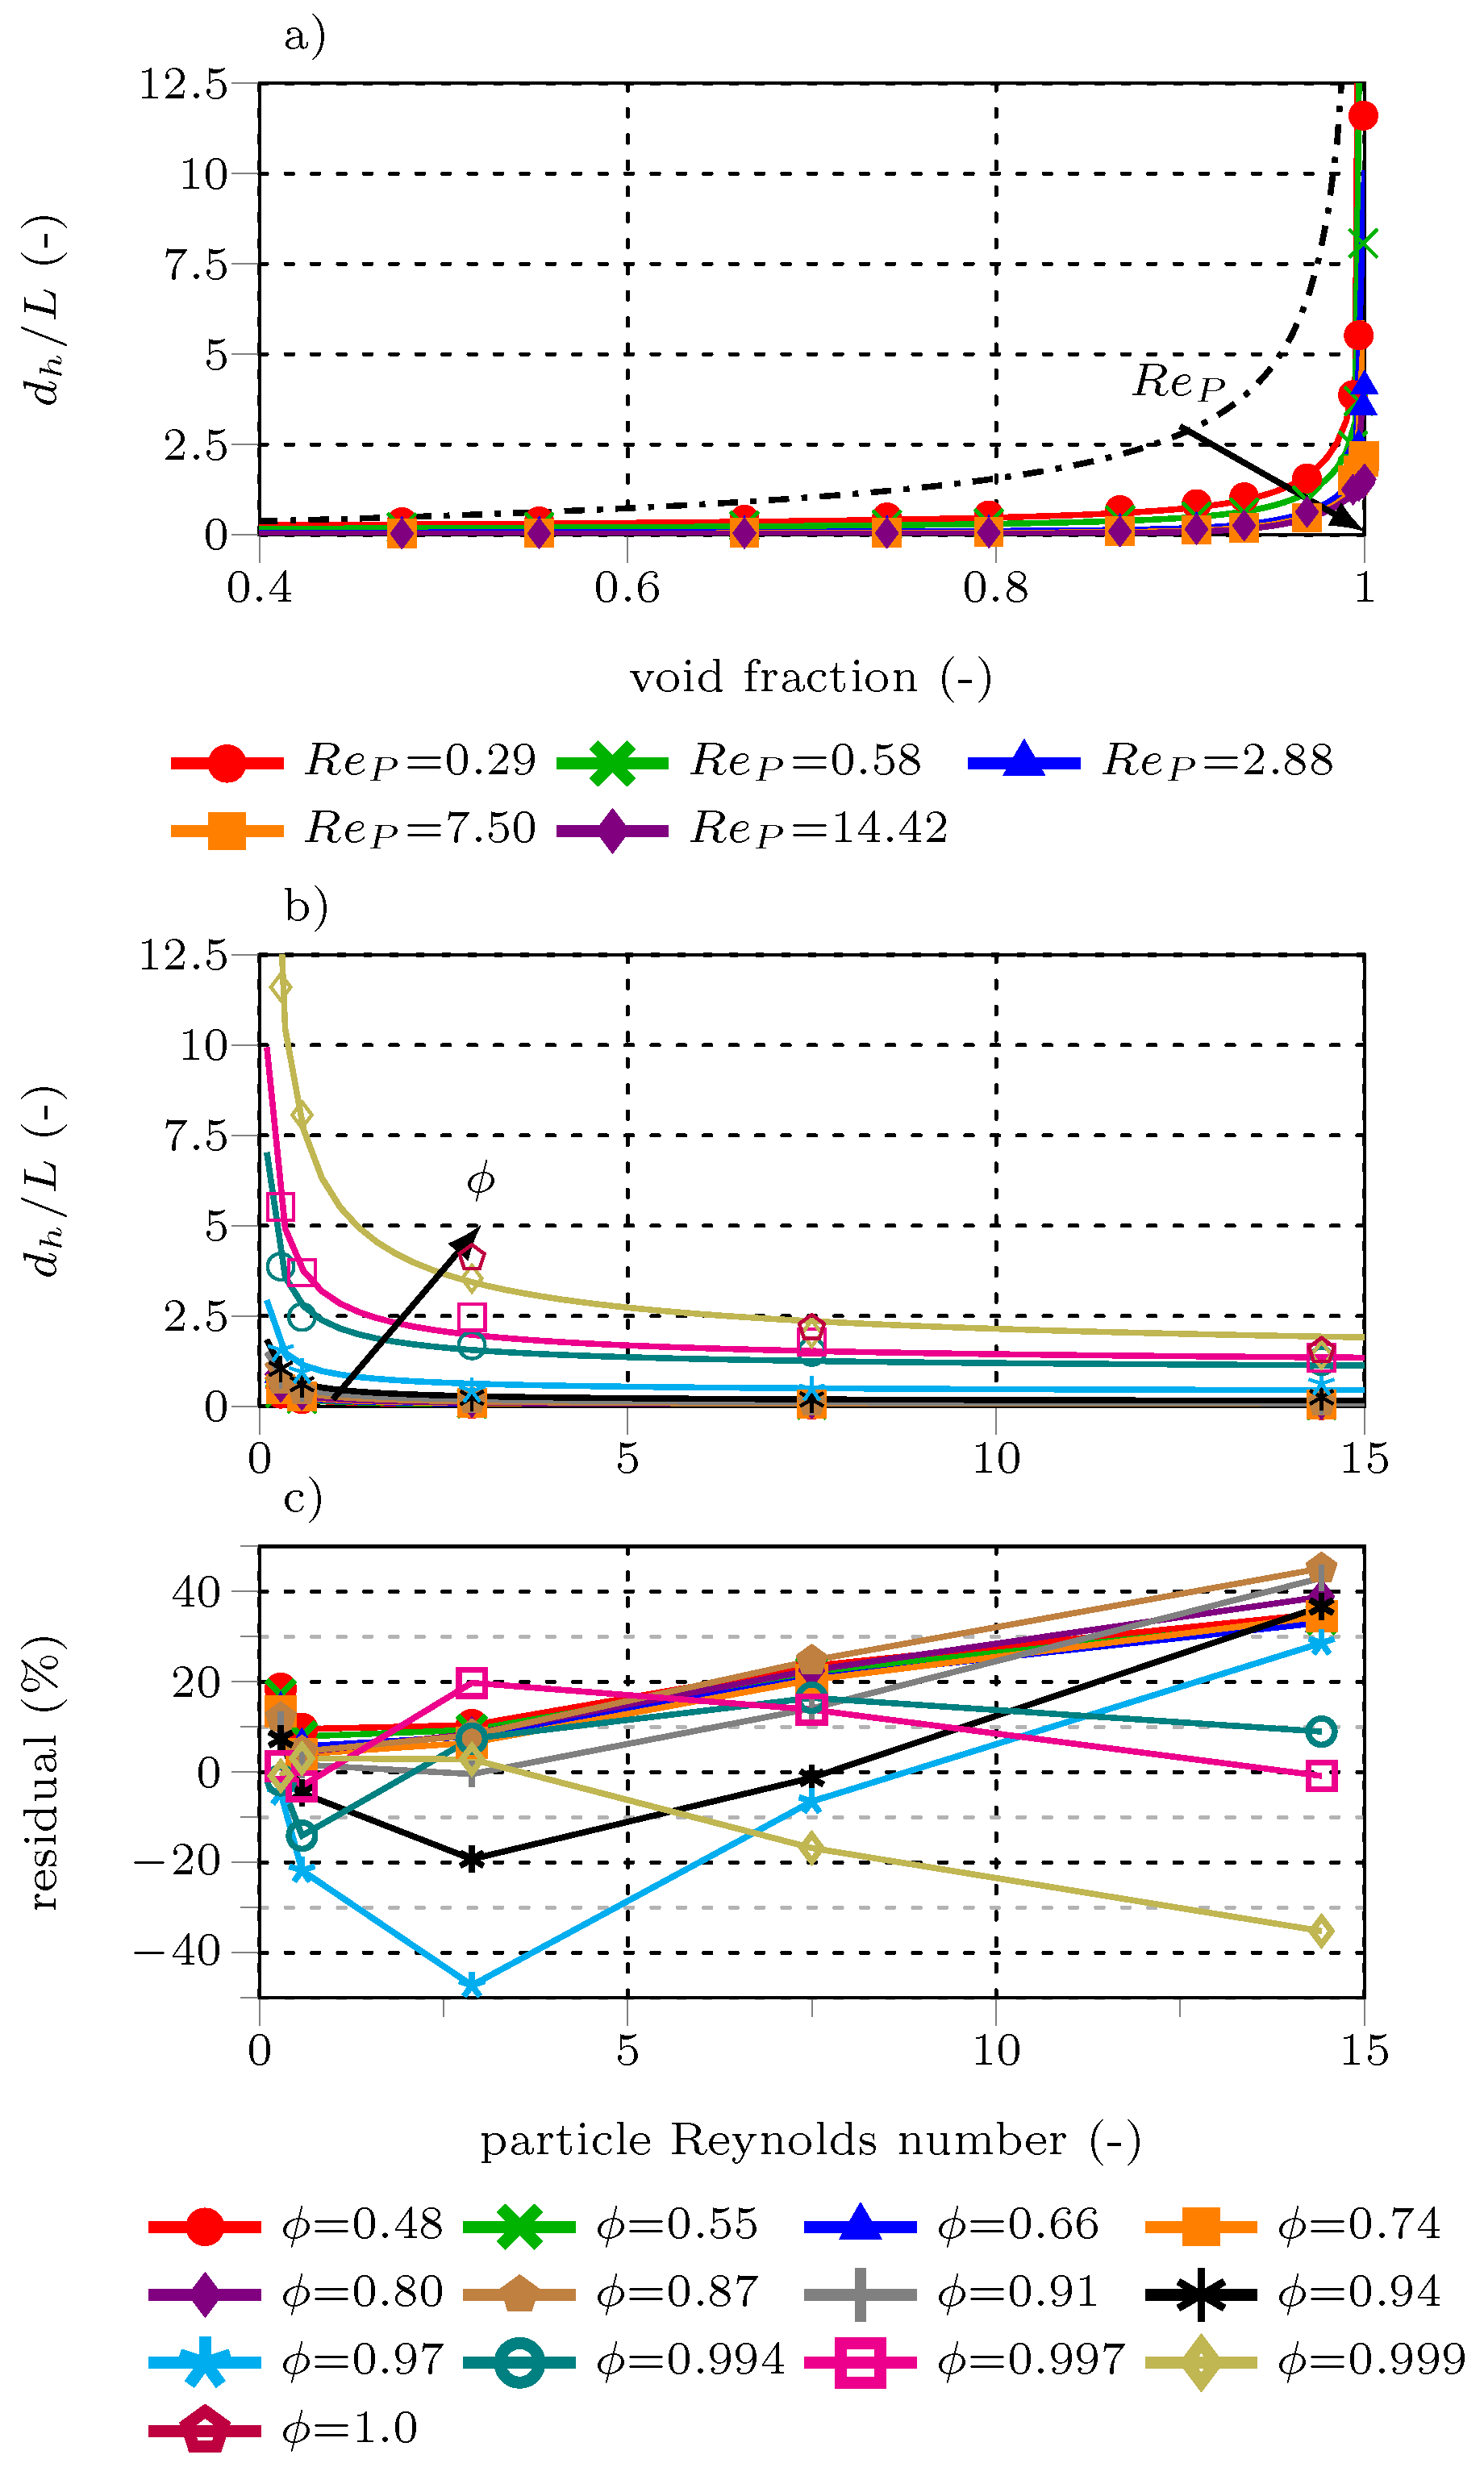
) with simulation data (●) and the drag coefficient according to Brauer [62] ( ) versus the cluster void fraction (a) and particle Reynolds number (b). The relative errors of Equation (20) compared to CFD-simulated data is presented in (c). ) with values determined from simulations (●) and Equation (5) ( ) versus the cluster void fraction (a) and particle Reynolds number (b). The relative errors of Equation (17) compared to CFD-simulated data is presented in (c).
) with values determined from simulations (●) and Equation (5) ( ) versus the cluster void fraction (a) and particle Reynolds number (b). The relative errors of Equation (17) compared to CFD-simulated data is presented in (c).
) with values determined from simulations (●) and Equation (5) ( ) versus the cluster void fraction (a) and particle Reynolds number (b). The relative errors of Equation (17) compared to CFD-simulated data is presented in (c). ) (b) the Nusselt number calculated using Equation (16) (
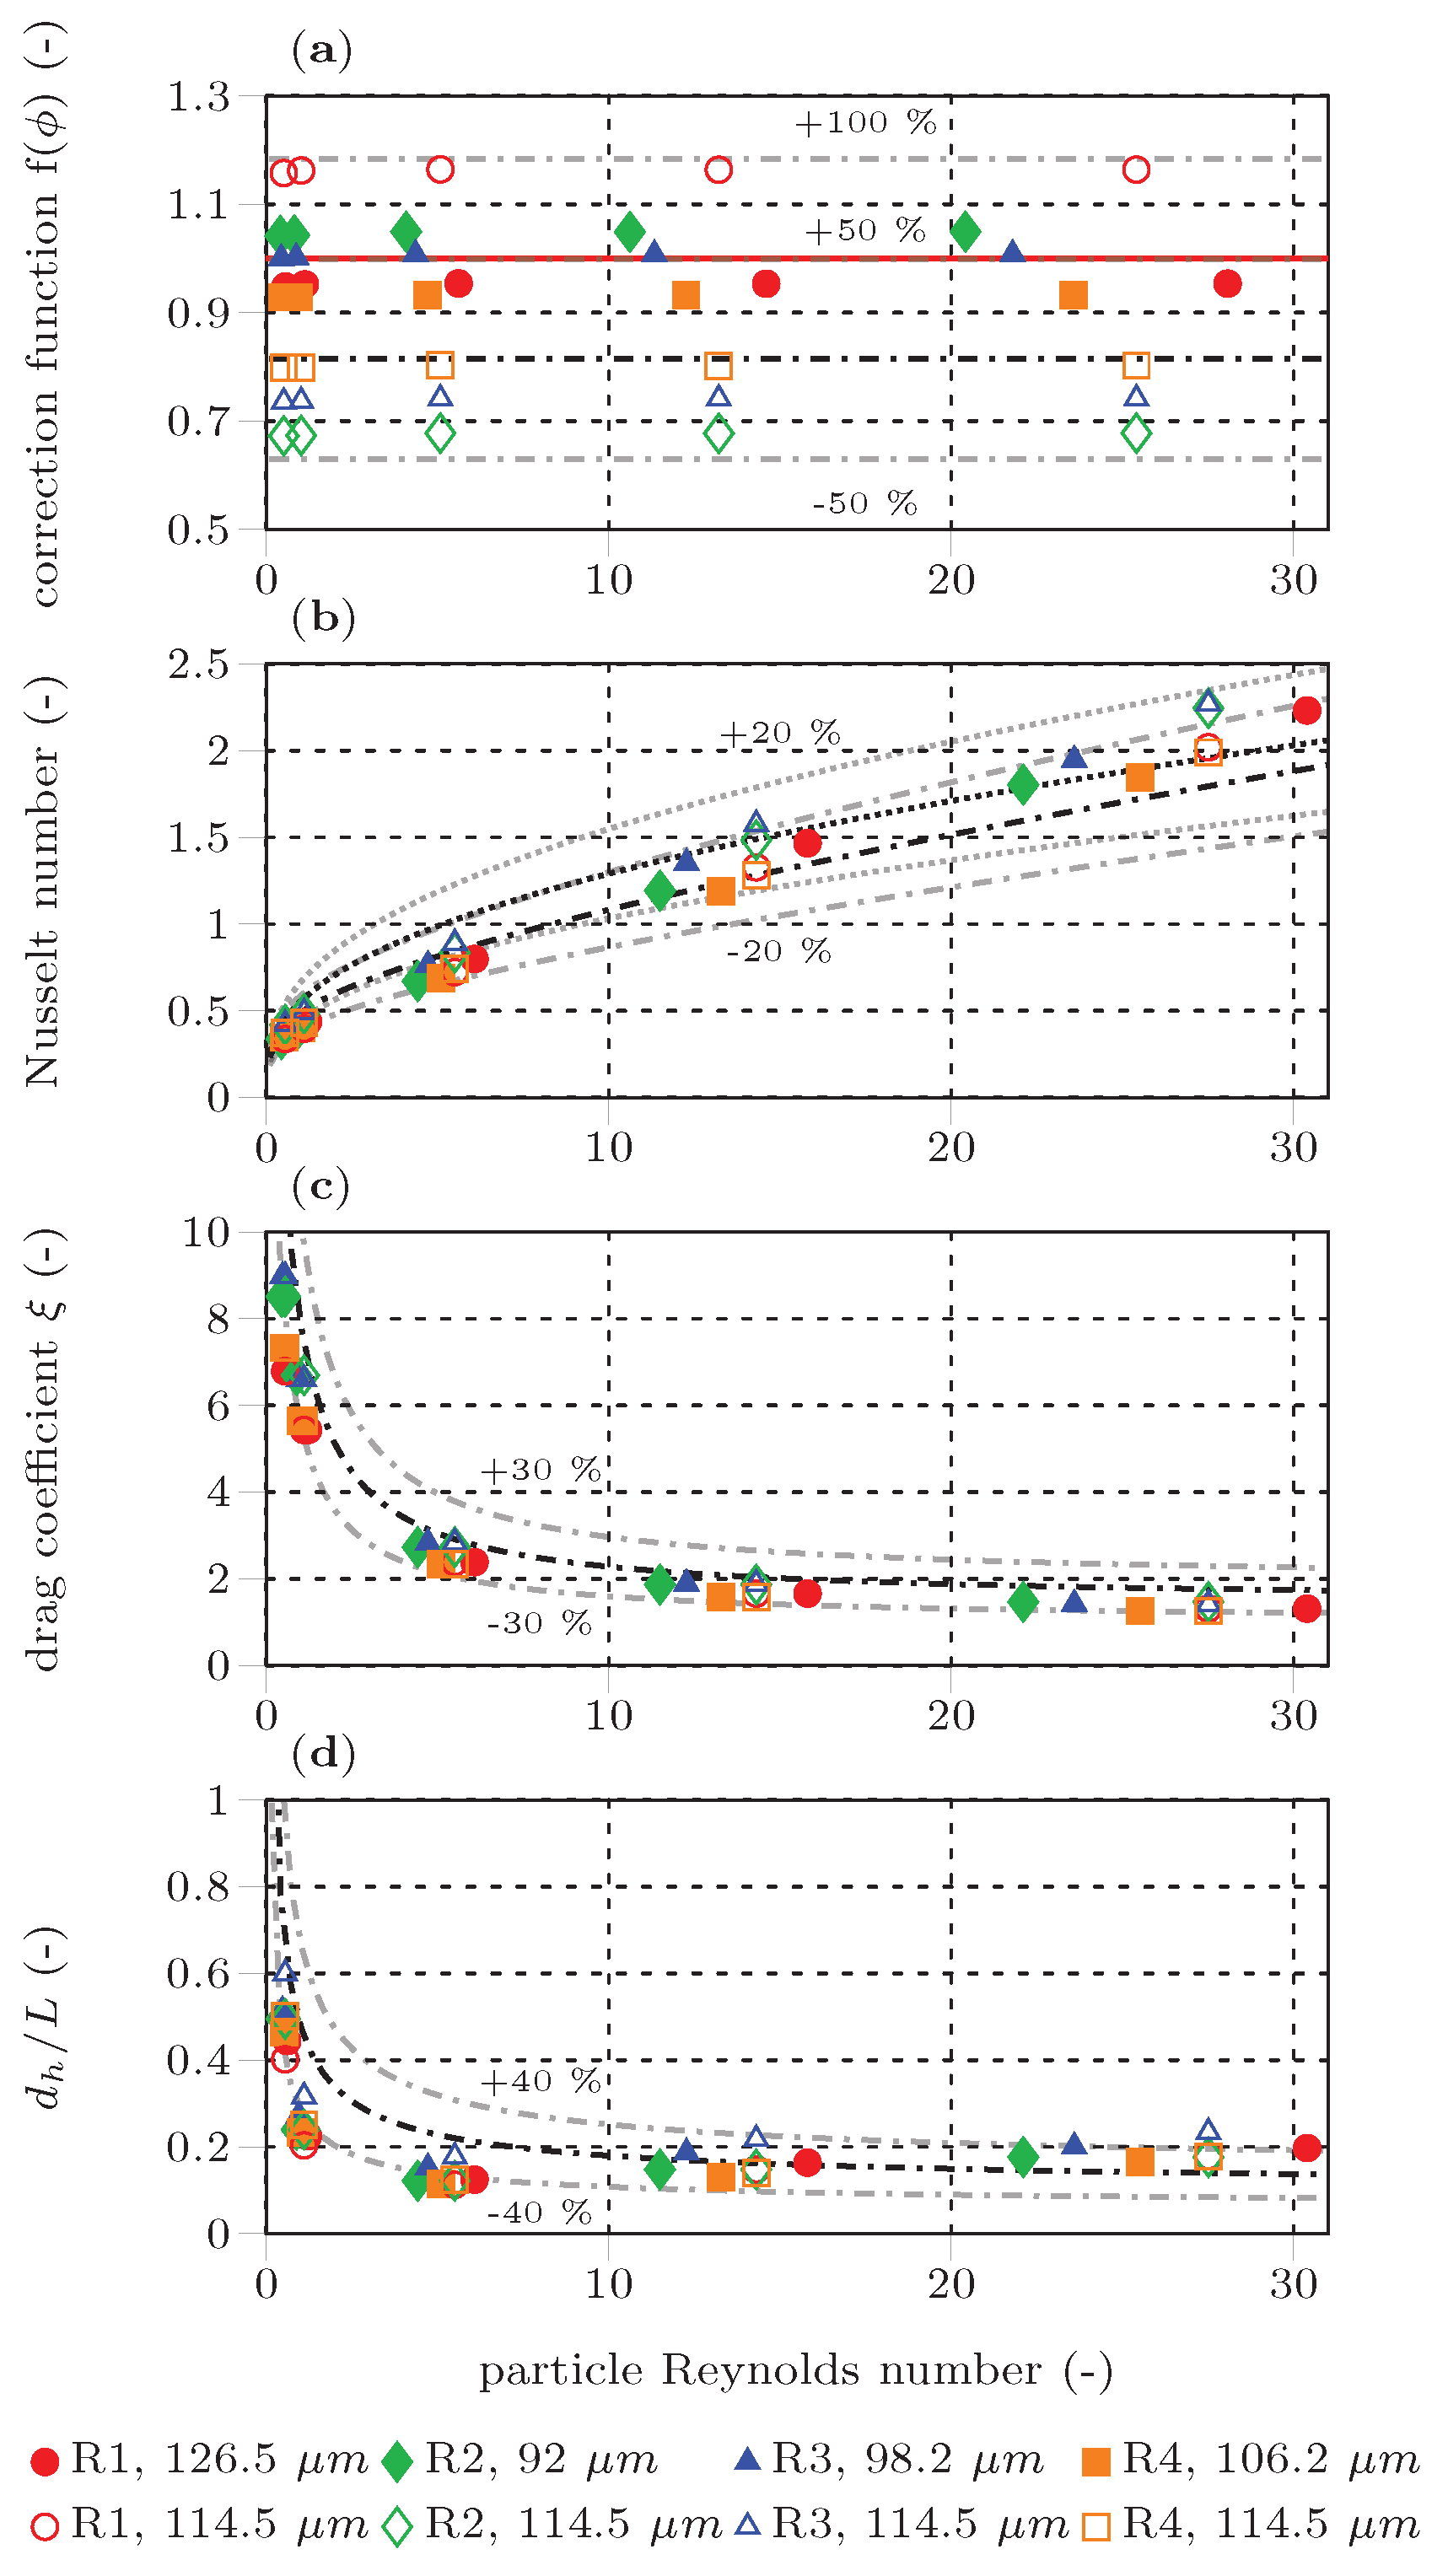
  ) and Equation (17) ( ), (c) the drag coefficient according to Equation (20) ( ), and (d) calculated using Equation (19) ( ) with values determined from simulations (●) versus the cluster particle Reynolds number.
) (b) the Nusselt number calculated using Equation (16) ( ) and Equation (17) ( ), (c) the drag coefficient according to Equation (20) ( ), and (d) calculated using Equation (19) ( ) with values determined from simulations (●) versus the cluster particle Reynolds number.
) and Equation (17) ( ), (c) the drag coefficient according to Equation (20) ( ), and (d) calculated using Equation (19) ( ) with values determined from simulations (●) versus the cluster particle Reynolds number.
) (b) the Nusselt number calculated using Equation (16) ( ) and Equation (17) ( ), (c) the drag coefficient according to Equation (20) ( ), and (d) calculated using Equation (19) ( ) with values determined from simulations (●) versus the cluster particle Reynolds number.
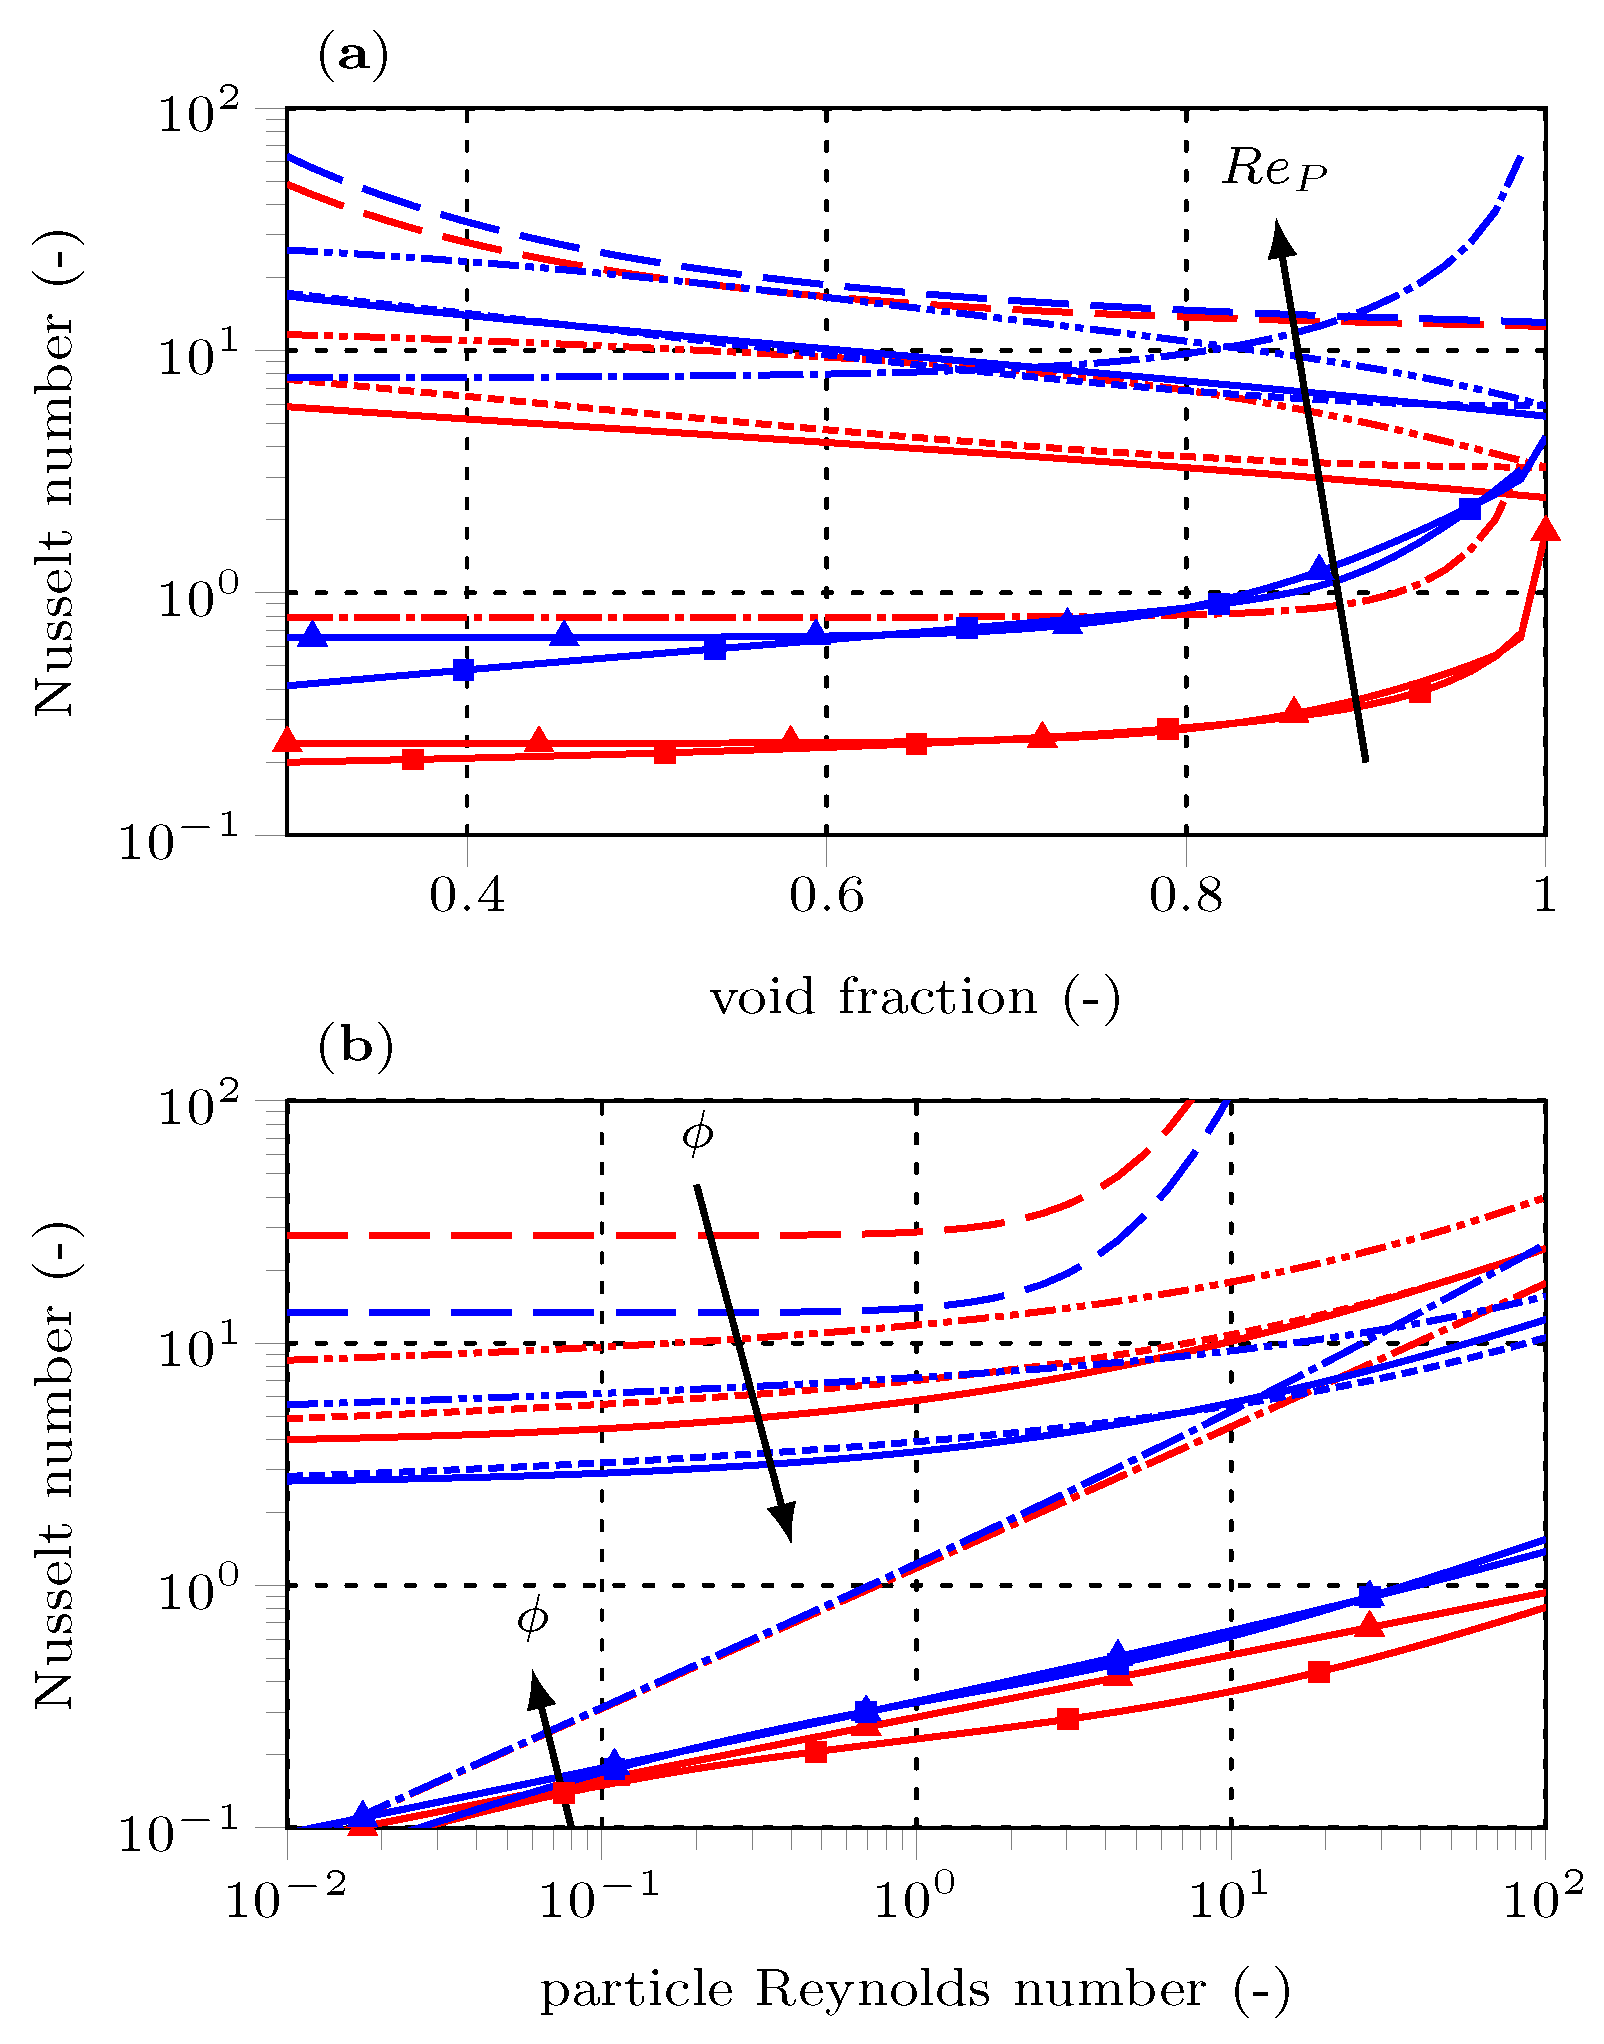
 ), Gnielinski [32] ( ), Gunn [65] (
  ), Sun et al. [24] (
  ), Municchi and Radl [25] (
  )) with the multiple linear regression (MLE) of Equation 16 (
  ) and the Lévêque (GLE) of Equations (17)–(19) (
  ) correlations versus void fraction (a) and particle Reynolds number (b). Red: (a) lower ReP, (b) lower void fraction; Blue: (a) higher ReP, (b) higher void fraction.
), Gnielinski [32] ( ), Gunn [65] ( ), Sun et al. [24] ( ), Municchi and Radl [25] ( )) with the multiple linear regression (MLE) of Equation 16 ( ) and the Lévêque (GLE) of Equations (17)–(19) ( ) correlations versus void fraction (a) and particle Reynolds number (b). Red: (a) lower ReP, (b) lower void fraction; Blue: (a) higher ReP, (b) higher void fraction.
) correlations versus void fraction (a) and particle Reynolds number (b). Red: (a) lower ReP, (b) lower void fraction; Blue: (a) higher ReP, (b) higher void fraction.
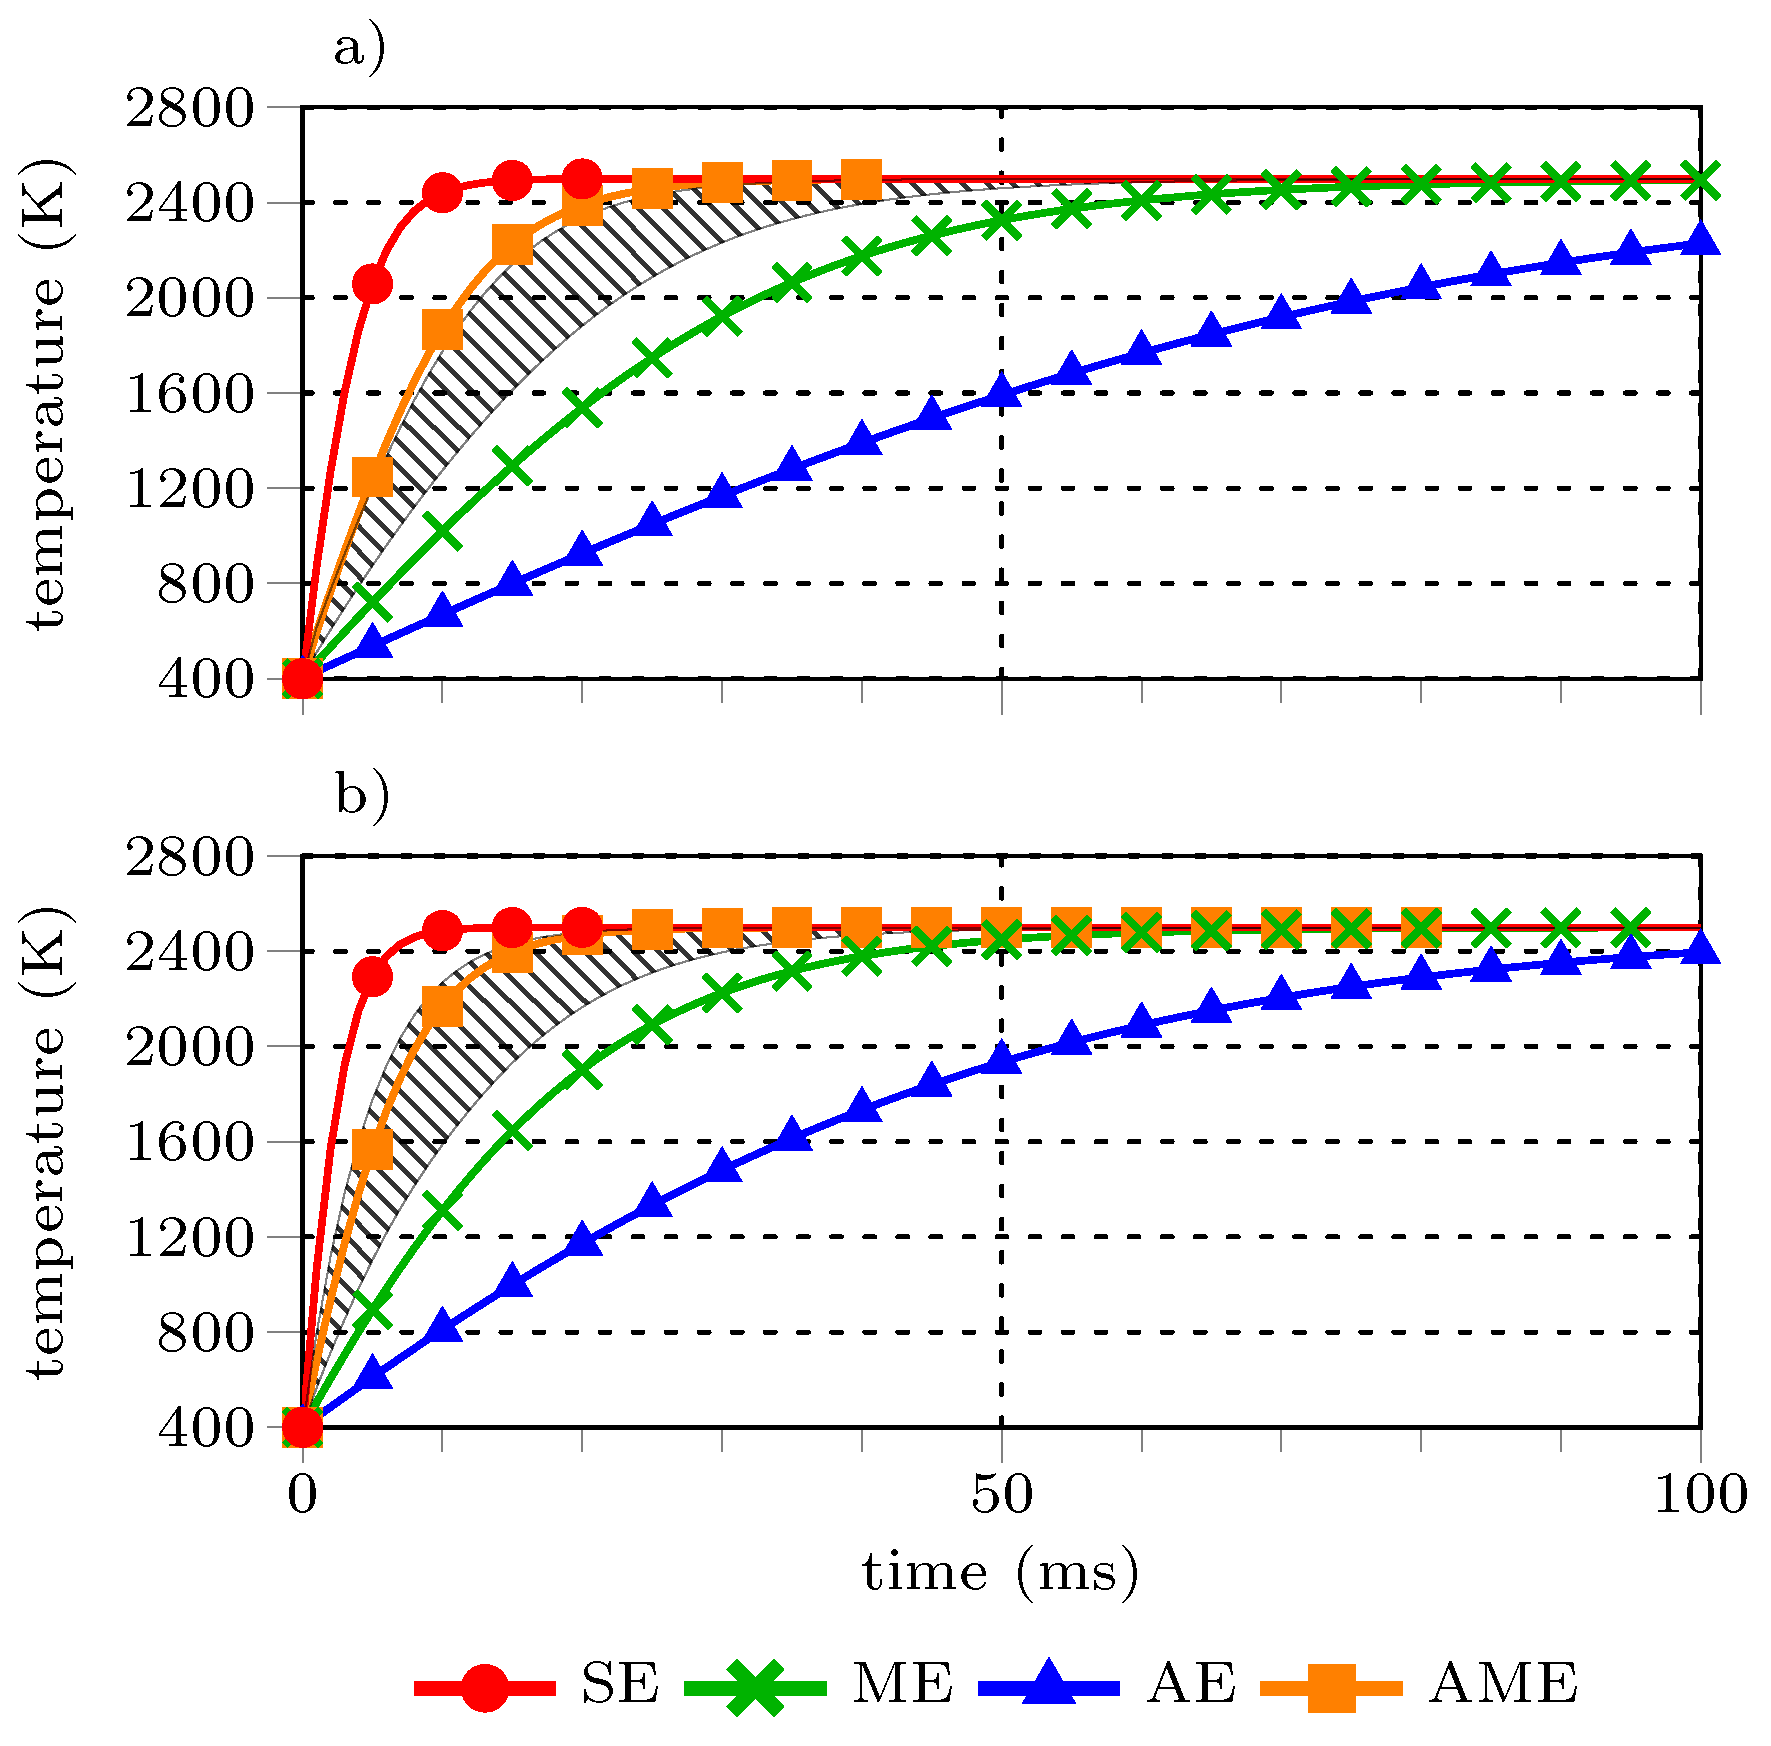
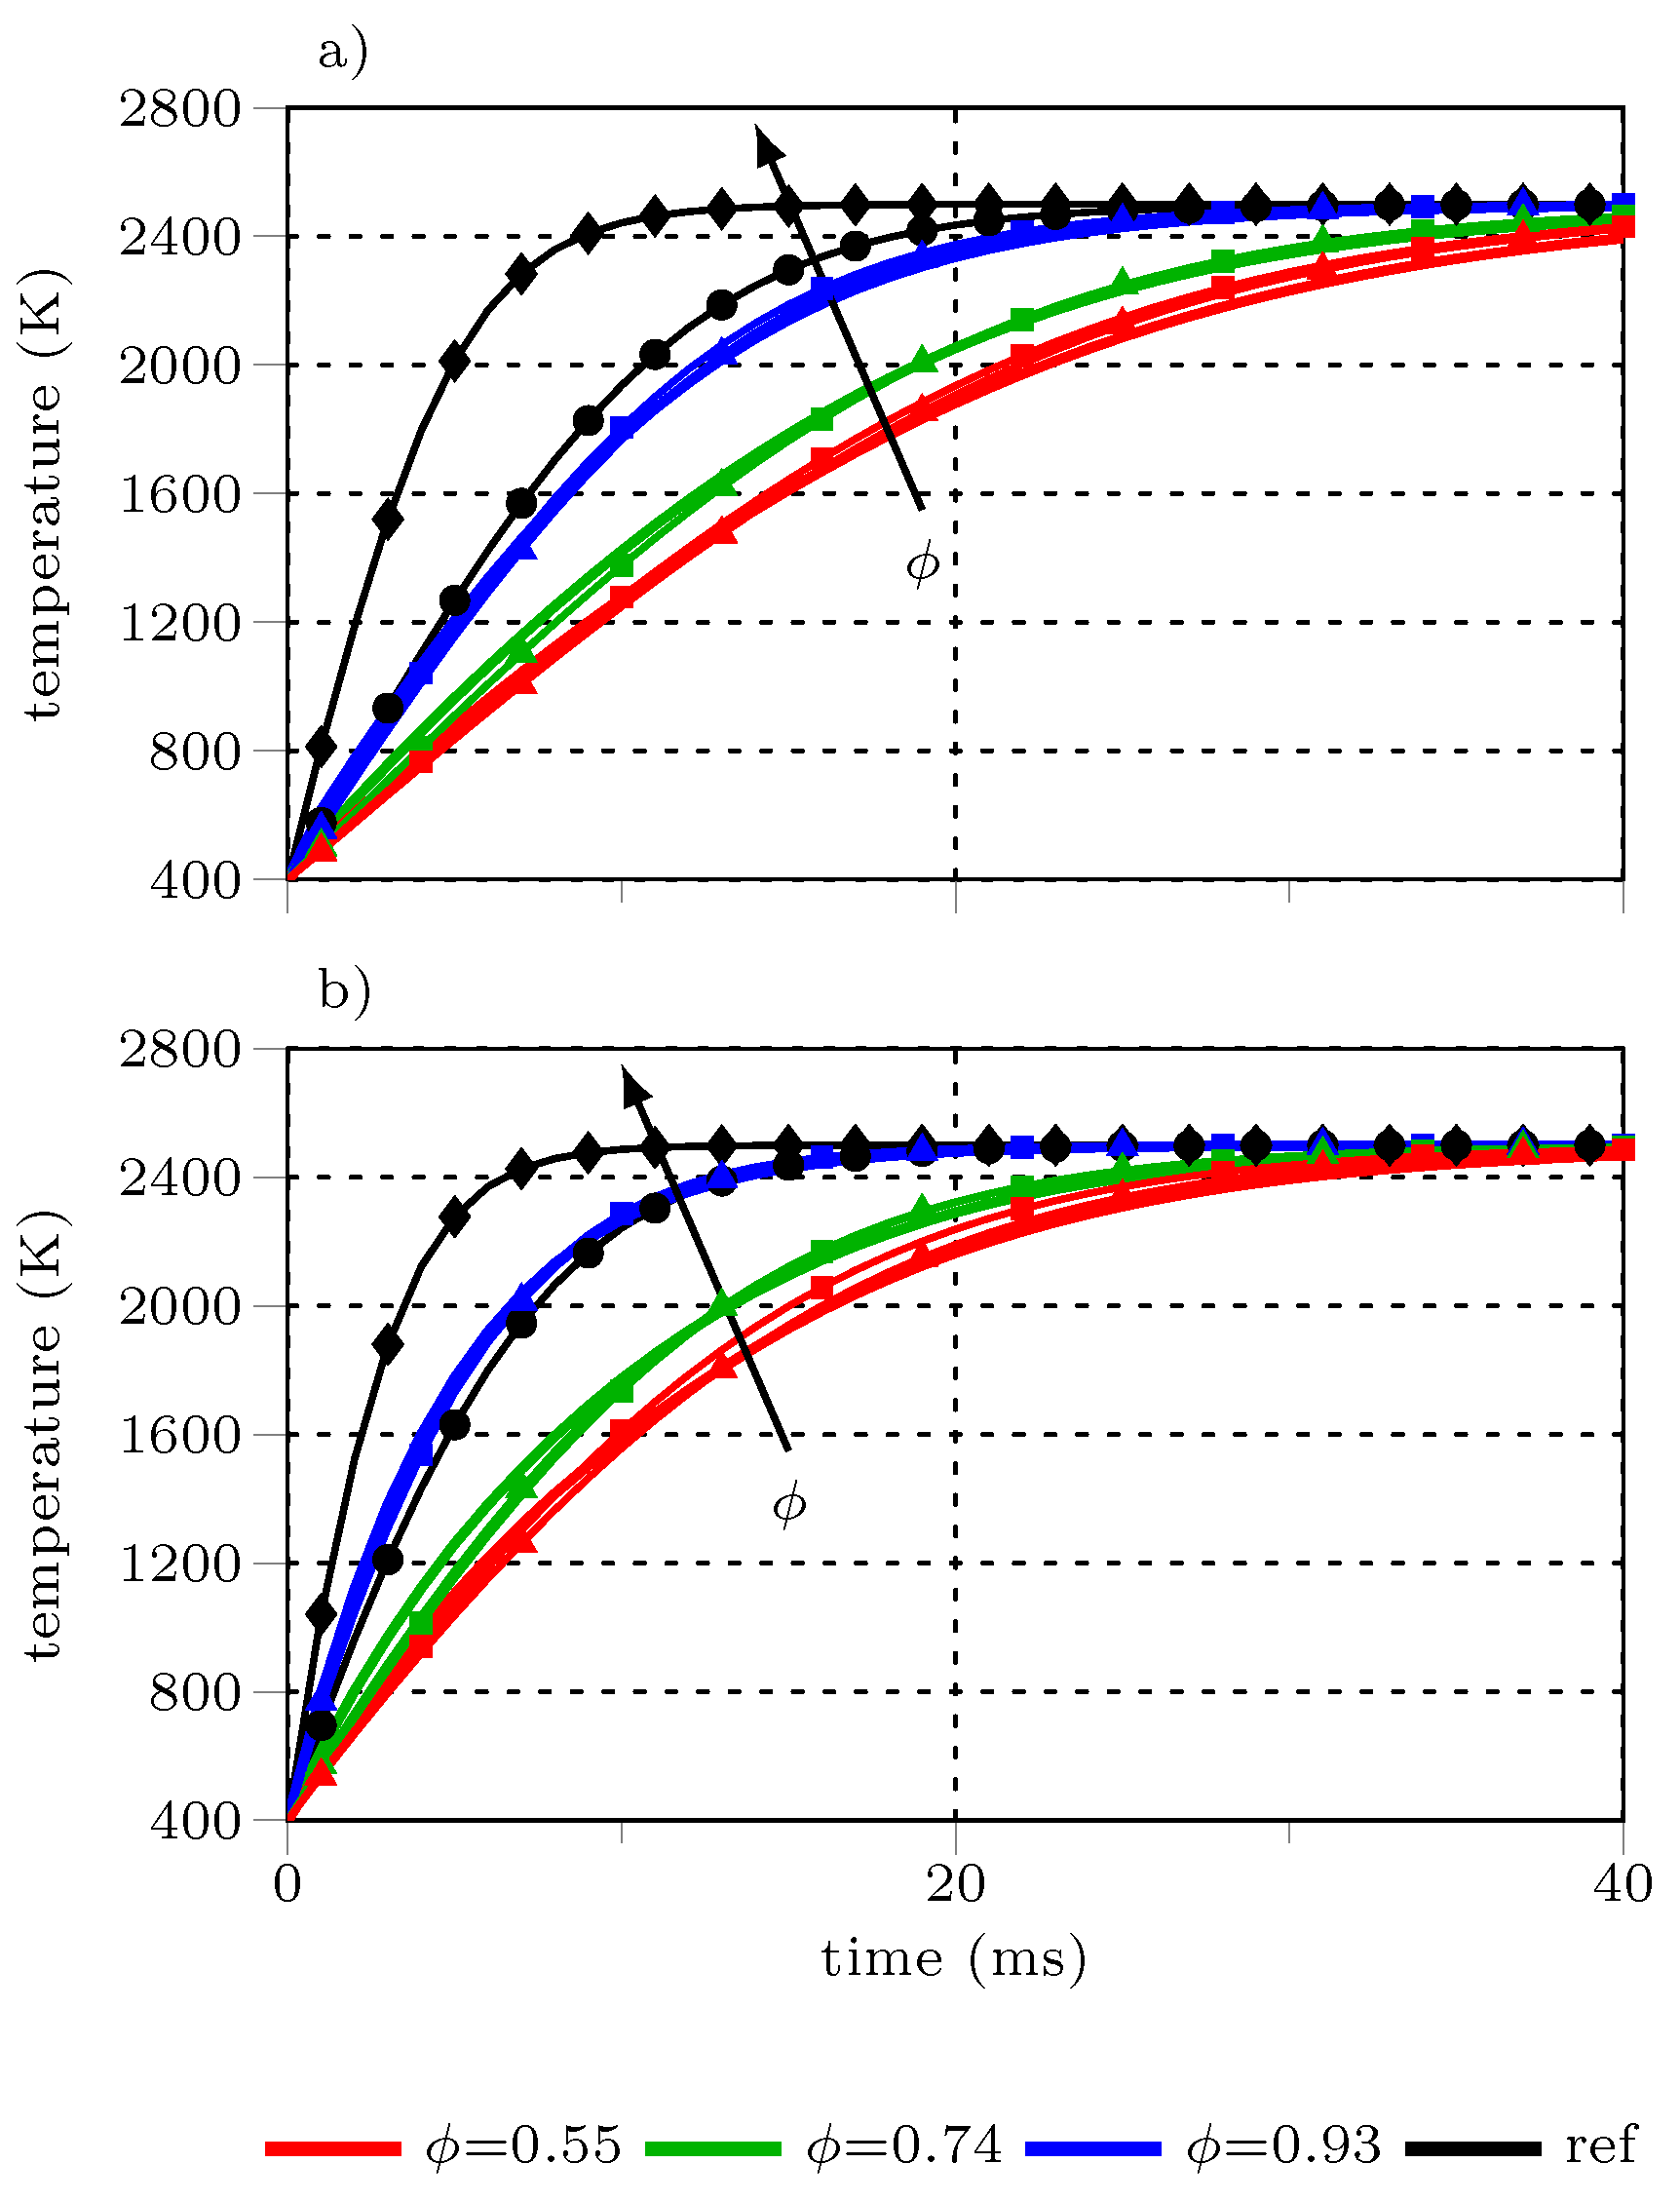
), Gnielinski [32] ( ), Gunn [65] ( ), Sun et al. [24] ( ), Municchi and Radl [25] ( )) with the multiple linear regression (MLE) of Equation 16 ( ) and the Lévêque (GLE) of Equations (17)–(19) ( ) correlations versus void fraction (a) and particle Reynolds number (b). Red: (a) lower ReP, (b) lower void fraction; Blue: (a) higher ReP, (b) higher void fraction. ) and Lagrangian parcel temperatures using the multiple linear regression (MLR) ( ) and the Lévêque (GLE) ( ) Nusselt correlation for relative velocities of 0.5 m/s (a) and 13 m/s (b). Size equivalent (
  ) and surface and mass equivalent (
  ) reference cases use the Whitaker heat transfer model.
) and Lagrangian parcel temperatures using the multiple linear regression (MLR) ( ) and the Lévêque (GLE) ( ) Nusselt correlation for relative velocities of 0.5 m/s (a) and 13 m/s (b). Size equivalent ( ) and surface and mass equivalent ( ) reference cases use the Whitaker heat transfer model.
) reference cases use the Whitaker heat transfer model.
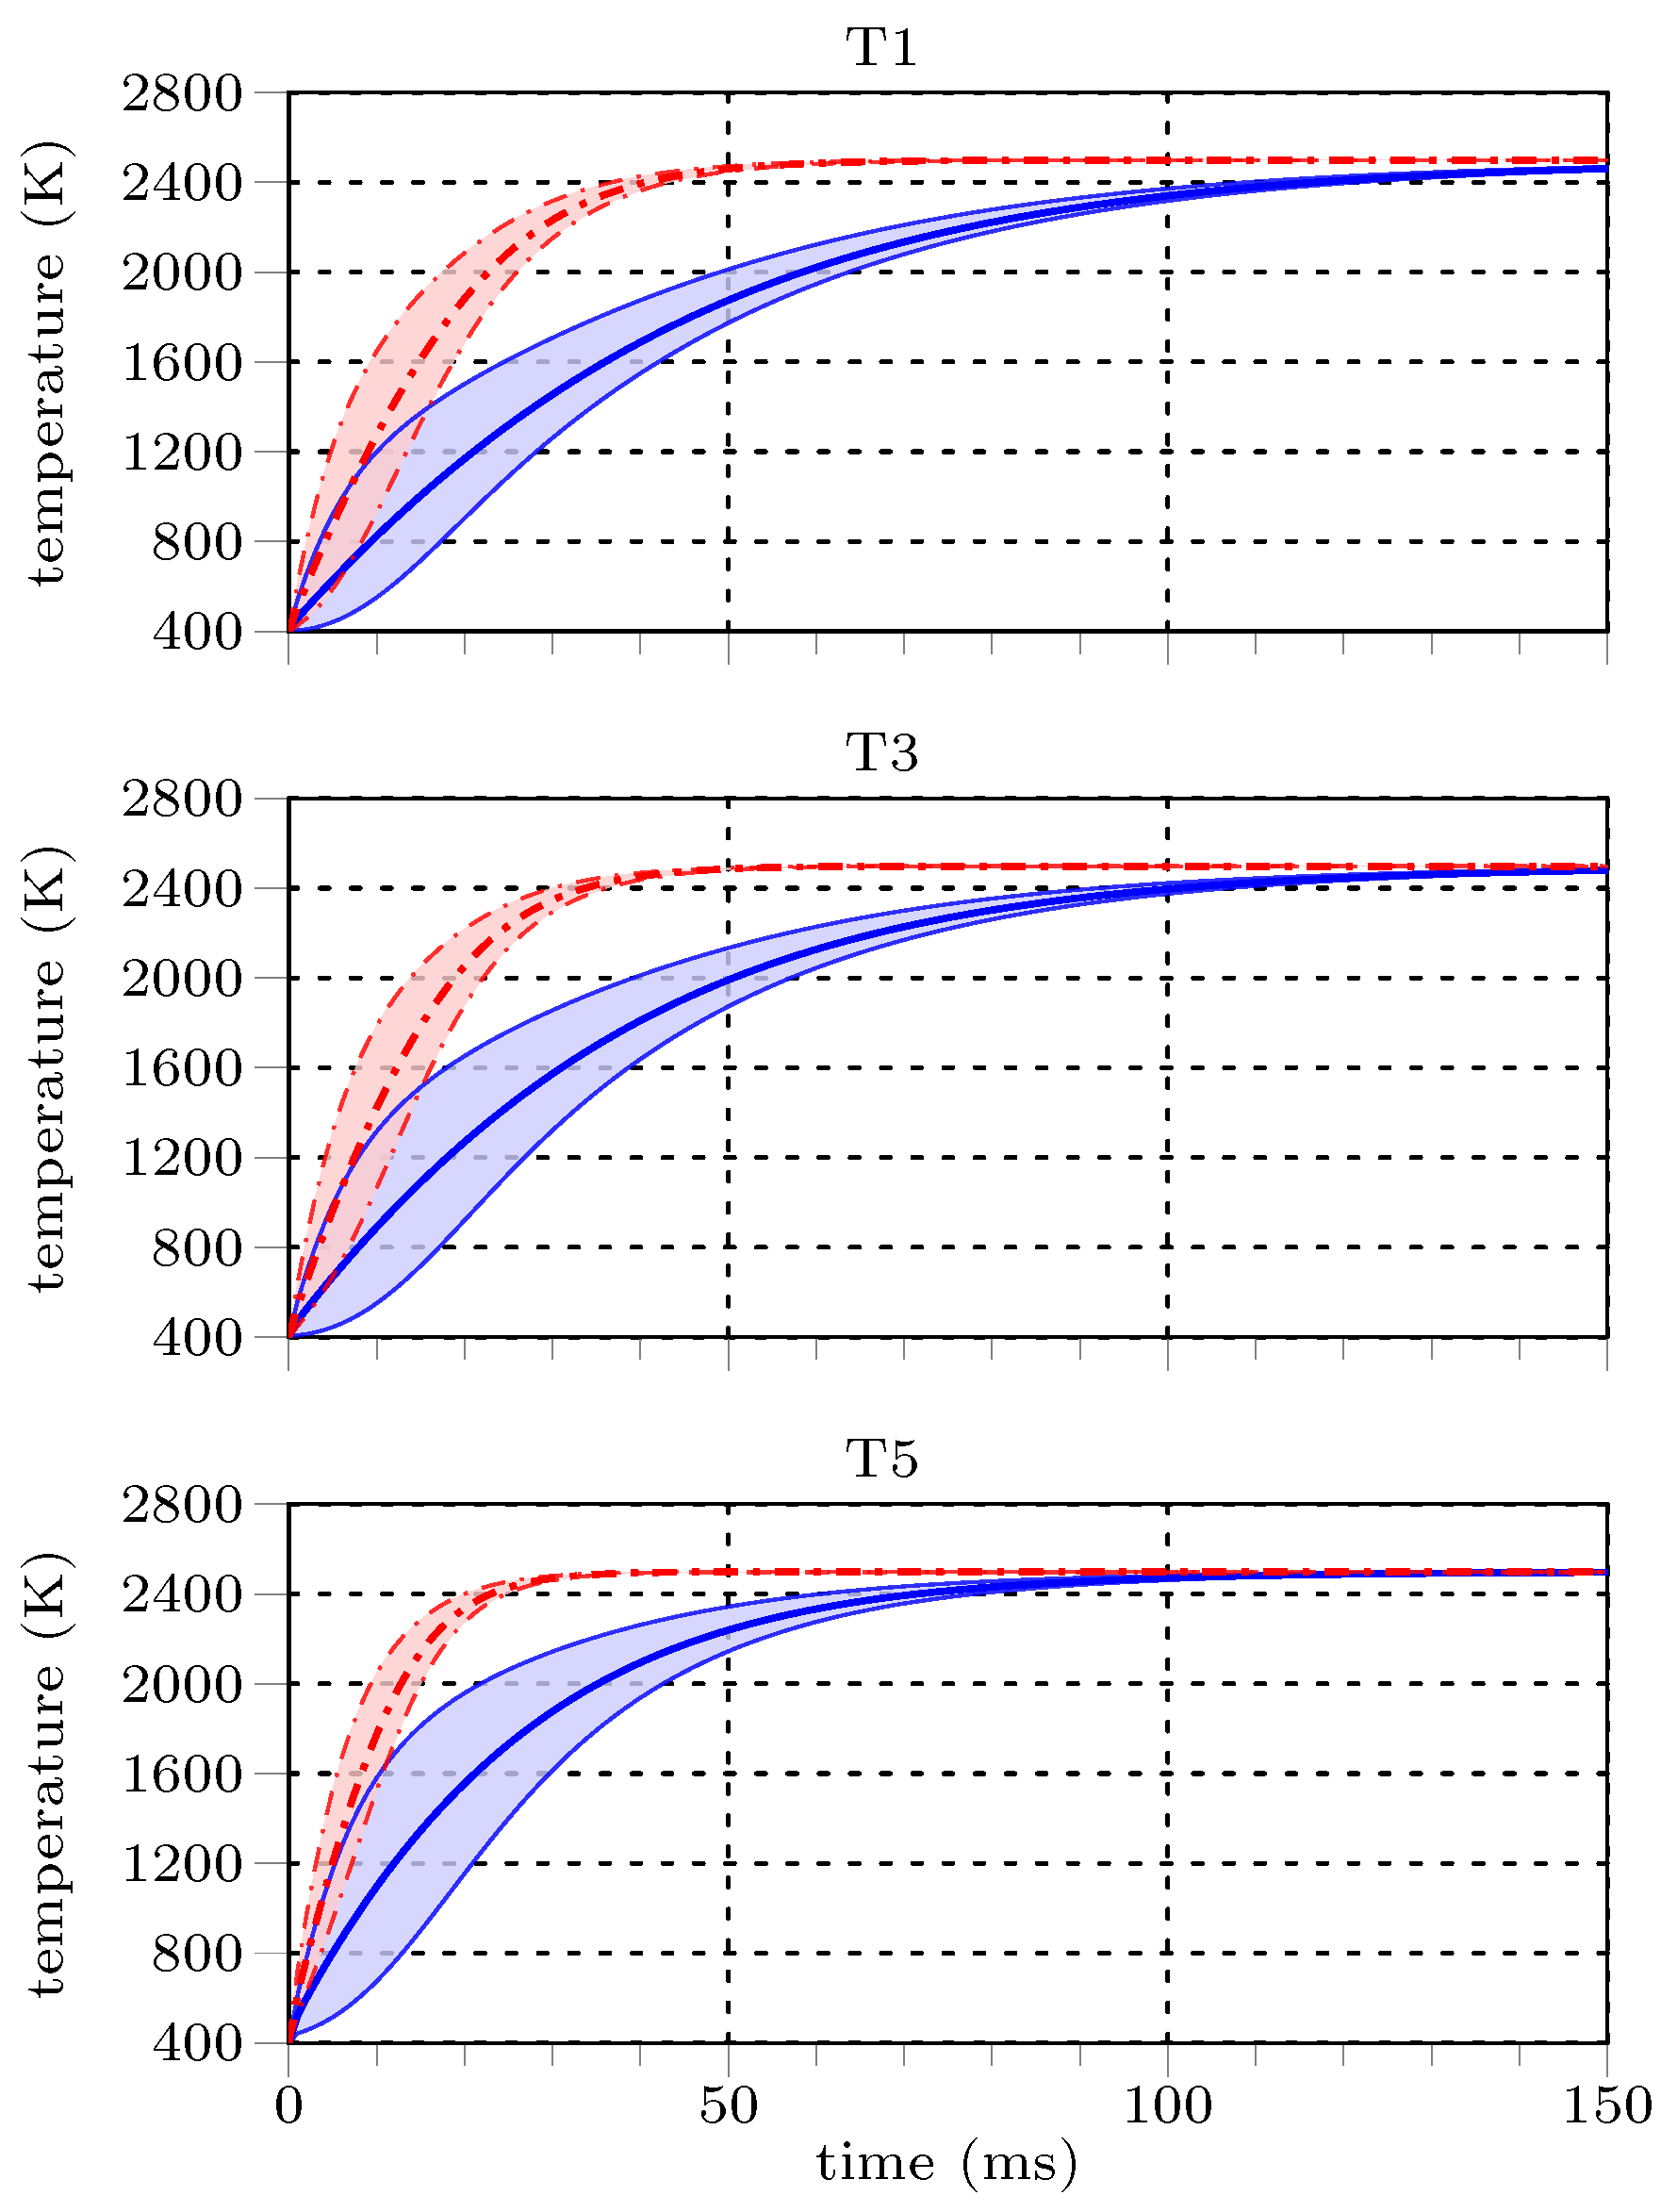
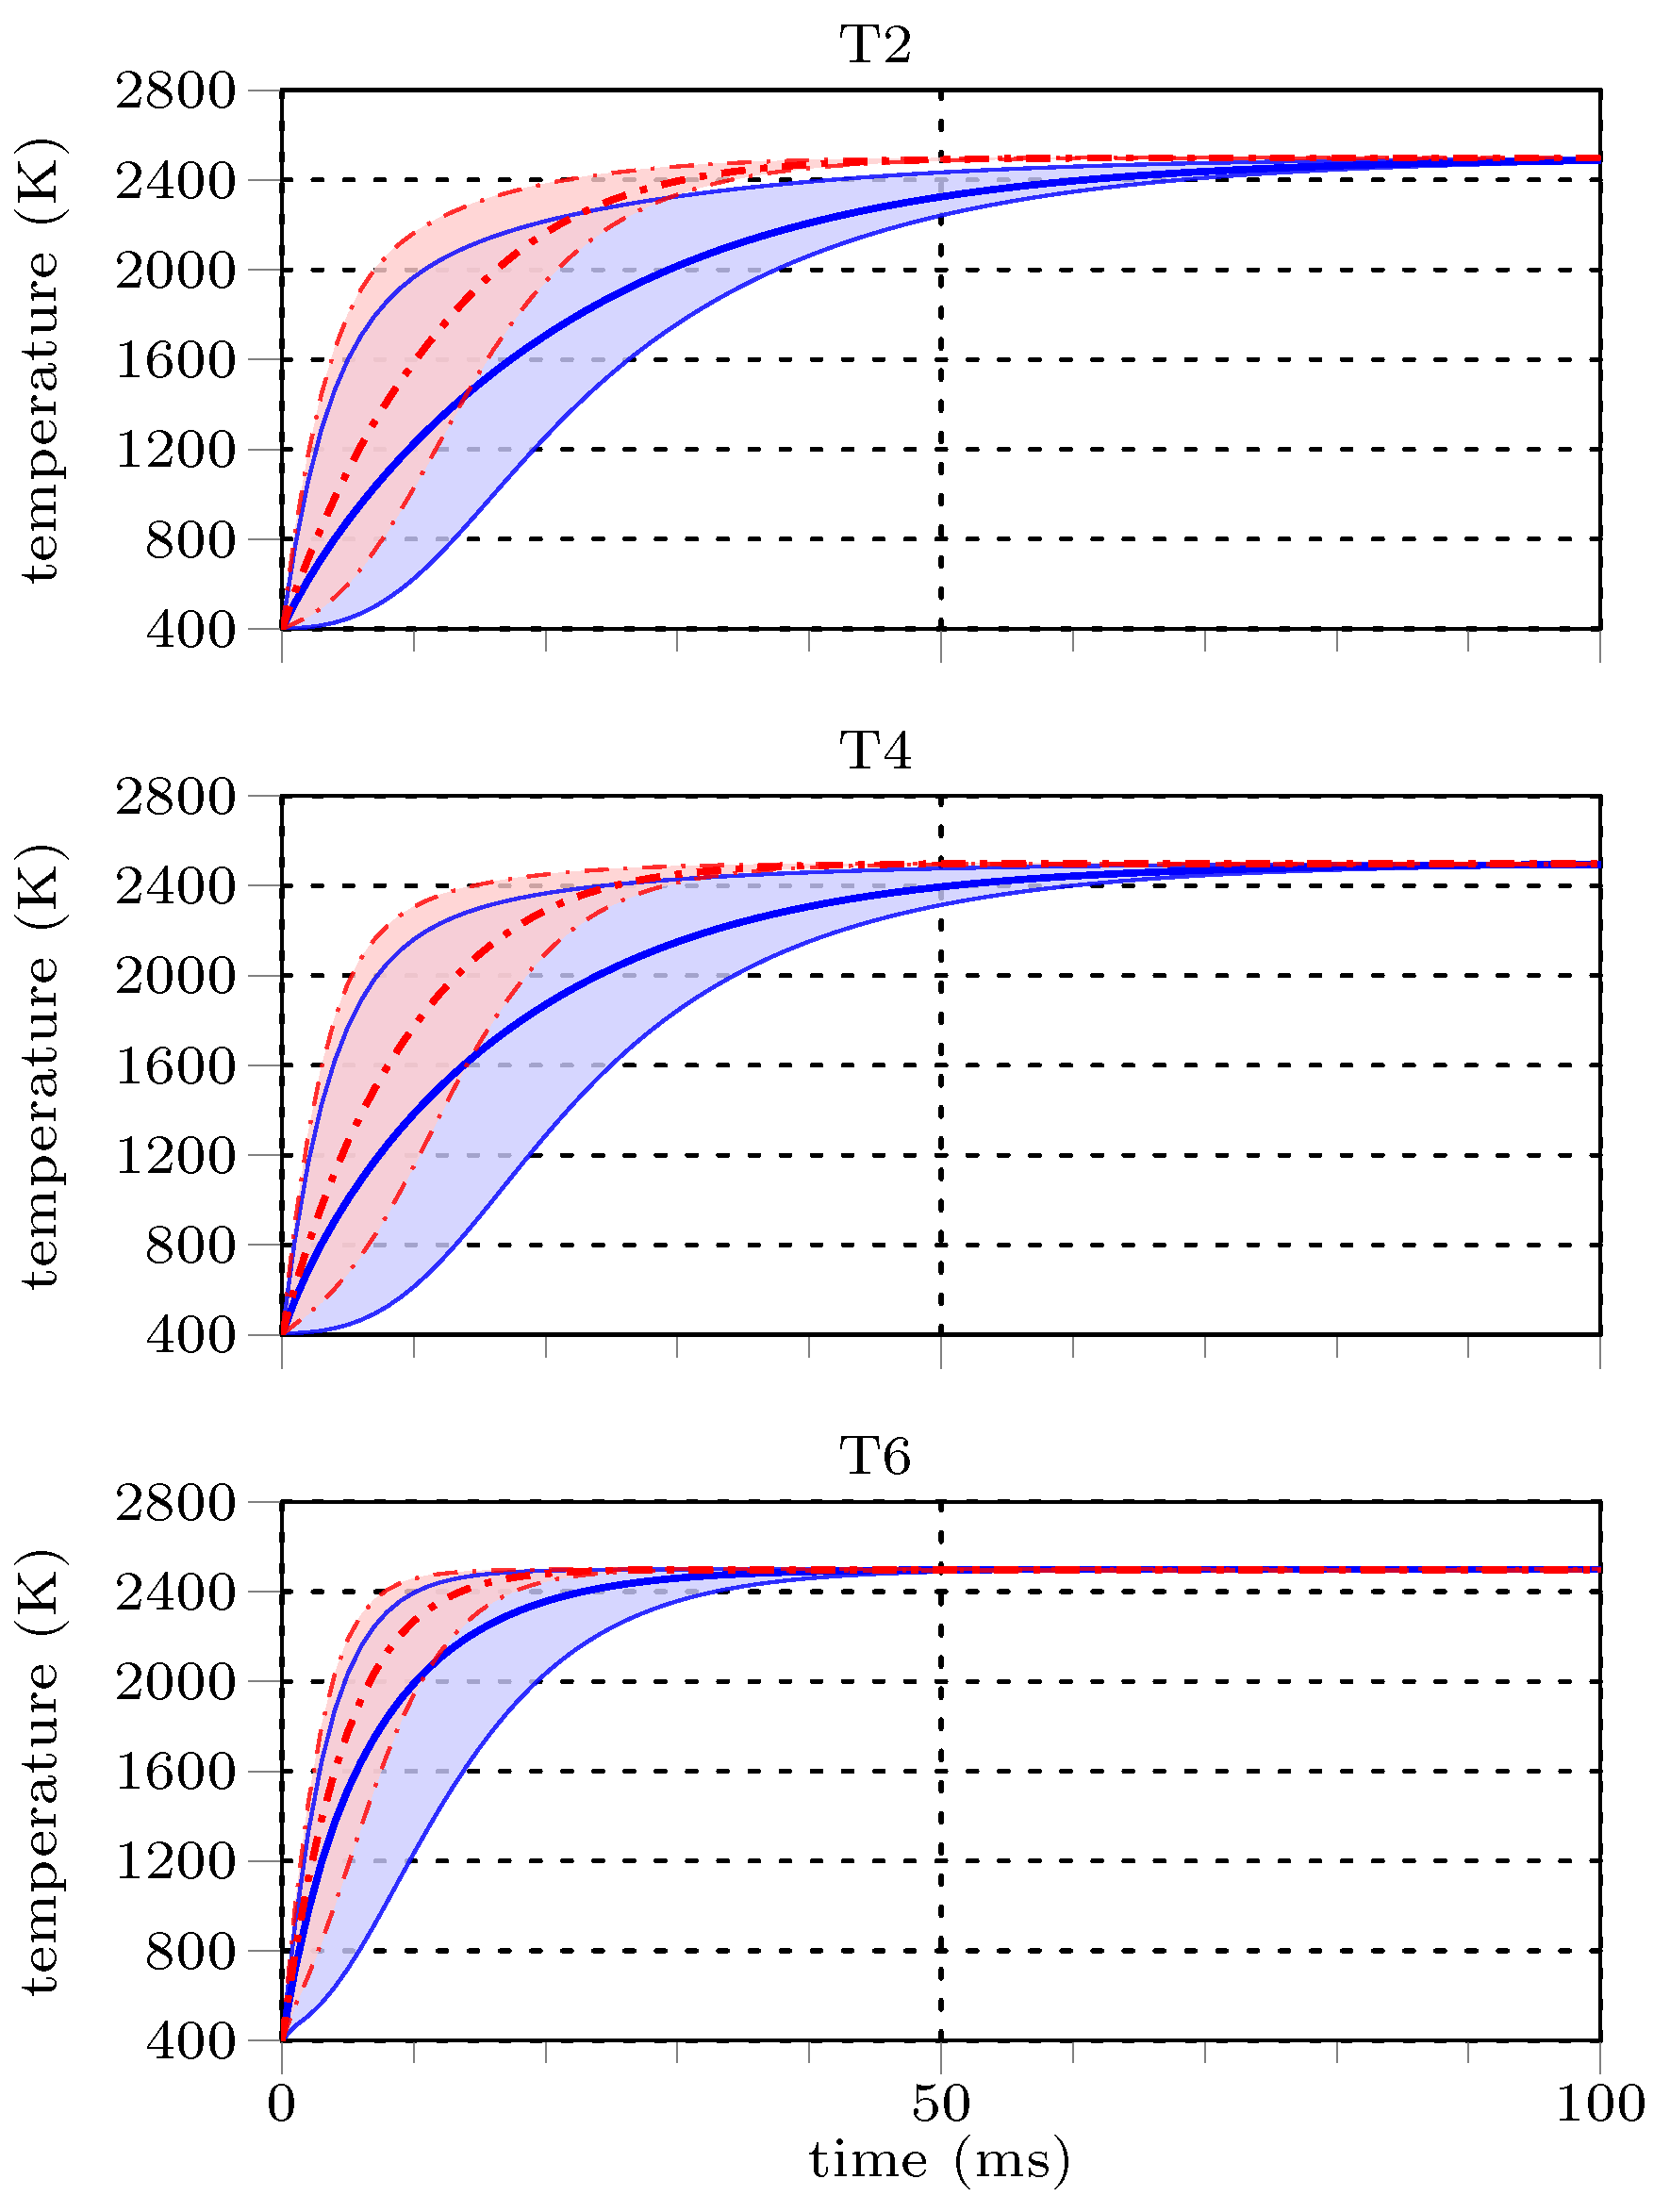
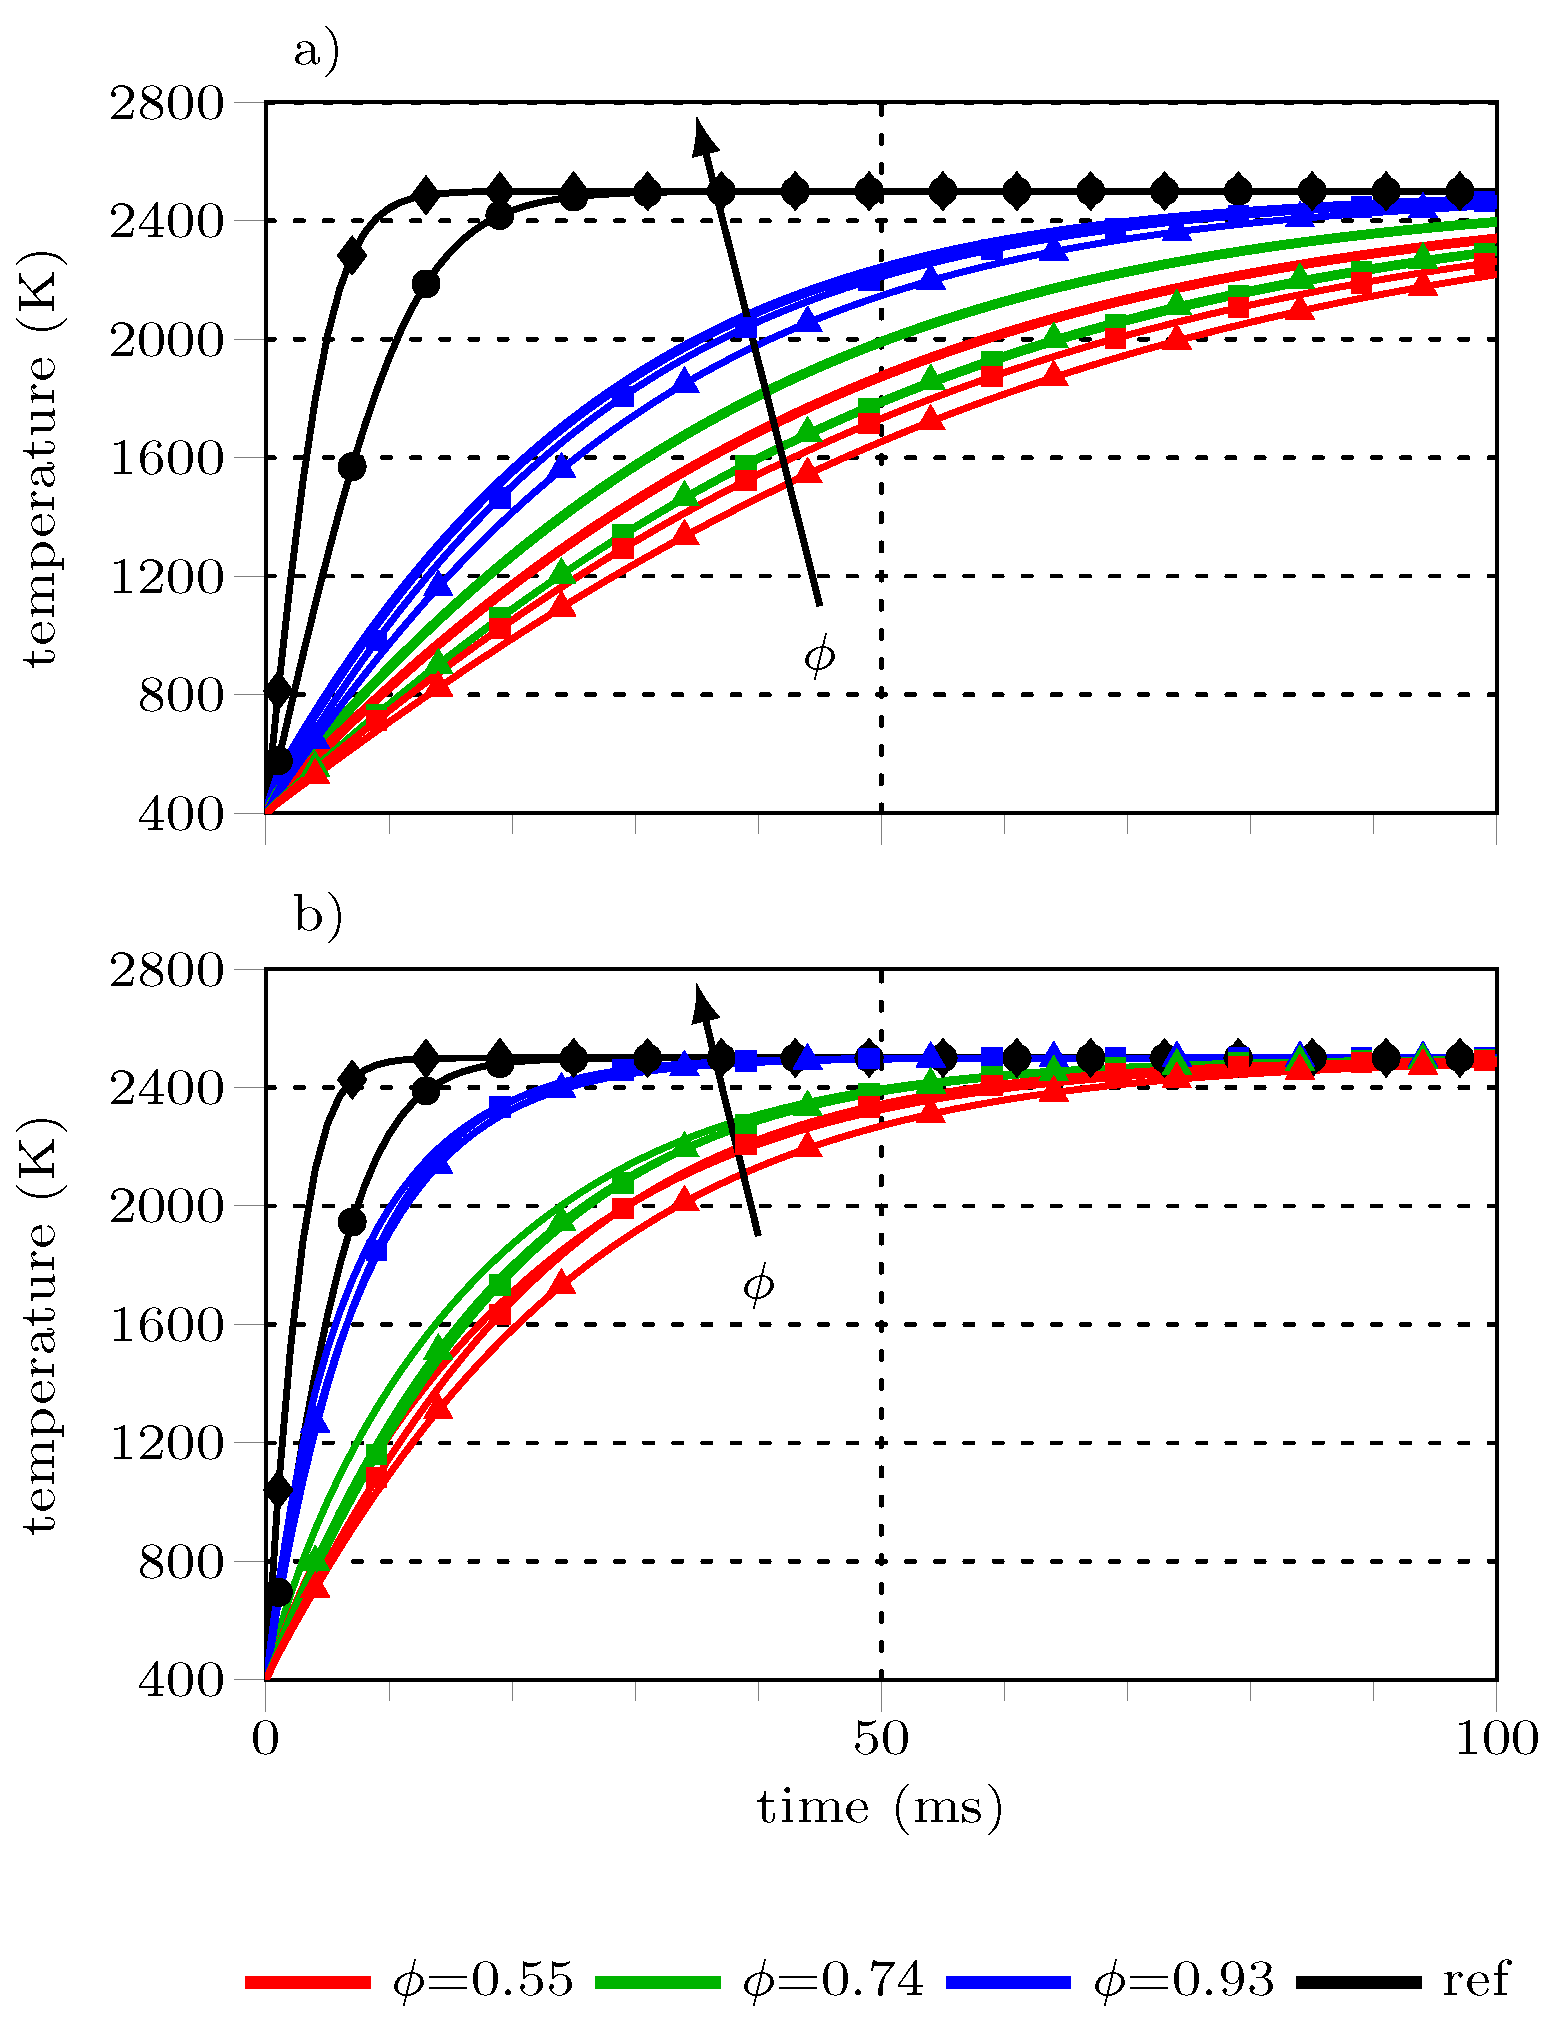
) and Lagrangian parcel temperatures using the multiple linear regression (MLR) ( ) and the Lévêque (GLE) ( ) Nusselt correlation for relative velocities of 0.5 m/s (a) and 13 m/s (b). Size equivalent ( ) and surface and mass equivalent ( ) reference cases use the Whitaker heat transfer model. ) and Lagrangian parcel temperatures using the radiative heat transfer correction and the Nusselt correlation ( ) and the Lévêque approach ( ) for relative velocities of 0.5 m/s (a) and 13 m/s (b). Size equivalent ( ) and surface and mass equivalent ( ) reference cases use the Whitaker heat transfer model.
) and Lagrangian parcel temperatures using the radiative heat transfer correction and the Nusselt correlation ( ) and the Lévêque approach ( ) for relative velocities of 0.5 m/s (a) and 13 m/s (b). Size equivalent ( ) and surface and mass equivalent ( ) reference cases use the Whitaker heat transfer model.
) and Lagrangian parcel temperatures using the radiative heat transfer correction and the Nusselt correlation ( ) and the Lévêque approach ( ) for relative velocities of 0.5 m/s (a) and 13 m/s (b). Size equivalent ( ) and surface and mass equivalent ( ) reference cases use the Whitaker heat transfer model.
| Case | Distance 2 × x | |||
|---|---|---|---|---|
| id | (m/s) | (-) | (-) | () |
| T1 | 0.5 | 0.29 | 0.552 | 100 |
| T2 | 13 | 7.50 | 0.552 | 100 |
| T3 | 0.5 | 0.29 | 0.741 | 120 |
| T4 | 13 | 7.50 | 0.741 | 120 |
| T5 | 0.5 | 0.29 | 0.935 | 190 |
| T6 | 13 | 7.50 | 0.935 | 190 |
| Patch | U | p | T | I |
|---|---|---|---|---|
| inlet | fixed value | zero gradient | fixed value | gray body |
| outlet | zero gradient | fixed value | zero gradient | gray body |
| wall | slip | zero gradient | zero gradient | gray body |
| gas-solid interface | no slip | zero gradient | coupled | gray body |
| Gas-Phase Composition (kg/kg) | |
|---|---|
| H2O | 0.01 |
| N2 | 0.72 |
| O2 | 0.27 |
| Bulk Gas-Phase Thermophysical Properties | |
| density () | 0.69 kg m−3 |
| specific heat capacity () | 1300 J kg−1K−1 |
| thermal conductivity () | 0.133 W m−1K−1 |
| dynamic viscosity () | 7.213× 10⁻⁵ Pa s |
| Solid Thermophysical Properties | |
| density () | 1100 kg m−3 |
| emissivity () | 1 |
| specific heat capacity () | 1660 J kg−1K−1 |
| thermal conductivity () | 1.241 W m−1K−1 |
| Case | m | |||
|---|---|---|---|---|
| id | (m/s) | () | (-) | (kg) |
| SE1 | 0.5 | 60 | 0.29 | 1.24 × 10⁻¹⁰ |
| SE2 | 13 | 60 | 7.50 | 1.24 × 10⁻¹⁰ |
| ME1 | 0.5 | 211.8 | 1.02 | 5.47 × 10⁻⁹ |
| ME2 | 13 | 211.8 | 26.46 | 5.47 × 10⁻⁹ |
| AE1 | 0.5 | 397.8 | 1.91 | 3.63 × 10⁻⁸ |
| AE2 | 13 | 397.8 | 49.70 | 3.63 × 10⁻⁸ |
| AME1 | 0.5 | 397.8 | 1.91 | 5.47 × 10⁻⁹ |
| AME2 | 13 | 397.8 | 49.70 | 5.47 × 10⁻⁹ |
| Case | Solid Loading | Distance 2 × x | |||
|---|---|---|---|---|---|
| id | (m/s) | (-) | (-) | Ratio (-) | () |
| ST1–ST5 | 0.5, 1, 5, | 0.29, 0.58, 2.88, | 0.477 | 1737 | 95 |
| 13, 25 | 7.5, 14.42 | ||||
| ST6–ST10 | 0.5, 1, 5, | 0.29, 0.58, 2.88, | 0.552 | 1288 | 100 |
| 13, 25 | 7.5, 14.42 | ||||
| ST11–ST15 | 0.5, 1, 5, | 0.29, 0.58, 2.88, | 0.663 | 805 | 110 |
| 13, 25 | 7.5, 14.42 | ||||
| ST16–ST20 | 0.5, 1, 5, | 0.29, 0.58, 2.88, | 0.741 | 556 | 120 |
| 13, 25 | 7.5, 14.42 | ||||
| ST21–ST25 | 0.5, 1, 5, | 0.29, 0.58, 2.88, | 0.796 | 407 | 130 |
| 13, 25 | 7.5, 14.42 | ||||
| ST26–ST30 | 0.5, 1, 5, | 0.29, 0.58, 2.88, | 0.867 | 243 | 150 |
| 13, 25 | 7.5, 14.42 | ||||
| ST31–ST35 | 0.5, 1, 5, | 0.29, 0.58, 2.88, | 0.909 | 159 | 170 |
| 13, 25 | 7.5, 14.42 | ||||
| ST36–ST40 | 0.5, 1, 5, | 0.29, 0.58, 2.88, | 0.935 | 111 | 190 |
| 13, 25 | 7.5, 14.42 | ||||
| ST41–ST45 | 0.5, 1, 5, | 0.29, 0.58, 2.88, | 0.969 | 51 | 243 |
| 13, 25 | 7.5, 14.42 | ||||
| ST46–ST50 | 0.5, 1, 5, | 0.29, 0.58, 2.88, | 0.994 | 10 | 415 |
| 13, 25 | 7.5, 14.42 | ||||
| ST51–ST55 | 0.5, 1, 5, | 0.29, 0.58, 2.88, | 0.997 | 5 | 523 |
| 13, 25 | 7.5, 14.42 | ||||
| ST56–ST60 | 0.5, 1, 5, | 0.29, 0.58, 2.88, | 0.999 | 1 | 892 |
| 13, 25 | 7.5, 14.42 | ||||
| ST61–ST65 | 0.5, 1, 5, | 0.29, 0.58, 2.88, | 1 | - | - |
| 13, 25 | 7.5, 14.42 |
Publisher’s Note: MDPI stays neutral with regard to jurisdictional claims in published maps and institutional affiliations. |
© 2022 by the authors. Licensee MDPI, Basel, Switzerland. This article is an open access article distributed under the terms and conditions of the Creative Commons Attribution (CC BY) license (https://creativecommons.org/licenses/by/4.0/).
Share and Cite
Bösenhofer, M.; Pichler, M.; Harasek, M. Heat Transfer Models for Dense Pulverized Particle Jets. Processes 2022, 10, 238. https://doi.org/10.3390/pr10020238
Bösenhofer M, Pichler M, Harasek M. Heat Transfer Models for Dense Pulverized Particle Jets. Processes. 2022; 10(2):238. https://doi.org/10.3390/pr10020238
Chicago/Turabian StyleBösenhofer, Markus, Mario Pichler, and Michael Harasek. 2022. "Heat Transfer Models for Dense Pulverized Particle Jets" Processes 10, no. 2: 238. https://doi.org/10.3390/pr10020238