1. Introduction
Circular Economy (CE) is a systemic approach to economic development that is designed to benefit businesses, society, and the environment. In contrast to the “take–make–waste” linear model, which is built on extracting raw materials from nature and producing things that are either consumed or discarded, a circular economy is regenerative by design and aims to gradually decouple growth from the consumption of finite resources [
1]. Its goal is to close the loop on the linear lifespan of products by replacing the concept of End-of-Life with that of restoration [
2]. There are several strategies that can and should be adopted to reach this goal, from the creation of a superior design for the system to the redesign of the associated Business Model (BM), which have the aims of reducing waste and retaining as much value as possible from the products and resources that are being used [
3]. Out of all the strategies aiming for CE, this work focuses on the Life Cycle Extension Strategies (LCES) as defined in [
4], which have the objective of extending the life cycle of a product by “slowing” and/or “closing” the loop—namely acting on the Middle-of-Life (MoL) and/or the End-of-Life (EoL), respectively—of the product, which in this case is a piece of industrial equipment.
Even though the transition toward a circular production and consumption model is recognized as the only way to revert the depletion of resources, the management of the deriving value chains significantly increases business complexity [
5]. Therefore, it is essential to understand in advance the impacts of the implementation of circular strategies, and to be able to evaluate and compare the performance of these strategies based on their feasibility and potential sustainability results. Indeed, circularity in and of itself does not guarantee positive social, economic, and environmental performance, i.e., circularity is not guaranteed to be sustainable. The sustainability of circular strategies needs to be measured against their linear counterparts to identify and avoid strategies that increase circularity but lead to unintended externalities [
6]. Thus, in order to select and implement circular strategies, companies need to have the tools/methodologies to evaluate and compare the performance of the strategies both in terms of progress toward CE and also based on their feasibility, business outcomes, and sustainability performance.
However, evaluation methods for circularity strategies at the product level are in their infancy [
7]. When considering the existing literature on the topic, it has been observed that some commonalities can be identified amongst the different frameworks addressing the impact assessments of EoL strategies. Specifically, the available frameworks include very similar steps that constitute the procedure to be applied in order to evaluate the sustainability performances of the EoL strategies. These common steps are: (i) the evaluation of the product characteristics; (ii) the selection of EoL options; (iii) the quantitative analysis of the different options; iv) the ranking of the valuable EoL options and the selection of the best one.
The first step consists of a preliminary evaluation of the required product characteristics in order to understand the feasibility of the EoL options. For instance, Phuluwa et al. [
8] proposed a sustainable decision framework for the selection and implementation of the EoL options in the specific case of rail components.
The second step is the selection of the EoL options that could address the relevant technological, social or economic criteria, depending on the preferences of the decision-maker as to which factors to consider. The list of alternative strategies to be adopted at the EoL stage also varies in length, depending on the methodology being considered. For instance, Ref. [
9] presented a holistic decision support tool to specifically frame remanufacture as the key circular EoL strategy to be adopted as opposed to shredding and recycling/landfilling options, while Alamerew et al. [
7] developed a methodology including the assessment of reuse/resell, repair, refurbish, recondition, repurpose, cannibalization, and recycle strategies as well as remanufacture.
Once the list of feasible EoL strategies for the product is defined, the third step is the quantitative analysis of the different options. This operation usually relies on the results from the evaluation of one or more indicators in the economic and environmental aspects of sustainability. In the work of [
9], the economic assessment evaluated the total profit as the sum of the resale price, core collection cost, and EoL processing cost, while the selected environmental indicator was the energy saving obtained by calculating the percentage of the energy recovered during the EoL process. Phuluwa et al. [
8] developed mathematical models for the estimation of the cost related to the identified EoL options in order to project the cost-effectiveness and profitability. Alamerew et al. [
10] quantified the impacts of the implementation of EoL options based on the net recoverable value and the disassembly cost as the economic indicators and the EoL impact indicator for the environmental aspect, which was calculated through the eco-indicator method [
11], and they also addressed social impacts by considering the exposure to hazardous materials and the number of employees needed to perform all operations associated with the scenario. In a following publication by Alamerew et al. [
7], the list of criteria was enlarged to include legislative, technical, and business categories and they introduced Life Cycle Assessment (LCA) [
12] and Life Cycle Costing (LCC) [
13] as recommended methodologies for evaluating the environmental and economic criteria. Both LCA and LCC are life cycle-oriented assessment methodologies that allow the evaluation of the environmental and economic impacts of a system throughout its life cycle, respectively. The use of life cycle approaches was recommended to overcome the issue of the impacts shifting from one life cycle stage to another [
14].
The last step is the ranking of the valuable EoL options and the selection of the best one, where “best” stands for the optimum trade-off between the possible EoL solutions to be implemented. For instance, Yang et al. [
9] found a set of Pareto trade-off solutions for the optimization problem, having both the economic profit metric to be maximized and the environmental impact metric to be minimized as objective functions. The Alamerew et al. [
7] methodology assigned a score to each strategy based on the weighted sum of the selected indicators, where the weighting was assigned based on evaluation by the decision-maker.
This work aims to propose a conceptual framework that, by following the four steps described above, is meant to: (i) address the manufacture of equipment as an analyzed product; (ii) identify a set of Life Cycle Extension Strategies (LCES) that could be exploited to support the transition toward CE; (iii) allow the comparison of circular and linear strategies, highlighting the differential cost and environmental impacts of each life cycle phase of the equipment through the identification and calculation of indicators concerning both the environmental and economic aspects and exploiting LCA and LCC approaches; (iv) provide a picture of different scenarios, in which it is possible to assess which strategy is most suitable for every life cycle phase from the point of view of sustainability (economic and environmental).
This work aims to fill a few of the gaps identified in the existing literature that is dedicated to the assessment of circular strategies by proposing a methodology that: (1) could address LCES that are not only EoL options but MoL options, such as predictive maintenance, and also potentially Beginning-of-Life (BoL) options, such as Design for X (DFX) strategies; (2) is life cycle-oriented, thus avoiding the issues of problem shifting; (3) could provide a twofold vision on the economic and environmental impacts of the application of LCES under the evaluation of LCC and LCA indicators; (4) could be exploited both qualitatively, as a first step toward circularity awareness and adoption in a “linear approach” industrial context, and quantitatively, as a screening assessment methodology.
The performance differences between the application of the linear approach and the circular approach, or among circular alternatives, are assessed through a differential analysis at the economic and environmental level, which is described in
Section 2, and tested in an industrial case study, which is presented in
Section 3 and discussed in
Section 4.
2. Materials and Methods: Conceptual Framework Development
This section presents the developed conceptual framework that helps to identify the LCES that maximize environmental and economic benefits when applied to industrial equipment in linear economy contexts. The approach depicted here represents the theoretical basis for the evaluation of the effects of the LCES, where LCA and LCC tools were then adopted. The framework consists of the following main blocks:
A list of potential LCES to be applied, which were retrieved from a literature review identifying LCES that could shift the life cycle management of production equipment from a linear to a CE approach (
Section 2.1);
A list of indicators to be exploited in the LCES performance analysis, divided into the two categories of environmental and economic indicators (
Section 2.2);
A calculation methodology, based on LCA and LCC, to evaluate economic and environmental performance based on a “gap approach” that highlights the differences between the circular and linear approaches (
Section 2.3).
The gap methodology was specifically exploited to compare the linear approach with the different possible circular approaches represented by the various LCES that were identified. The gap-based evaluation/analysis described in detail in
Section 2.3.1 is not only meant to present a methodological framework but is also proposing qualitative considerations of the possible differences in the performances generated.
2.1. Selection of LCES
LCES are defined as strategies that have the objective of extending the life cycle of a product, which in this context is a piece of industrial equipment. These strategies address the “slowing loop”, which involves maintenance, including repair, preventive and predictive maintenance, resell and reuse strategies. The LCES also address the “closing loop”, which involves strategies such as remanufacture, recondition, refurbish, and other R-strategies [
4].
The literature presents a wide spectrum of LCES with definitions that overlap and are sometimes even conflicting. The literature review performed by [
4] is exploited in the present work as a foundation in order to identify the list of the potential CE-oriented LCES to be assessed through the calculation methodology. The LCES identified are summarized in
Table 1.
The following sections are dedicated to the description of the economic and environmental indicators exploited by the assessment methodology and to the gap-based methodology (gap analysis,
Section 2.3).
2.2. Selection of Indicators
The aim of the framework presented in this work was to analyze the sustainability performances of the adopted strategies. The benefits offered by the LCES from the environmental and economic point of view were measured by the identified indicators. By considering a life cycle-oriented approach, the indicators were retrieved from the methodologies of LCC and LCA; the former addressed the economic aspect and the latter concerned the environmental aspect of sustainability.
The considered life cycle phases are summarized and described in
Table 2.
A detailed list and description of the indicators concerning the two aspects of sustainability is shown in the following sections.
2.2.1. Economic Indicator (LCC Indicator)
The economic indicator calculated by the evaluation methodology was the total life cycle cost associated with a piece of equipment, from the extraction of the raw materials to the End-of-Life of the equipment. To identify this cost, it was necessary to identify all cost contributions affecting the total cost of the product under analysis. The list of potential cost contributions considered in the current model is described in
Table 3. The cost contributions were associated with the equipment’s life cycle phases in order to outline the economic impact of each stage. These contributions were the basic building blocks of the cost calculation model. Considering the structure proposed by the “Standard for general use IEC 60300-3-3: 2017: Life cycle costing for technological systems” [
13] and adopting a high-level view, these were the general cost items relating to the whole life cycle of the product being considered. As they were formulated as generic elements, most of the cost items were used different times within each life cycle phase.
Depending on the specific cost contribution, adjustment factors could be introduced to consider the effect of learning curves, aging technology, and bank interests on labor, hardware, and investment costs, respectively.
The total cost was calculated by summing the costs associated to each life cycle phase. Within each life cycle phase, cost contributions were identified to detail the single cost items. Most of the time, these contributions were common to the different life cycle phases. For instance, personnel costs contributed to both the manufacturing phase and the disassembly phase. The cost related to a single life cycle phase was thus calculated by summing the different contributions that were expected to affect that phase.
Table 4 presents the cost contributions adopted in the LCC approach, relating to the life cycle phases. The first column of the table lists the cost contributions and the first row presents the life cycle phases. The table shows the association between the phases and the costs with a gray ticked cell. This means, for instance, that the following cost contributions are expected in the design phase: services, personnel, and the amortization of multi-year assets.
The total cost related to the whole life cycle of the equipment was calculated as follows:
where
is the total cost associated to the phase
.
The cost contributions identified in
Table 3 were associated to the life cycle phases in order to outline the economic impact of each stage. Indeed, for each life cycle phase in
Table 4, the associated cost contributions are ticked. The total cost contribution of each phase was given by:
where
is the cost contribution related to phase
and cost item
.
For example, the related cost of the design phase was:
2.2.2. Environmental Indicators (LCA Indicators)
In a similar manner to the economic evaluation, a life cycle approach was also adopted for the environmental assessment in order to analyze and compare the impact of the indicators throughout the entire life cycle of the equipment. According to the ISO 14040 standard series [
12,
25], LCA studies the environmental aspects and potential impacts throughout a product’s life cycle (i.e., cradle-to-grave), from the acquisition of raw materials through to production, use, and disposal. The general categories of environmental impact that need consideration include resource use, human health, and ecological consequences. LCA is carried out, under the ISO LCA standard guidelines [
12], in four distinct but interdependent phases, namely the Goal and Scope Definition, Inventory Analysis, Impact Assessment, and Interpretation phases.
Goal and Scope Definition: The goal sets out the context of the study and explains how and to whom the results are to be communicated. The scope describes the detail and depth of the analysis and should outline the product system, the functional unit, the reference flow, the system boundary, the allocation methodologies, the impact assessment methodology, and other possible elements needed to guide and regulate the other LCA phases.
Inventory Analysis: A Life Cycle Inventory (LCI) analysis is meant to create an inventory of the flows from and to nature (ecosphere) for a product system. It is the process of quantifying raw material and energy requirements, atmospheric emissions, land emissions, water emissions, resource uses, and other emissions over the life cycle of a product or process. The output of an LCI is a compiled inventory of elementary flows from all processes in the studied product system (e.g., a piece of production equipment). The contribution flows used to calculate the environmental impacts, based on ISO 14044 [
25], are summarized in
Table 5. These items could be activated or not depending on the type of process under consideration.
Impact Assessment: A Life Cycle Impact Assessment (LCIA) is aimed at evaluating the potential environmental and human health impacts resulting from the elementary flows determined in the LCI. The ISO 14040 and 14044 standards require the following mandatory steps for the completion of an LCIA:
The selection of impact categories (the environmental issues of concern to which the LCI results may be assigned, e.g., climate change), category indicators (the indicator relating to an impact category that allows the measurement of that environmental impact, e.g., the Global Warming Potential indicator), and characterization models (the assessment models reflecting the environmental mechanisms by describing the relationship between the LCI data and the impacts and effects created);
The classification of the inventory results. The LCI data are assigned to the chosen impact categories according to their known environmental effects; for instance, greenhouse gasses are classified in the climate change impact category while the emission of cadmium into the environment is assigned to the human toxicity impact category;
Characterization, which quantitatively transforms the inventory results of the elementary flow that is classified in an impact category with an impact category indicator via a characterization factor (specific for s classified in c) , is calculated as follows:
The is a numerical factor that is scientifically determined and is meant to translate the into an impact, representing the environmental mechanism associated with the substance s that has an effect and impacts on the impact category c.
In this phase, by selecting a specific impact category for each process included in a life cycle phase of a product, an environmental indicator value could be obtained by summing the impact contributions of the LCI data collected for the specific process, as calculated by Equation (3). The environmental impacts of a product that are associated with a life cycle phase are evaluated by summing the impacts associated with all processes included in that life cycle phase. The total environmental impact of the product is than obtained by summing the impacts of the different life cycle phases. This process can be replicated for all impact categories and their related impact indicators that are selected.
Interpretation: The LCA phase is dedicated to the preparation of the results and their analysis. The final aim of interpretation is twofold: extract all possible information that could be exploited for product improvement; prepare a report for the communication of the results.
As reported in the Goal and Scope definition and in the Impact Assessment phases identified by the ISO 14040 [
12], one of the first steps needed to prepare an LCA is the selection of the impact categories to be addressed along with the related category indicators and characterization methodologies. To this end, a list of potential environmental indicators can be retrieved from the ISO 14025 [
26] certification schemes, also named Environmental Product Declarations (EPDs). This kind of environmental indicator is allocated to the certification of the LCA of the labelled product in order to allow the comparison of similar products from an environmental point of view.
An EPD scheme is based on a given Product Category Rule (PCR) concerning a certain product category. The PCR provides a standardized LCA recipe and instructions on how the LCA should be conducted. As well as indications on the definitions of system boundaries, functional units, and how to define the use phase and EoL options, a PCR also includes the impact categories that need to be assessed.
PCRs are a key part of ISO 14025 as they enable transparency and comparability between EPD labels and are accessible via a PCR library contained within the database of the Program Operator who is managing that specific labelling scheme (e.g., the International EPD
® System) [
27]. For instance, in the context of industrial equipment, it is possible to select a PCR related to the category of “Machinery and Equipment” [
28].
If none of the existing PCRs meets a request, it is possible to consider the list of general environmental indicators, reported in
Table 6, which were retrieved from the Product Environmental Footprint (PEF) initiative: a method proposed by the European Commission that is meant to standardize LCA realization in order to form the basis for a future ISO 14025-like product certification.
Following the same approach as for LCC, life cycle phases were assessed to understand whether an impact was generated in the environmental aspect. With respect to the conclusions obtained for the LCC, the design phase was no longer considered, and the monitoring, disassembly, inspection (both control and test), replace, and reassembly sub-phases were considered as potential marginal contributors, since they were supposed to require more manual processing than resource consumption.
2.3. LCC and LCA Gap Analysis
As anticipated, the evaluation methodology was based on LCA and LCC approaches for the economic and environmental indicators and based on a “gap approach” that was meant to highlight the performance differences between the circular approach and the linear approach by comparing the effects generated by the linear strategy with those created by the LCES analysis.
In order to highlight the advantages, or even the disadvantages, of the application of the Circular Economy model in the production equipment context, a comparison strategy was developed. The proposed evaluation analysis was based on a screening assessment that companies could exploit to measure the possible environmental and economic benefits offered by each LCES in comparison with the linear method of producing, commercializing, and consuming a product.
The model essentially adopted and applied LCC and LCA approaches and aimed to enable a high-level comparison, in terms of environmental impacts and costs, between a specific LCES and the linear economy approach. Through the high-level vision proposed, the model had the objective of identifying the possible general trends of impact gaps that could be generated by the life extension approach in each life cycle phase of a product. Beyond that, the use of variables and parameters came into play in the evaluation of contributions in order to also guarantee a case-by-case evaluation. Indeed, it was not fully possible to determine whether a certain LCES (e.g., resell) always generates benefits for a company that currently bases its business on a liner model. The product itself and the way the company produces and commercializes the product may influence the efficacy of the strategy from economic and environmental points of view.
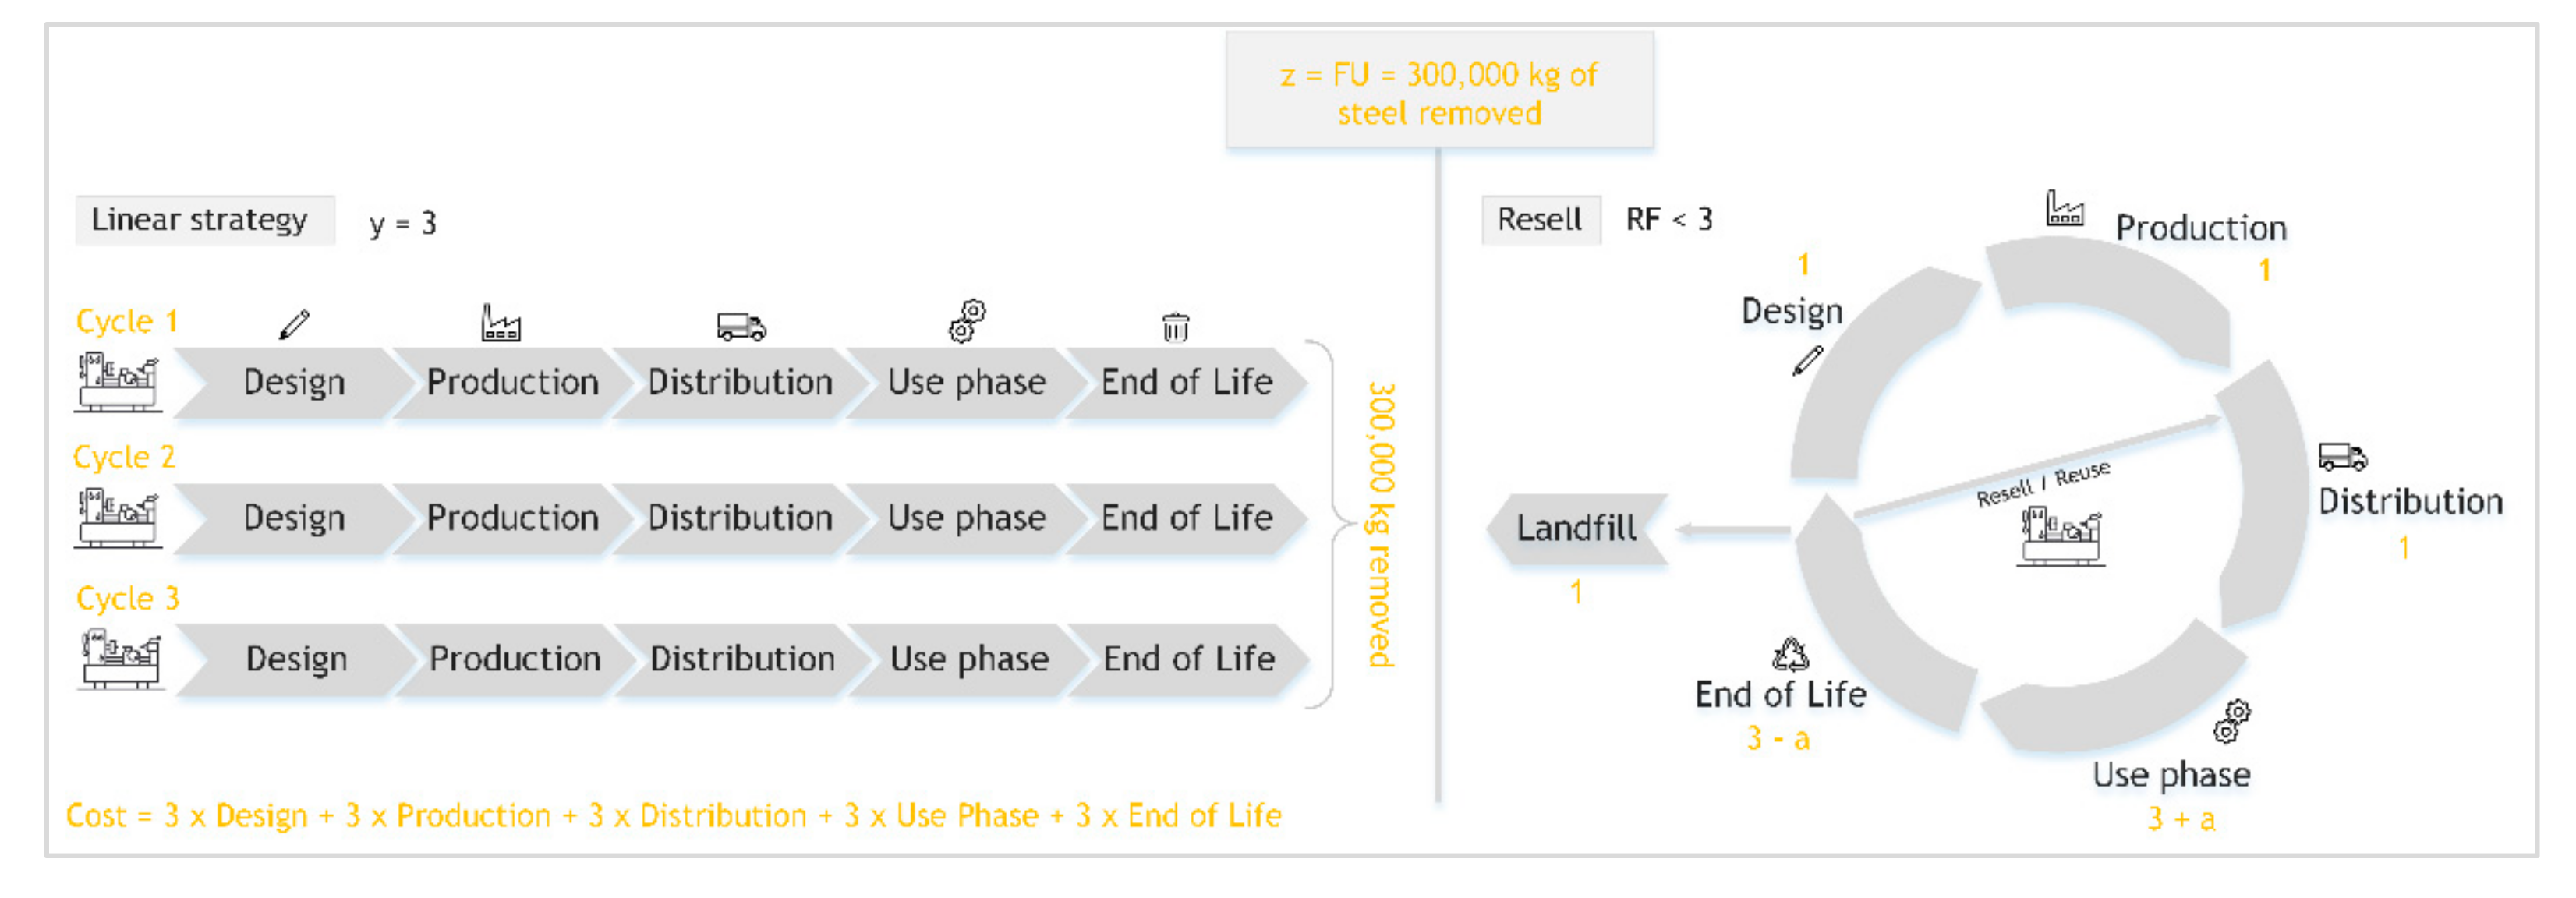
The definition of a Functional Unit (FU) is a prerequisite to allow the gap analysis because it is a comparison methodology oriented to the life cycle perspective, as indicated by the ISO 14040. The FU is a specific quantity of the function of the studied system and provides a reference to which the input and output flows can be related, thereby enabling the comparison of two essentially different systems that provide the same function. The FU thus establishes a common quantity of the function provided. In the comparison of two products, the FU is a fixed parameter that regulates the comparison, while the “amount” of product needed to fulfill a specific function quantity can vary from case to case. This second element is named Reference Flow (RF) and can vary between the different systems under analysis. For instance, when a milling machine is considered as the system under investigation, a possible FU could be fixed at 300.000 kg of removed steel. Considering a milling machine table can remove 100.000 kg of steel during its life cycle, 3 machines would be needed in order to accomplish the given FU, therefore the RF of this specific analysis is 3.
This example case would correspond to the adoption of a linear strategy, since the machinery would be sent to landfill at the end of every life cycle and a new one would be needed in order to fulfil the FU. On the contrary, if applying an LCES to the same example, we could assume that the associated Reference Flow would be less than 3. The LCES strategy is meant to extend the machines’ life cycle, thus the number of machines needed is proportionally less than in the linear case whilst still providing the same amount of removed steel. In the case of the reuse strategy, the RF could be equal to 1 since a single piece of equipment could account for the 300.000 kg of removed steel. Within the developed model, in order to generalize the reasoning carried out in the aforementioned example, the parameter “y” was introduced into the evaluation model to represent the RF of the linear model.
This approach is shown in
Figure 1, with a general approach. On the left side is the representation of the linear strategy, which takes “y” as equal to
n and completes
n life cycles to fulfill the related Functional Unit (
z). On the right side, the concept of circular strategies is presented. In this case, since the circular strategies are designed specifically to extend the life cycle of the product, it is expected that the Functional Unit is reached with a number of machines that is less than
n.
Taking the practical comparison example into consideration (Linear—Resell/Reuse), the related contributions could be calculated as shown in
Figure 2.
The various phases that belong to the life cycle of the linear strategy (on the left) would contribute to the total impacts (environmental and economic) with a factor of 3. On the other hand, the phases of the life cycle belonging to the Resell/Reuse strategy would contribute by a factor of 1, for the most part (see the design, production, distribution, and landfill phases). This means that the execution of the relative phase would be required only once for the Functional Unit to be reached. The use and End-of-Life phases would instead contribute with a value of “3 + a” and “3 − a”, thus demonstrating a gap with a value of “a” in the achievement of the Functional Unit. Therefore, the factor “a” would be introduced to represent the effect of the life cycle extension on the contribution of the life cycle phases. A more detailed description of the “a” parameter is provided in
Section 2.3.1.
2.3.1. The “Gap-Based” Methodology
The proposed methodology supports the evaluation of the adoption of different strategies by assessing their economic and environmental impacts. To achieve this, a general gap assessment method was designed, based on a parametric description of the contribution of the strategies to each life cycle phase and, consequently, on the related contribution.
Considering the linear strategy as the base case, the Functional Unit of the system must be fixed as the first step, and the parameter “y” is exploited to identify the number of life cycles that the machinery must perform to fulfil the FU. Indeed, “y” machines should be produced in order to fulfil the FU using the linear economy case, because the whole system is sent to landfill at the End-of-Life. Therefore, every phase of the life cycle would be repeated “y” times and the associated cost contributions would be counted “y” times.
The same logic would also apply to the analysis of the LCES. However, it is expected that the Functional Unit would be reached within a smaller number of cycles than in the linear case.
In order to account for the impact that an LCES would have on each life cycle phase, 7 parameters (namely “a”, “b”, “c”, “d”, “e”, “f”, and “g”) were introduced; one for each LCES. The total cost associated with the phases of a specific LCES was counted for “y” times minus the related parameter.
It is important to notice that “y” was a fixed positive-valued parameter and had the same value for all strategies, while the other parameters were variable and depended on the strategy under consideration. Moreover, parameters related to a specific strategy (e.g., “a” in the case of the Resell/Reuse strategy) always assumed positive values, but, within the same strategy, also assumed different values depending on the specific life cycle phases being considered. The introduction of additional parameters to highlight this fact was avoided for the sake of simplicity.
Table 7 describes the parameters that were introduced and the boundaries concerning the possible values that they could assume. As reported in the table, each parameter assumed a different boundary in its values in the use phase and distribution/reverse logistic sub-phase within the same LCES. Indeed, in these cases, the parameter was intended to represent an additional positive contribution to the economic impact of the phase.
A parameter “k” was introduced in the case of “Repair” activities (corresponding to the corrective maintenance) for all analyzed strategies. Indeed, the “Repair” sub-phase was repeated more than “y” times in the time horizon in order to fulfil the Functional Unit, therefore k > 0 always (which would have an impact on the costs and the environmental burden).
The proposed method, developed in Excel, consists of a general sheet and is presented as follows in
Table 8. It could be applied to develop both an economic and environmental gap analysis, whilst remembering that the contributions of all life cycle phases had to be considered in the case of LCC analysis, while the design phase contribution (*) was not considered and the monitoring, disassembly, inspection (both control and test), replace, and reassembly sub-phases (**) were considered as potential marginal contributors when performing the LCA.
Since the Recycling strategy was not properly considered as an LCES of the equipment, as it only extends the lifespan of its constituting materials, it was not included as a strategy in the implementation of the methodology, but it was included as a life cycle phase.
The calculation of the total life cycle cost/environmental impact for a strategy was performed using the following formulas:
where:
is the total cost associated to the phase (see Equation (2));
is the indicator of the impact category for the phase (see Equation (3));
is the correction factor for the phase , which introduces the concept of RF (Reference Flow).
For instance, the total cost related to the linear strategy from Equation (4) is:
and the total environmental impact from Equation (5) is:
Likewise, the total cost for the reuse strategy is:
and the total environmental impact is:
Once the contribution, in terms of the multiplying factor for each sub-phase of the life cycle, was determined, the comparison between the linear approach and each LCES was carried out as follows:
Considering the constraints imposed on the parameters, the differential cost/impact obtained from the previous formula assumed a positive or a negative value with the following meanings:
A negative Δ result means that the adopted LCES was less sustainable in terms of costs/environmental impacts than the linear approach;
A positive Δ result means that the adopted LCES was more advantageous in terms of costs/environmental impacts than the linear approach.
2.3.2. Scenario Evaluation
The indication provided by the gap-based methodology was both qualitative and quantitative. First, it aimed to highlight the different cost/environmental impacts provided by LCES strategies with respect to the linear approach. On the other hand, this methodology could be exploited as a theoretical basis to enable future precise evaluations to be carried out, where the parameters and the cost contributions/environmental impacts could be substituted by calculated values and real data gathered from the field concerning specific equipment and actual industrial cases where LCES are being applied. Starting with this method and considering its specific production system, it was possible to quantify the value of the introduced parameters and the cost contributions/environmental impacts in order to carry out the economic/environmental comparison between actual and future production strategies.
Table 9 shows the summary of the qualitative results obtained from the comparison of the differential economic and environmental impacts of the linear strategy with all LCES strategies. The gap assessment for every phase is presented and highlighted with different colors:
Green identifies phases in which the cost/environmental impact gap is in favor of the adoption of an LCES;
Red means that the cost/environmental impact gap in that phase is in favor of the adoption of the linear strategy;
Yellow stands for gap not specified until the company applies the methodology to its specific case. Until then, the gap in that phase could assume both positive and negative values, being in favor of the adoption of an LCES or the linear strategy, respectively;
Gray is when the gap assumes a 0 value, meaning that the cost/environmental impact of that phase is independent from the adopted strategy.
It is clear that in order to extend the product’s life cycle, the adoption of a LCES would imply the necessity for EoL operations that are not part of the life cycle of a machine exploited with a linear strategy. This would result in additional contributions in terms of the environmental impacts of the EoL phases, as can be seen from where most of the red cells are concentrated in
Table 9. On the other hand, greater benefits would be incurred by the adoption of an LCES in the production and distribution phases, where most of the environmental impact is presumably focused.
2.4. Conceptual Framework Implementation Design
As the proposed conceptual framework is thought to be suitable for implementation in business environments, the steps for its adoption in those environments are shown in
Figure 3.
The framework (
Figure 3) consists of the following main blocks:
A preliminary evaluation of the selected product, in which, considering a general life cycle approach, a potential list of LCES is studied and selected for the comparison with the linear strategy in the following phases;
An assessment of environmental and economic strategies, for which a state-of-the-art analysis of the economic and environmental indicators and a data collection phase are required;
A calculation methodology for the economic and environmental indicators, based on a “gap approach”, which highlights the performance differences between the circular approach and the linear approach by comparing the effects generated by the linear strategy with those created by the LCES analysis; and
A final comparison and the decision: an internal activity that is managed by the company that makes the decision on the output of the study, i.e., the strategy chosen to be applied for that product.
The steps will be discussed in greater in
Section 3, considering a real case study with the company A.
3. Implementation
In this chapter, a description of the framework application in a real industrial case study is provided. Based in Switzerland, Company A is a real company with 40 years of experience and is a leader in the production of wooden furniture, included kitchens, wardrobes, bathroom furniture, and furnishing accessories. It specializes in the creation of designer kitchens, for which it provides all necessary services, such as installation, testing, maintenance, and the production of spare parts. Company A has increased its revenues by investing regularly in technology, automation, and innovation and, looking to the future, the business outlook is positive with regard to the growth of recent years.
3.1. Preliminary Evaluation of Selected Product
3.1.1. Product Features Analysis
In this preliminary phase, based on the requirements and the potential benefits that a certain product could bring, the company had to first identify the reference product for the analysis. The general product features that could drive the strategy selection were identified (e.g., the age of the machine, the status of the essential components for its operation, etc.).
Company A has large industrial equipment that needs to have a longer lifespan. In this study, the analysis was focused on a selected production machine: the drilling machine used for drilling wood panels for drawers and for inserting hinges. The choice was motivated by the fact that the drilling machine was the oldest piece of equipment, so the company was at a crossroads between renewing or changing the machine.
3.1.2. Selection of the Potential LCES to Be Applied
Based on the reference product and the potential list of LCES proposed in
Table 1, the company was in charge of choosing the most appropriate strategies in terms of technical and feasibility properties.
The Strategy Characterization Framework (SCF), developed in [
4], served as a basis to provide a deeper and more structured analysis of the strategies. The selection of the most suitable strategy for the extension of the life cycle of the production equipment in this specific industrial case was be facilitated using the SCF. Through the detailed characterization of the LCES provided and by following the SCF’s existing fields, the company could exploit more detailed information about each strategy, such as the description, the life cycle phases involved, which stakeholders were involved in its implementation, the enabling technologies, the related business model, and some implementation actions to put the strategy in place.
The pre-selected strategies were those used for the comparison with the linear strategy through the gap-based methodology to assess the costs and benefits from the sustainability point of view that was presented in this study.
The reasons for the strategy choice of Company A can be summarized as:
Machine lifespan extension: the actual life of the machine was 16 years and the aim was to extend it for an additional 8 years;
Increased machine flexibility in order to help Company A to meet increasing customer demand with the existing equipment.
Based on these reasons and the SCF framework, the goal of Company A was to Refurbish the drilling machine. It aimed to achieve the above objectives through the following interventions on the machine:
The mechanical replacement of the hinge loading system;
The update of the operating system;
The purchase of a new control unit;
The realization of the production management software;
The realization of the interfacing software with the company CAD/CAM systems;
The electric and electronic adaptations needed to accomplish the above interventions.
3.1.3. Identification of the Involved Lifecycle Phases
Once the product and the potential strategies to be adopted were selected, it was important to understand which phases of the life cycle the strategy would affect. The company, depending on its core activities, could select the equipment life cycle phases to be managed internally from the general phases proposed in
Table 2.
Table 10 presents the life cycle phases identified for Company A’s drilling machine, which were selected from the list reported in
Table 2.
3.2. Economic and Environmental Strategies Assessment
3.2.1. Cost Contributions Identification
In order to make the comparison between the economic impacts of the linear and the Refurbish strategies, Company A needed to outline the cost contributions for each phase that contributed to the total life cycle cost of the machine. In
Table 11, the selected cost contributions are presented along with a description detailing the assumptions and the hypotheses that were used to evaluate each contribution. Some of the costs could be obtained by the company in a direct way (e.g., via paid invoices), while others needed to be estimated (e.g., in the case of the repair activities, where an annual average was calculated). These hypotheses concerned not only which costs related to the company activities were the most relevant, but also to the possibility of trying to collect data that were not available.
3.2.2. Environmental Indicators Selection
As described in
Section 2.2.2 it was possible to identify a list of potential environmental indicators for an available EPD certification scheme that addressed the product under analysis with an appropriate PCR. For Company A’s machine and the process that it performed, the EPD from the Swedish Environdec scheme [
28] offered a PCR addressing the relevant equipment sector. Woodworking equipment was not included in the PCR list, but since the panels were drilled, the PCR related to “machine tools for drilling, drilling or milling metal” could be used [
29]. Even though the processed material was wood, the selected PCR was a starting point in the absence of in-depth studies in the available literature on the environmental impacts generated by industrial woodworking machines. The list of indicators retrieved from the selected PCR is presented in
Table 12.
Once the list of main impact categories was defined, the next step was the collection of the data needed to quantify the impacts of the woodworking machine’s life cycle. In this regard, data that could serve as monitoring measurements for the environmental impacts were not yet gathered by Company A. It was possible, however, to elaborate on some hypotheses/considerations to produce a preliminary framework for the data collection operation. Firstly, in light of the purpose of this methodology, it was worth focusing only on the differential environmental impacts created by adopting either a linear approach or a Refurbish operation. Secondly, it was worth recalling that the company was not an OEM, i.e., the company did not produce the machine but purchased it. This meant that the company had no direct access to data related to the production process, unless the machine supplier was willing and able to provide them. To overcome this issue, it was helpful to exploit LCA databases, such as Ecoinvent [
30], to provide an initial approximation of the environmental impacts of the machine’s production. The same reasoning could be applied to the issues generated by the distribution phase, which could be evaluated considering the means of transportation used, the weight of the equipment transported, the distance covered in the linear and Refurbish cases, and the unitary impacts (per t transported and km travelled) available in the database. The hypotheses relative to each life cycle phase are summarized in
Table 13. These considerations referred to the impact gap between the linear and refurbish strategies, thus “impacts” here stands for “differential impacts”. These elements were the input for the next phase of data collection, which exploited LCA databases, such as Ecoinvent. Since Company A had not already started the collection of the necessary data, a future direct interaction with the company would provide clearer, more specific, and more truthful information for the calculation of the selected indicators.
3.2.3. Data Gathering
For both the LCC and LCA approaches, the company had the role of quantifying the cost and environmental contributions of each phase for the strategies considered in the analysis, i.e., the linear strategy and the LCES. The data gathering consisted of collecting the actual cost contribution data for each life cycle phase that was involved in the case of LCC and it consisted of gathering the LCI information for the processes involved in each product life cycle phase and then translating them into the related environmental impacts for the LCA.
For the latter, as stated in
Section 2.2 and on the basis of the availability of company data, the company had to choose the most suitable data collection strategy.
In the case of Company A, the hypotheses described in
Table 11 and
Table 13 constituted the preliminary step toward data collection, since they provided the guidelines to be applied by the company.
3.3. Economic and Environmental Evaluation Analysis
3.3.1. Parametric Gap Analysis
Starting with the choice of the Functional Unit of the system, 16 years in this case, it was possible to elaborate on the parametric analysis. Knowing the functional unit and that the company wanted to extend the life of the machine by an additional 8 years, it was possible to deduce that the variable “y” was equal to 1.5 (the number of life cycles the machinery has to perform to fulfil the FU, see references in
Section 2.3).
For the parametric gap analysis, the theoretical approach reported in
Section 2.3.1 was applied to the Company A case study.
3.3.2. Economic Gap Analysis
Based on the generic formulation taken from
Section 2.3.1,
Table 14 summarizes the economic gap analysis in compliance with the identified FU.
3.3.3. Environmental Gap Analysis
Based on the generic formulation taken from
Section 2.3.1,
Table 15 summarizes the environmental gap analysis in compliance with the identified FU.
3.3.4. Scenario Evaluation
The cost and environmental gap impacts were calculated and are shown in
Table 16.
The resulting gap (
) in terms of the equation were expressed as follows:
By considering the constraints imposed on the parameter d (see
Table 7) and remembering that d took a different value for each life cycle phase (e.g.,
, etc.), the differential cost impact obtained could assume a positive or a negative value. A positive result for
meant that the Refurbish strategy was more advantageous in terms of costs/environmental impacts than the linear approach.
For the environmental impacts, the resulting gap was certainly positive since the parameter d was greater than 0 for each phase, thus:
However, without the numerical contribution, it was not possible to assess the result of the comparison in terms of costs. By considering each phase, it could be said that the result of the comparison was in favor of the refurbish strategy for the design, procurement, distribution, recycle, and disposal phases, being
d > 0 and, consequently,
> 0. On the contrary, the linear approach was more advantageous for the disassembly, replace, and reassembly phases, being
d − 1.5 < 0 and, consequently,
< 0. Thus, the life cycle scenario was in favor of the Refurbish strategy if, given the cost of each phase
, the sum of the certainly positive contribution terms was greater than the sum of the certainly negative contribution terms, which translated to:
3.4. Final Comparison and Decision
The “gap evaluation” method described was meant to propose some qualitative considerations for the possible differences between the generated performances, as reported in
Section 3.3.4 for the Company A case study. Even without actual data on the costs and environmental impacts, the methodology was able to highlight certain trends that could guide Company A in its decision-making process. This was especially true in an ex-ante approach, where the LCES had not yet been implemented so the methodology could provide high-level guidance for identifying possible trends (e.g., refurbish could be less impactful than the linear approach) and, even better, could identify the main life cycle phases and related processes that could affect this CE vs. linear trend. Indeed, the results of the gap analysis for Company A show that the environmental impacts of the refurbish strategy were lower than those of the linear strategy, while the economic benefits of the use of the LCES needs to be tested further to investigate the actual impact of the EoL phase costs on the overall cost scenario. Then, in order to assess the actual advantages (or disadvantages) of the application of the LCES, data from specific cases are needed to calculate quantitative gaps. This would be the only way to actually verify the qualitative observations made by the parametric expression of the “gap evaluation” methodology. Indeed, it was not possible to determine a general rule concerning the possible advantages offered by a life extension approach since the effect needs to be evaluated on a case-by-case basis according to the equipment, the manufacturing, and the characteristics of the logistical processes. For this reason, the final decision and the related adopted strategy was undertaken exclusively by applying the framework. In this specific case, it was possible to deduce the best strategy to select from an economic and/or environmental point of view, but only by attributing the numerical values and considering the objectives of Company A it will be possible to make the final choice of adopting the identified strategy.
4. Discussion
In this work, a conceptual framework was presented that allows the comparison of the different impacts of adopting either a circular or linear strategy throughout the life cycle of a piece of manufacturing equipment. The framework focuses on the evaluation of the impacts, both in terms of cost and environmental burdens, which provide a differential contribution based on a qualitative evaluation of each life cycle phase. The model can be used to evaluate and compare several circular strategies, with the aim of highlighting the most suitable strategy to adopt for a particular situation.
The framework was implemented in the industrial case study of a company (not an OEM) that uses industrial equipment, in order to compare the impacts deriving from the linear and the Refurbish strategies in the context of lifespan extension interventions. In this specific context, the selection of an LCES was straightforward, as it was driven by the actual state of the machine (i.e., age, component malfunction). However, with few adaptations, the gap analysis proposed could also be applied to the comparison between different LCES. This could enable the identification of a more suitable CE strategy to be applied in a specific industrial context.
The gap-based methodology presented in
Section 2, and specifically in
Section 2.3.1, proposed qualitative considerations for the possible differences in the performances generated by LCES throughout each phase of the equipment’s life cycle. These considerations provided a starting point for the assessment of the impacts of CE strategies but need to be contextualized within the industrial scenario. Indeed, in order to assess the actual advantages or disadvantages offered by the application of LCES, data from specific cases are required to calculate the precise gaps. Since the effects need to be evaluated on a case-by-case basis according to the equipment, the manufacturing, and the characteristics of the logistic processes, it was impossible to determine a generic rule concerning the possible advantages offered by a life cycle extension approach. The following step of the quantification of the impacts relies on a procedure for the collection of data regarding the impacts of the adoption of LCES. There needs to be a monitoring system (e.g., sensors, software, etc.) to retrieve the necessary information for calculating the economic and environmental indicators.
From the economic point of view, gathering data to quantify the cost of each life cycle phase may be manageable without much effort but from the environmental side, the impacts arising from the equipment’s life cycle may be difficult to estimate, especially when the company is not the OEM of the equipment, as in the case study of Company A. As an initial attempt, the environmental impacts may be calculated using data from databases, such as Ecoinvent, etc. Even if approximations are unavoidable, a screening procedure that relies on existing data may provide an overall picture of the hot spots throughout the equipment’s life cycle, which may allow the refinement of further data collection.
The application of the framework on a specific industrial case showed that it was able to provide support for the decision-making process of a company that wanted to shift from the linear approach to a more CE-oriented strategy. On the one hand, the gap evaluation could be exploited in its parametric form in an ex-ante approach when most of the actual data on costs and impacts are still not available, especially for the CE approach that is yet to be implemented (starting from the basic assumption that the linear approach was the one already in place). On the other hand, the evaluation methodology presented in this work could provide more reliable guidance for choosing which LCES to adopt, as far as the data were available and accessible (for instance, resulting from cooperation with the machine supplier).
The quantitative exploitation of the gap-based methodology could be activated both in an ex-ante or ex-post approach (where both the linear and the CE strategies were implemented), depending on the company’s interests and whether the company were able to obtain the actual data or to forecast the data through simulations or other techniques. An iterative application of the gap analysis in different moments of the decision-making process could further improve the accuracy of the results, with cost and impacts data becoming more and more available and reliable with each iteration of the gap evaluation procedure.
5. Conclusions
The traditional linear economy, which is built on extracting raw materials from nature and producing things that are either consumed or discarded, is now being replaced by an industrial system that is based on restorative or regenerative processes: the Circular Economy. Its goal is to close the loop on the linear product lifespan by replacing the concept of End-of-Life with that of restoration [
2]. Different strategies can be used to reach this goal, from the creation of a superior design for the system to redesigning the associated BM with the goal of reducing waste and retaining as much value as possible from the products and resources being used. However, due to several challenges that companies face, the concrete application of this model at the micro-level is still in its infancy. One of these challenges is the uncertainty that businesses have in the estimation of the actual impact that adopting CE strategies can have on their activities from environmental and economic perspectives.
This paper aimed to define a conceptual framework to be applied to equipment LCES, which is meant to understand whether the application of a strategy is beneficial or not from an environmental and economic point of view.
As a first step, a list of indicators to be exploited in the LCES performance analysis was designed and divided in the two categories of environmental and economic indicators. Considering a life cycle-oriented approach, the indicators that were adopted reflected the methodologies of LCC and LCA. On the top of this, a calculation methodology based on life cycle perspective approaches was applied by exploiting a gap-based approach, which was meant to highlight the differences between the performances of the circular approach and the linear approach by comparing the effects that they generated. The proposed evaluation analysis was based on a screening assessment that companies could exploit to measure the possible environmental and economic benefits offered by each LCES in comparison with the linear method of producing, commercializing, and consuming products. The model essentially aims to enable a high-level comparison of the costs and environmental impacts. Through this proposed high-level vision, the model has the objective of identifying possible general trends in impacts gaps that could be generated by the life extension approach in each life cycle phase of the product. Nevertheless, the use of variables and parameters came into play in the evaluation of contributions in order to ensure a case-by-case assessment. Indeed, it was not fully possible to establish that a certain LCES always generates benefits for a company that currently bases its business on a liner model, since the product and the company procedures for its production and commercialization may influence the efficacy of the extension strategy from economic and environmental points of view.
Finally, the framework was tested using an industrial case study. At the preliminary stage, Company A identified the reference product for analysis: a drilling machine used for drilling wooden panels for drawers and for inserting hinges. The aim of the company was to Refurbish the drilling machine, and several mechanical and software interventions were planned to achieve this goal. After applying and choosing the cost and environmental indicators, the selected life cycle phases were: co-design, procurement, distribution, use (repair and consumption), and End-of-Life (disassembly, replace, reassembly and disposal). The cost contributions and environmental indicators were defined considering the sector to which the company belongs and the main functions of the analyzed product. Specifically, for the environmental aspect, the PCR relating to “machine tools for drilling, drilling or milling metal” was taken into account. In the application of the gap assessment method, a Functional Unit equal to 16 years (1.5 times the life cycle of the original machine to be refurbished) was selected and the parametric analyses of the economic and environmental gaps were carried out. Potential outcomes were discussed through the scenario assessment and gap calculation. The application of the gap evaluation showed its value even in the parametric form, without actual data on the cost and environmental impacts. In the case of Company A, the methodology showed a high-level trend that suggested that, under some constraints, the Refurbish strategy could show both economic and, especially, environmental advantages. Moreover, the analysis carried out highlighted which life cycle phases and related processes could most affect the identified trend, thereby providing guidance on the possible system hot spots to be taken into account in the implementation of an LCES.
The implementation of the framework in a concrete industrial case study was certainly useful for evaluating further steps that will lead to the improvement of the calculation methodology. On the one hand, it will be possible to integrate the third component of sustainability, the social component, thus allowing a company to evaluate its performance from a triple bottom line perspective. This social aspect can be inserted through the use of the Social Life Cycle Assessment (S-LCA) methodology. On the other hand, another possible and more practical future development is the creation and implementation of a decision-making instrument, i.e., a software tool that can support the calculation steps (including data collection) and the interpretation of the results in order to guide business decisions.


