Article

Life Cycle Energy Consumption and GHG Emissions of the Copper Production in China and the Influence of Main Factors on the above Performance

1
School of Chemistry & Chemical Engineering, Anhui University, Hefei 230601, China
2
School of Materials Science and Engineering, Anhui University, Hefei 230601, China
*
Author to whom correspondence should be addressed.
Processes 2022, 10(12), 2715; https://doi.org/10.3390/pr10122715
Submission received: 12 October 2022 / Revised: 9 December 2022 / Accepted: 13 December 2022 / Published: 15 December 2022
(This article belongs to the Special Issue Research on Process System Engineering)

Abstract

:
The copper demand and production in China are the largest in the world. In order to obtain the trends of the energy consumption and GHG emissions of copper production in China over a number of years, this paper uses a life cycle analysis method to calculate the above two indexes, in the years between 2004 and 2017. The life cycle energy consumption ranged between 101.78 and 31.72 GJ/t copper and the GHG emissions varied between 9.96 and 3.09 t CO2 eq/t copper due to the improvements in mining and smelting technologies. This study also analyses the influence of electricity sources, auxiliary materials consumption, and copper ore grade on the life cycle performance. Using wind or nuclear electricity instead of mixed electricity can reduce energy consumption by 63.67–76.27% or 64.23–76.94%, and GHG emissions by 64.42–77.84% or 65.08–78.63%, respectively. The GHG emissions and energy consumption of underground mining are approximately 2.97–7.03 times that of strip mining, while the influence of auxiliary materials on the above two indexes is less than 3.88%.

1. Introduction

One of the most essential metals in contemporary society is copper. It is widely used in the fields of infrastructure, power, and information technology [1,2]. Copper is a crucial material for the future development of low-carbon technologies, including electric vehicles, wind generation, and solar photovoltaics generation [3,4], and the demand for copper is expected to increase by 275–300%, across the world, by 2050 [5]. However, copper production is an energy-intensive process that requires a lot of fossil fuels and electricity, which leads to a large amount of greenhouse gas (GHG) emissions [6,7]. China is the world’s largest demand for refined copper, which made up 49% of global consumption in 2019 [8]. Systematically assessing the environmental influence of copper production in China is significant for responding to the national carbon neutrality policy and provide data support to guide the future development of the copper industry.
Life cycle assessment (LCA) is not only an effective tool to assess the potential environmental impact of products and materials, but also a tool to provide decision support for the sustainable development of the ecological environment [9,10]. Based on the LCA method, many scholars have analyzed the impact of the metal production process on the environment. Westfall et al. evaluated the cradle-to-gate life cycle of global manganese alloy production to provide a decision basis for improving the environmental and economic performance of manganese alloys [11]. Qi et al. and Genderen et al., studied the LCA performance of zinc production processes in China and globally, intending to provide more accurate environmental impact data for zinc industry development to identify potential improvement methods [12,13]. Tongpool et al. and Olmez et al. conducted the LCA of the steel industry in Thailand and Turkey, showing that the most significant contributor to the environmental category is the consumption of resources [14,15]. Norgate et al. studied the global warming potential (GWP) of the Australian copper production process through the LCA methodology [16]. In the background of the global temperature rise limited to 1.5 °C, Watari et al. explored a series of alternative solutions for global copper production, based on the LCA method, to reduce GHG emissions from the copper industry [17]. Sanjuan-Delmás et al. used the environmental impact of copper production in Europe using two different LCA software [18]. Moreno-Leiva et al. analyzed the impact of solar power on the GWP of copper production in Chile [19]. Adrianto et al. and Reid et al. considered the environmental impacts of copper production tailings in different treatment schemes and different regions [20,21].
There are several environmental studies on copper production in China. Wang et al. analyzed an environmental load of copper production by pyrometallurgy technology in China [22]. Hong et al. and Chen et al. mainly assessed the environmental impact of primary and secondary copper production in China, respectively [23,24]. Song et al. compared the impact of two different smelting technologies on environmental results and showed that the LCA results were slightly different in the smelting copper using the flash and bath processes [25]. The time factor has a significant impact on the validity and accuracy of life cycle results [26,27]. However, the above research only calculated the life cycle data of copper production for one or several years. The LCA inventory is often carried out by collecting time difference data at each time step for dynamic LCA to address this issue [28]. Quinteiro et al. analyzed the impact of ceramic process changes over the 10-year period on the environment from a time perspective [29]. Memary et al. used the time-series LCA method to analyze the impact of time and space factors on copper mining and smelting in Australia [30]. Dong et al. primarily analyzed the environmental impact of changes in energy structure under present scenarios, in the years of 2010 and 2015 and further scenarios in the years of 2020–2050, on copper production in China [31].
In addition to the time factor, there are also many factors affecting energy consumption and pollution emissions of copper production processes, such as process route, ore grade, mine age, etc. [32]. However, few studies have been conducted on the past trend of energy consumption and GHG emissions in copper production processes and the influence of main key factors on the LCA performance. This study aims to evaluate the national average GHG emissions and primary energy demand of copper production in terms of 1 t product from different routes, in the years between 2004 to 2017 in China, and analyze the effect of electricity source, auxiliary material consumption, and copper ore grade on the two LCA indicators.

2. Methodology

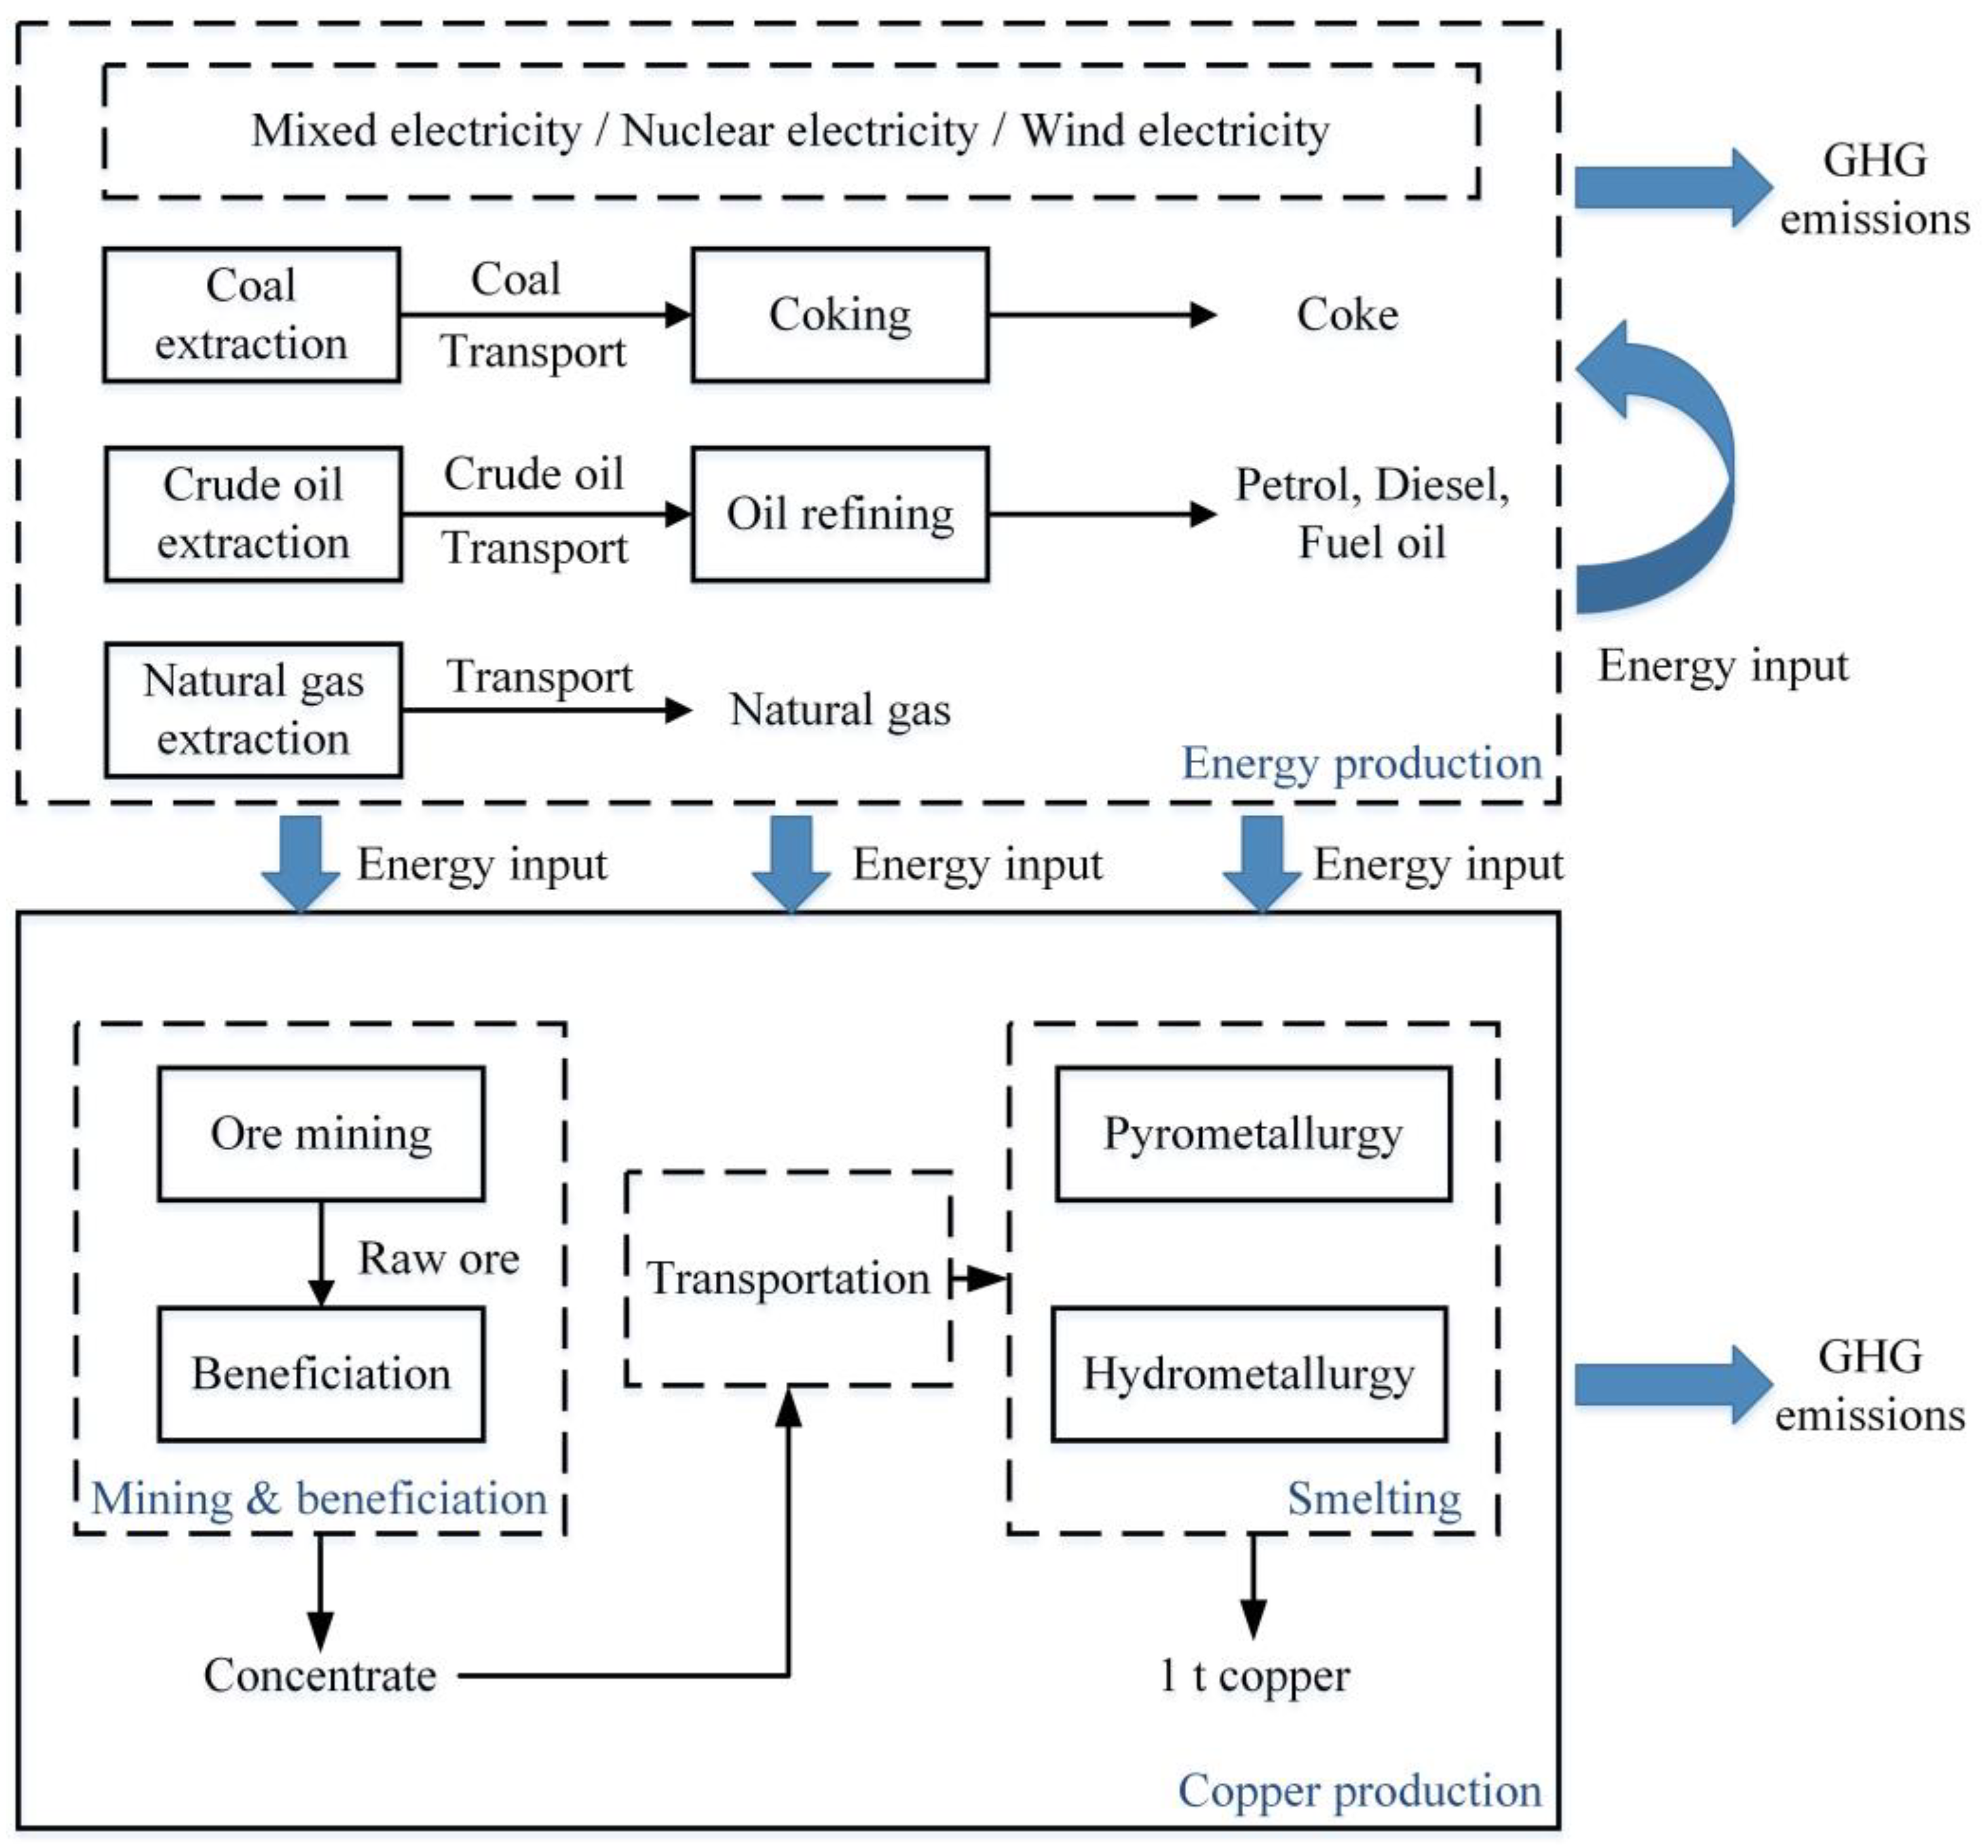
2.1. System Boundary and Functional Unit

The time-series LCA method is an analytical method based on the LCA guidelines that evaluates the environmental impact of a product in the stages of raw material acquisition, production, use, and abandonment with time as a variable [30]. The main goal of this paper is to estimate the changing trend of environmental impact, from cradle to gate, for copper production using the time-series LCA method in China and over time, from 2004–2017. The system boundary of the copper production is shown in Figure 1, which includes two parts of energy production and copper production. The copper production includes mining and beneficiation, transportation, and smelting. Copper mining mainly includes underground and strip mining, while copper smelting mainly includes pyrometallurgical and hydrometallurgical technologies [33]. The three stages of copper production require energy input, while the energy production process also requires energy input and emits GHG. The energy consumption of the above stages in this article used the average value in China. Energy production consists of the extraction and processing of primary energy and the production of secondary energy. Energy used in copper production includes coal, coke, natural gas, petrol, diesel, fuel oil, and electricity. In the trend study, we did not consider auxiliary materials consumption when defining the system boundary of copper production due to the lack of annual auxiliary materials consumption. The influence of auxiliary materials is analyzed in the results and discussion section of this paper. In order to compare the environmental indicators of different years, the functional unit is defined as 1 t refined copper.

2.2. Energy Consumption Calculation

The collection and integration of data during LCA greatly affects the life cycle results. The transport distance of the copper concentrate to the smelter adopts the average value of metal ore transportation of each year in China through the transportation tool of railway, while we ignore the distance of the mine to the concentrator as they are generally close. In this study, GWP is used to evaluate its GHG emissions and abiotic depletion potential (ADP) fossil is used to assess its primary energy consumption.
The raw ore consumption in j (2004–2017) year (ROCj) for producing 1 t refined copper is calculated by Equation (1), while those of the underground and strip mining for producing 1 t copper are calculated by Equations (2) and (3), respectively. The copper concentrate consumption of the smelting in j year (CCCb,j) for producing 1 t copper is calculated by Equation (4). The comprehensive energy consumption in j year (CECj) of producing 1 t refined copper with the unit of kg ce including the CEC of mining and beneficiation (CECmb,j) and smelting (CECsm,j) processes is calculated by Equation (5), in which the CECmb,j can be calculated by Equation (6). In the latter two equations, those with the subscripts of u, s, b, sm represent the CEC of 1 t copper raw ore in the underground and strip mining, 1 t copper concentrate in the beneficiation, and 1 t copper in the smelting. The CEC and actual recovery rate of the copper production between 2004 and 2017 are obtained from the China Nonferrous Metals Industry Yearbook [34], as shown in Table 1.
R O C j = 1 / ( α j · β j · ε j )
R O C u , j = R O C j · φ j
R O C s , j = R O C j · ( 1 φ j )
C C C b , j = 1 / ( β j · γ j )
C E C j = C E C m b ,   j + C E C s m , j
C E C m b , j = C E C u ,   j · R O C u ,     j + C E C s , j · R O C s , j + C E C b , j · C C C b , j
where αj, βj, Ɛj, φj, and γj represent the recovery rate of beneficiation, recovery rate of smelting, copper raw ore grade, ratio of underground mining, and copper concentrate grade, respectively.
Figure 2 shows the CEC of copper production between 2004 and 2017. The CEC of the copper production ranged between 1.98 and 0.59 t ce/t copper, which showed a downward trend as a whole. The CEC of the smelting process during 2004–2010 (with the exception of 2006) is greater than that of the mining and beneficiation process, but the CEC of the mining and beneficiation process between 2011 and 2017 (with the exception of 2013) is larger with the development of smelting technology. In general, the contributions of mining and beneficiation and smelting processes to the CEC are in the range of 42.19–54.48% and 45.52–57.81%, respectively.
In order to calculate the ADP, we estimate the consumption of coal, coke, petrol, diesel, fuel oil, natural gas, and electricity according to their distribution ratios in the total energy consumption of the mining and beneficiation (TECmb) and smelting (TECsm). Their distribution ratios are defined as DRmb and DRsm, as calculated in Equations (7)–(8). The consumption of the seven kinds of energy in the mining and beneficiation (ECmb) and smelting (ECsm) can be calculated by Equations (9) and (10). It is worth noting that the copper industry only provides TEC data between 2010 and 2017 [34]. Therefore, we estimate the energy distribution ratio between 2004 and 2009, using the average value of 2010 to 2017. The ADP fossil of copper production can be obtained by substituting the seven types of energy consumption in the two stages, the mass of copper concentrate, and transportation distance (TD) into Equation (11).
D R m b , i , j = T E C m b ,   i , j · C C i i = 1 7 ( T E C m b , i , j · C C i )
D R s m , i , j = T E C s m ,   i , j · C C i i = 1 7 ( T E C s m , i , j · C C i )
E C m b ,     i , j = C E C m b , j   · D R m b , i , j C C i
E C s m ,     i , j = C E C s m , j · D R s m , i , j C C i
A D P j = i = 1 7 E C m b , i , j · A D P F i + i = 1 7 E C s m , i , j · A D P F i + C C C b , j · T D j · A D P F r t
where i, mb, and sm represents the seven kinds of energy, mining and beneficiation, and smelting; CCi represents the conversion coefficient of i energy into standard coal obtained from the China Energy Statistics Yearbook [35]; ADPFi represents the ADP factor of i energy; ADPFrt represents the ADP factor of railway transportation obtained from eBalance; the ADPFi are mainly derived from GaBi (except for coke) and the ADPF of the coke is obtained from Ref. [36].

2.3. GHG Emissions Calculation

Various emissions from the use of fossil energy are the main source of environmental pollution in the studied process. The GHG emissions of energy consumption in the copper production process include two parts of fuel production and combustion, which are related to the indirect and direct emissions [37]. The GWP is mainly calculated by the sum of the products of emissions quality (EQ) of CO2, CH4, and N2O emissions and their weights according to Ref. [38], as shown in Equation (12).
As for the GWP of 1 t copper, in this paper, it is calculated from the GHG emissions of mining and beneficiation, smelting, and transportation, as shown in Equation (13). The GWP of the first two stages are obtained by the product of seven kinds of energy consumption and corresponding GWP factor (GWPFi), while that of the transportation stage is obtained by the product of transportation distance, quality of transported concentrate, and GWPF of railway transportation (GWPFrt) obtained from eBalance. The GWPF of coal, natural gas, fuel oil, and electricity are obtained from GaBi, petrol, and diesel from GaBi and IPCC, and coke from Ref. [36] and IPCC.
G W P = E Q C O 2 + 25 · E Q C H 4 + 298 · E Q N 2 O
G W P j = i = 1 7 ( E C m b , i , j · G W P F i , j ) + i = 1 7 ( E C s m , i , j · G W P F i , j ) + C C C b , j × T D j · G W P F r t

3. Results and Discussion

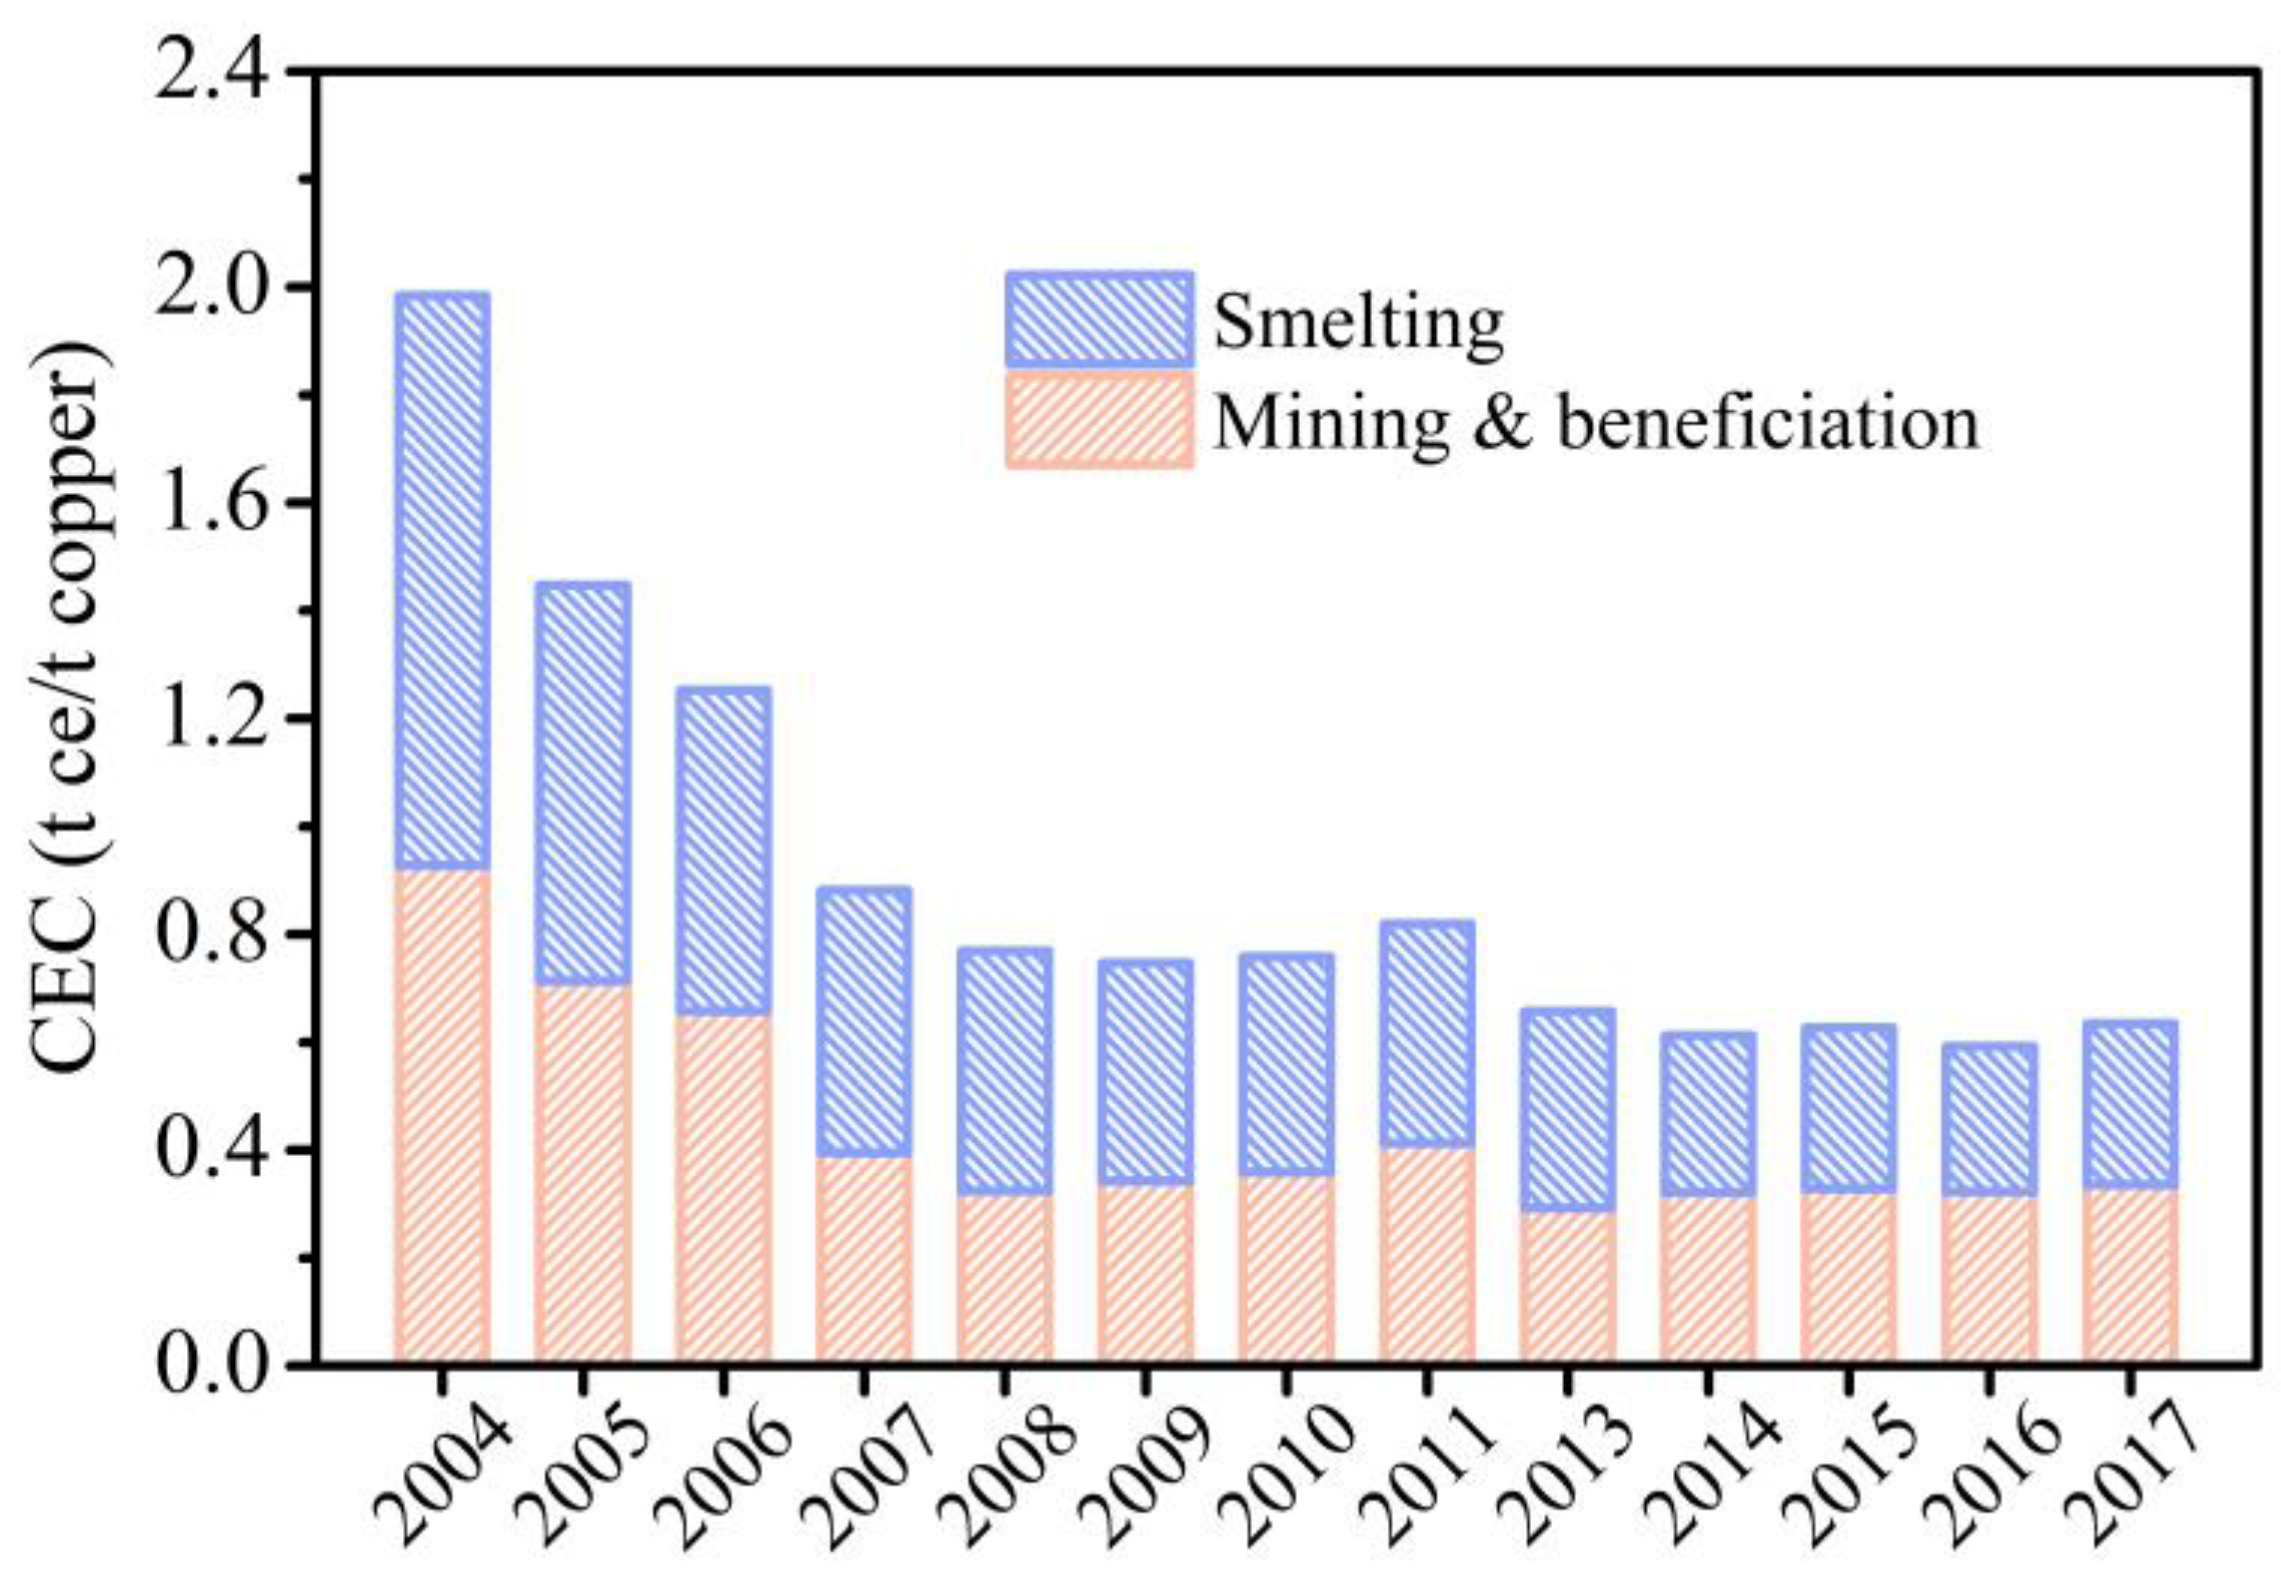
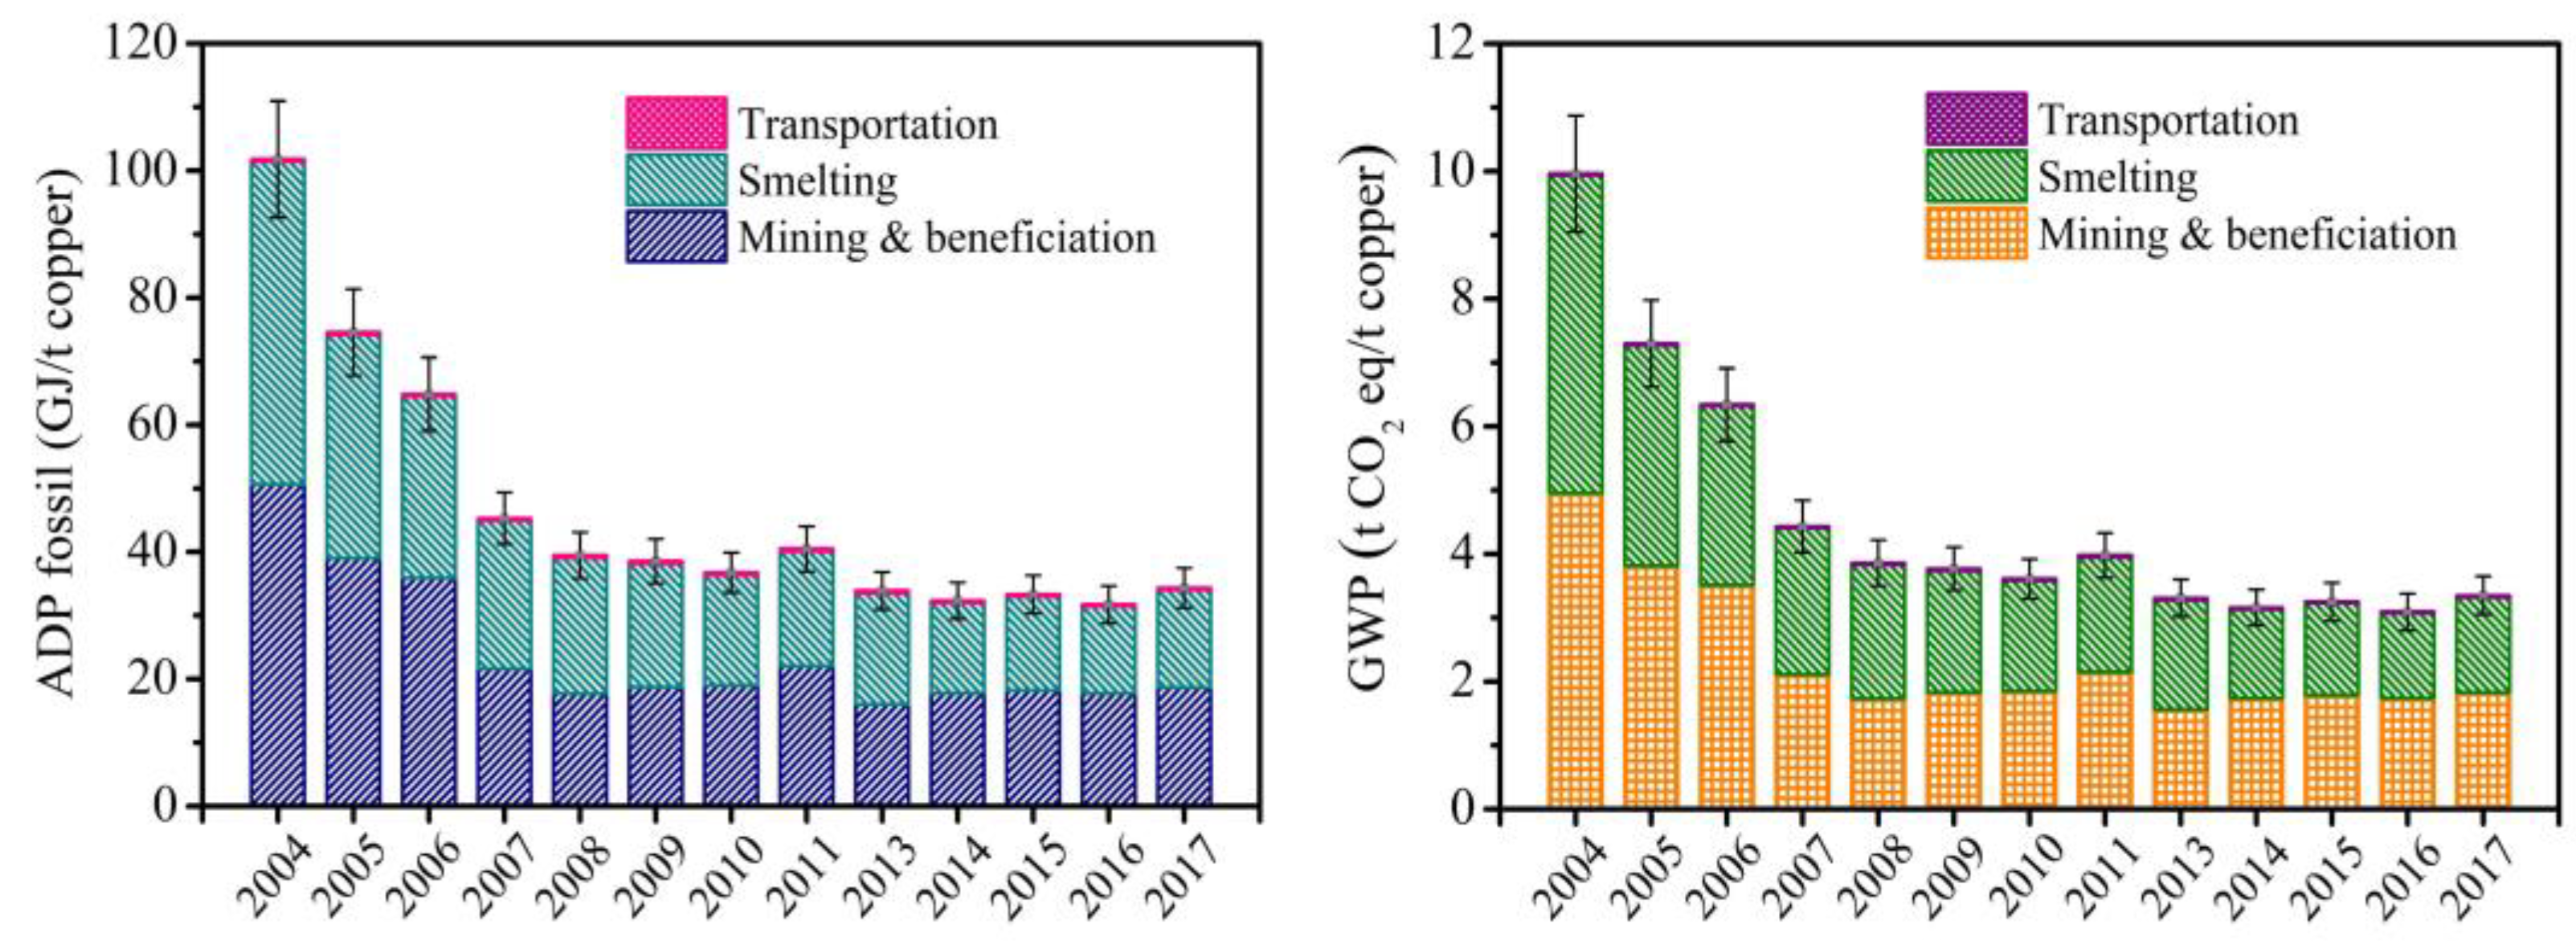
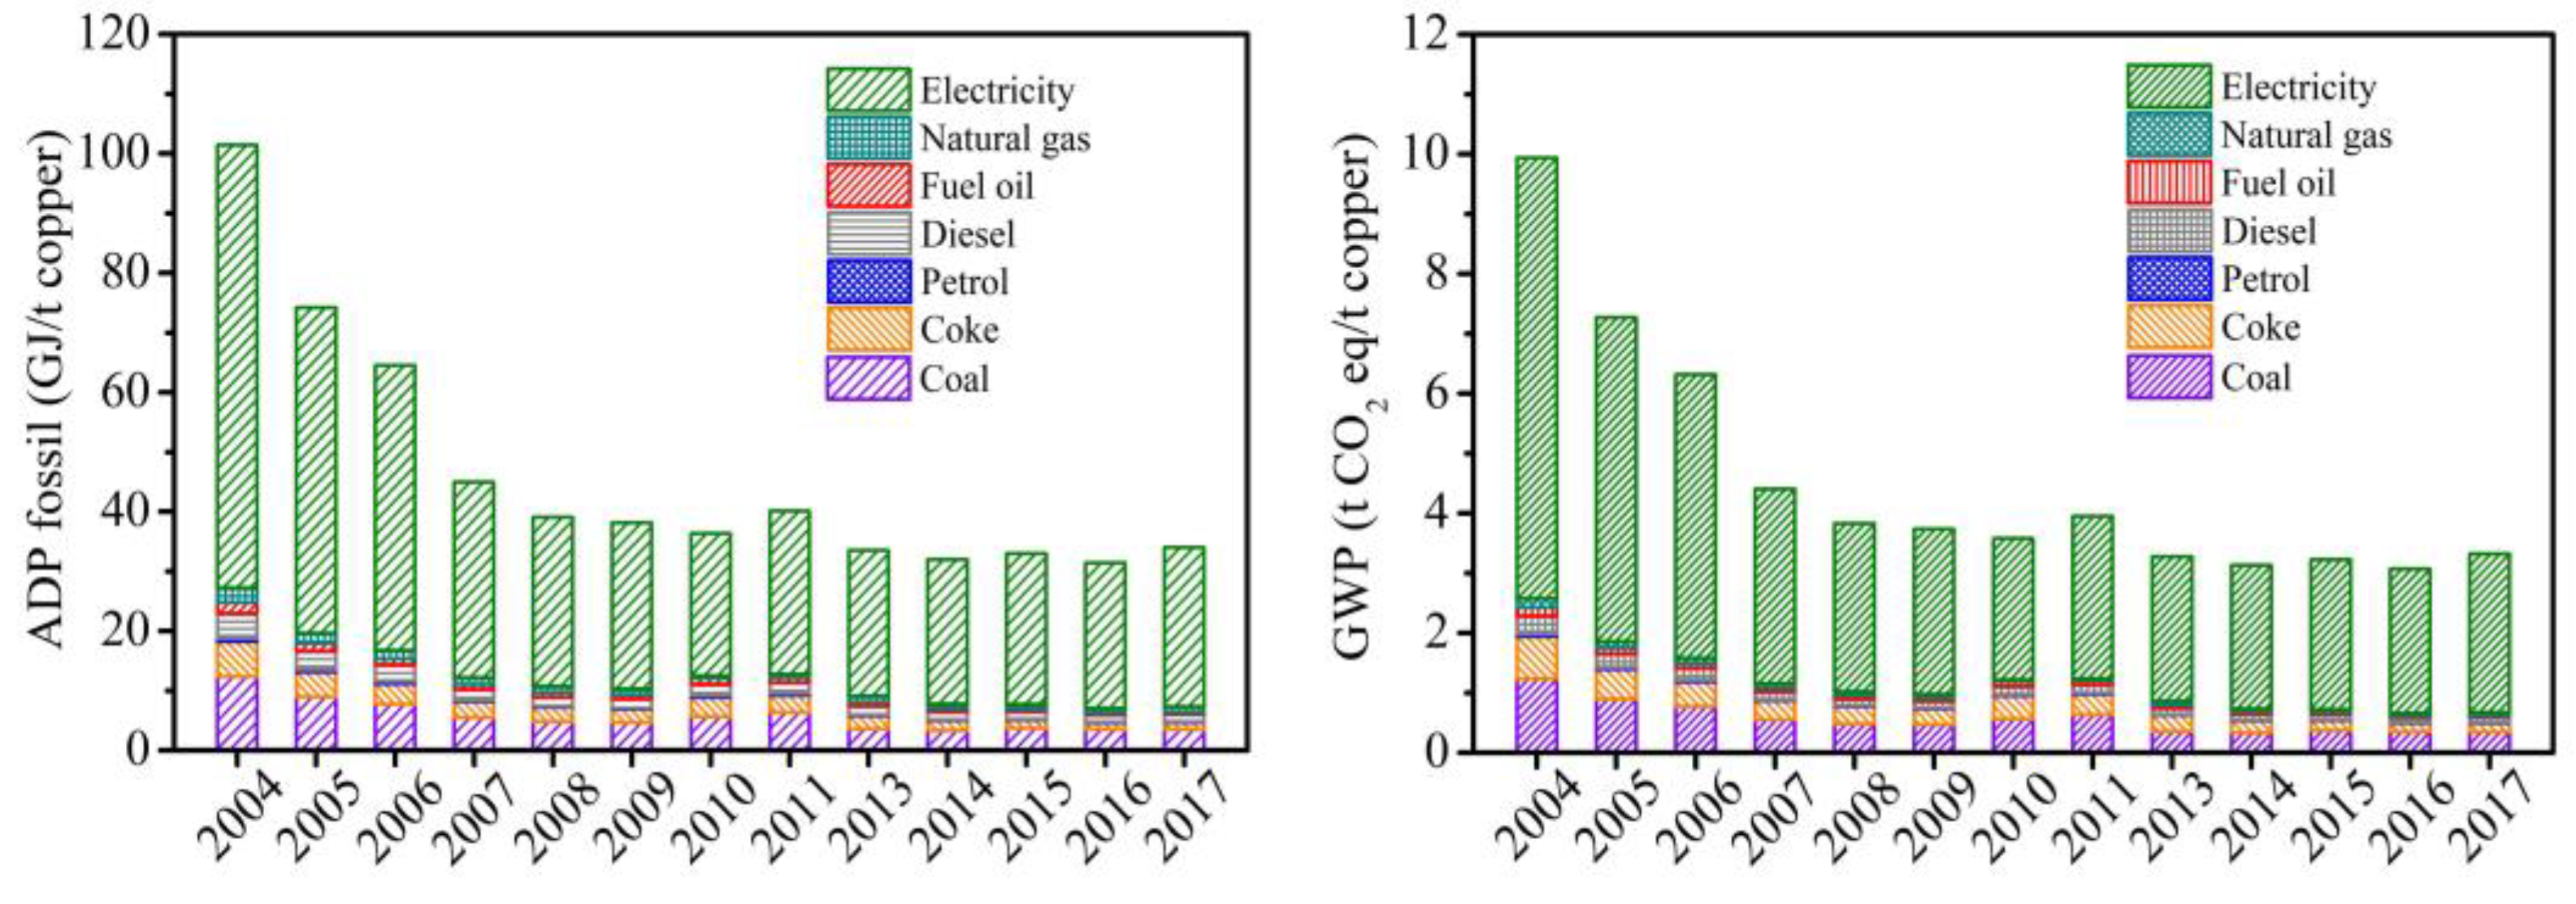
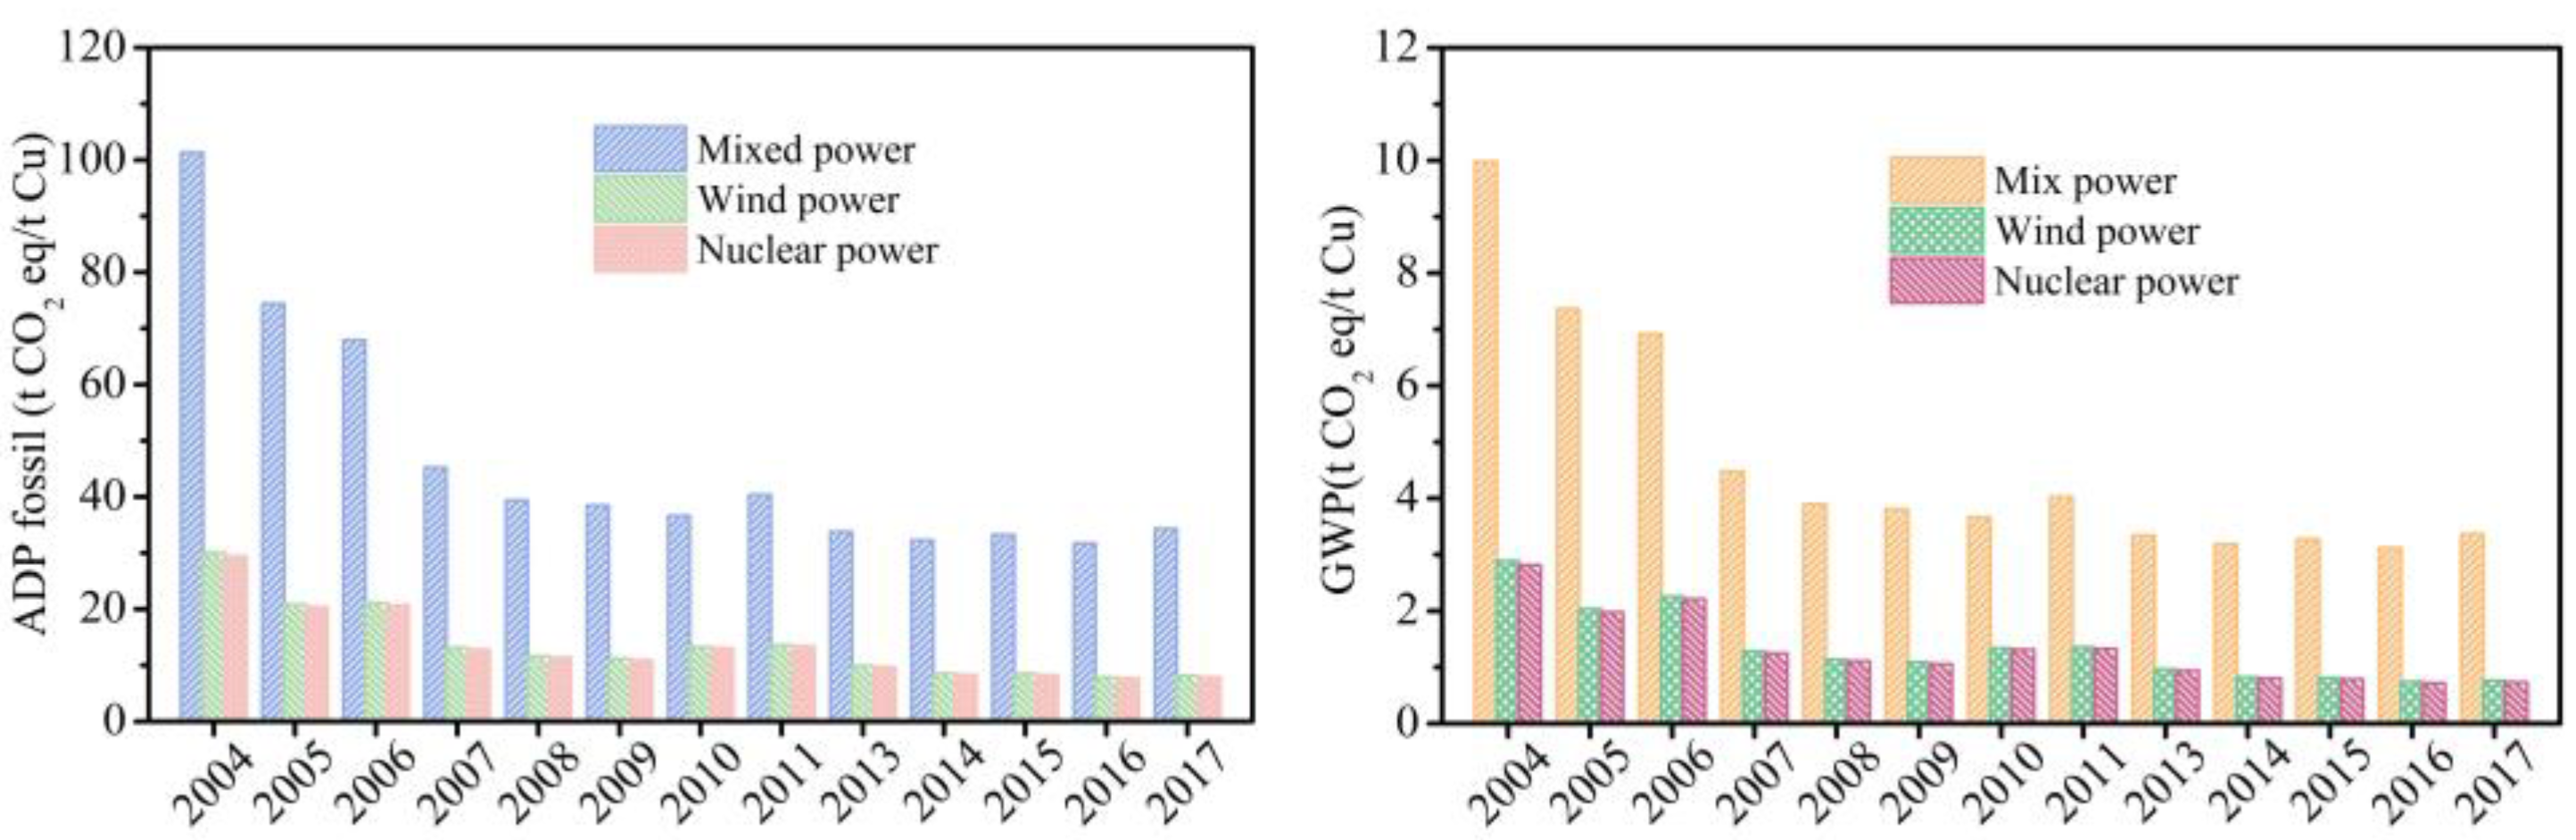
3.1. Life Cycle Inventory Results

Figure 3 presents the GWP and ADP fossil trend of the copper production process in China during the period of 2004–2017. The two indicators show a downward trend, as a whole, and declined rapidly between 2004 and 2007 due to the energy efficiency of the smelting process being improved considerably between 1995 and 2007 [31]. The two indicators are relatively stable and have minor fluctuations between 2013 and 2017. The main reason for the slightly higher LCA results in 2011 is that the energy consumption of underground mining and smelting increased from 2.77 kg ce/t raw ore and 398.81 kg ce/t copper in 2010 to 3.20 kg ce/t raw ore and 407.04 kg ce/t copper in 2011, respectively. The energy consumption of underground mining depends on the characteristics of the mine, the mining depth, and the mining technology [39]. The ore grades obtained from underground mining are 0.78% in 2010 and 0.76% in 2011, and the actual recovery rate of mineral processing in 2011 is less than that in 2010, which means that the raw ore needed for copper production in 2011 is 9.14 t more than that in 2010.
Between 2004 and 2017, the ADP fossil ranged between 101.78 and 31.72 GJ/t copper and the GWP varied between 9.96 and 3.09 t CO2 eq/t copper. The contribution of the mining and beneficiation process to the ADP fossil and GWP exhibits an increasing trend in general, which individually varied between 44.87% and 55.89%, and 44.91% and 56.17%. Whereas the contribution of the smelting process to the ADP fossil and GWP generally exhibit decreasing trends, which range between 54.13% and 43.12%, and 54.29% and 43.02%. In addition, the contributions of the transportation stage to the ADP fossil and GWP are less than 1.14%. The development of mining and smelting technology is critical for reducing the environmental impact of the copper production process.
The data of seven kinds of energy consumption were obtained from the statistical yearbook. We evaluated the quality of the data based on the Data Quality Indicator method to identify the range of values for seven different types of energy consumption, and randomly calculated 10,000 groups of data using Monte-Carlo simulation to analyze the uncertainty of the LCA results of copper production [40,41]. The results show that the range of the ADP fossil and GWP in 2004–2017 is approximately 0.91–1.09 times the real value. The analysis below is based on the actual data from the yearbook as it is close to the average value of the 10,000 simulation results.
The contributions of different energy consumption to the ADP fossil and GWP between 2004 and 2017 can be derived from Figure 4. The LCA results of the copper production in these years are most influenced by electricity consumption, followed by coal and coke. The contributions of electricity to the ADP fossil and GWP ranged between 74.21 and 23.83 GJ/t copper and 7.36 to 2.36 t CO2 eq/t copper, while those of coal are in the range of 3.32–12.35 GJ/t copper and 0.33–1.24 t CO2 eq/t copper, and those of coke are within the 1.15–5.87 GJ/t copper and 0.14–0.71 t CO2 eq/t copper. The influence of the other four energy sources, which include gasoline, diesel, fuel oil, and natural gas, on LCA results is less than 10.02%. In addition, their contributions to the ADP fossil and GWP are 2.44–8.99 GJ/t copper and 0.17–0.63 t CO2 eq/t copper.
The life cycle energy consumption and GHG emissions of copper production in China from other studies are used for comparison with this work. As can be seen from Table 2, the life cycle results obtained by the same research objects also have certain differences. The ADP fossil and GWP of our study are in the range of 45.30–101.78 GJ/t copper and 4.43–9.96 t CO2 eq/t copper between 2004 and 2007 due to the limited mining and smelting technology at that time. The ADP fossil ranged between 39.45 and 31.72 GJ/t copper and GWP ranged between 3.86 and 3.09 t CO2 eq/t between 2008 and 2017, which are within the data range of references listed in Table 2. The reasons for these differences in environmental indicators may be methodological choice, software choice, or data uncertainty.
Coal-fired power accounts for 73.23% of the total power generation in China [44], which produces a lot of GHG emissions. In addition, the copper industry consumes a large amount of electricity. Therefore, electricity consumption is the main source of GHG emissions in copper production. With the optimization of the electricity supply structure, the proportion of non-fossil energy electricity generation has increased year by year [45]. The impact of using wind or nuclear electricity, instead of the current mixed electricity, on the energy consumption and GHG emissions throughout the life cycle of the copper production depend on the proportion of electricity in the total energy consumption, as shown in Figure 5. If the mixed electricity is entirely replaced by wind electricity between 2004 and 2017, the ADP fossil and GWP can be reduced by 63.67–76.27% and 64.42–77.84%. When mixed electricity is completely replaced by nuclear electricity, the ADP fossil and GWP can be reduced by 64.23–76.94% and 65.08–78.63%. The reduction proportions of energy consumption and GHG emissions by using nuclear electricity are slightly higher than that of using wind electricity.

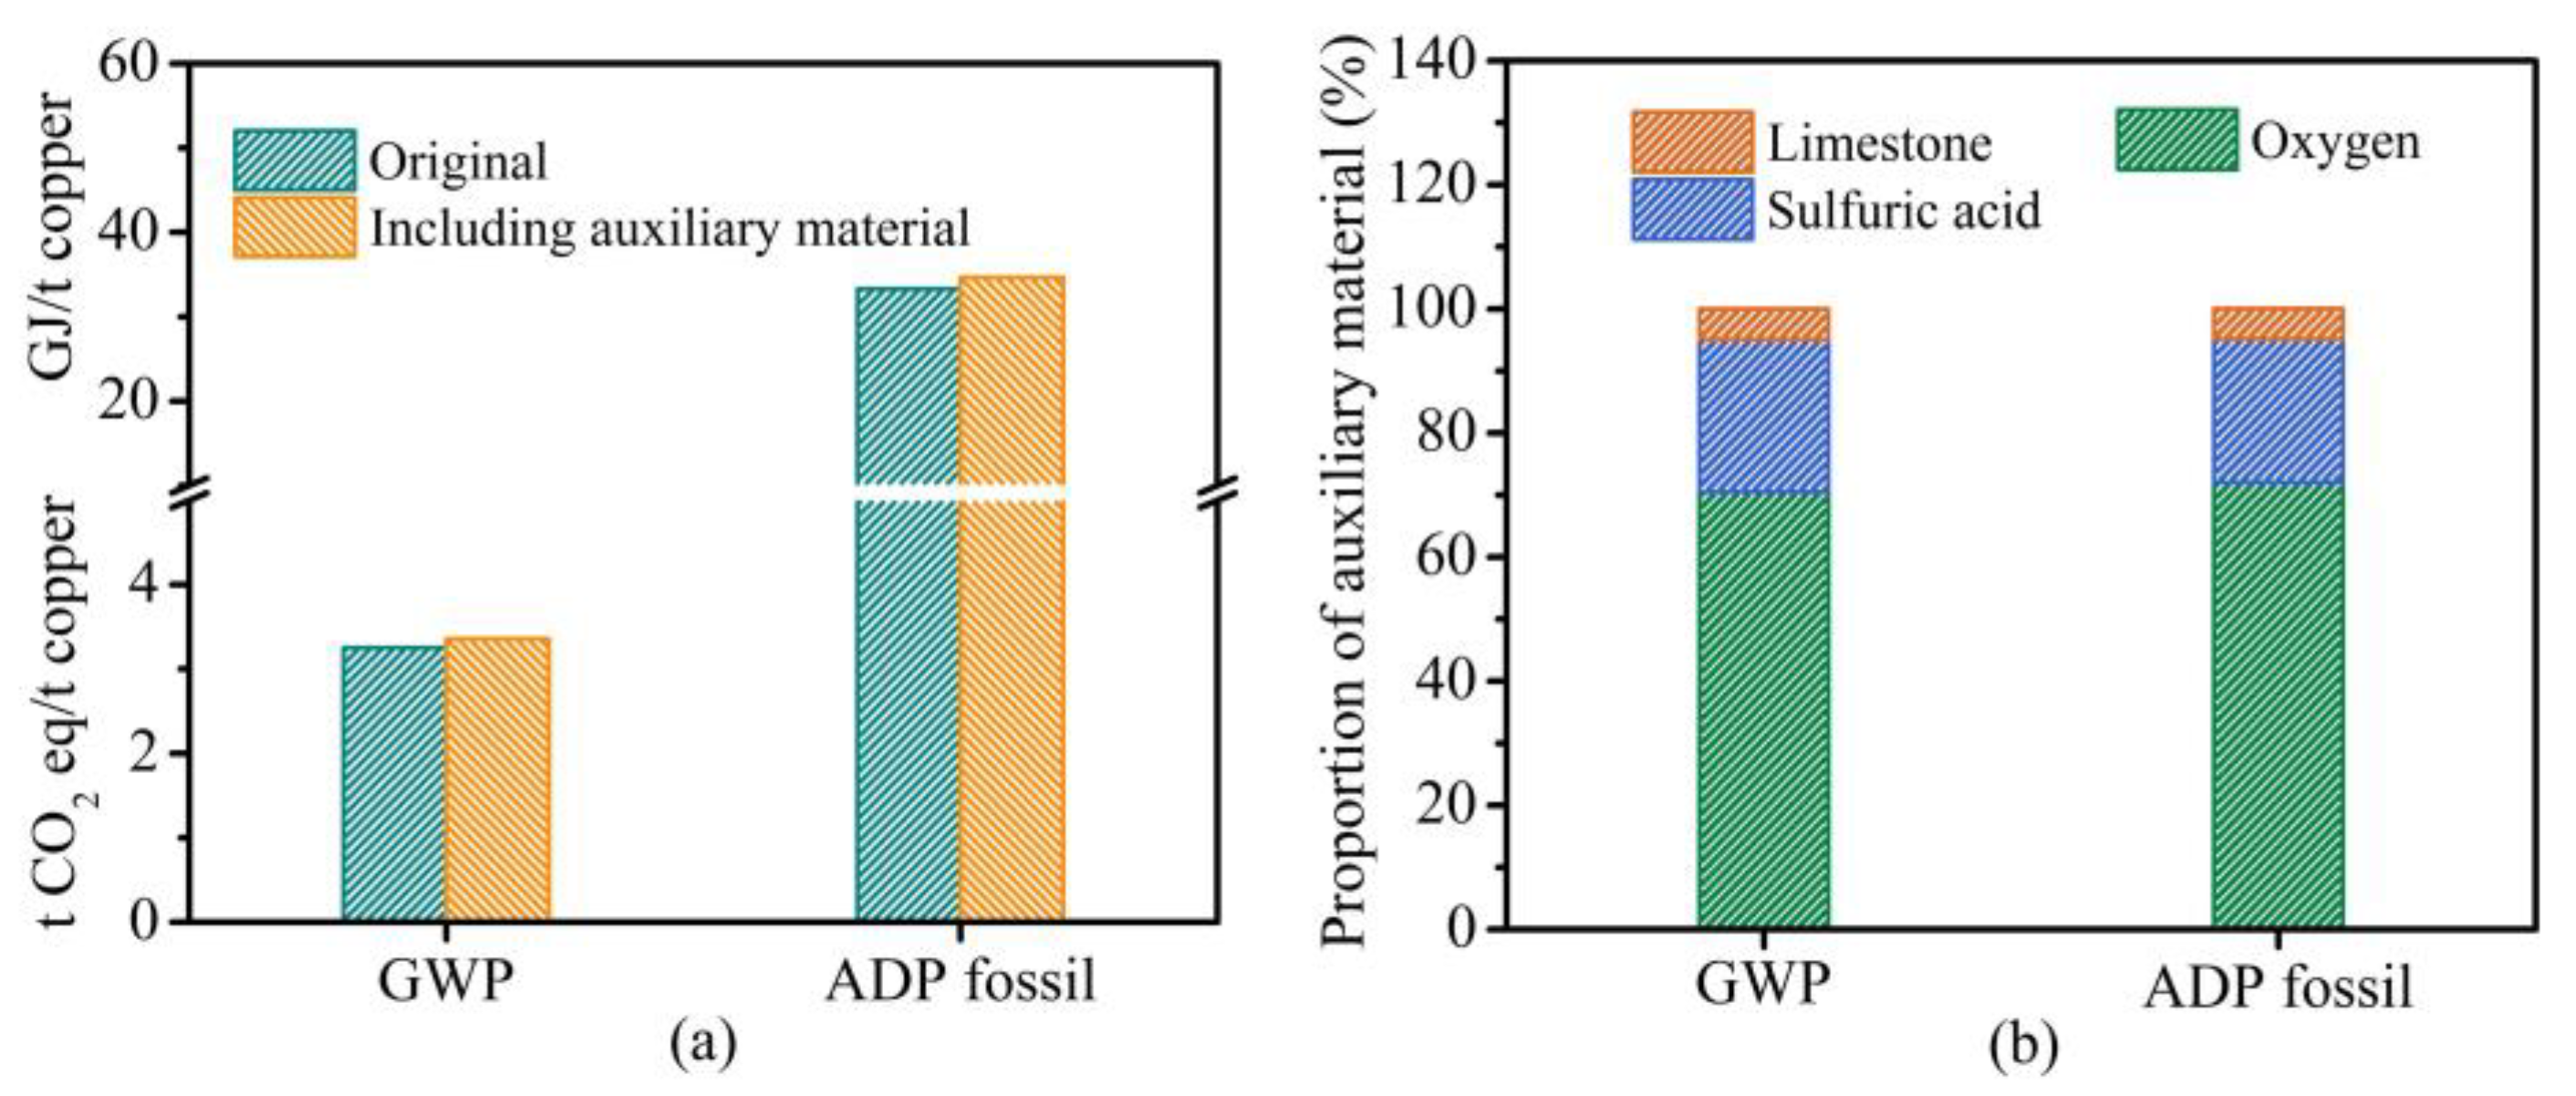
3.2. Influence of Auxiliary Material Consumption

This section considers the environmental impact caused by auxiliary materials consumption in the copper production. Detonators, explosive, and beneficiation reagents are negligible, according to Ref. [25], but limestone, sulfuric acid, and oxygen are considered due to their high consumption. We calculate the average value of the auxiliary materials required for the production of refined copper by multiplying the proportion of pyrometallurgy and hydrometallurgy by their respective consumption of the auxiliary materials [46]. The energy consumption and GHG emissions during the production of auxiliary materials come from eBalance. As shown in Figure 6a, the ADP fossil increased from 33.29 to 34.63 GJ/t copper and GWP increased from 3.25 to 3.35 t CO2 eq/t copper in 2015 considering the consumption of auxiliary materials. As shown in Figure 6b, the impact of auxiliary materials on the GWP of the copper production accounted for 3.07%, of which oxygen, sulfuric acid, and limestone accounted for 70.51%, 24.55%, and 4.94% of the impact of auxiliary materials. The contribution of auxiliary material consumption to ADP fossil is 3.89%. Among them, the contributions of oxygen, sulfuric acid, and limestone are 72.04%, 23.12%, and 4.85%, respectively.

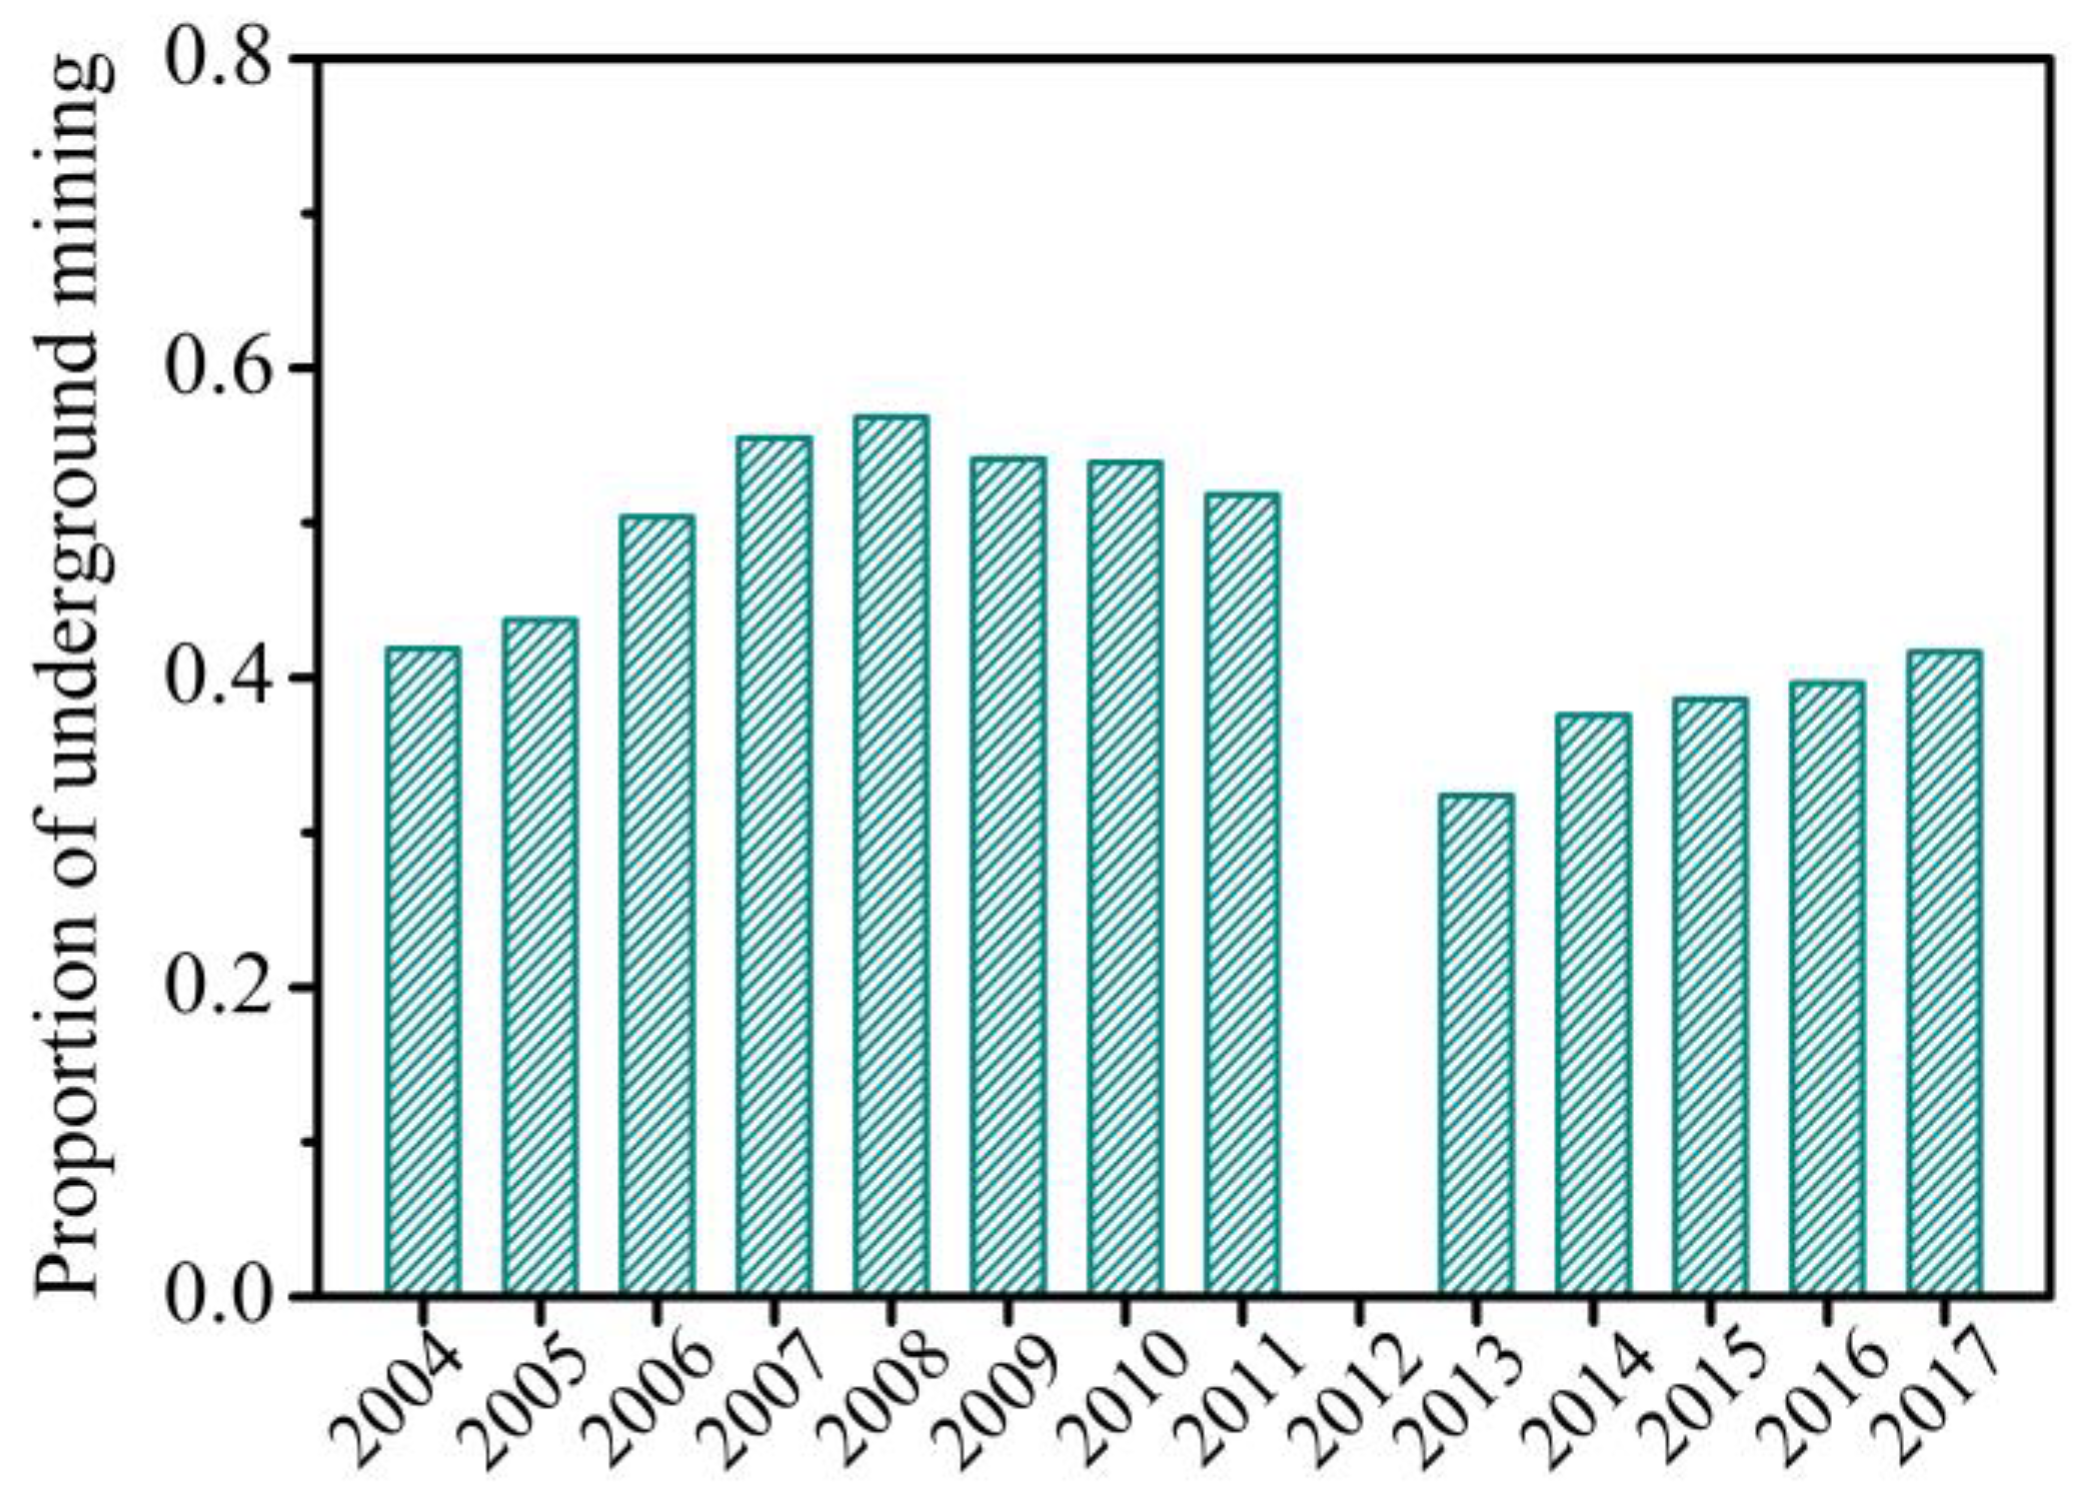
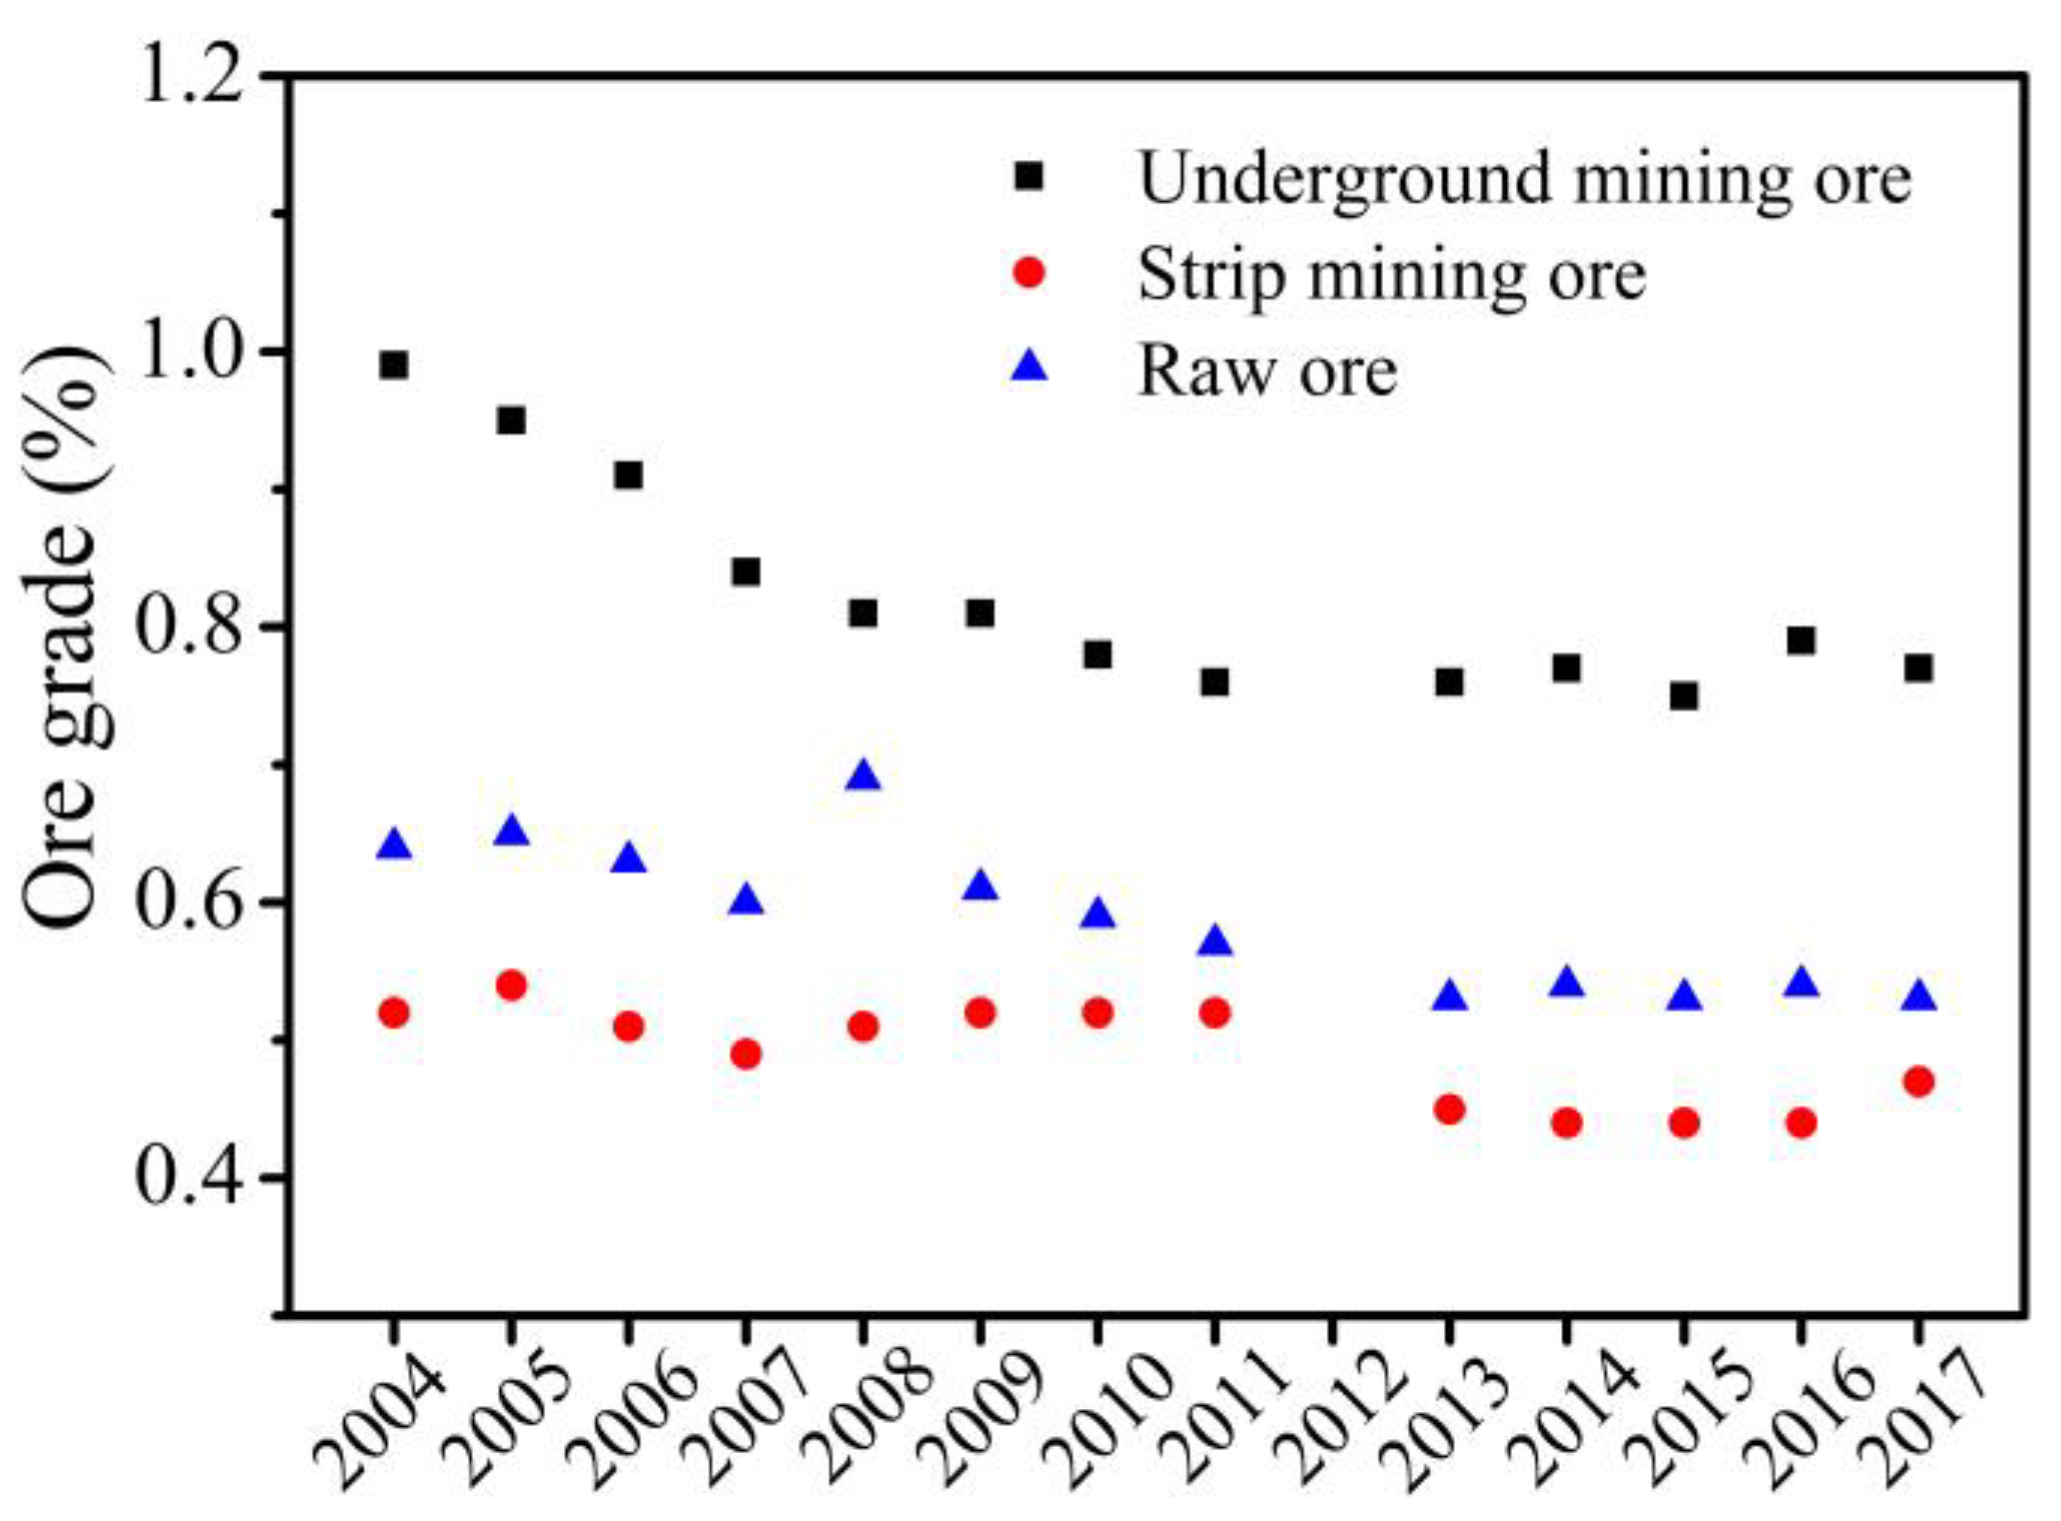
3.3. Influence of Copper Ore Grade

The ore grade is a vital factor that affects the environmental performance of copper production. Dong [31] et al. established a relationship model between ore grade and energy consumption, indicating that energy use increases when the ore grade decreases. With the increase in mining years, the resources of copper mines will decline. The demand for resources will be met by increasing the depth of mining and expanding the scope of mining. The copper ore proportion of underground mining, as shown in Figure 7, first increases and then decreases between 2004 and 2011, and shows a continuously rising trend after 2013. Figure 8 shows the change in copper ore grade in China between 2004 and 2017. Although the ore grade from underground mining shows a downward trend between 2004 and 2017 as a whole, the grade is still much higher than that from strip mining. However, underground mining requires more energy consumption.
In this section, we compare the environmental assessment of the copper mining in two scenarios, including strip mining and underground mining, in comparison with the average results of China. As shown in Figure 9, the environmental indicators of the ore obtained from strip mining are lower than the national average, while those from underground mining are higher than the national average. The ADP fossil and GWP between 2004 and 2007 showed a downward trend, while those between 2007 and 2017 fluctuated up and down due to the change in ore grade. The ADP fossil of the above two scenarios is within the range of 5.01–9.53 GJ/t copper and 21.57–67.01 GJ/t copper, and their GWP ranged between 0.49 and 0.93 t CO2 eq/t copper and 2.11–6.56 t CO2 eq/t copper. The two environmental indicators of underground mining are 1.14–1.64 times the national average and 2.97–7.03 times the strip mining. Although underground mining brings advantages in ore grade, it will also cause more energy consumption. The ore obtained from underground mining to produce 1 t copper requires 0.40–1.23 t ce of comprehensive energy, while the CEC of strip mining is only 0.09–0.17 t ce/t copper in the mining process. The raw ore required to produce 1 t copper in strip mining is approximately 1.46–1.90 times that of underground mining, which means strip mining will produce more waste rock. However, underground mining requires more primary energy than strip mining and will generate more GHG emissions.

4. Conclusions

This article has used a time-series LCA to analyze the trends of primary energy demand and GHG emissions of copper production. The comprehensive energy consumption of copper production showed a decreasing trend between the years 2004 and 2017 as a whole, with the exception of 2011. The ADP fossil varied between 101.78 and 31.72 GJ/t, whilst the copper GWP ranged between 9.96 and 3.09 t CO2 eq/t copper. The reason for the above trend is that developments in mining and smelting technologies have improved the energy efficiency of the copper production process.
Meanwhile, the impact of auxiliary materials consumption, mining methods, and electricity generation methods on LCA results are also investigated. When mixed electricity is completely replaced by nuclear or wind electricity, the life cycle energy consumption can reduce by 63.67–76.27% or 64.23–76.94%, and GHG emissions by 64.42–77.84% or 65.08–78.63% as electricity consumption is identified as the most critical factor contributing to GWP. The influence of auxiliary materials on the environmental indicators is less than 3.88%. The ADP fossil and GWP of copper production, when the raw ore all comes from underground mining, are 2.97–7.03 times that of strip mining. A change of electricity source has the most significant impact on GHG emissions of the copper production process. In order to mitigate the greenhouse effect, the optimization of power energy structure should be given priority in the future.
It must be pointed out that the influence of each factor on the copper production process in this paper is based on a specific scenario. However, in the actual situation, it will be affected by various factors, such as ore resource consumption and changes to the energy structure. Further research into the influences of copper import and export, energy structure change, and copper waste recovery of the copper production process on the environment is advised. Predicting the future environmental indicators of the copper industry based on original data and its impact on carbon neutrality are crucial for formulating the development policy for the copper industry in the future.

Author Contributions

Conceptualization, D.X.; methodology, H.C.; software, L.L.; investigation, H.C. and P.L.; data curation, L.L.; writing—original draft, L.L.; writing—review and editing, D.X.; visualization, L.L.; supervision, D.X.; funding acquisition, D.X. All authors have read and agreed to the published version of the manuscript.

Funding

This research was funded by the National Natural Science Foundation of China (Grant No: 22078001, 21706001) and the Anhui Provincial Natural Science Foundation (Grant No: 1808085QB46).

Institutional Review Board Statement

Not applicable.

Informed Consent Statement

Not applicable.

Data Availability Statement

Not applicable.

Conflicts of Interest

The authors declare no conflict of interest.

References

  1. Soulier, M.; Glöser-Chahoud, S.; Goldmann, D.; Espinoza, L.A.T. Dynamic analysis of European copper flows. Resour. Conserv. Recycl. 2018, 129, 143–150. [Google Scholar] [CrossRef]
  2. Kuipers, K.J.J.; van Oers, L.F.C.M.; Verboon, M.; der Voet, E. Assessing environmental implications associated with global copper demand and supply scenarios from 2010 to 2050. Glob. Environ. Chang. 2018, 49, 106–115. [Google Scholar] [CrossRef]
  3. Deetman, S.; Pauliuk, S.; van Vuuren, D.P.; van der Voet, E.; Tukker, A. Scenarios for Demand Growth of Metals in Electricity Generation Technologies, Cars, and Electronic Appliances. Environ. Sci. Technol. 2015, 52, 4950–4959. [Google Scholar] [CrossRef] [Green Version]
  4. Ciacci, L.; Fishman, T.; Elshkaki, A.; Graedel, T.E.; Vassura, I.; Passarini, F. Exploring future copper demand, recycling and associated greenhouse gas emissions in the EU-28. Glob. Environ. Chang. 2020, 63, 102093. [Google Scholar] [CrossRef]
  5. Elshkaki, A.; Graedel, T.E.; Ciacci, L.; Reck, B.K. Copper demand, supply, and associated energy use to 2050. Glob. Environ. Chang. 2016, 39, 305–315. [Google Scholar] [CrossRef] [Green Version]
  6. Röben, F.T.C.; Liu, D.; Reuter, M.A.; Dahmen, M.; Bardow, A. The demand response potential in copper production. J. Clean. Prod. 2022, 362, 132221. [Google Scholar] [CrossRef]
  7. Li, M.J.; Mi, Z.F.; Coffman, D.; Wei, Y.M. Assessing the policy impacts on non-ferrous metals industry’s CO2 reduction: Evidence from China. J. Clean. Prod. 2018, 192, 252–261. [Google Scholar] [CrossRef] [Green Version]
  8. Yang, Z.; Yang, Z.; Yang, S.; Liu, Z.; Liu, Z.; Liu, Y.; Drewniak, L.; Jiang, C.; Li, Q.; Li, W.; et al. Life cycle assessment and cost analysis for copper hydrometallurgy industry in China. J. Environ. Manag. 2022, 309, 114689. [Google Scholar] [CrossRef] [PubMed]
  9. Finnveden, G.; Hauschild, M.Z.; Ekvall, T.; Guinée, J.; Heijungs, R.; Hellweg, S.; Koehler, A.; Pennington, D.; Suh, S. Recent developments in life cycle assessment. J. Environ. Manag. 2009, 91, 1–21. [Google Scholar] [CrossRef]
  10. Pryshlakivsky, J.; Searcy, C. Life Cycle Assessment as a decision-making tool: Practitioner and managerial considerations. J. Clean. Prod. 2021, 309, 127344. [Google Scholar] [CrossRef]
  11. Westfall, L.A.; Davourie, J.; Ali, M.; McGough, D. Cradle-to-gate life cycle assessment of global manganese alloy production. Int. J. Life Cycle Assess. 2016, 21, 1573–1579. [Google Scholar] [CrossRef] [Green Version]
  12. Qi, C.; Ye, L.; Ma, X.; Yang, D.; Hong, J. Life cycle assessment of the hydrometallurgical zinc production chain in China. J. Clean. Prod. 2017, 156, 451–458. [Google Scholar] [CrossRef]
  13. Van Genderen, E.; Wildnauer, M.; Santero, N.; Sidi, N. A global life cycle assessment for primary zinc production. Int. J. Life Cycle Assess. 2016, 21, 1580–1593. [Google Scholar] [CrossRef] [Green Version]
  14. Tongpool, R.; Jirajariyavech, A.; Yuvaniyama, C.; Mungcharoen, T. Analysis of steel production in Thailand: Environmental impacts and solutions. Energy 2010, 35, 4192–4200. [Google Scholar] [CrossRef]
  15. Olmez, G.M.; Dilek, F.B.; Karanfil, T.; Yetis, U. The environmental impacts of iron and steel industry: A life cycle assessment study. J. Clean. Prod. 2016, 130, 195–201. [Google Scholar] [CrossRef]
  16. Norgate, T.E.; Jahanshahi, S.; Rankin, W.J. Assessing the environmental impact of metal production processes. J. Clean. Prod. 2007, 15, 838–848. [Google Scholar] [CrossRef]
  17. Watari, T.; Northey, S.; Giurco, D.; Hata, S.; Yokoi, R.; Nansai, K.; Nakajima, K. Global copper cycles and greenhouse gas emissions in a 1.5 °C world. Resour. Conserv. Recycl. 2022, 179, 106118. [Google Scholar] [CrossRef]
  18. Sanjuan-Delmás, D.; Alvarenga, R.A.F.; Dewulf, J.; Lindblom, M.; Kampmann, T.C.; van Oers, L.; Guinée, J.B.; Dewulf, J. Environmental assessment of copper production in Europe: An LCA case study from Sweden conducted using two conventional software-database setups. Int. J. Life Cycle Assess. 2022, 27, 255–266. [Google Scholar] [CrossRef]
  19. Moreno-Leiva, S.; Díaz-Ferrán, G.; Haas, J.; Telsnig, T.; Díaz-Alvarado, F.A.; Palma-Behnke, R.; Kracht, W.; Román, R.; Chudinzow, D.; Eltrop, L. Towards solar power supply for copper production in Chile: Assessment of global warming potential using a life-cycle approach. J. Clean. Prod. 2017, 164, 242–249. [Google Scholar] [CrossRef]
  20. Adrianto, L.R.; Pfister, S.; Hellweg, S. Regionalized Life Cycle Inventories of Global Sulfidic Copper Tailings. Environ. Sci. Technol. 2022, 56, 4553–4564. [Google Scholar] [CrossRef] [PubMed]
  21. Reid, C.; Bécaert, V.; Aubertin, M.; Rosenbaum, R.K.; Deschênes, L. Life cycle assessment of mine tailings management in Canada. J. Clean. Prod. 2009, 17, 471–479. [Google Scholar] [CrossRef]
  22. Wang, H.; Liu, Y.; Gong, X.; Wang, Z.; Gao, F.; Nie, Z. Life Cycle Assessment of Metallic Copper Produced by the Pyrometallurgical Technology of China. Mater. Sci. Forum 2015, 814, 559–563. [Google Scholar] [CrossRef]
  23. Hong, J.; Chen, Y.; Liu, J.; Ma, X.; Qi, C.; Ye, L. Life cycle assessment of copper production: A case study in China. Int. J. Life Cycle Assess. 2018, 23, 1814–1824. [Google Scholar] [CrossRef]
  24. Chen, J.; Wang, Z.; Wu, Y.; Li, L.; Li, B.; Pan, D.; Zuo, T. Environmental benefits of secondary copper from primary copper based on life cycle assessment in China. Resour. Conserv. Recycl. 2019, 146, 35–44. [Google Scholar] [CrossRef]
  25. Song, X.; Yang, J.; Lu, B.; Li, B.; Zeng, G. Identification and assessment of environmental burdens of Chinese copper production from a life cycle perspective. Front. Environ. Sci. Eng. 2014, 8, 580–588. [Google Scholar] [CrossRef]
  26. Su, S.; Zhu, C.; Li, X.; Wang, Q. Dynamic global warming impact assessment integrating temporal variables: Application to a residential building in China. Environ. Impact Assess. Rev. 2021, 88, 106568. [Google Scholar] [CrossRef]
  27. Fnais, A.; Rezgui, Y.; Petri, I.; Beach, T.; Yeung, J.; Ghoroghi, A.; Kubicki, S. The application of life cycle assessment in buildings: Challenges, and directions for future research. Int. J. Life Cycle Assess. 2022, 27, 627–654. [Google Scholar] [CrossRef]
  28. Su, S.; Li, X.; Zhu, C.; Lu, Y.; Lee, H.W. Dynamic Life Cycle Assessment: A Review of Research for Temporal Variations in Life Cycle Assessment Studies. Environ. Eng. Sci. 2021, 38, 1013–1026. [Google Scholar] [CrossRef]
  29. Quinteiro, P.; Almeida, M.I.; Serra, J.; Arroja, L.; Dias, A.C. Life cycle assessment of ceramic roof tiles: A temporal perspective. J. Clean. Prod. 2022, 363, 132568. [Google Scholar] [CrossRef]
  30. Memary, R.; Giurco, D.; Mudd, G.; Mason, L. Life cycle assessment: A time-series analysis of copper. J. Clean. Prod. 2012, 33, 97–108. [Google Scholar] [CrossRef]
  31. Dong, D.; Oers, L.; Tukker, A.; Voet, E. Assessing the future environmental impacts of copper production in China: Implications of the energy transition. J. Clean. Prod. 2020, 274, 122825. [Google Scholar] [CrossRef]
  32. Moreno-Leiva, S.; Haas, J.; Junne, T.; Valencia, F.; Godin, H.; Kracht, W.; Nowak, W.; Eltrop, L. Renewable energy in copper production: A review on systems design and methodological approaches. J. Clean. Prod. 2020, 246, 118978. [Google Scholar] [CrossRef]
  33. Zhou, S.; Ge, Z. Technology advance and development trends of copper smelting in China. China Nonferrous Metall. 2014, 43, 8–12. [Google Scholar]
  34. China Nonferrous Metals Industry Yearbook Editorial Board. China Nonferrous Metals Industry Yearbook (2005–2018). Available online: https://data.cnki.net/yearbook/Single/N2021060077 (accessed on 12 September 2022).
  35. China Energy Statistics Yearbook; China Statistics Press: Beijing, China, 2021; Available online: https://data.cnki.net/yearbook/Single/N2022060061 (accessed on 12 September 2022).
  36. Li, J.; Zhang, S.; Nie, Y.; Ma, X.; Xu, L.; Wu, L. A holistic life cycle evaluation of coking production covering coke oven gas purification process based on the subdivision method. J. Clean. Prod. 2020, 248, 119183. [Google Scholar] [CrossRef]
  37. Burchart-Korol, D. Life cycle assessment of steel production in Poland: A case study. J. Clean. Prod. 2013, 54, 235–243. [Google Scholar] [CrossRef]
  38. Ding, N.; Liu, J.; Yang, J.; Yang, D. Comparative life cycle assessment of regional electricity supplies in China. Resour. Conserv. Recycl. 2017, 119, 47–59. [Google Scholar] [CrossRef]
  39. Wu, A.; Wang, Y.; Zhang, M.; Yang, G. New Development and Prospect of Key Technology in Underground Mining of Metal Mines. Met. Mine 2021, 1, 1–13. [Google Scholar]
  40. Navajas, A.; Mendiara, T.; Goñi, V.; Jiménez, A.; Gandía, L.M.; Abad, A.; García-Labiano, F.; de Diego, L.F. Life cycle assessment of natural gas fuelled power plants based on chemical looping combustion technology. Energy Convers. Manag. 2019, 198, 111856. [Google Scholar] [CrossRef]
  41. Mo, H.; Zhang, T. Data quality assessment of life cycle inventory analysis. Res. Environ. Sci. 2003, 05, 55–58. [Google Scholar]
  42. Rötzer, N.; Schmidt, M. Historical, current, and future energy demand from global copper production and its impact on climate change. Resources 2020, 9, 44. [Google Scholar] [CrossRef]
  43. Lu, T.; Tikana, L.; Herrmann, C.; Ma, Y.; Jia, J. Environmental hotspot analysis of primary copper production in China and its future improvement potentials. J. Clean. Prod. 2022, 370, 133458. [Google Scholar] [CrossRef]
  44. Xu, S.; Wang, Y.; Niu, J.; Ma, G. ‘Coal-to-electricity’ project is ongoing in north China. Energy 2020, 191, 116525. [Google Scholar]
  45. Wang, L.; Zhang, J.; Wang, X.; Chen, X.; Song, X.; Zhou, L.; Yan, G. Pathway of Carbon Emission Peak in China′s Electric Power Industry. Res. Environ. Sci. 2022, 35, 329–338. [Google Scholar]
  46. Beylot, A.; Villeneuve, J. Accounting for the environmental impacts of sulfidic tailings storage in the Life Cycle Assessment of copper production: A case study. J. Clean. Prod. 2017, 153, 139–145. [Google Scholar] [CrossRef]
Figure 1. Life cycle boundary of the copper production.
Processes 10 02715 g001
Figure 2. The CEC of copper production during 2004–2017.
Processes 10 02715 g002
Figure 3. The variation trends of the ADP fossil and GWP from 2004 to 2017.
Processes 10 02715 g003
Figure 4. Contribution of different energy consumption to the ADP fossil and GWP from 2004 to 2017.
Processes 10 02715 g004
Figure 5. The impact of different electricity sources on the ADP fossil and GWP from 2004 to 2017.
Processes 10 02715 g005
Figure 6. The influence of auxiliary material consumption on environmental indicators (a) and the contribution of limestone, oxygen, and sulfuric acid to the life cycle results of auxiliary material consumption (b).
Processes 10 02715 g006
Figure 7. Proportion of copper ore underground mining from 2004 to 2017.
Processes 10 02715 g007
Figure 8. Copper ore grade varying from 2004 to 2017.
Processes 10 02715 g008
Figure 9. Environmental indicators of the strip mining and underground mining.
Processes 10 02715 g009
Table 1. Energy consumption and recovery rate of copper production from 2004 to 2017 [34].
YearCECu,j (kg ce)CECs,j (kg ce)CECb,j (kg ce)CECsm,j (kg ce)αj (%)βj (%)
200410.310.7711.231056.2387.9496.48
20057.350.7410.62733.0787.5095.91
20066.110.575.37594.7587.5596.26
20073.090.483.60485.8087.5796.87
20082.770.474.03444.2786.8597.20
20092.710.453.92404.1386.9897.36
20102.770.413.53398.8185.5297.36
20113.200.413.67407.0484.7597.32
2012N/AN/AN/AN/AN/AN/A
20132.870.433.37364.4684.9998.05
20142.870.483.46290.5985.2398.14
20152.790.513.29297.6585.1998.34
20162.720.513.38269.4385.2198.22
20172.730.523.37299.0986.3998.39
Table 2. LCA results of copper production in different literatures.
Software/MethodEnergy Consumption
(GJ/t Copper)
GHG Emissions
(t CO2 eq/t Copper)
Research ObjectReference
GaBi6.00Pyrometallurgy[19] a
4.90Hydrometallurgy
33.003.30Pyrometallurgy[16] b
64.006.20Hydrometallurgy
CML2.50–8.50[30] b
69.004.50Global average in 2010[42] c
GaBi34.153.42Pyrometallurgy[24] d
7.333.16Secondary copper production
GaBi2.09Flash smelting[25] d
2.20Bath smelting
CMLCA85.805.88Pyrometallurgy in 2015[31] d
98.707.37Hydrometallurgy in 2015
GaBi36.904.28Pyrometallurgy[43] d
GaBi31.72–101.783.09–9.96Chinese average in 2004–2017Our research
The superscripts a, b, c, and d indicate that the LCA data of the copper production process was obtained from Chile, Australia, Globe, and China, respectively.
Publisher’s Note: MDPI stays neutral with regard to jurisdictional claims in published maps and institutional affiliations.

