

How to Choose the Suitable Steel of Wellhead, Wellbore, and Downhole Tools for Acid Gas Reinjection Flooding
Abstract
:1. Introduction
2. Material Selection Basis
2.1. Basic Data Analysis of Acid Gas Reinjection Well
2.2. Preliminary Selection of Materials
2.2.1. Material Selection Process for Wellhead Equipment of Gas Well
- (1)
- The data of composition and production of produced fluid, wellbore pressure and temperature are collected.
- (2)
- According to the gas content and wellbore pressure data of CO2 and H2S in the produced fluid, the gas partial pressure of CO2 and H2S is calculated.
- (3)
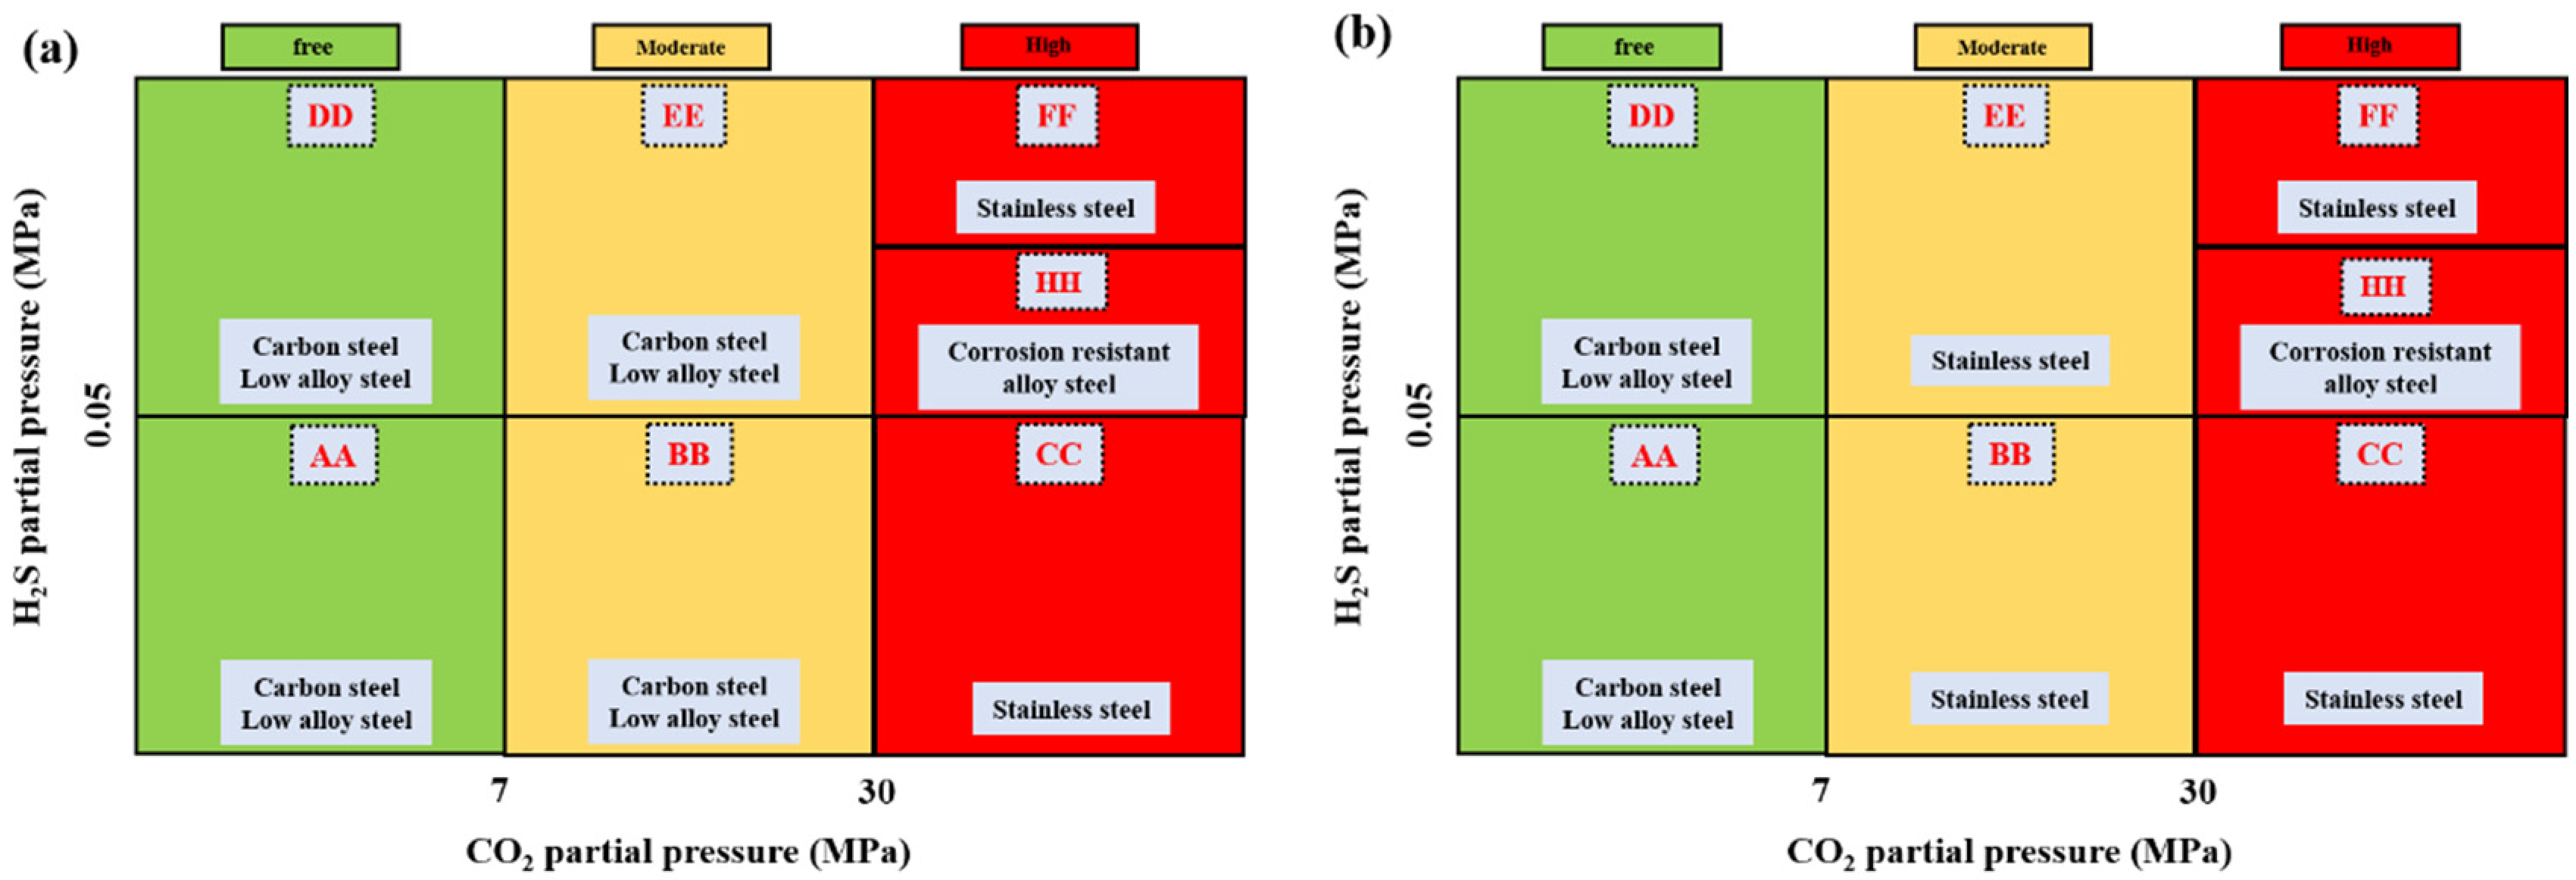
- Based on the CO2 and H2S partial pressure data, the application environment of wellhead equipment and a gas tree are classified to determine the corrosion degree of the application environment.
- (4)
- According to the classification of the application environment, the suitable material for wellhead equipment is selected to ensure that the wellhead equipment is safe and reliable.
2.2.2. Material Selection Process for Wellhead Equipment of Gas Well
2.2.3. Material Selection Process for Packer of Gas Well
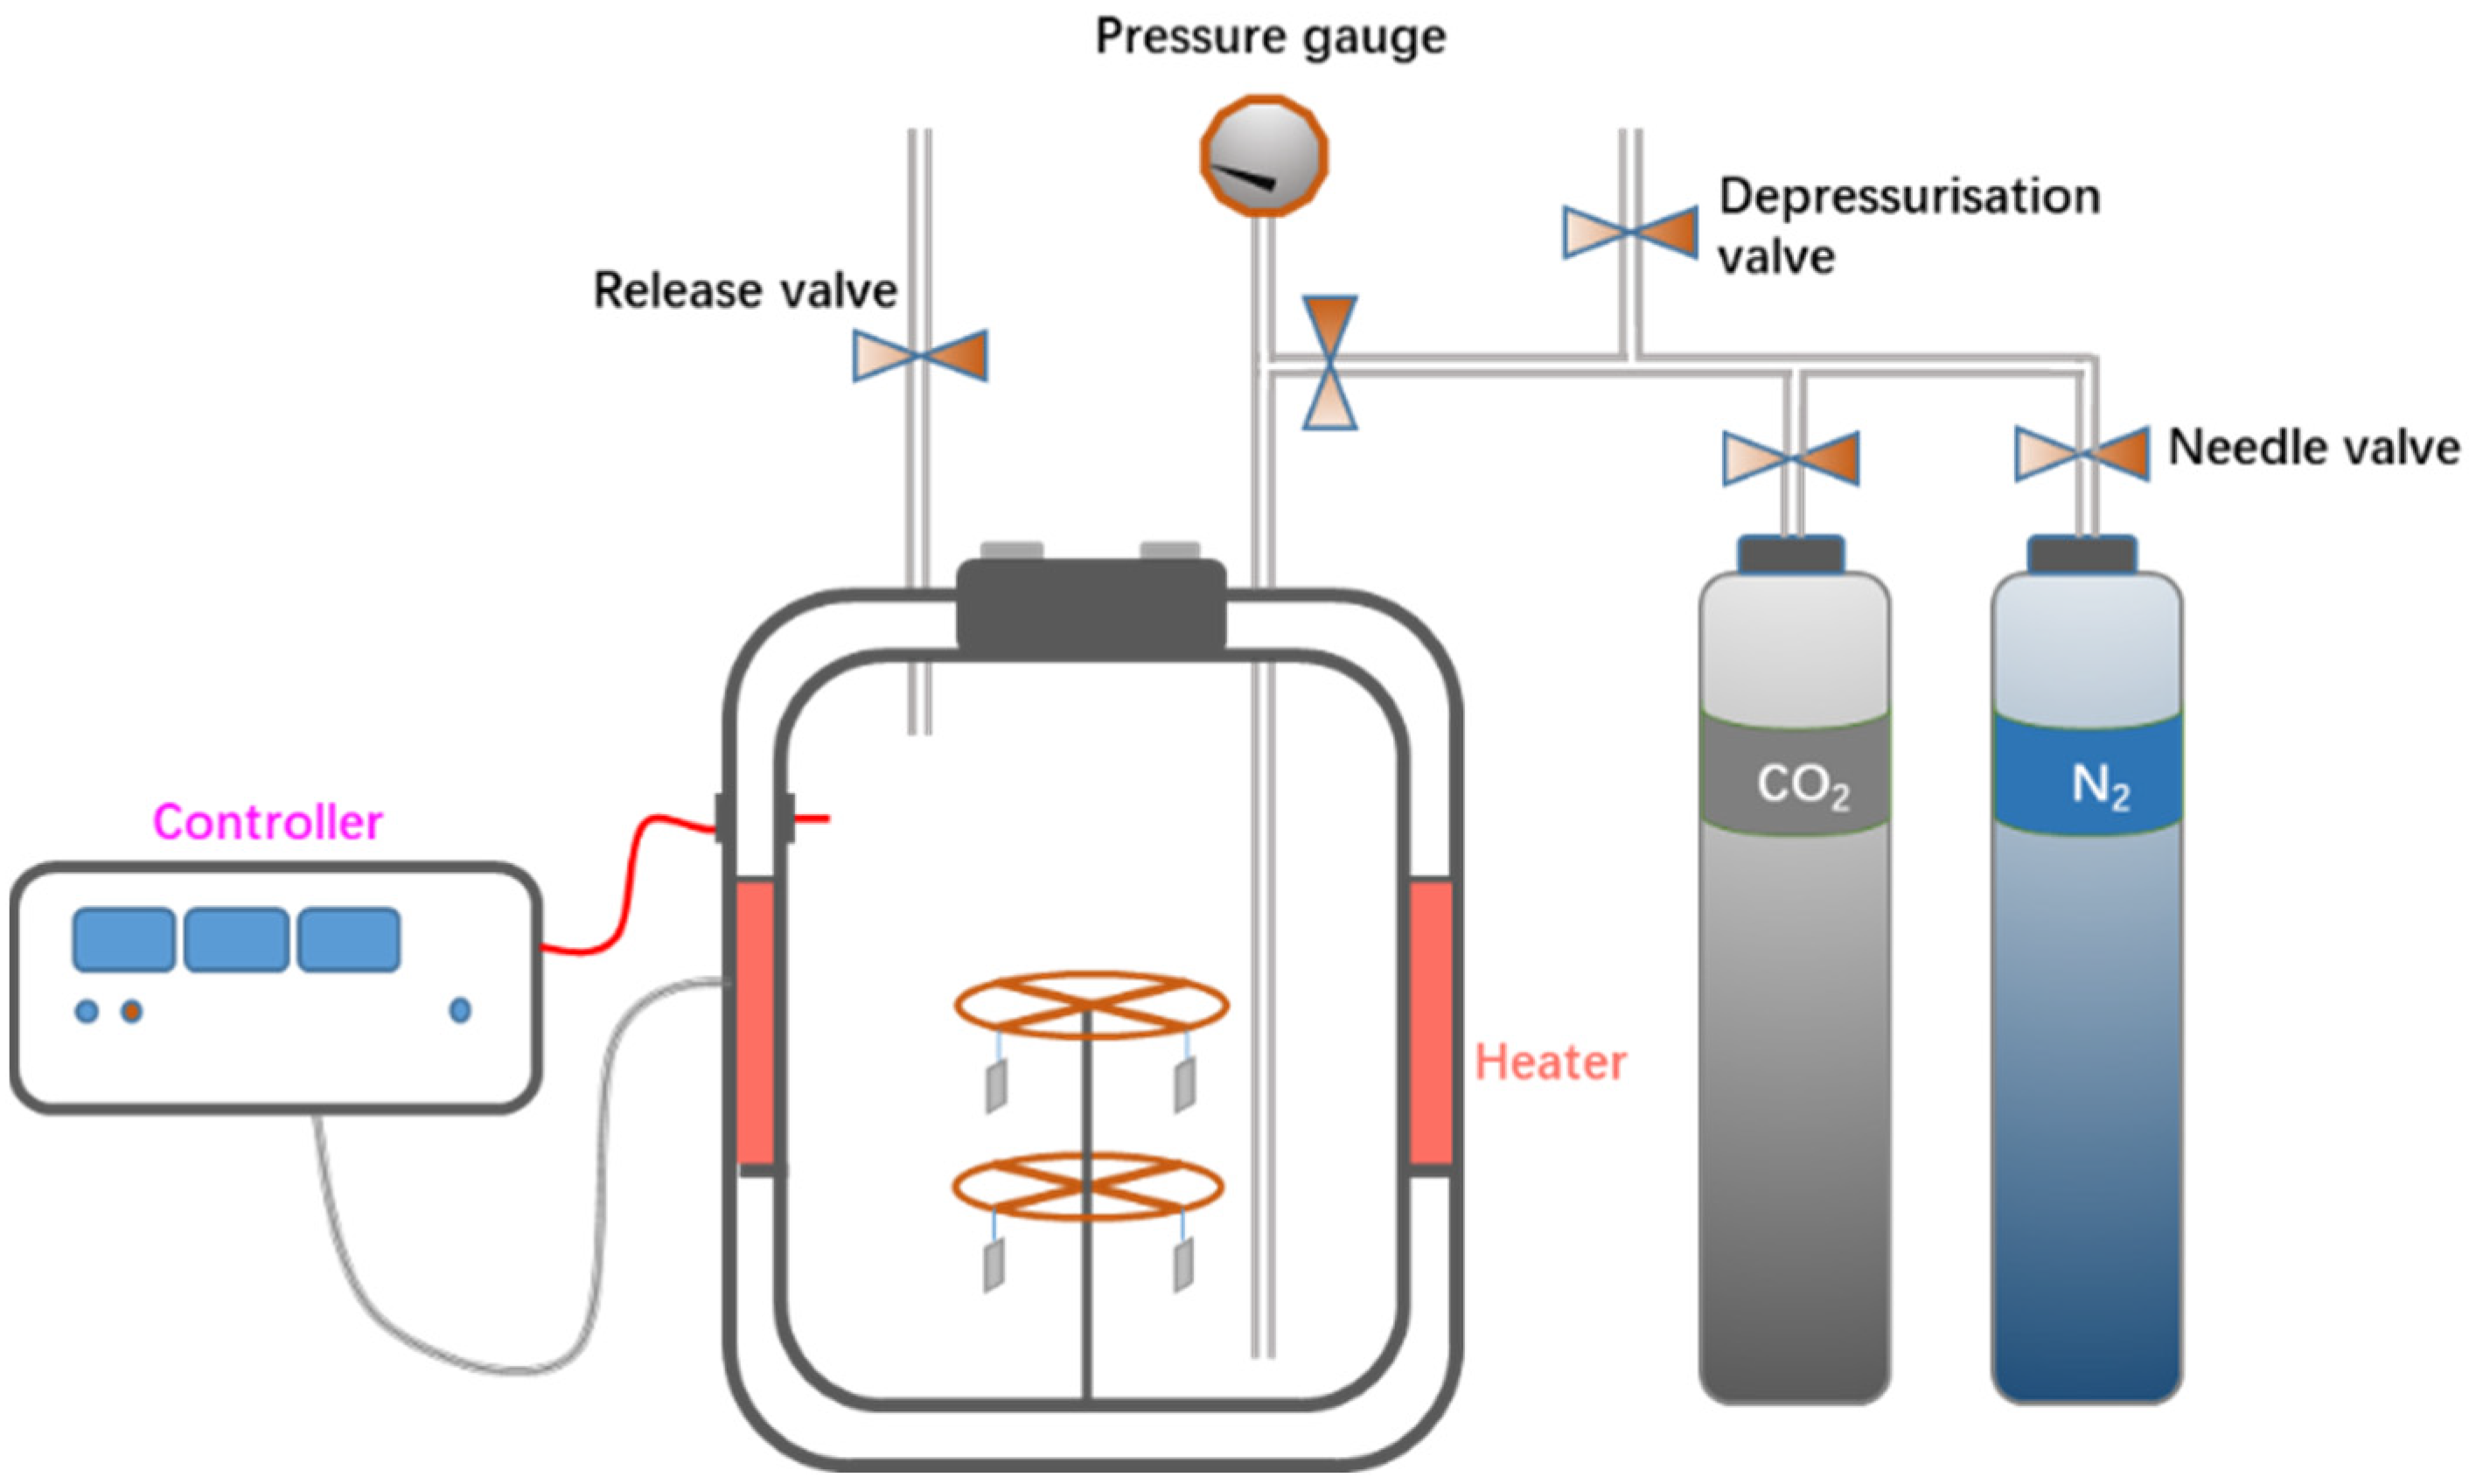
2.3. Material Selection Experiment
2.3.1. Determination of Service Environment of Wellhead, Wellbore, and Packer
2.3.2. Materials and Solution
2.3.3. Weight-Loss Test
2.3.4. Surface Characterization
2.3.5. Finite Service Life Calculation of Corrosion-Resistant Alloys and Carbon Steel Tubing
- (1)
- Life assessment considering the tensile safety factor
- (2)
- Life assessment considering the internal pressure safety factor
3. Results
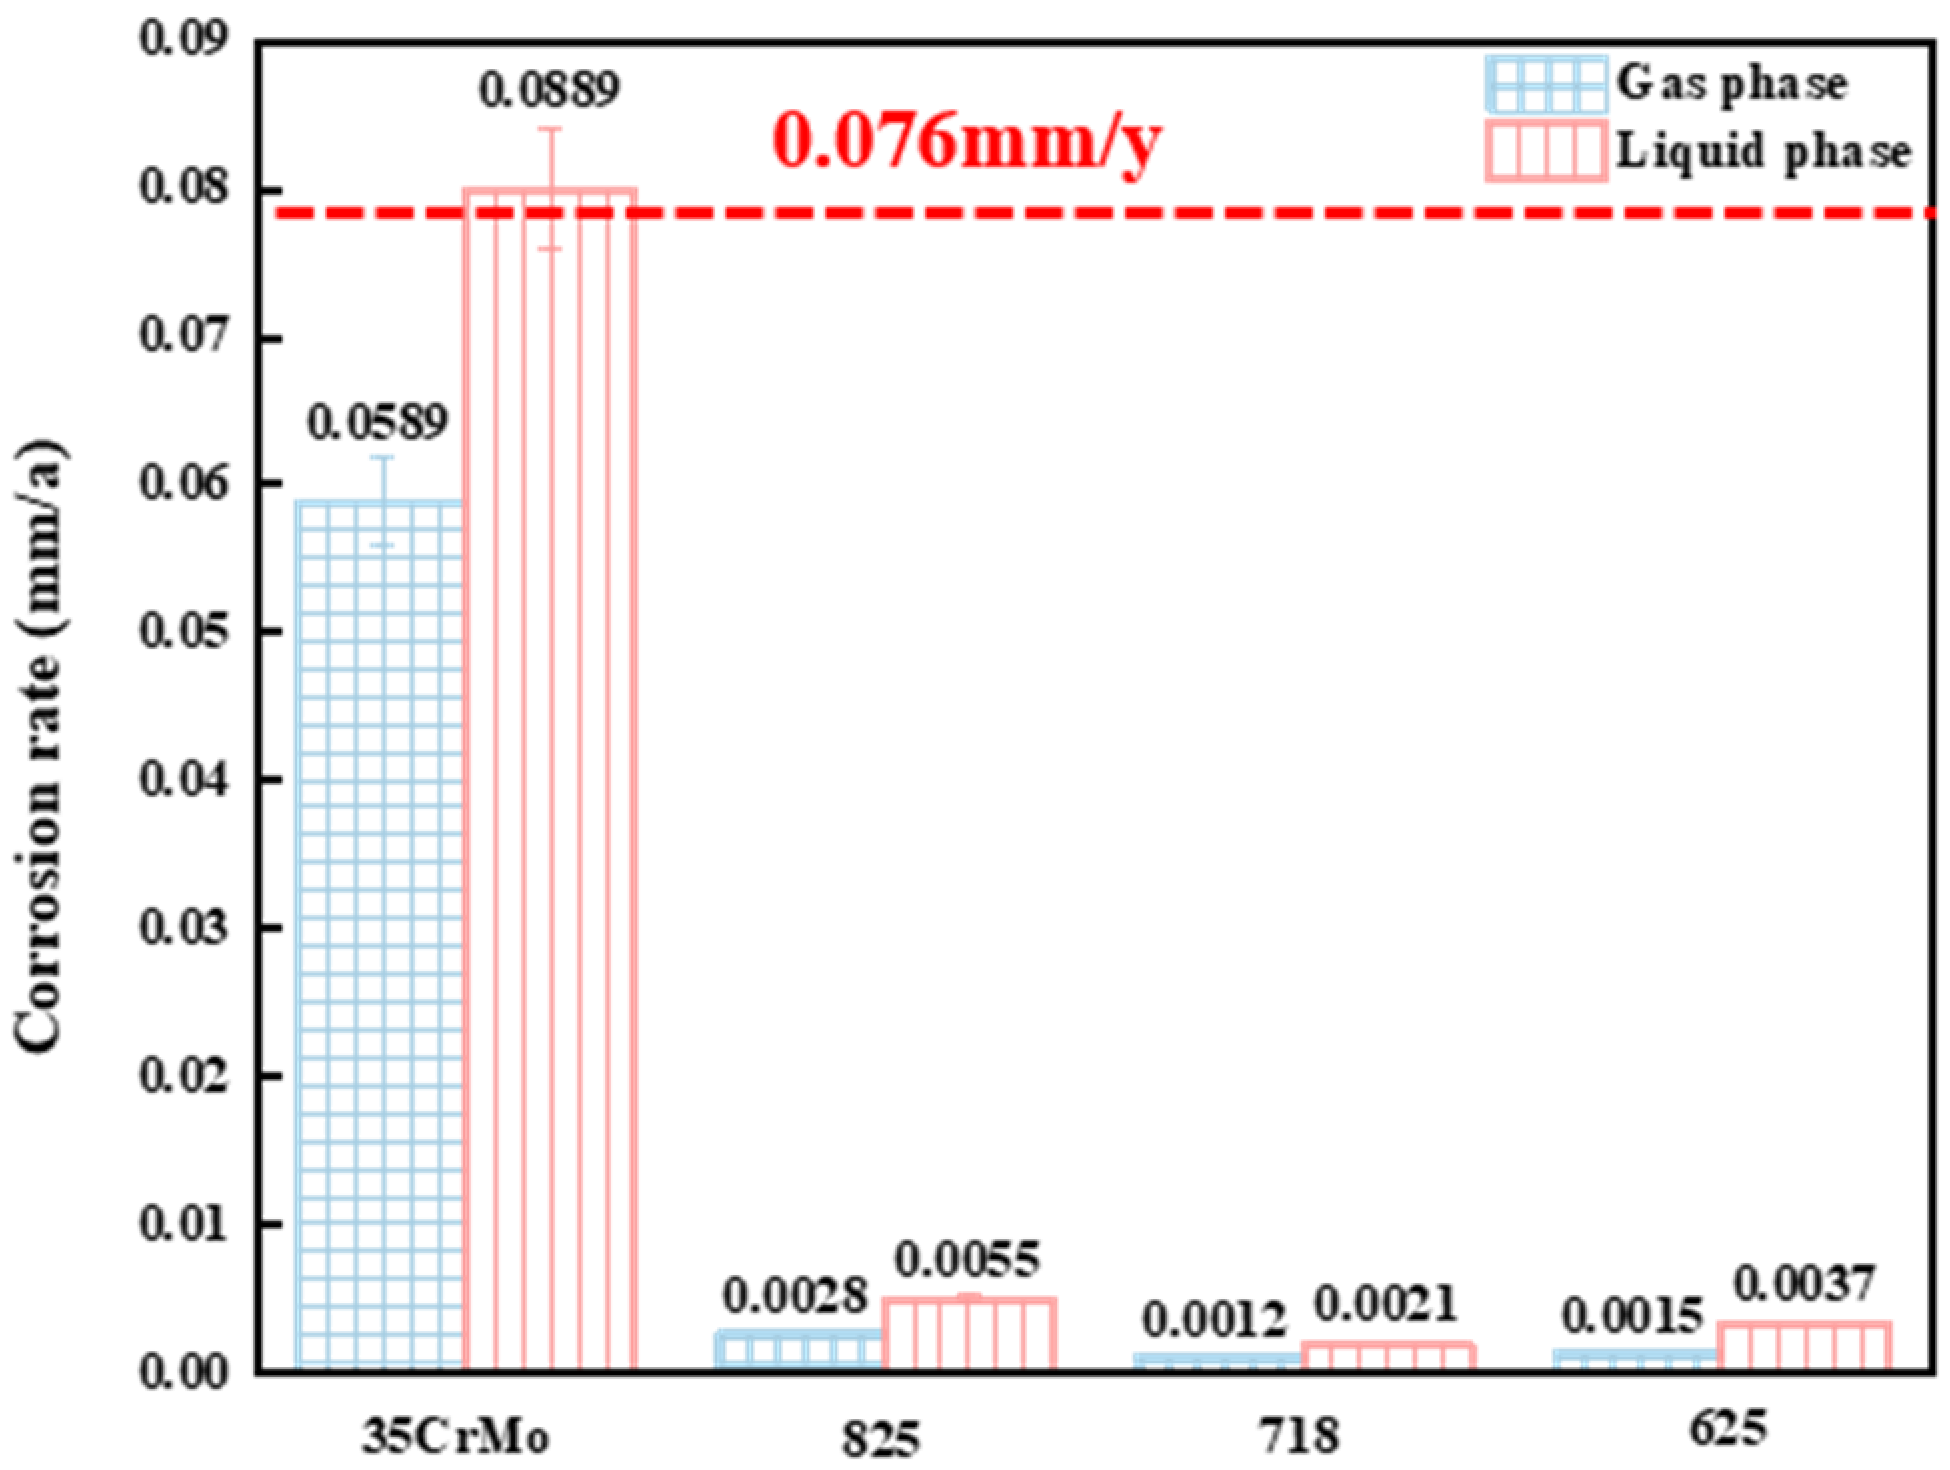
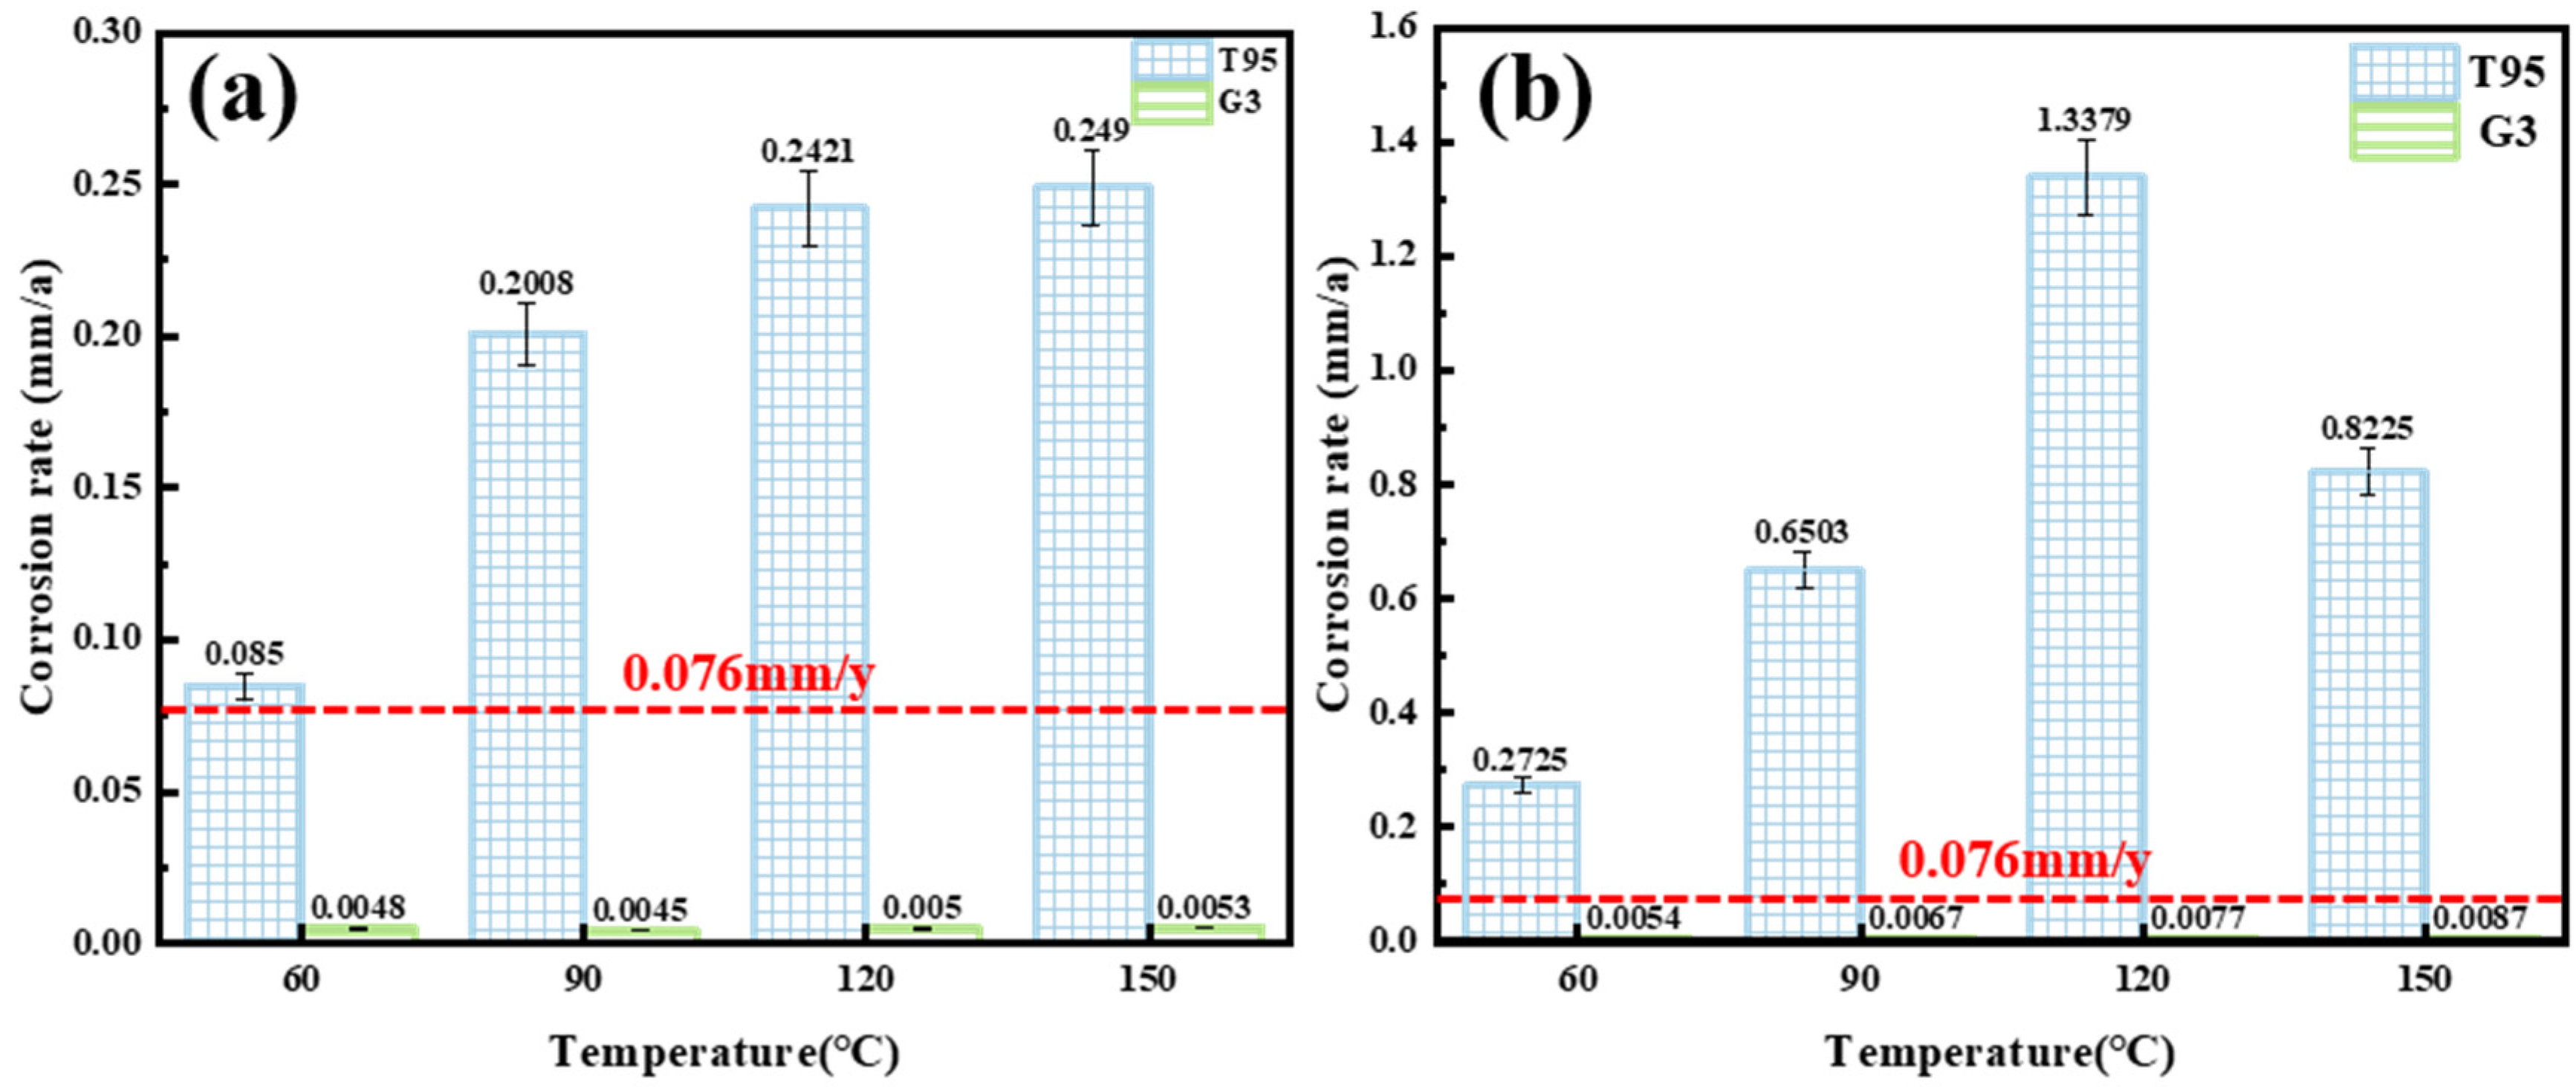
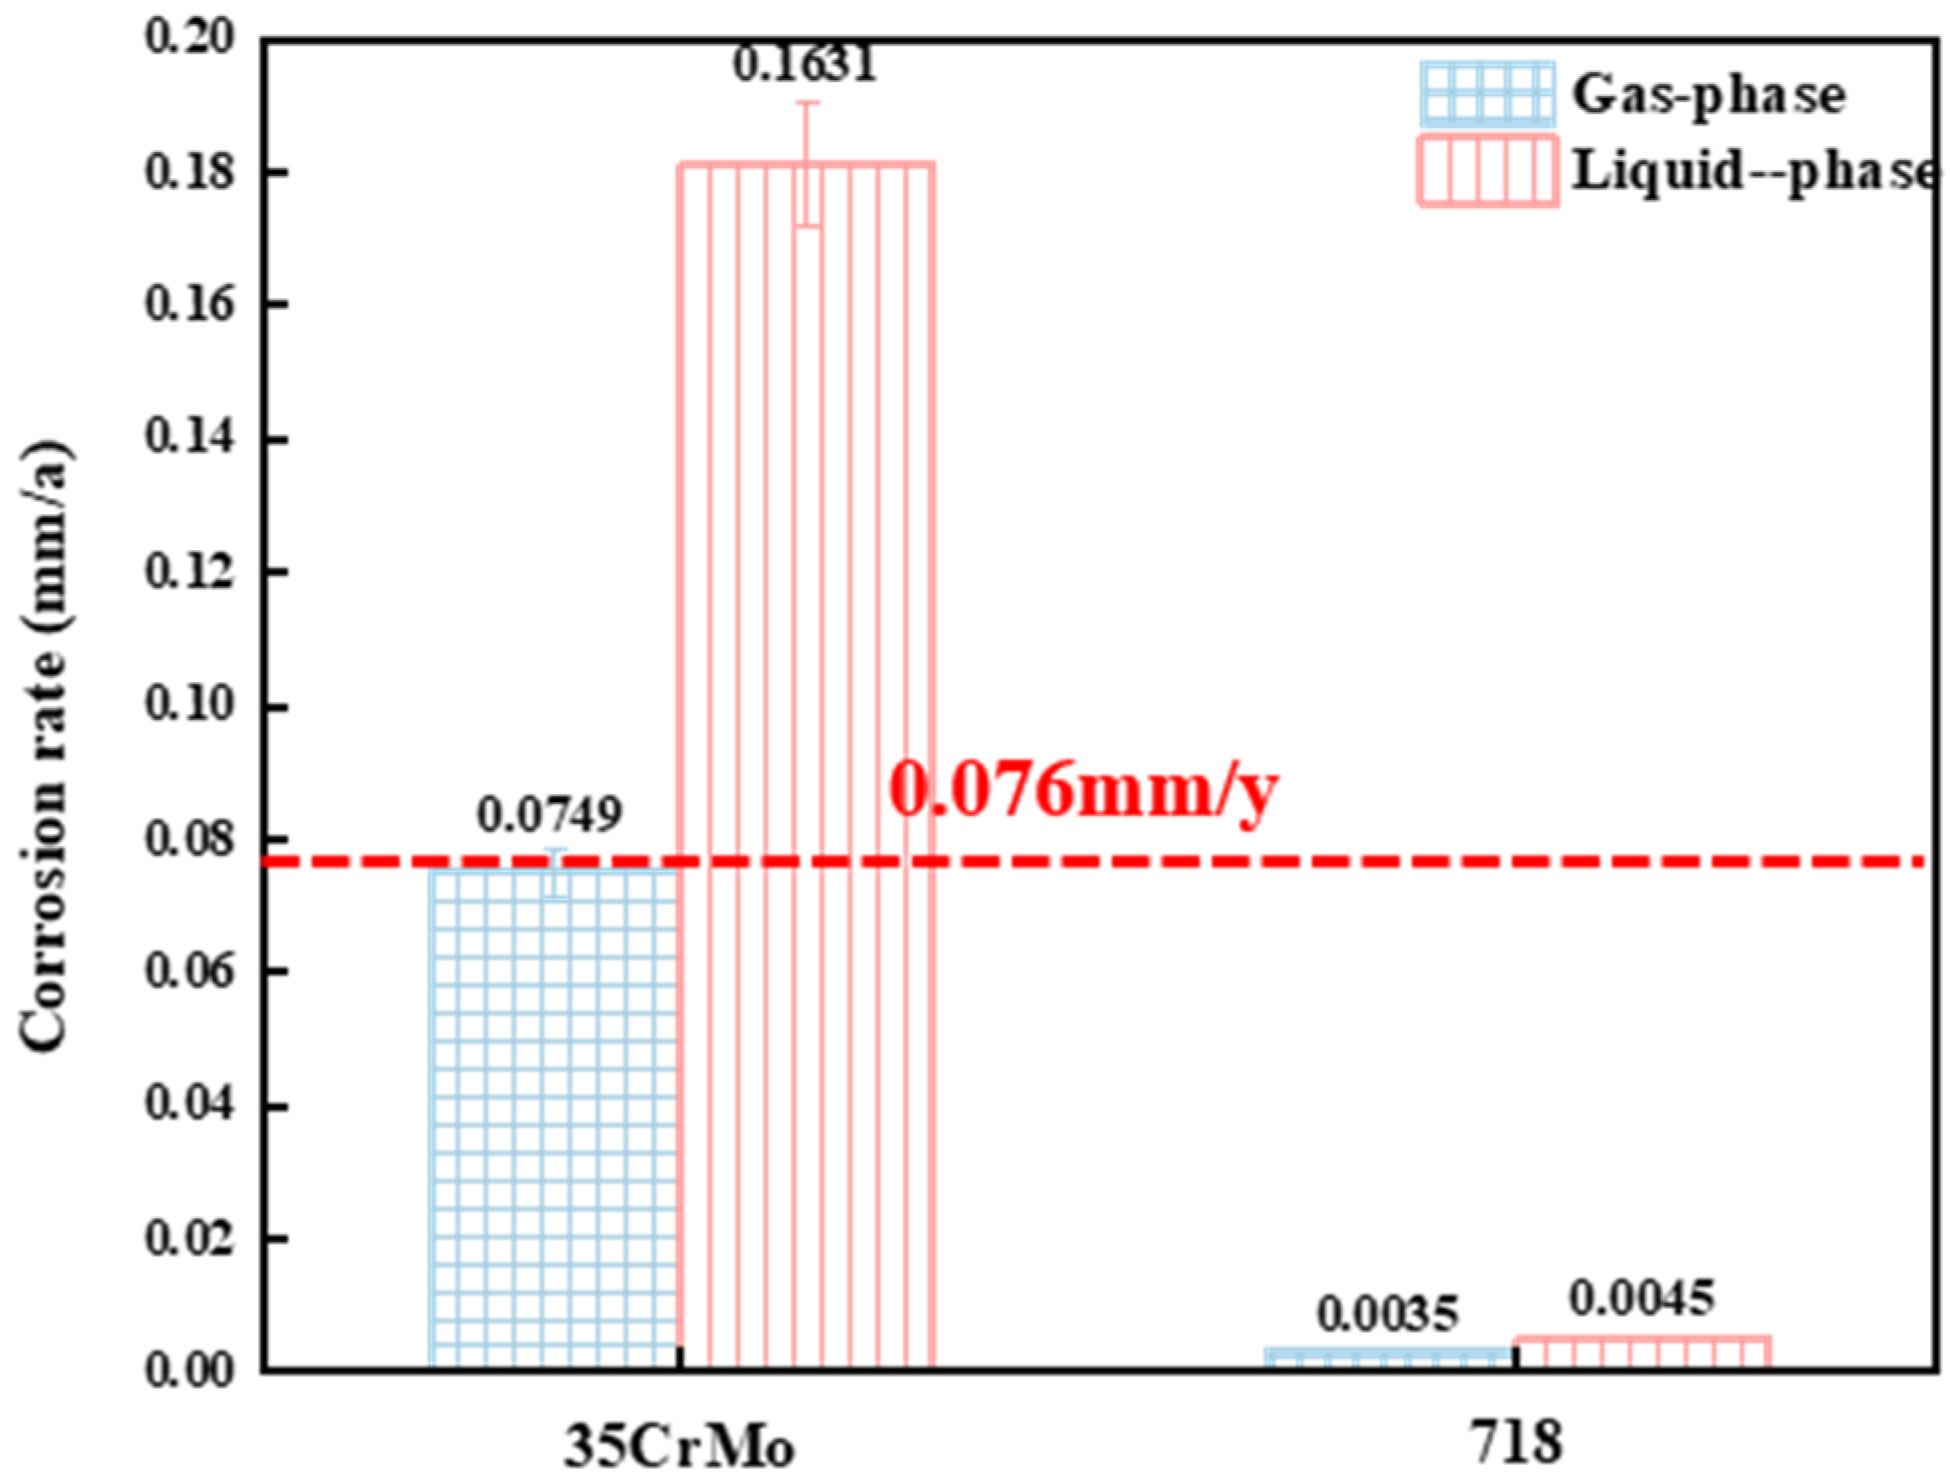
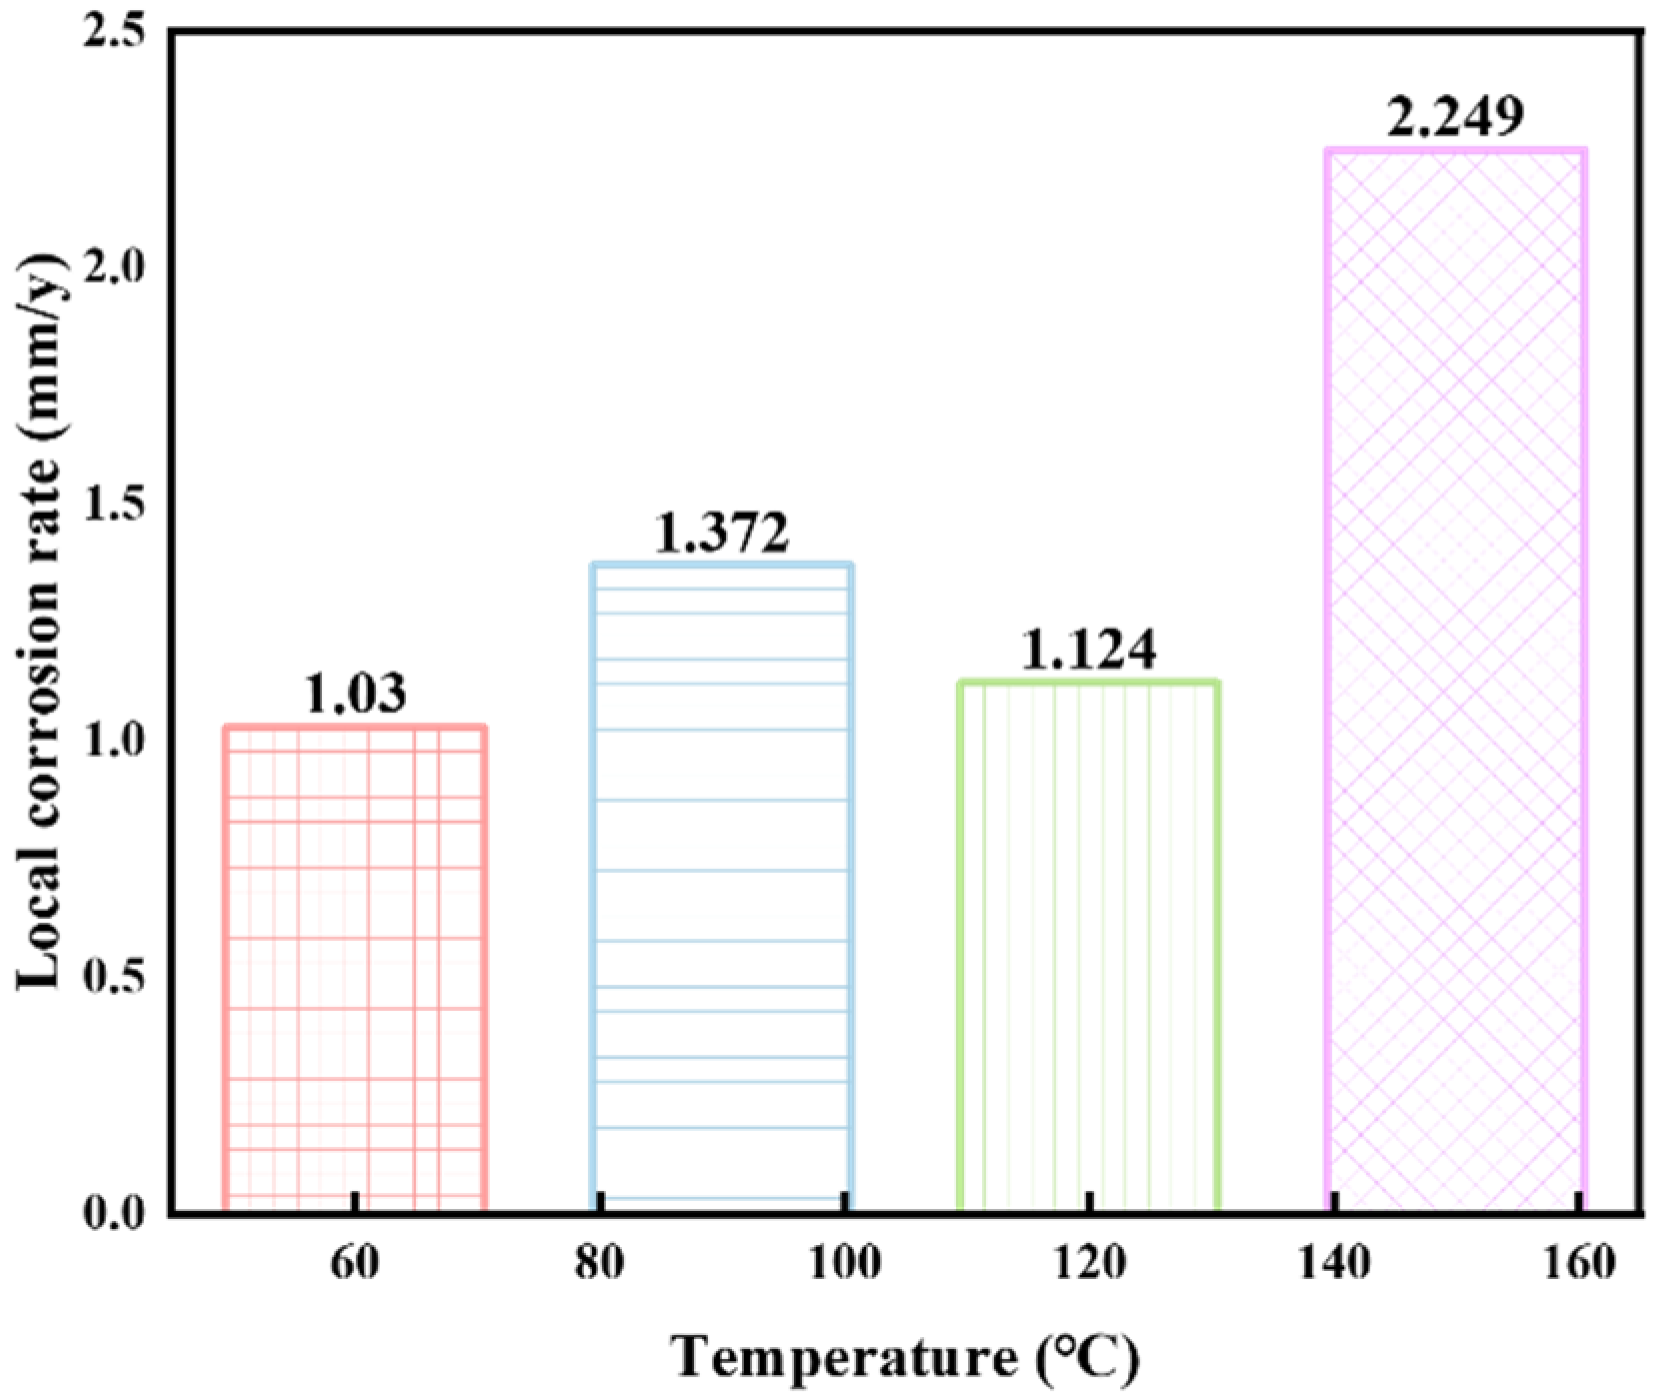
3.1. Corrosion Rate
3.2. Characteristics of Corrosion Scales
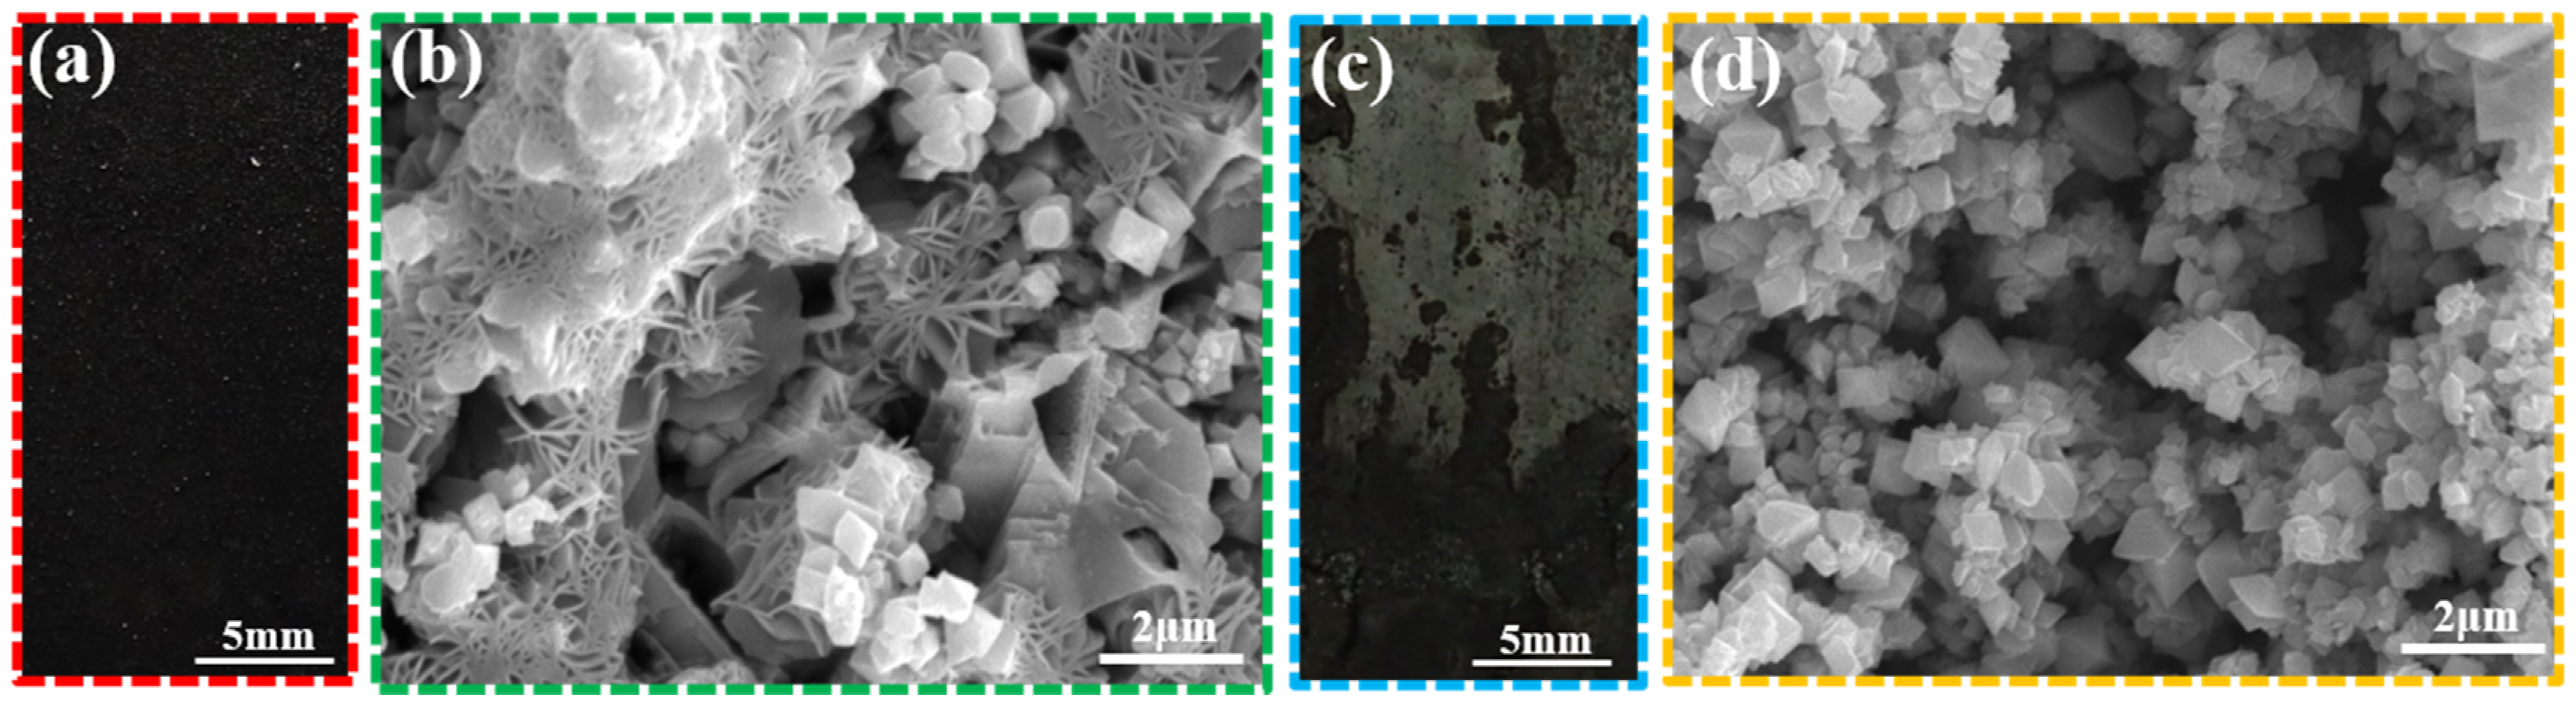
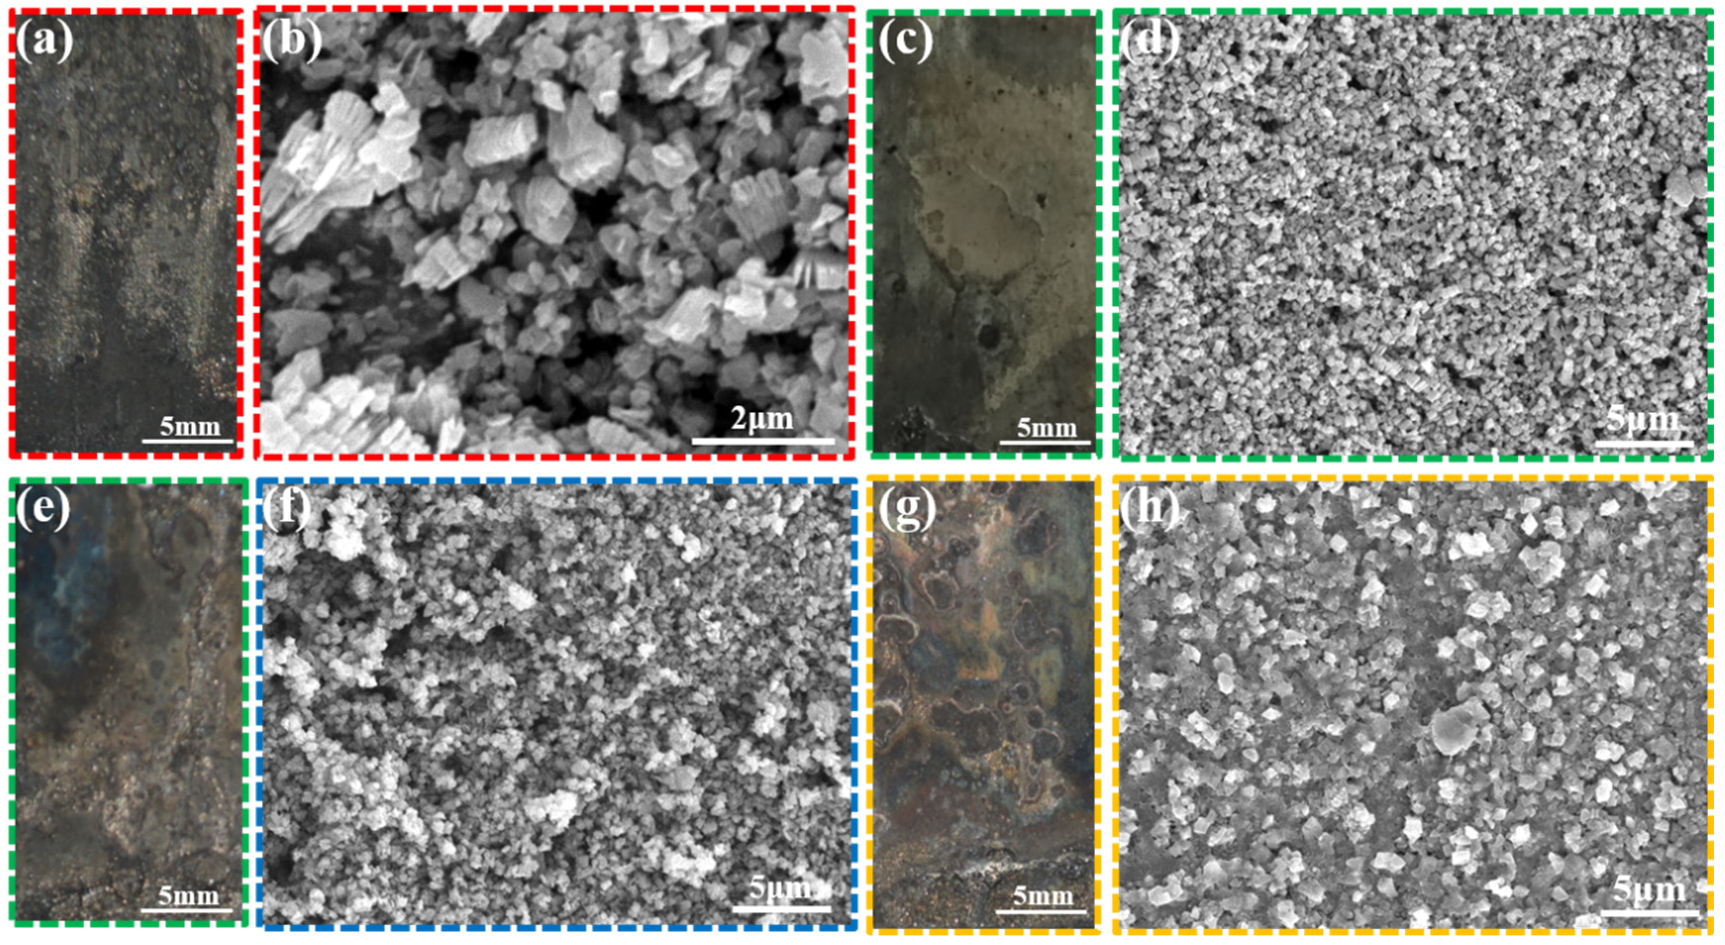
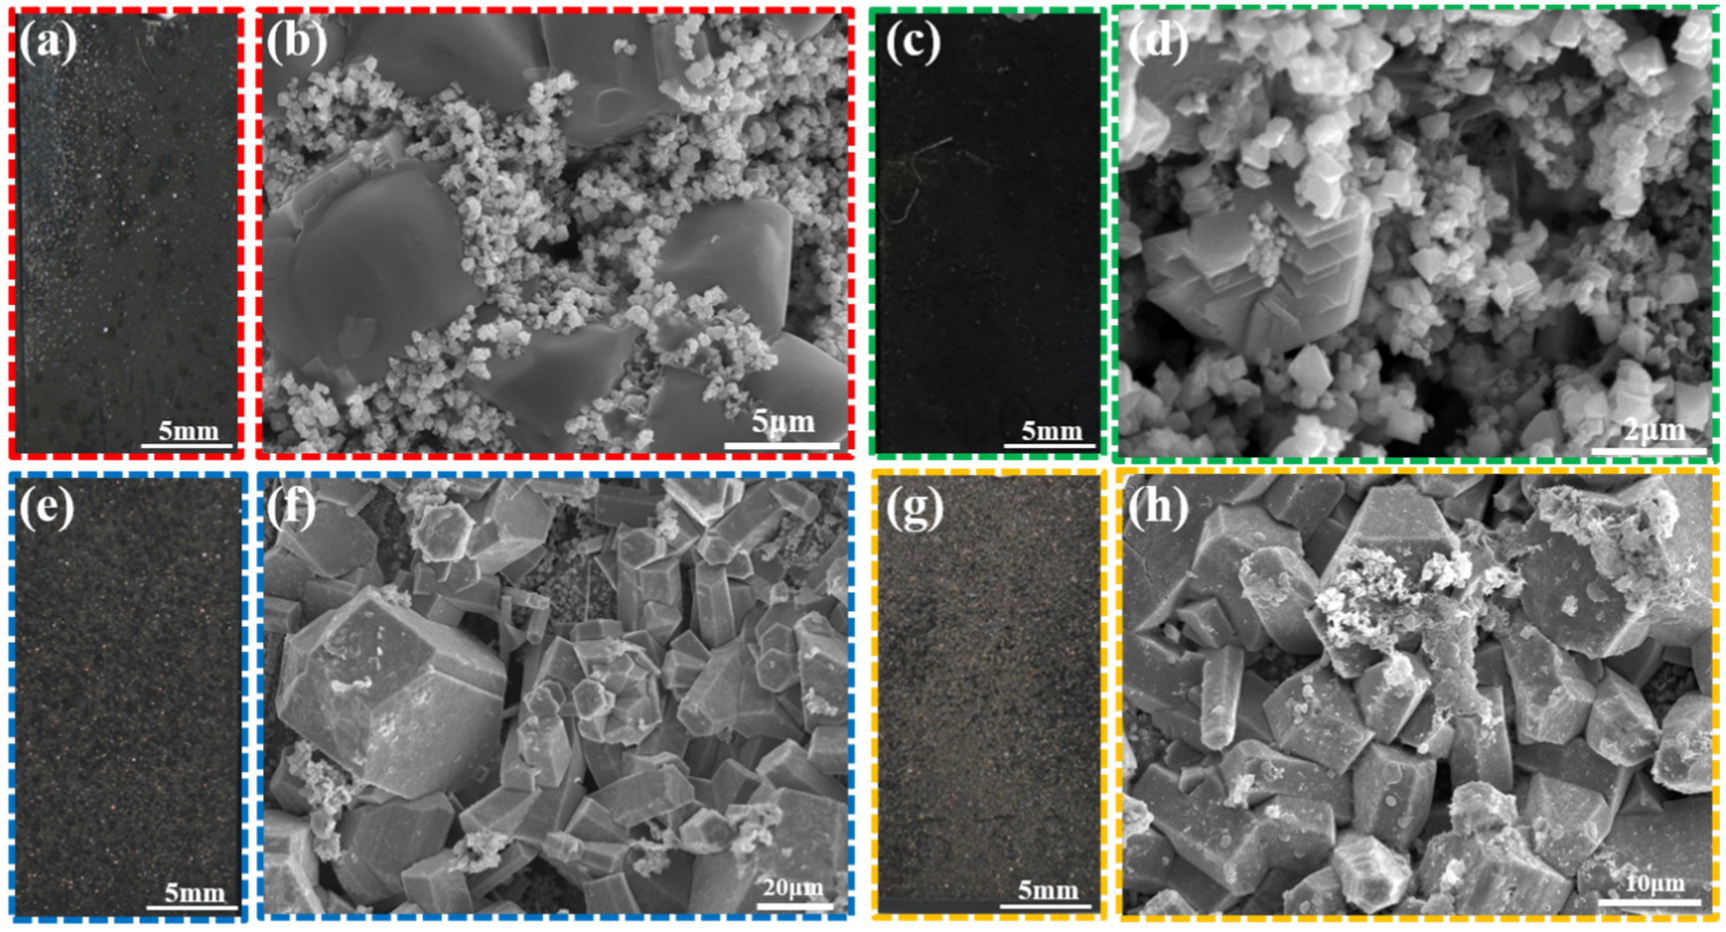
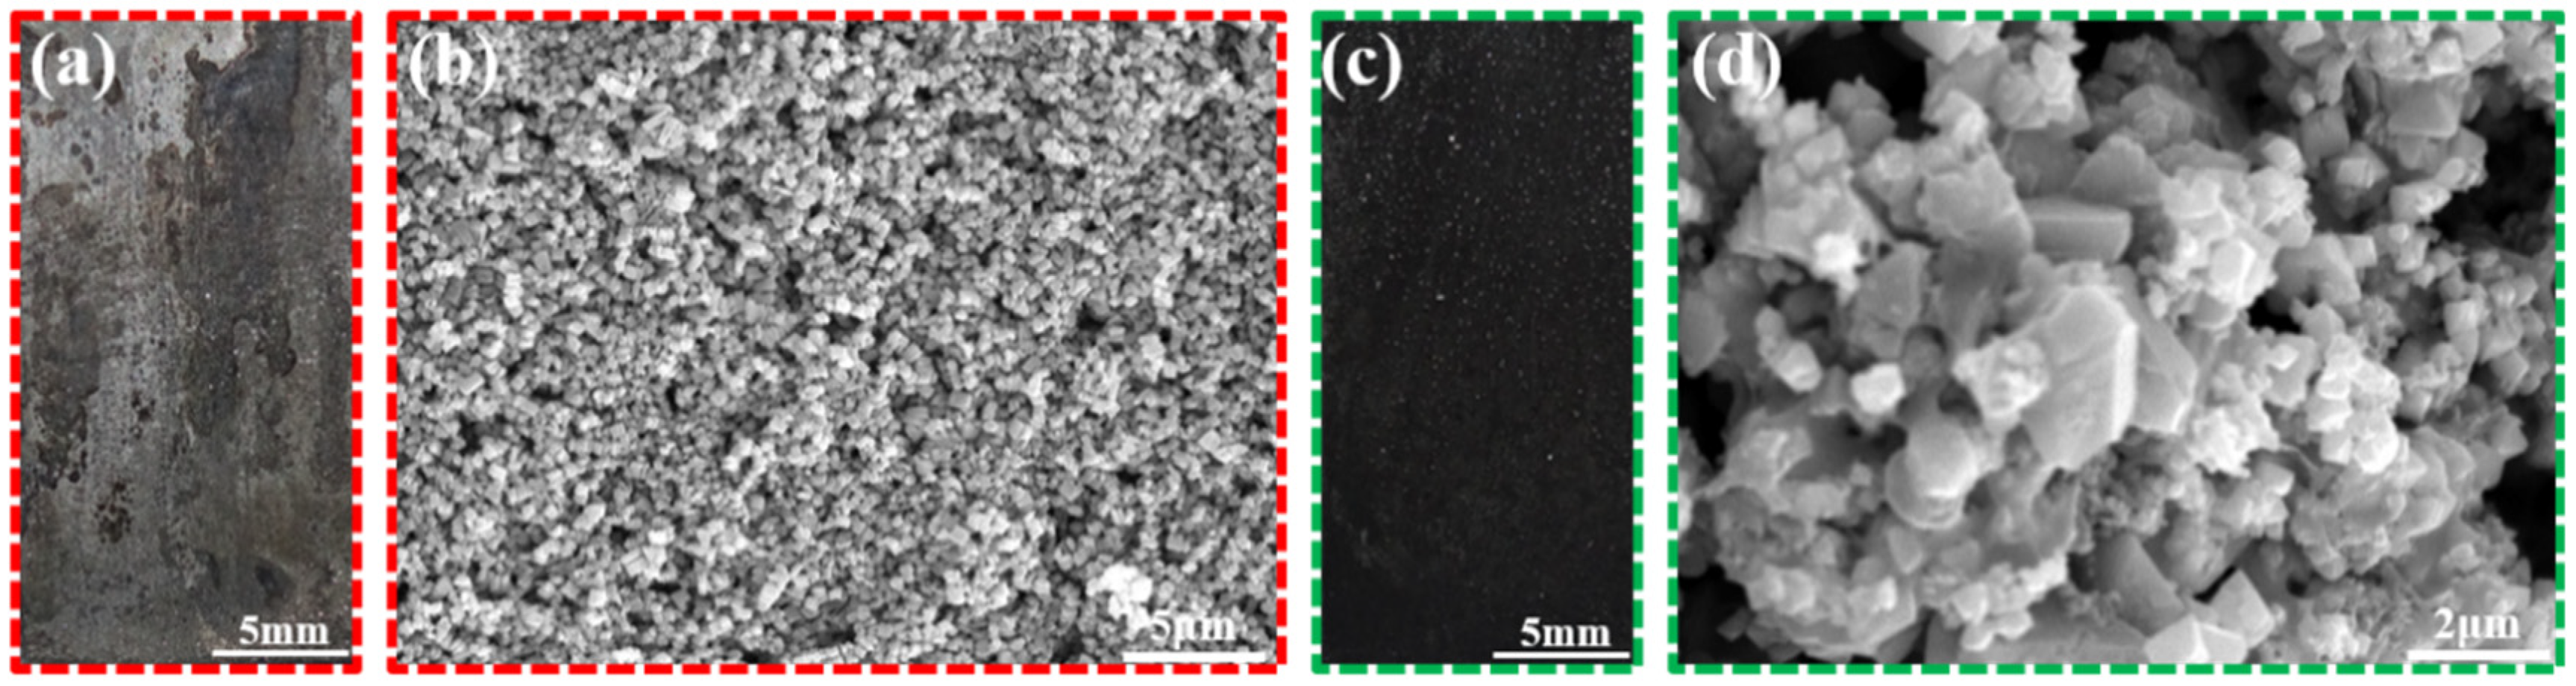
3.2.1. Surface Morphology
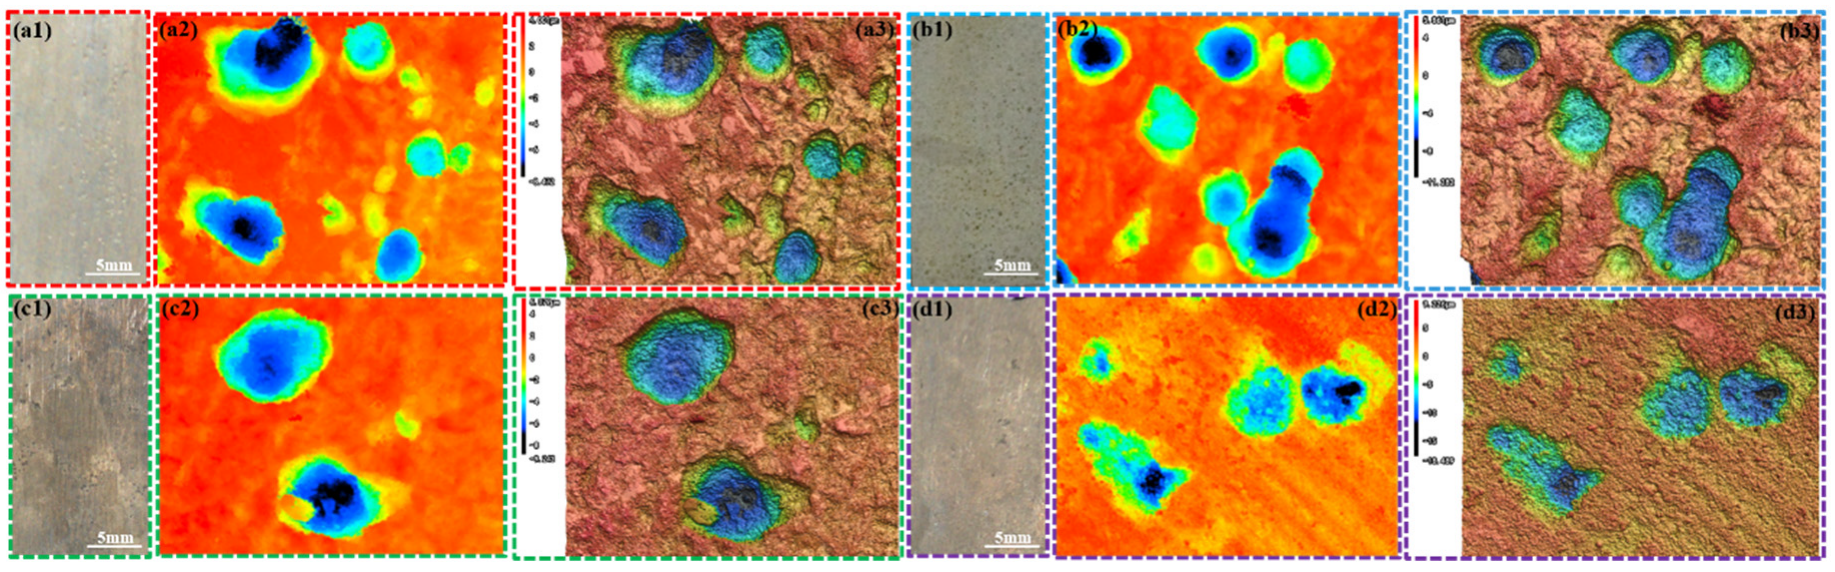
3.2.2. 3D Surface Morphology and Pitting Rate
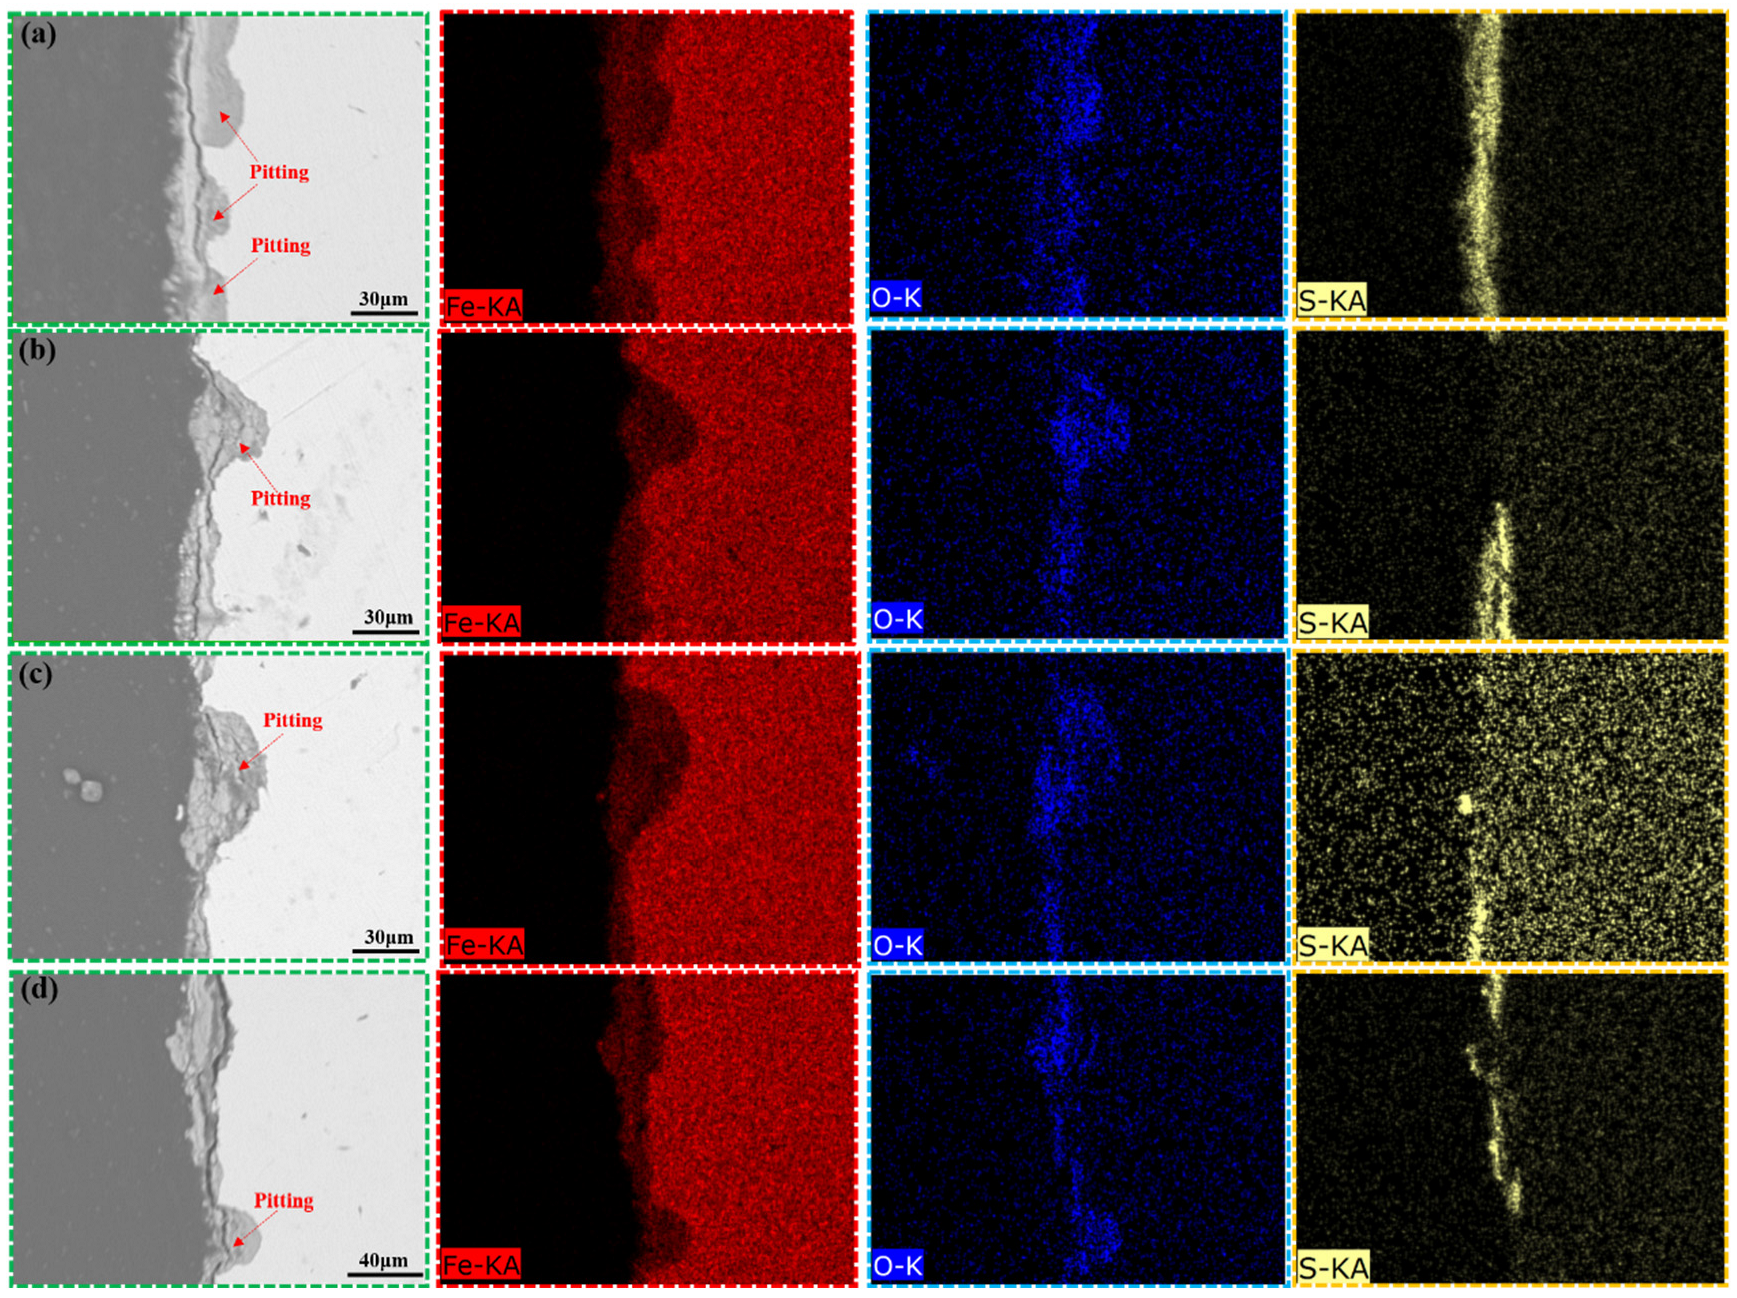
3.2.3. Element Distribution
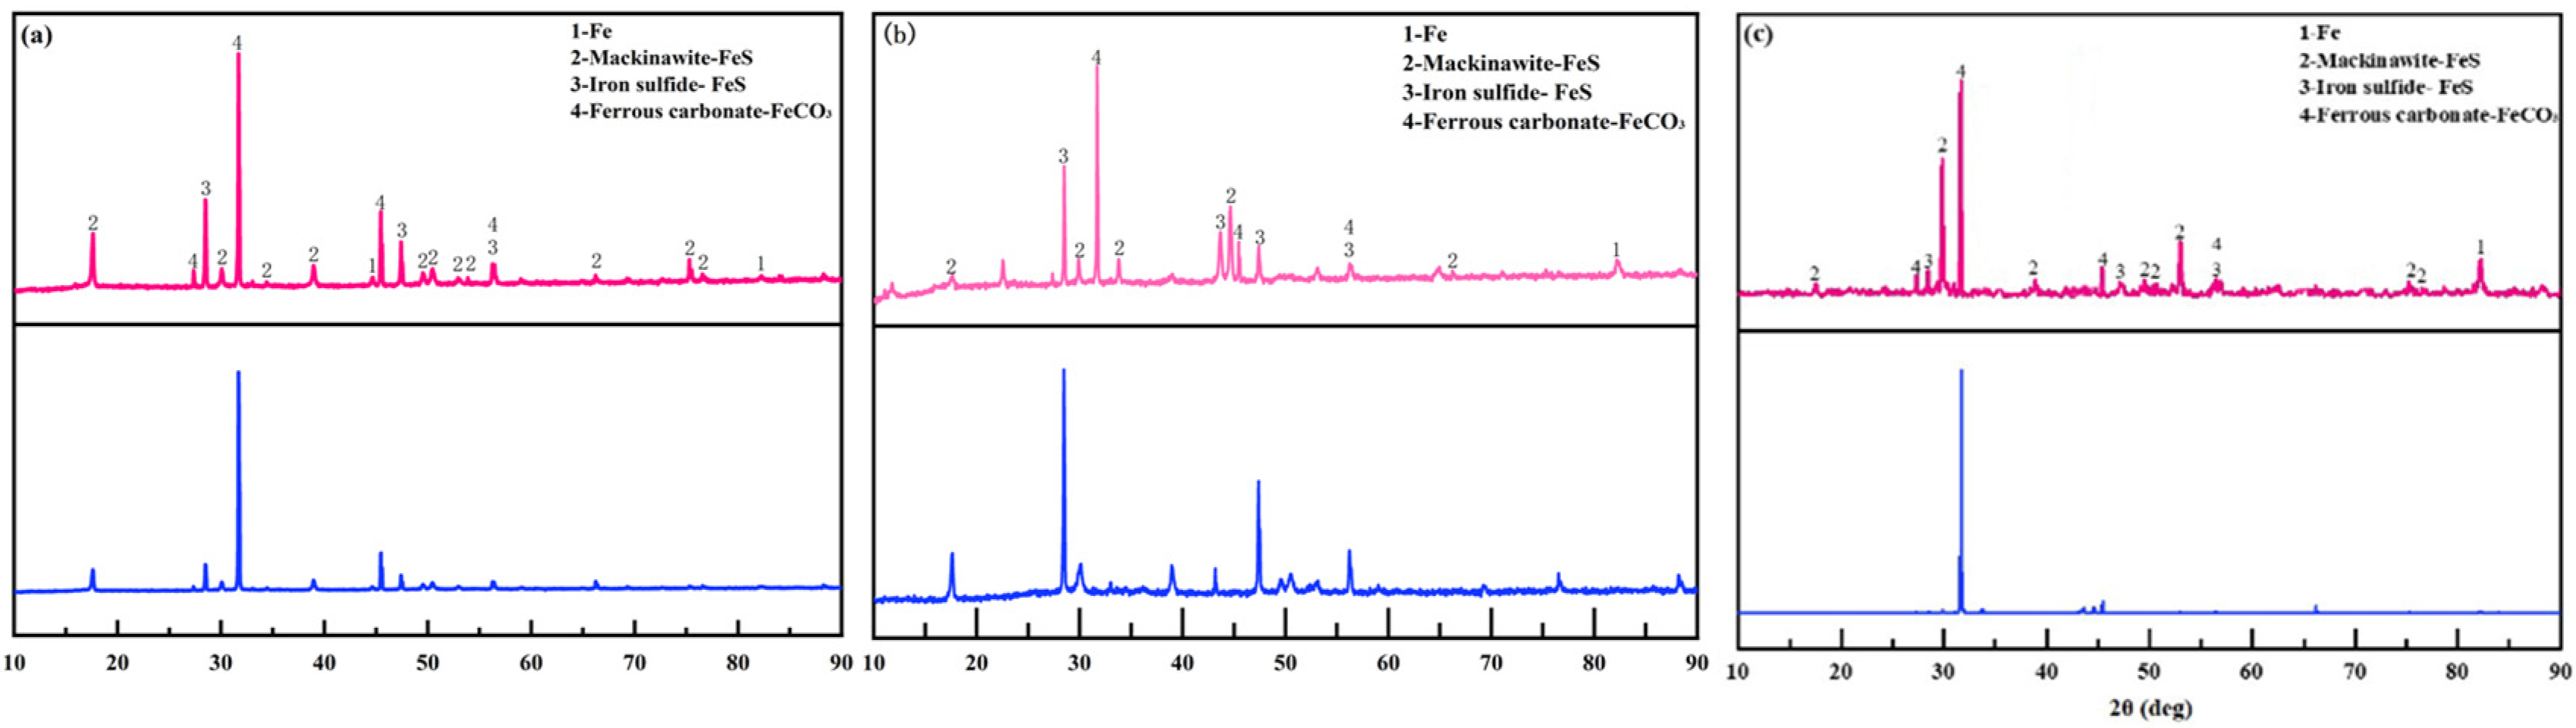
3.2.4. Phase Composition of Corrosion Products
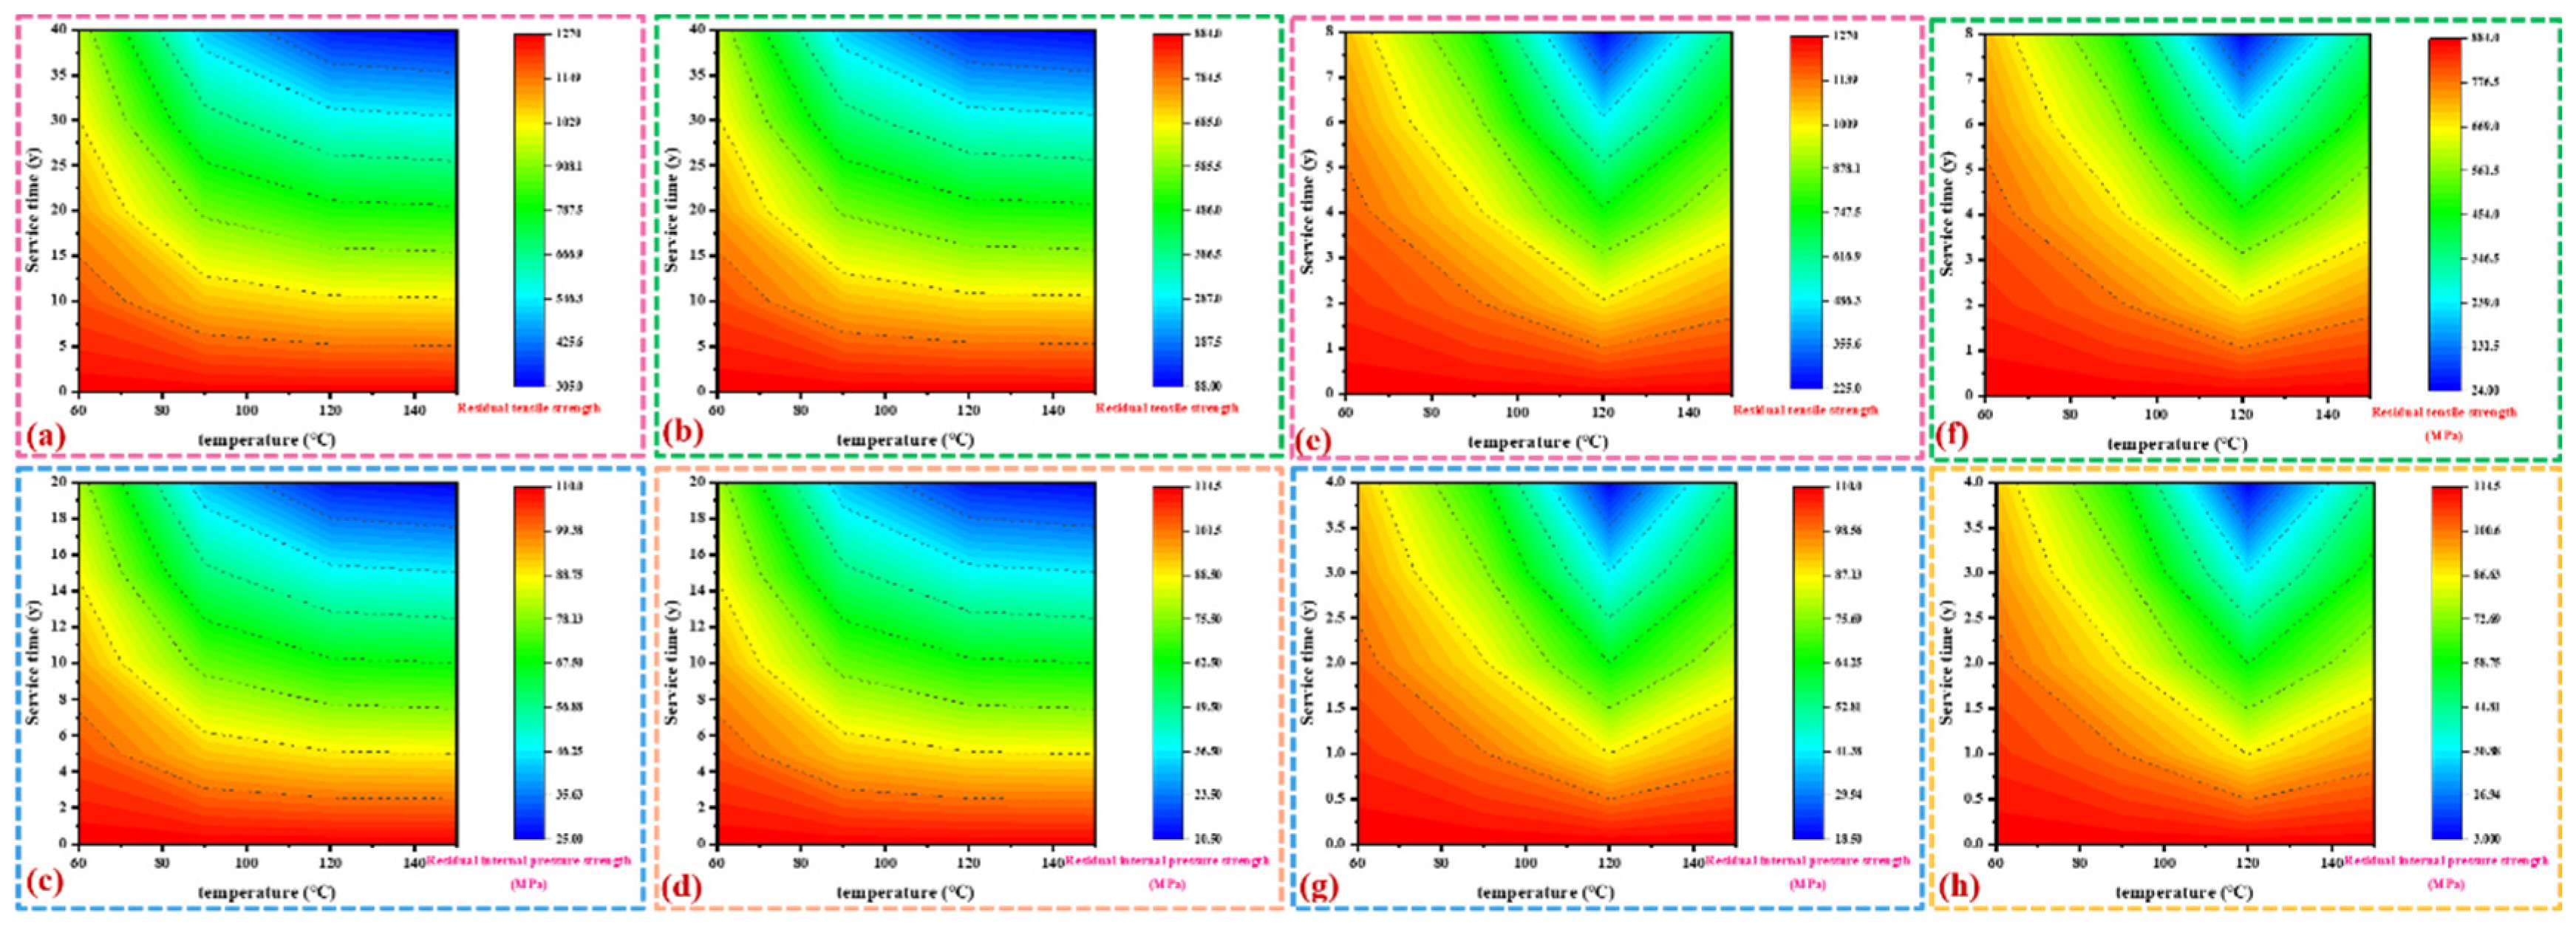
3.3. Safe Service Life of Carbon Steel and Nickel Base Alloy Steel
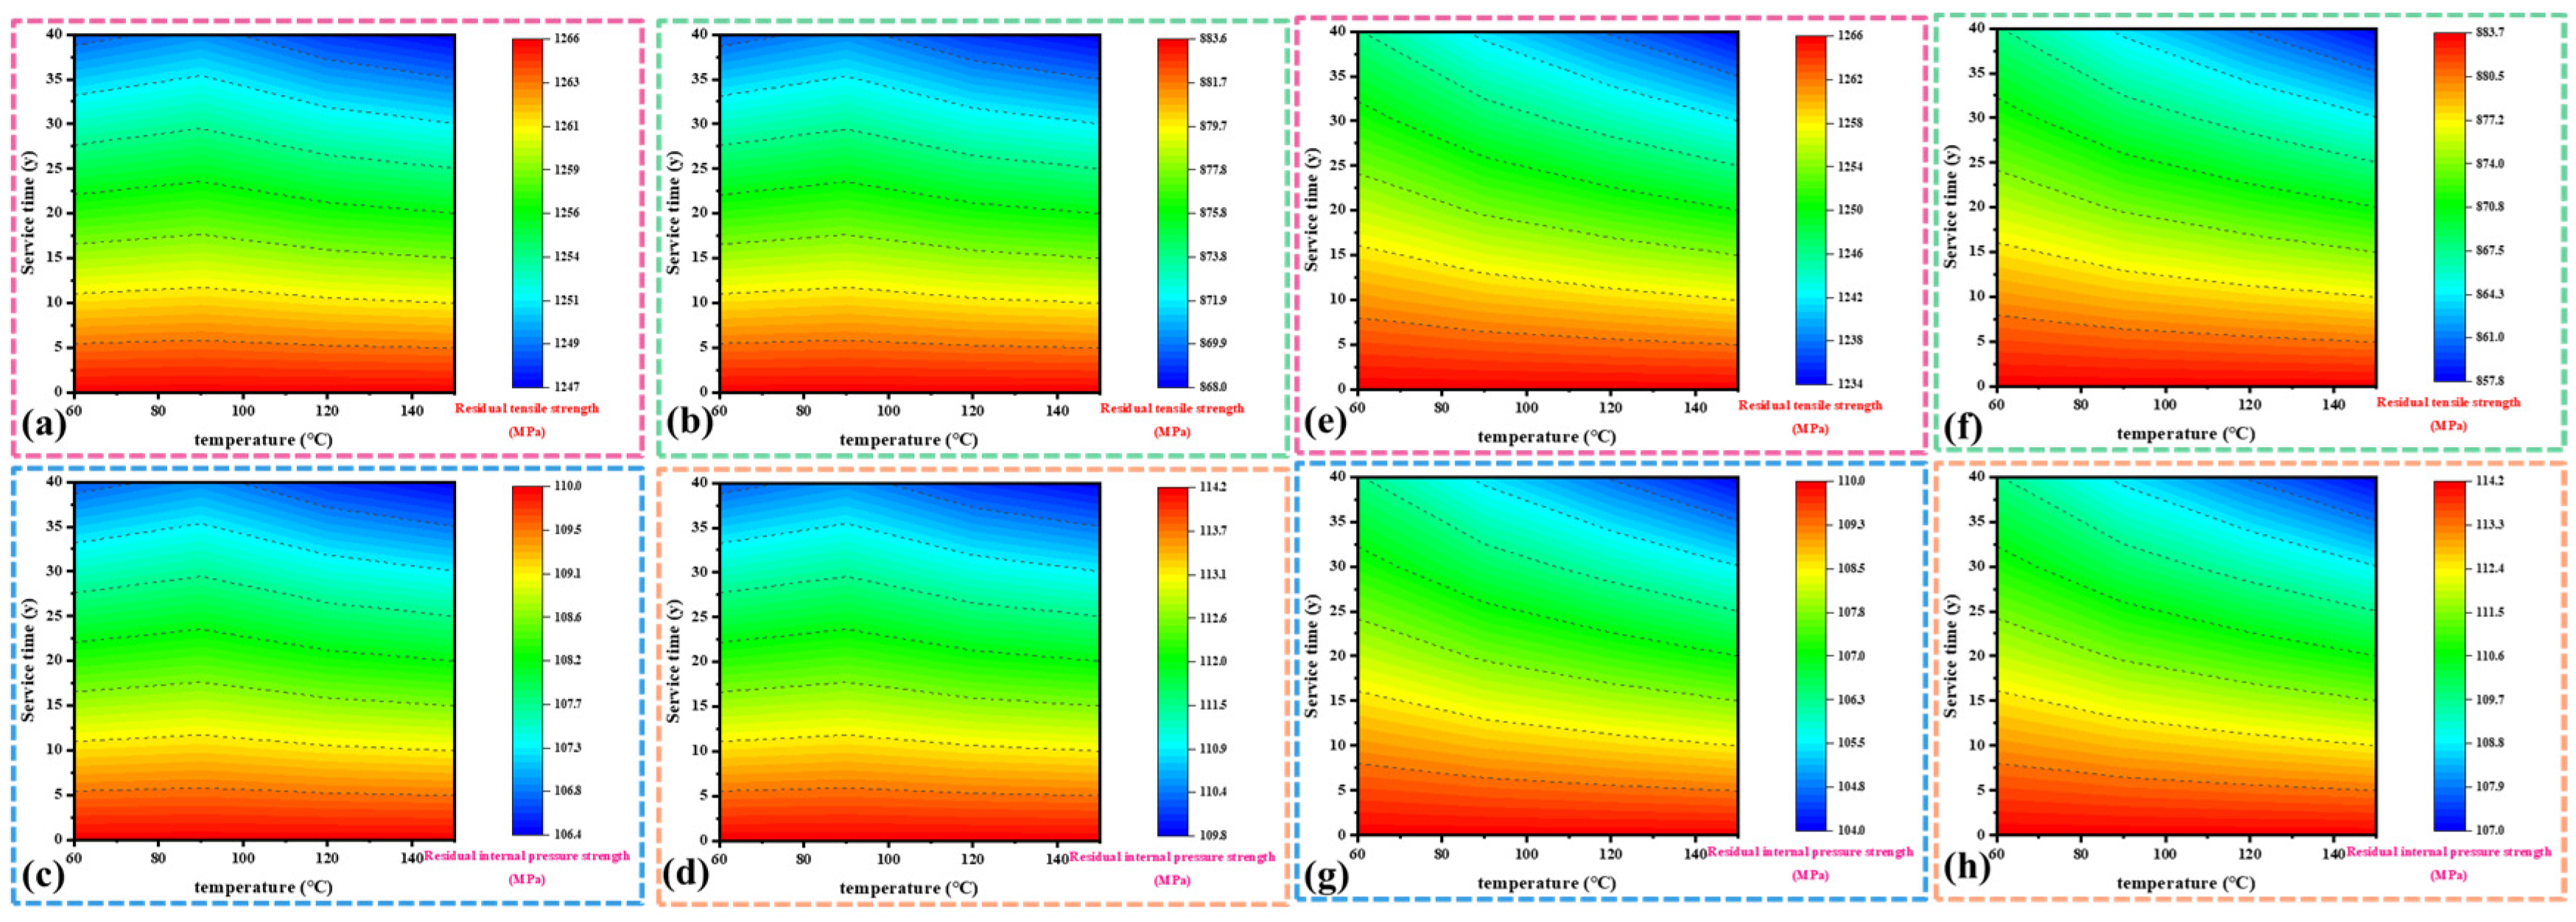
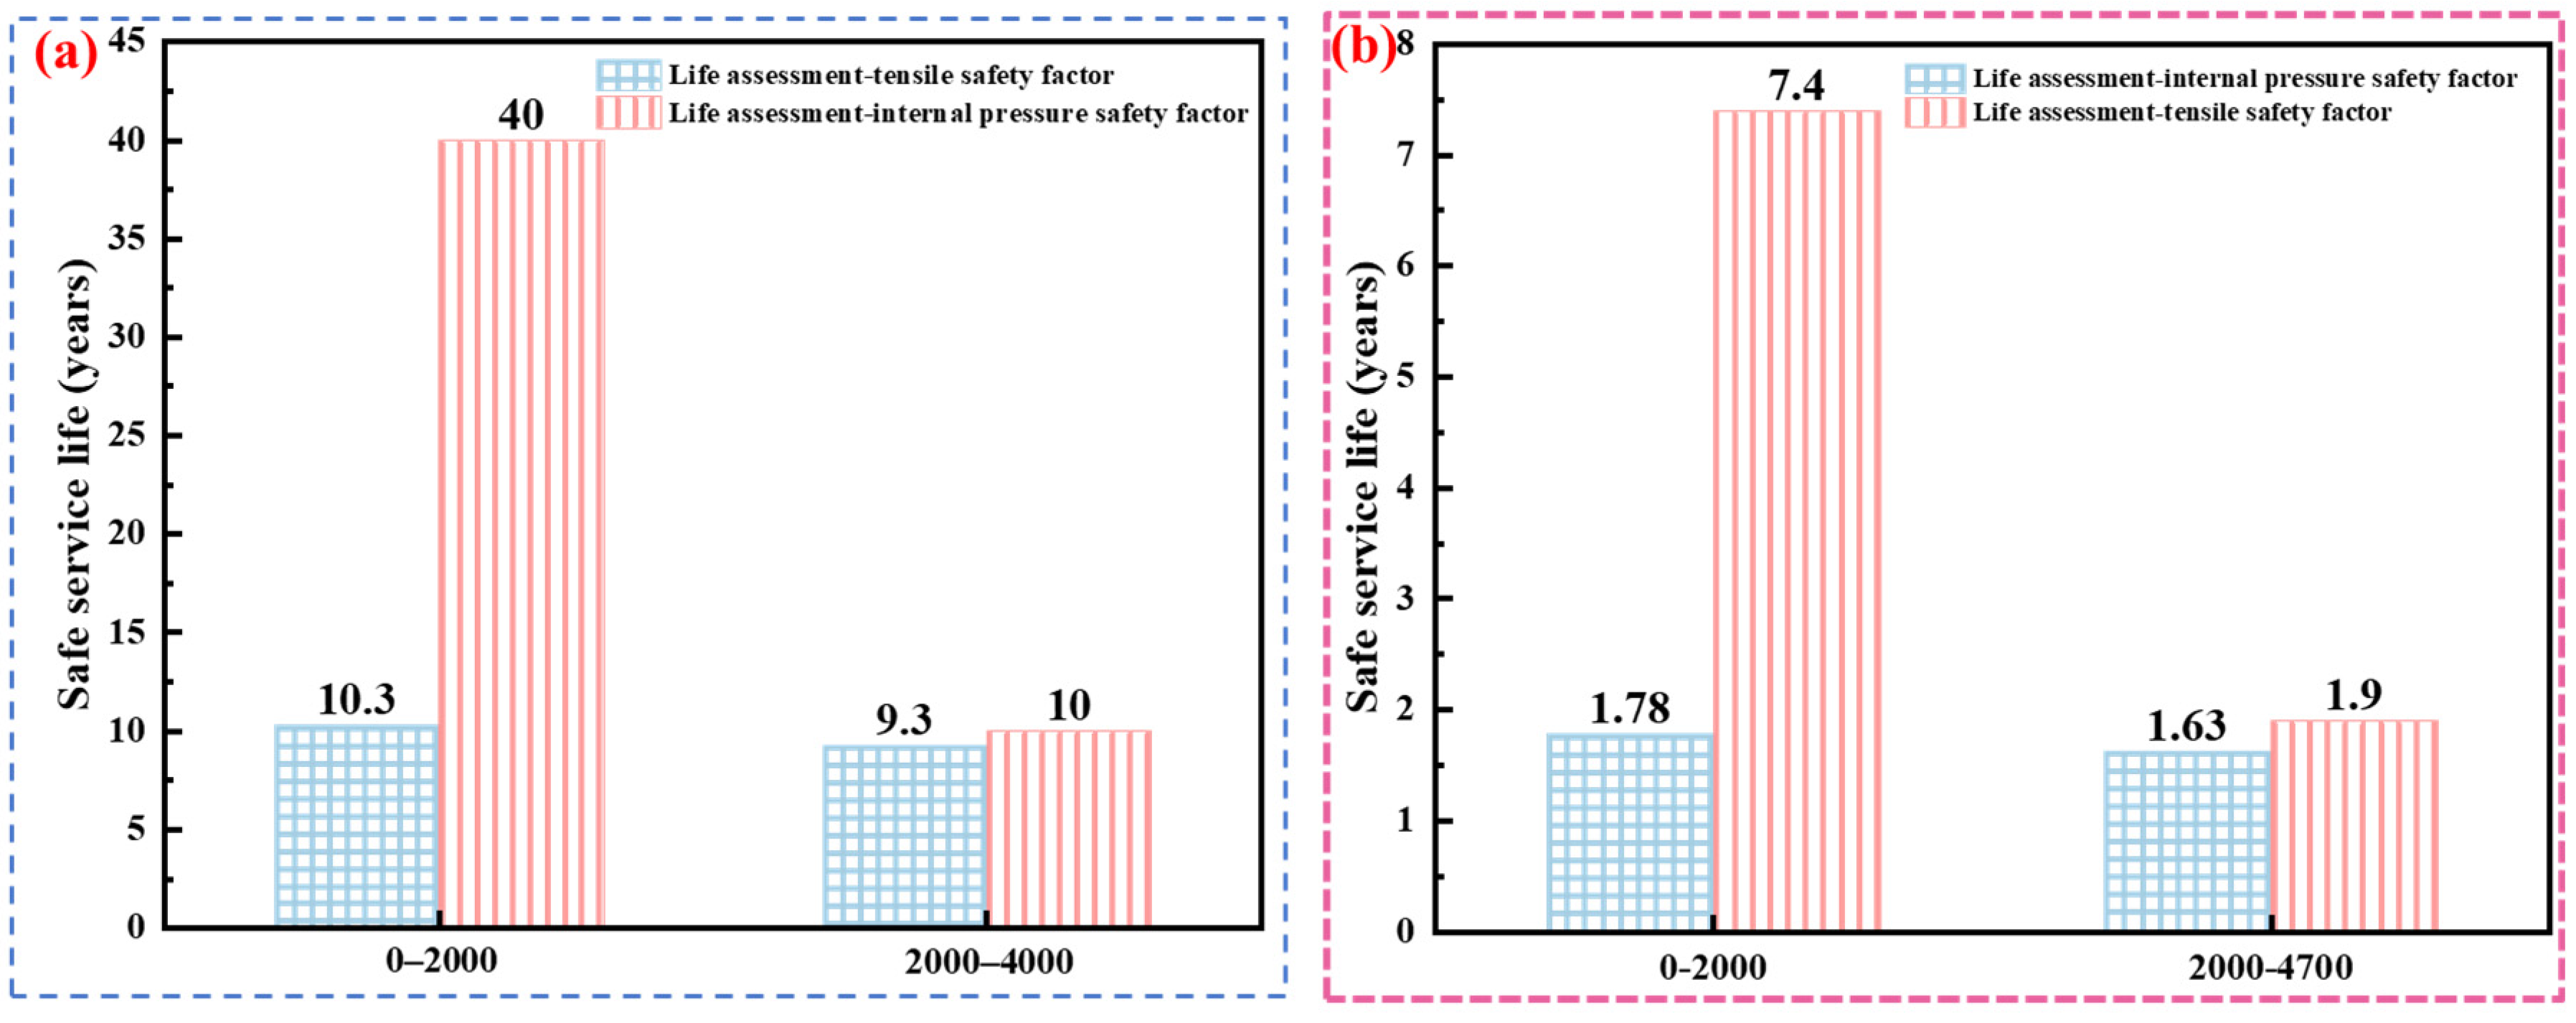
3.3.1. Service Life of Tubing Considering Uniform Corrosion
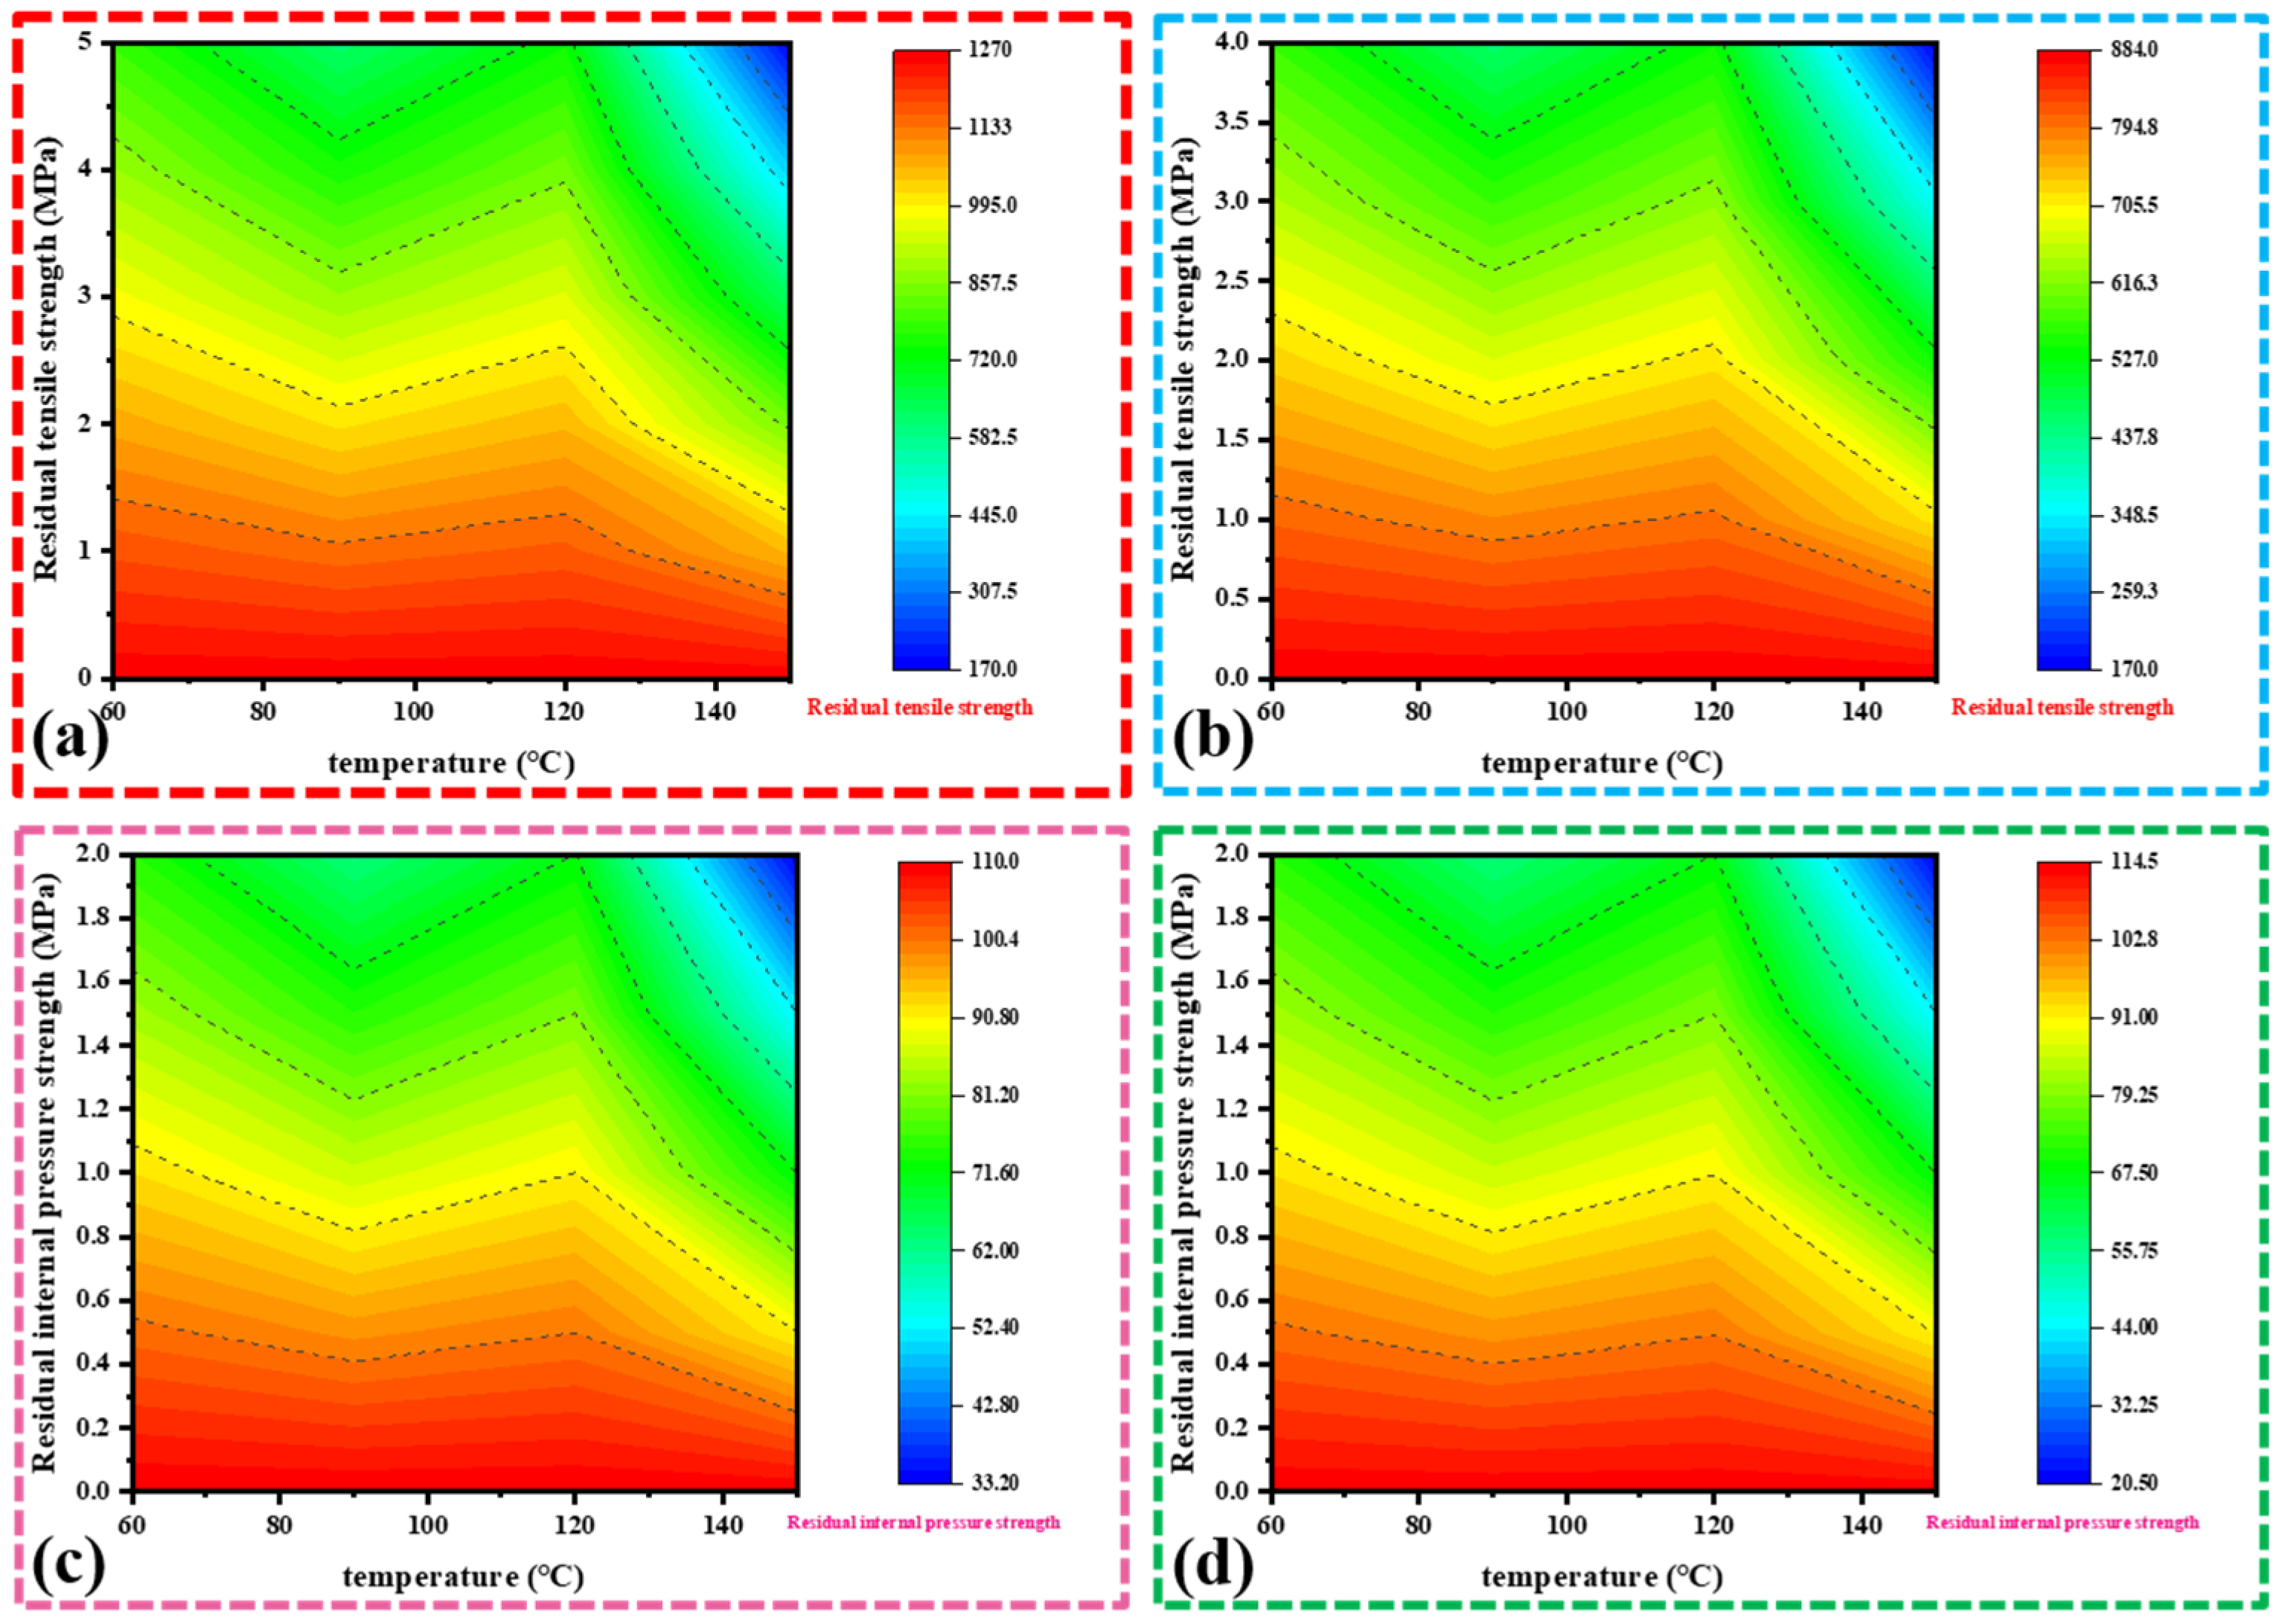
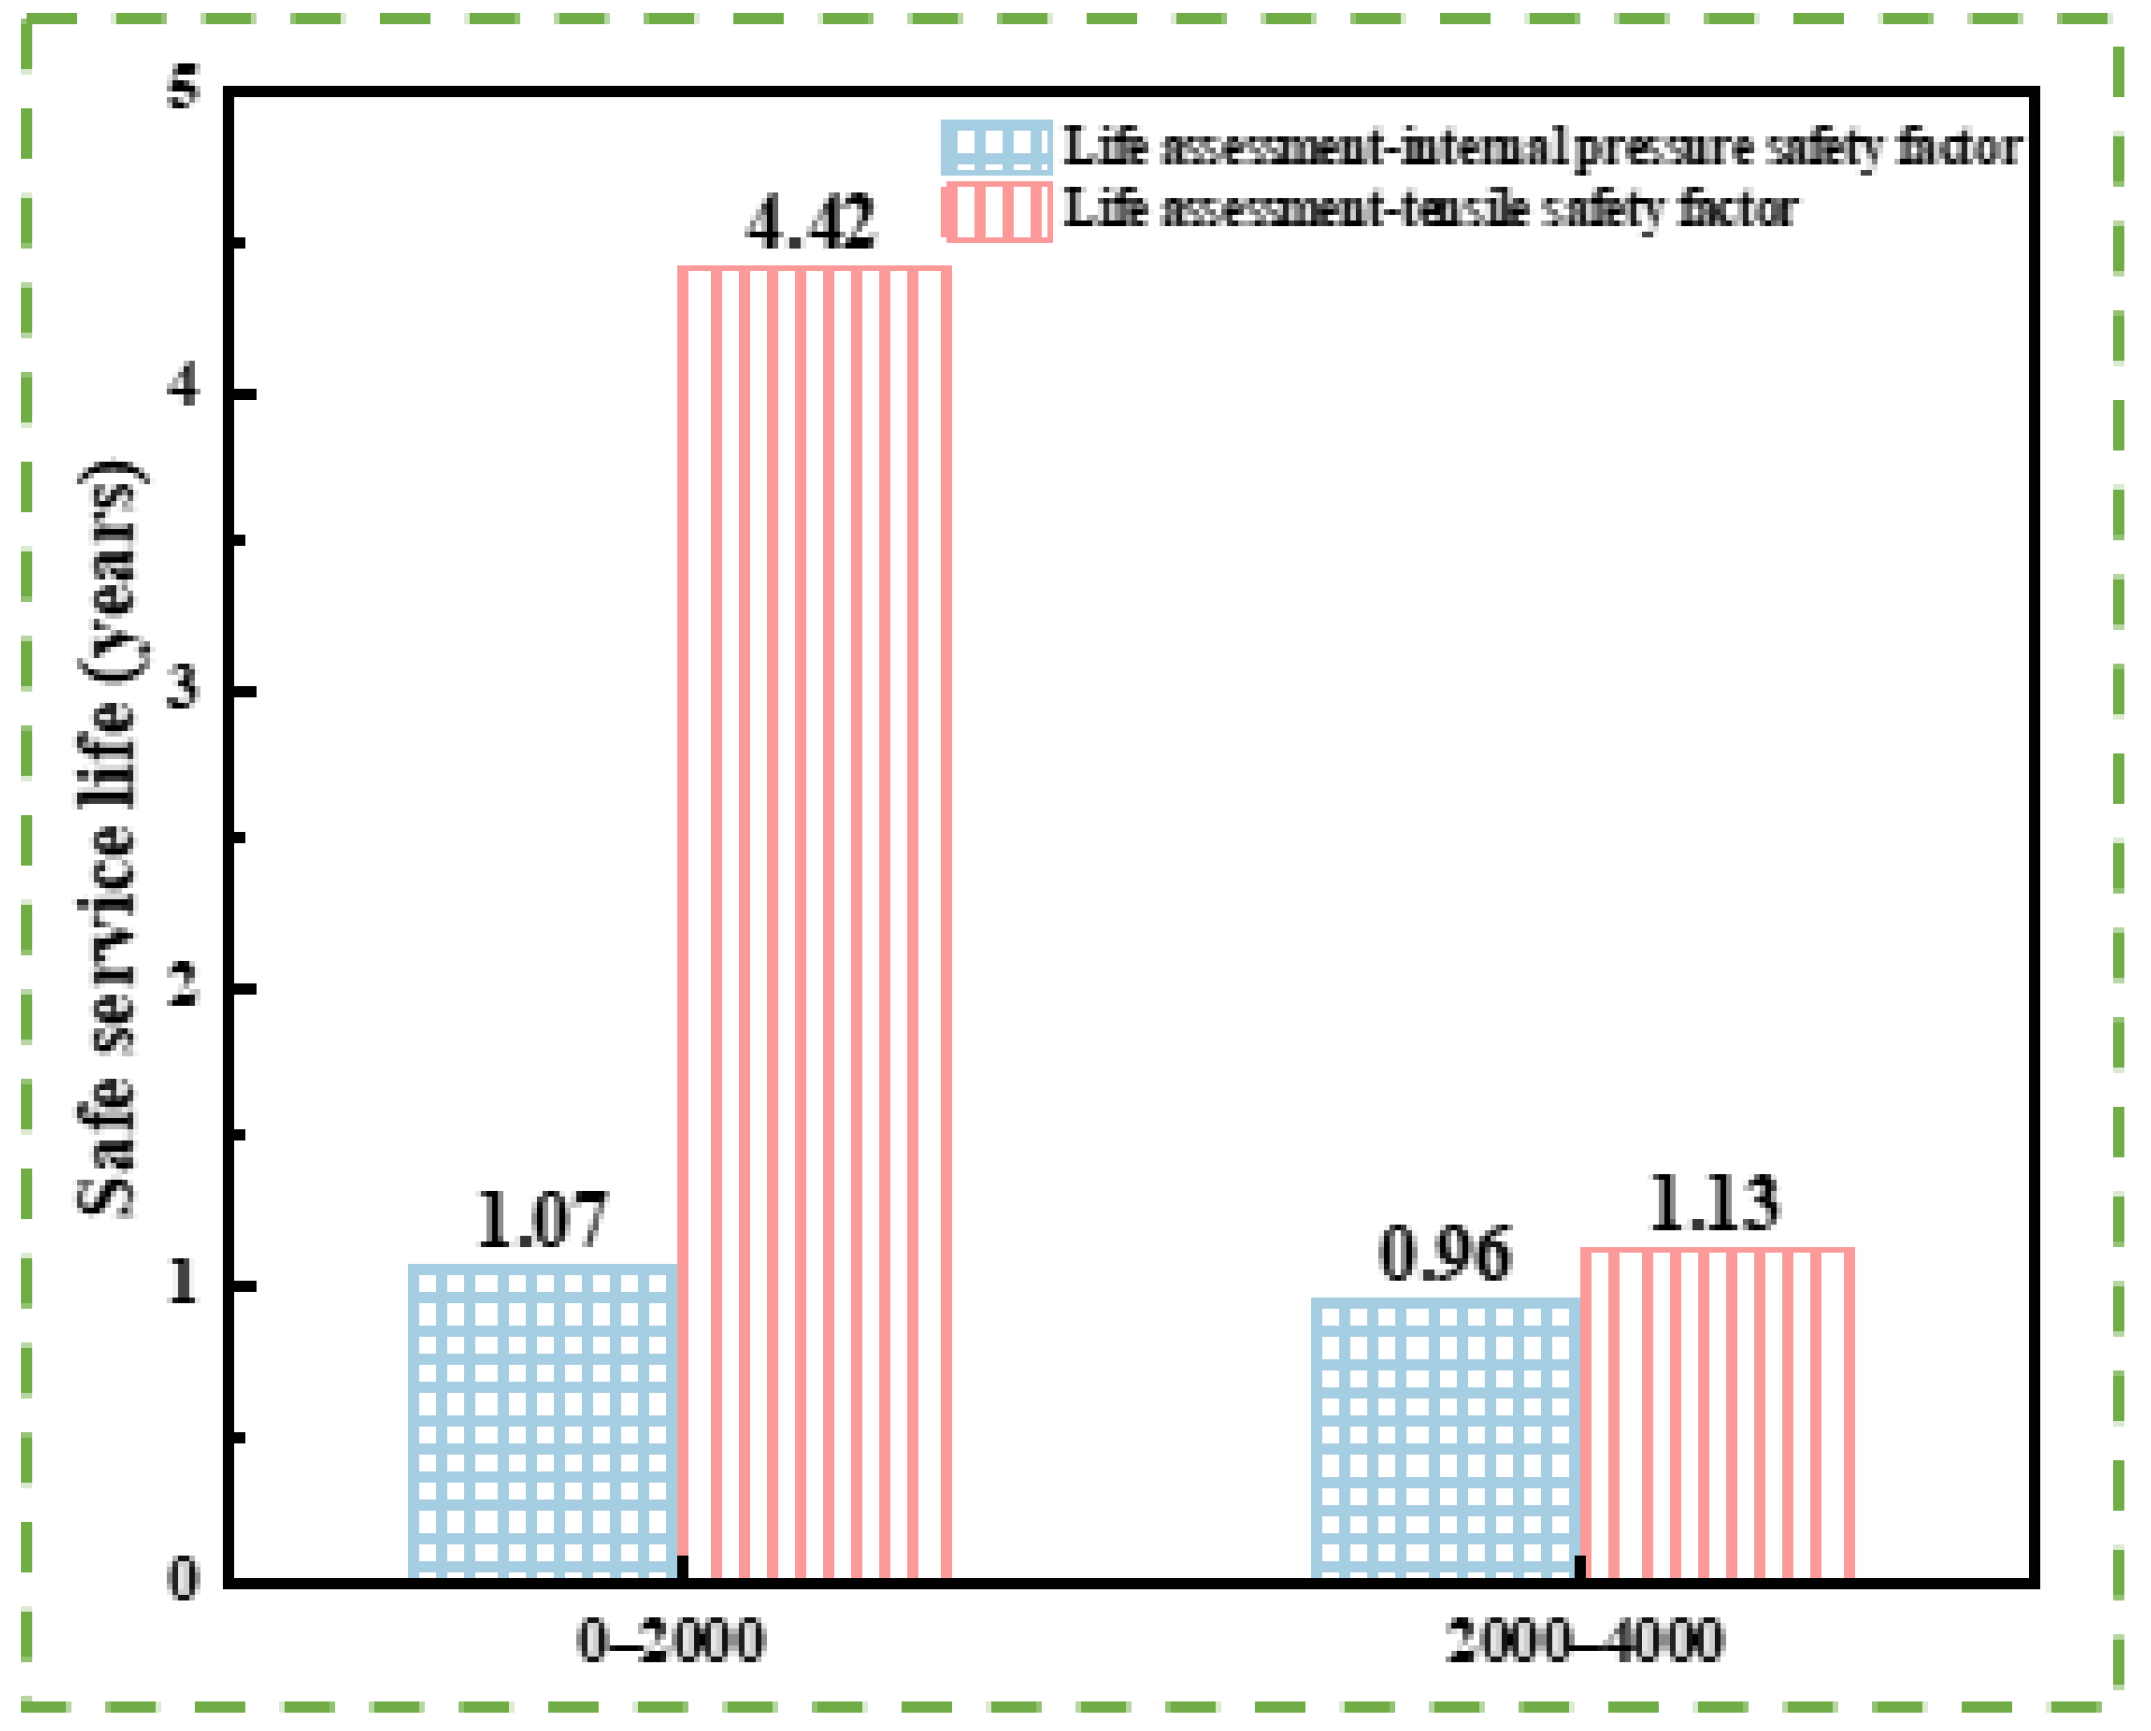
3.3.2. Service Life of Tubing Considering Pitting Corrosion
4. Discussion
4.1. Pitting Corrosion of T95 Steel in Liquid Phase
4.2. Economic Cost Calculation of Tubing Made of Carbon Steel and Alloy Steel
4.3. New Design Scheme of Downhole String
5. Conclusions
- (1)
- 35CrMo steel is used for wellhead materials, 625 alloy steel is selected as the sealing surface, and 625 or 825 alloy steel is used for wellhead sealing material. 718 nickel base alloy is selected as packer steel.
- (2)
- Its cost is significantly lower than that of G3 steel when T95 steel, as the tubing is serviced for 10 and 20 years. Its cost is nearly close to G3 alloy when it has been used for more than 30 years.
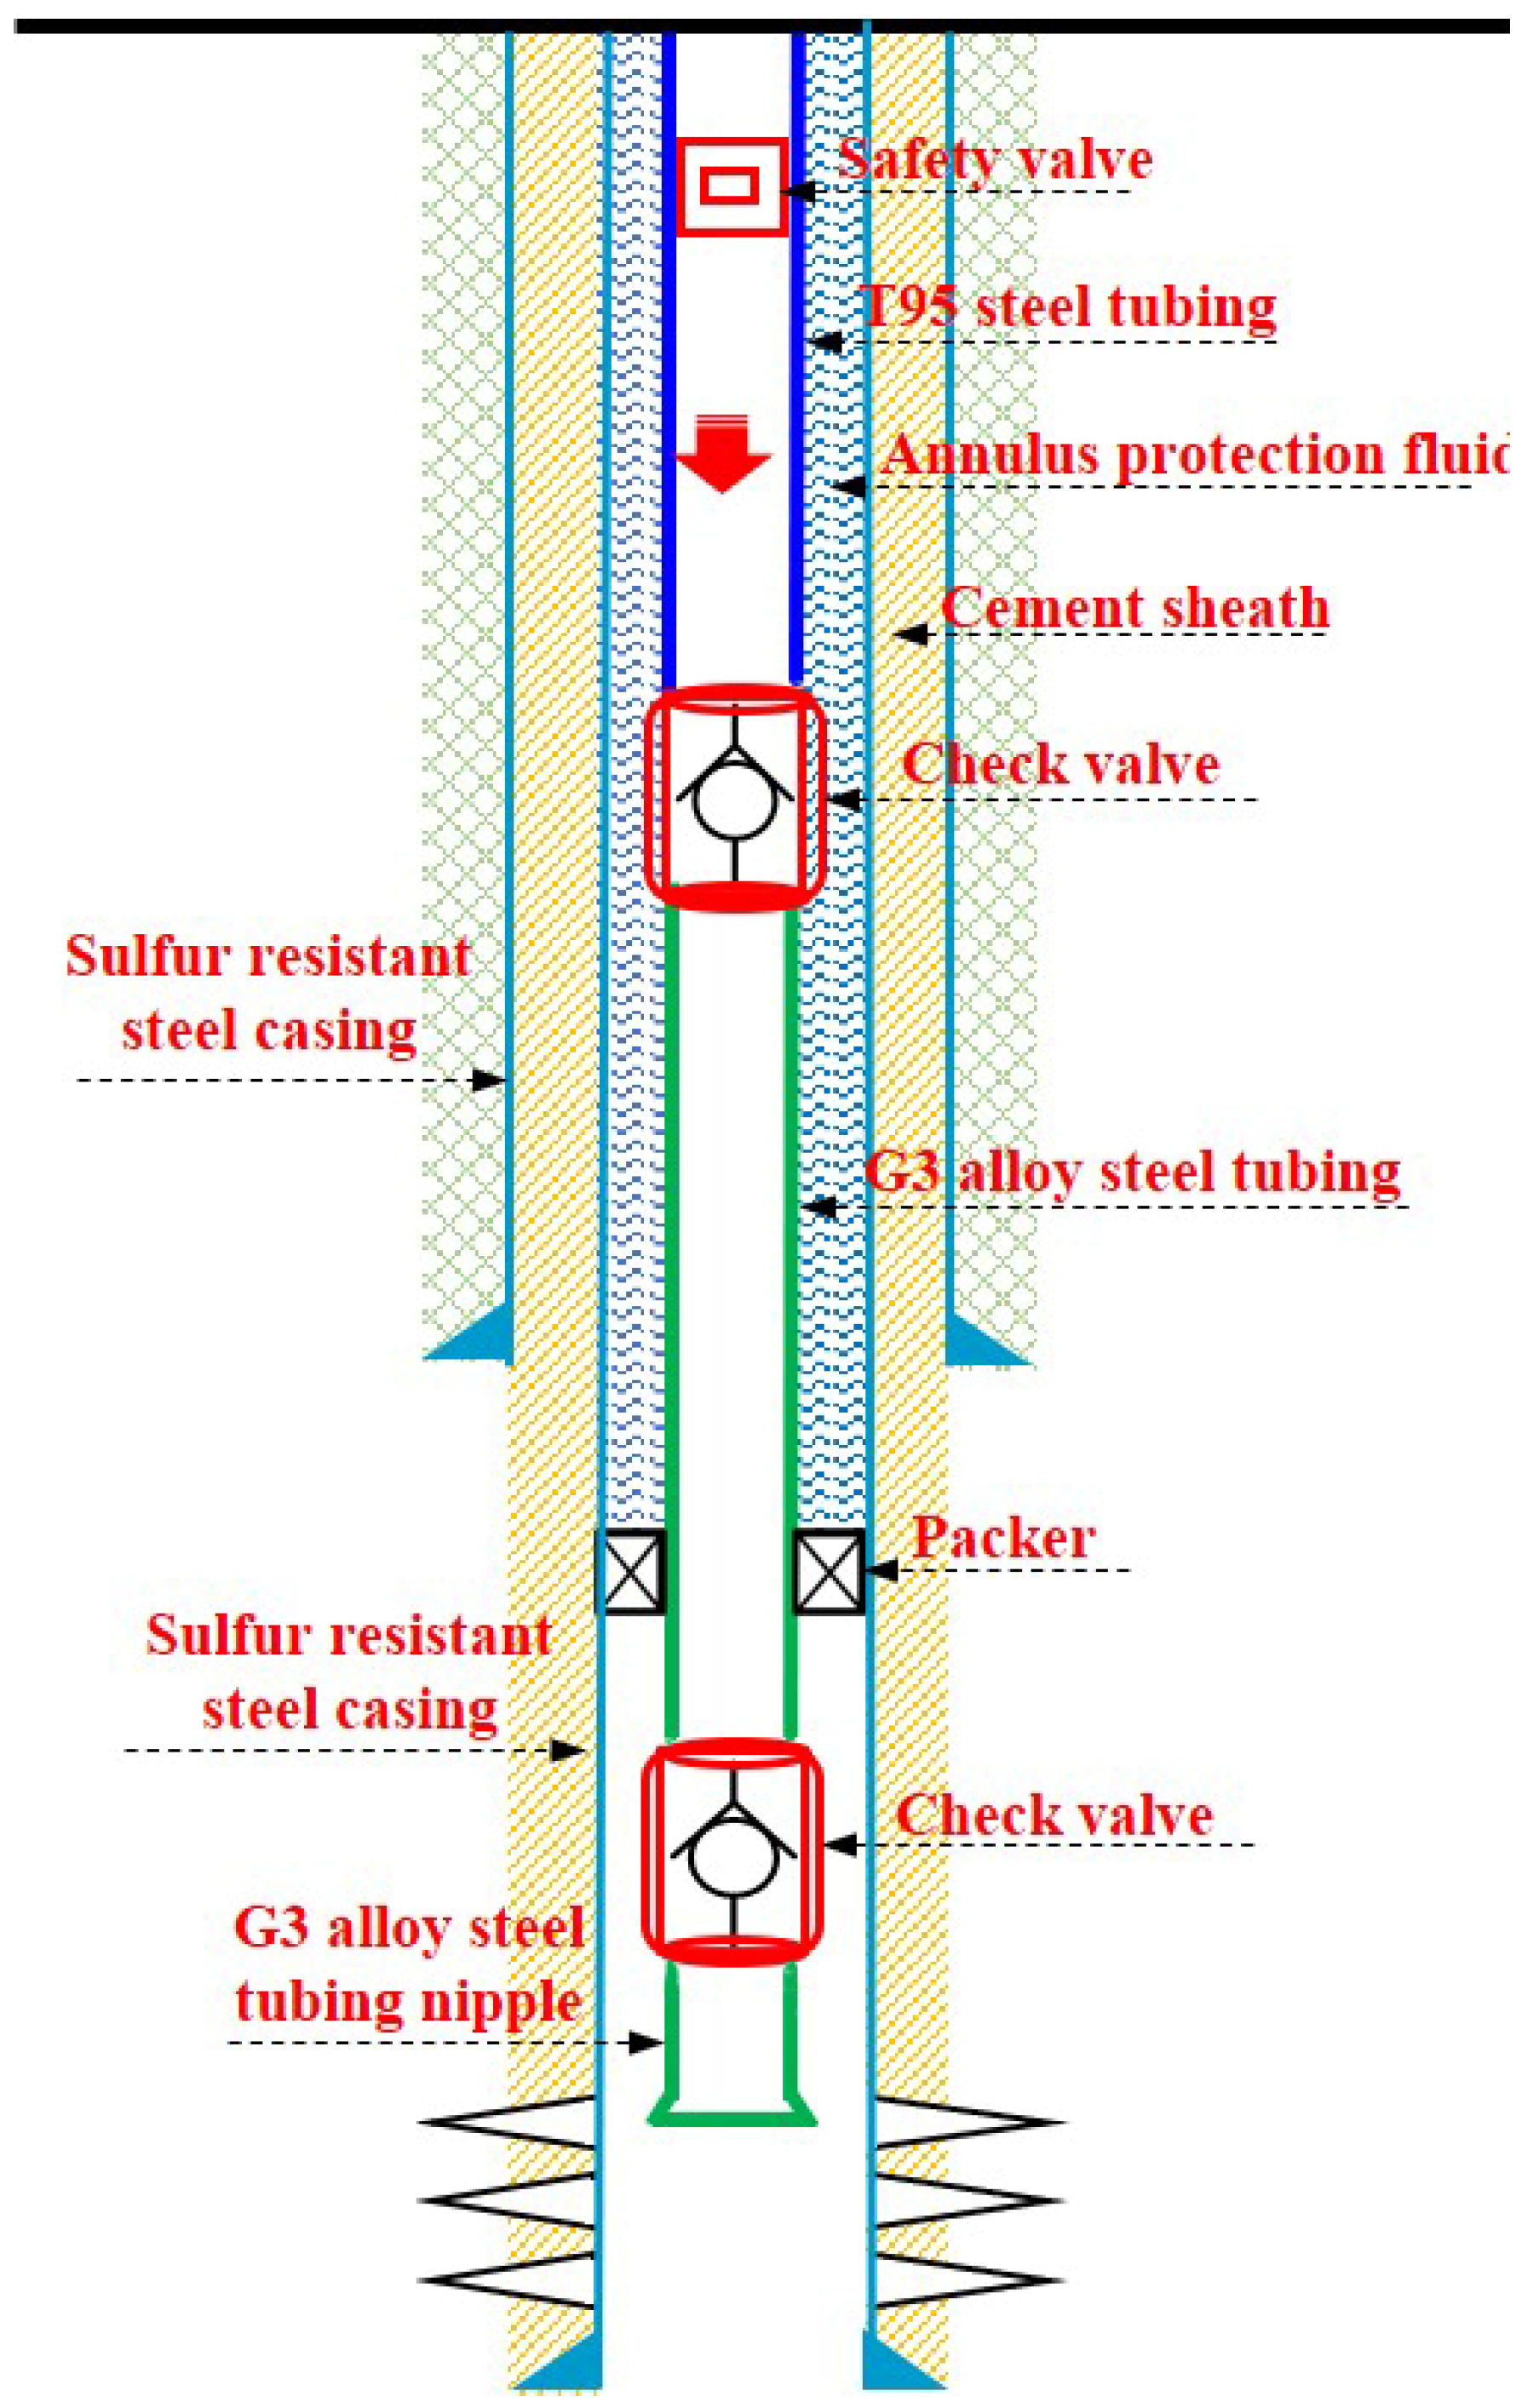
- (3)
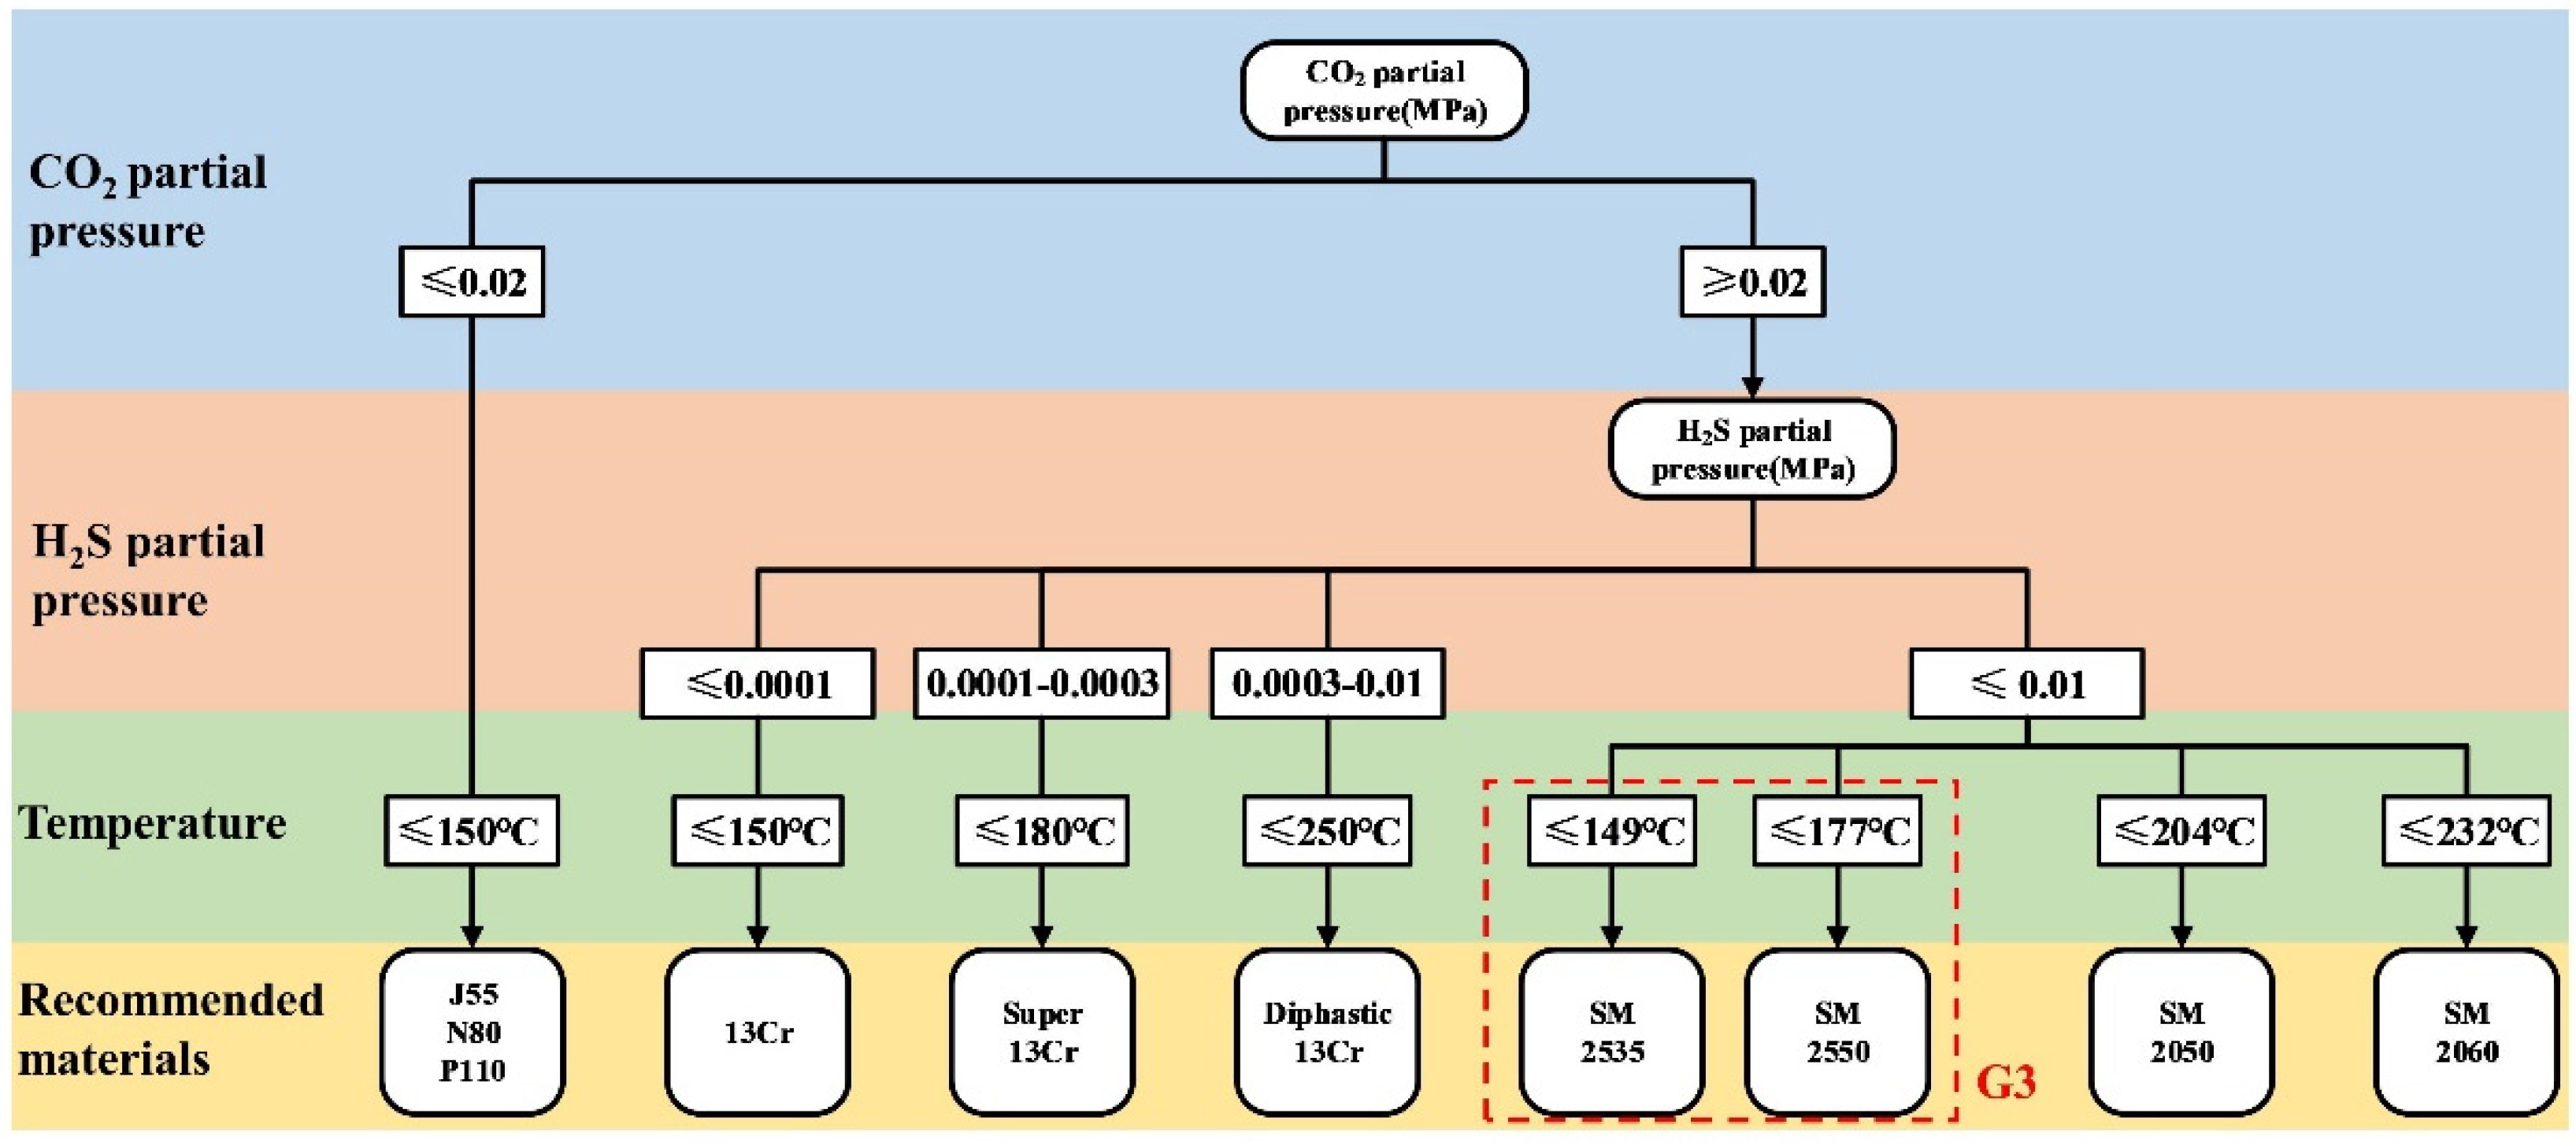
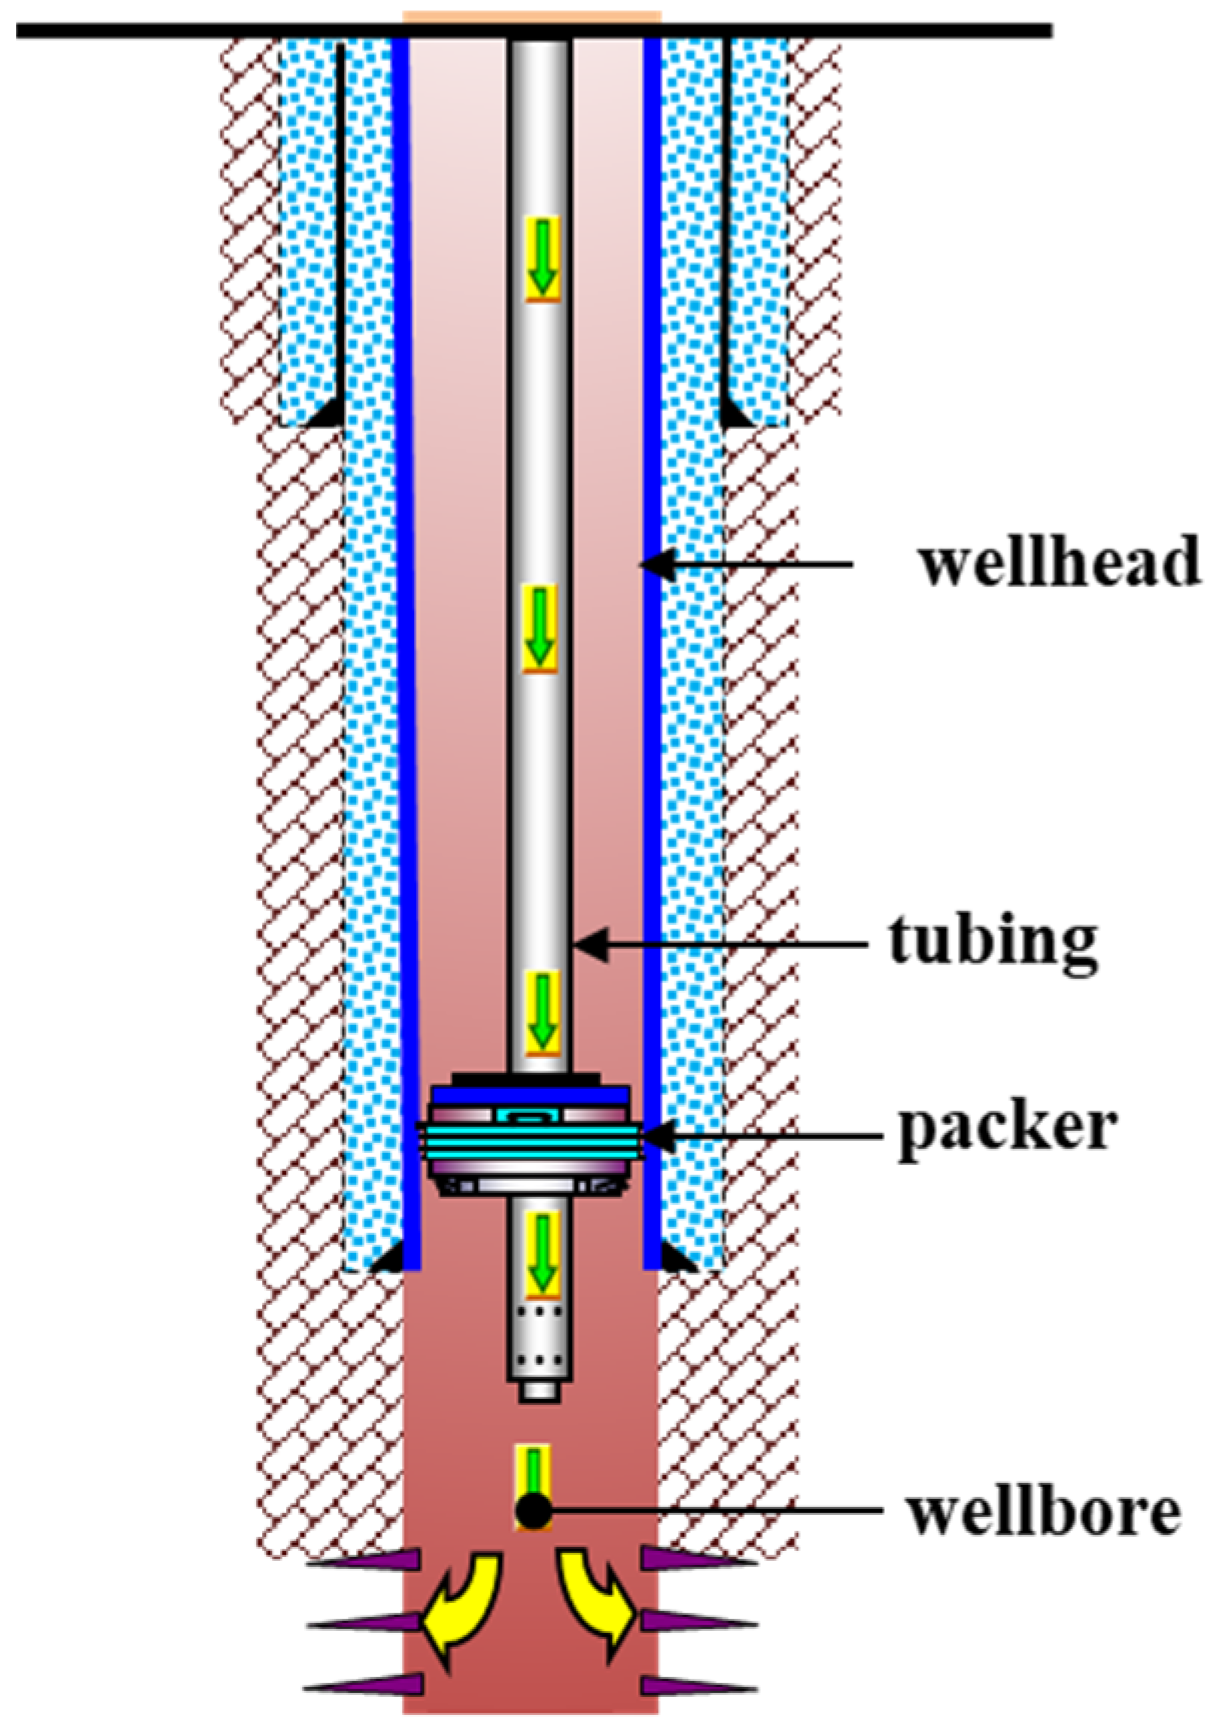
- A kind of downhole packer for acid gas reinjection is proposed, which has a double barrier to ensure the safety of wellbore gas injection. G3 alloy steel tubing is used between the packer and the relief valve, T95 steel tubing is selected above the packer and below the safety valve, and the packer is set in the G3 steel tubing.
- (4)
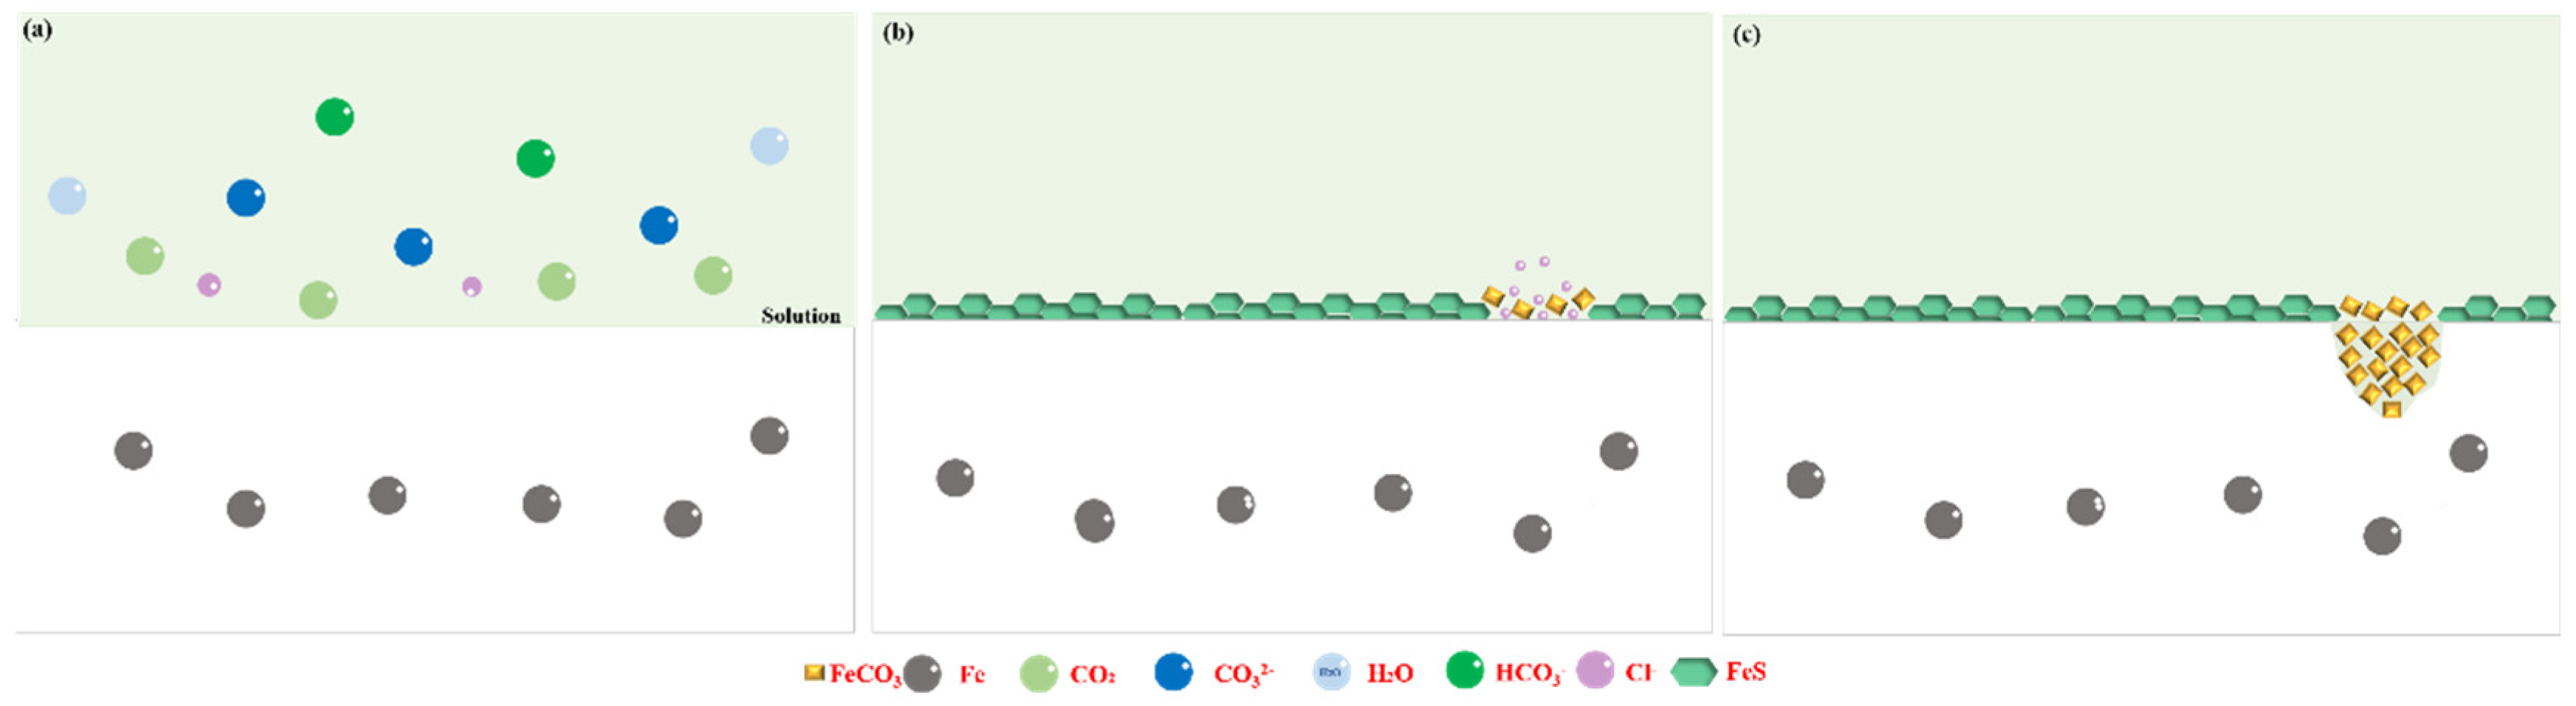
- FeS is deposited on most of the steel surface, while FeCO3 is only deposited on some parts of the steel surface. Chloride ion easily passes through the loose FeCO3 films while is blocked by the dense FeS films.
Author Contributions
Funding
Conflicts of Interest
References
- Xiang, Y.; Xie, W.; Ni, S.; He, X. Comparative study of A106 steel corrosion in fresh and dirty MEA solutions during the CO2 capture process: Effect of NO3−. Corros. Sci. 2020, 167, 108521. [Google Scholar] [CrossRef]
- Sun, C.; Sun, J.; Wang, Y.; Lin, X.; Li, X.; Cheng, X.; Liu, H. Synergistic effect of O2, H2S and SO2 impurities on the corrosion behavior of X65 steel in water-saturated supercritical CO2 system. Corros. Sci. 2016, 107, 193–203. [Google Scholar] [CrossRef]
- Yue, X.; Zhang, L.; Sun, C.; Xu, S.; Wang, C.; Lu, M.; Neville, A.; Hua, Y. A thermodynamic and kinetic study of the formation and evolution of corrosion product scales on 13Cr stainless steel in a geothermal environment. Corros. Sci. 2020, 169, 108640. [Google Scholar] [CrossRef]
- Hoa, L.Q.; Bäßler, R.; Bettge, D.; Buggisch, E.; Schiller, B.N.; Beck, M. Corrosion Study on Wellbore Materials for the CO2 Injection Process. Processes 2021, 9, 115. [Google Scholar] [CrossRef]
- Dong, B.; Zeng, D.; Yu, Z.; Zhang, H.; Yu, H.; Tian, G.; Yi, Y. Role of polyacrylamide concentration on corrosion behavior of N80 steel in the HPAM/H2S/CO2 environment. Mater. Corros. 2020, 71, 526–536. [Google Scholar] [CrossRef]
- Pessu, F.; Barker, R.; Neville, A. Pitting and uniform corrosion of X65 carbon steel in sour corrosion environments: The influence of CO2, H2S, and temperature. Corrosion 2017, 73, 1168–1183. [Google Scholar] [CrossRef] [PubMed]
- Zeng, D.; Dong, B.; Qi, Y.; Yu, Z.; Wang, J.; Huang, X.; Liu, X.; Liu, Y. On how CO2 partial pressure on corrosion of HNBR rubber O-ring in CO2–H2S–CH4 environment. Int. J. Hydrog. Energy 2021, 46, 8300–8316. [Google Scholar] [CrossRef]
- Sun, C.; Sun, J.; Liu, S.; Wang, Y. Effect of water content on the corrosion behavior of X65 pipeline steel in supercritical CO2-H2O-O2-H2S-SO2 environment as relevant to CCS application. Corros. Sci. 2018, 137, 151–162. [Google Scholar] [CrossRef]
- Yue, X.; Zhang, L.; Ma, L.; Lu, M.; Neville, A.; Hua, Y. Influence of a small velocity variation on the evolution of the corrosion products and corrosion behaviour of super 13Cr SS in a geothermal CO2 containing environment. Corros. Sci. 2021, 178, 108983. [Google Scholar] [CrossRef]
- Pessu, F.; Barker, R.; Neville, A. CO2 Corrosion of Carbon Steel: The Synergy of Chloride Ion Concentration and Temperature on Metal Penetration. Corrosion 2020, 76. [Google Scholar] [CrossRef]
- Rizzo, R.; Baier, S.; Rogowska, M.; Ambat, R. An electrochemical and X-ray computed tomography investigation of the effect of temperature on CO2 corrosion of 1Cr carbon steel. Corros. Sci. 2020, 166, 108471. [Google Scholar] [CrossRef]
- Gao, S.; Brown, B.; Young, D.; Nesic, S.; Singer, M. Formation Mechanisms of Iron Oxide and Iron Sulfide at High Temperature in Aqueous H2S Corrosion Environment. J. Electrochem. Soc. 2018, 165, C171–C179. [Google Scholar] [CrossRef] [Green Version]
- Liu, Z.; Gao, X.; Du, L.; Li, J.; Li, P.; Yu, C.; Misra, R.; Wang, Y. Comparison of corrosion behaviour of low-alloy pipeline steel exposed to H2S/CO2-saturated brine and vapour-saturated H2S/CO2 environments. Electrochim. Acta 2017, 232, 528–541. [Google Scholar] [CrossRef]
- Abadeh, H.K.; Javidi, M. Assessment and influence of temperature, NaCl and H2S on CO2 corrosion behavior of different microstructures of API 5L X52 carbon steel in aqueous environments. J. Nat. Gas Sci. Eng. 2019, 67, 93–107. [Google Scholar] [CrossRef]
- Elgaddafi, R.; Ahmed, R.; Shah, S. Modeling and experimental studies on CO2-H2S corrosion of API carbon steels under high-pressure. J. Pet. Sci. Eng. 2017, 156, 682–696. [Google Scholar] [CrossRef]
- Santos, B.; Serenario, M.; Souza, R.; Oliveira, J.R.; Vaz, G.L.; Gomes, J.A.C.P.; Bueno, A.H. The electrolyte renewal effect on the corrosion mechanisms of API X65 carbon steel under sweet and sour environments. J. Pet. Sci. Eng. 2021, 199, 108347. [Google Scholar] [CrossRef]
- Souza, R.; Santos, B.A.F.; Gonçalves, M.; Júnior, E.M.; Simões, T.; Oliveira, J.; Vaz, G.; Caldeira, L.; Gomes, J.; Bueno, A. The role of temperature and H2S (thiosulfate) on the corrosion products of API X65 carbon steel exposed to sweet environment. J. Pet. Sci. Eng. 2019, 180, 78–88. [Google Scholar] [CrossRef]
- Dong, B.; Liu, W.; Zhang, Y.; Banthukul, W.; Zhao, Y.; Zhang, T.; Fan, Y.; Li, X. Comparison of the characteristics of corrosion scales covering 3Cr steel and X60 steel in CO2-H2S coexistence environment. J. Nat. Gas Sci. Eng. 2020, 80, 103371. [Google Scholar] [CrossRef]
- Dong, B.; Zeng, D.; Yu, Z.; Cai, L.; Yu, H.; Shi, S.; Tian, G.; Yi, Y. Major corrosion influence factors analysis in the production well of CO2 flooding and the optimization of relative anti-corrosion measures. J. Pet. Sci. Eng. 2021, 200, 108052. [Google Scholar] [CrossRef]
- Zeng, D.; Dong, B.; Zeng, F.; Yu, Z.; Zeng, W.; Guo, Y.; Peng, Z.; Tao, Y. Analysis of corrosion failure and materials selection for CO2–H2S gas well. J. Nat. Gas Sci. Eng. 2021, 86, 103734. [Google Scholar] [CrossRef]
- Zhang, H.-H.; Gao, K.; Yan, L.; Pang, X. Inhibition of the corrosion of X70 and Q235 steel in CO2—Saturated brine by imidazoline-based inhibitor. J. Electroanal. Chem. 2017, 791, 83–94. [Google Scholar] [CrossRef]
- Sun, C.; Zeng, H.; Luo, J.L. Unraveling the effects of CO2 and H2S on the corrosion behavior of electroless Ni-P coating in CO2/H2S/Cl– environments at high temperature and high pressure. Corros. Sci. 2019, 148, 317–330. [Google Scholar] [CrossRef]
- Abdulazeez, I.; Al- Hamouz, O.C.S.; Khaled, M.; Al-Saadi, A.A. Inhibition of mild steel corrosion in CO2 and H2S-saturated acidic media by a new polyurea-based material. Mater. Corros. 2020, 71, 646–662. [Google Scholar] [CrossRef]
- Zhang, H.-H.; Pang, X.; Zhou, M.; Liu, C.; Wei, L.; Gao, K. The behavior of pre-corrosion effect on the performance of imidazoline-based inhibitor in 3 wt.% NaCl solution saturated with CO2. Appl. Surf. Sci. 2015, 356, 63–72. [Google Scholar] [CrossRef]
- Zhang, C.; Zhao, J. Synergistic inhibition effects of octadecylamine and tetradecyl trimethyl ammonium bromide on carbon steel corrosion in the H2S and CO2 brine solution. Corros. Sci. 2017, 126, 247–254. [Google Scholar] [CrossRef]
- Choi, Y.S.; Hassani, S.; Thanh, V.U.; Nesic, S.; Abas, A.Z.; Nor, A.M. Strategies for Corrosion Inhibition of Carbon Steel Pipelines under Supercritical CO2/H2S Environments. Corrosion 2019, 75, 1156–1172. [Google Scholar] [CrossRef]
- Xu, L.; Xu, X.; Yin, C.; Qiao, L. CO2 corrosion behavior of 1% Cr–13% Cr steel in relation to Cr content changes. Mater. Res. Express 2019, 6, 096512. [Google Scholar] [CrossRef]
- Hu, J.; Xiong, Q.; Chen, L.; Zhang, C.; Zheng, Z.; Geng, S.; Yang, Z.; Zhong, X. Corrosion inhibitor in CO2-O2-containing environment: Inhibition effect and mechanisms of Bis(2-ehylhexyl) phosphate for the corrosion of carbon steel. Corros. Sci. 2021, 179, 109173. [Google Scholar] [CrossRef]
- Xiang, Y.; Song, C.; Li, C.; Yao, E.; Yan, W. Characterization of 13Cr steel corrosion in simulated EOR-CCUS environment with flue gas impurities. Process Saf. Environ. Prot. 2020, 140, 124–136. [Google Scholar] [CrossRef]
- Wei, L.; Gao, K.; Li, Q. Corrosion of low alloy steel containing 0.5% chromium in supercritical CO2-saturated brine and water-saturated supercritical CO2 environments. Appl. Surf. Sci. 2018, 440, 524–534. [Google Scholar] [CrossRef]
- ISO 10423-2009 Standard; Petroleum and Natural Gas Industries—Drilling and Production Equipment—Wellhead and Christmas Tree Equipment. International Organization for Standardization: Geneva, Switzerland, 2009.
- Q/SH 0015-2006 Standard; The Choice Technical Requirements for Casing and Tubing Pipes in Gas Wells Including Hydrogen Sulfide and Carbon Dioxide. China Petroleum and Chemical Corporation: Beijing, China, 2006.
- Zhi, Z.; Li, J.; Zheng, Y.; Zhang, C.; Zhang, Q.; Zeng, D.; Zhong, X. Finite service life evaluation method of production casing for sour-gas wells. J. Pet. Sci. Eng. 2018, 165, 171–180. [Google Scholar] [CrossRef]
- Zeng, D.; Yu, Z.; Dong, B.; Zhang, H.; Yu, H.; Tian, G.; Yi, Y. Investigation of service life and corrosion mechanism of tubing in production well on polymer flooding. Corros. Eng. Sci. Technol. 2020, 55, 634–644. [Google Scholar] [CrossRef]
- Li, Y.; Zhu, G.; Hou, B.; Zhang, Q.; Zhang, G. A numerical model based on finite element method for predicting the corrosion of carbon steel under supercritical CO2 conditions. Process Saf. Environ. Prot. 2021, 149, 866–884. [Google Scholar] [CrossRef]
- Sun, C.; Sun, J.; Luo, J.-L. Unlocking the impurity-induced pipeline corrosion based on phase behavior of impure CO2 streams. Corros. Sci. 2020, 165, 108367. [Google Scholar] [CrossRef]
- Elgaddafi, R.; Ahmed, R.; Shah, S. Corrosion of carbon steel in CO2 saturated brine at elevated temperatures. J. Pet. Sci. Eng. 2021, 196, 107638. [Google Scholar] [CrossRef]
- Zhao, Y.; Hua, Y.; Liu, B.; Li, X.; Xie, J.; Zeng, G.; Zhang, T.; Wang, F. The development of a mechanistic-chemometrics model with multi-degree of freedom for pitting corrosion of HP-13Cr stainless steel under extremely oilfield environments. Corros. Sci. 2021, 181, 109237. [Google Scholar] [CrossRef]
- Wei, L.; Pang, X.; Gao, K. Effect of small amount of H2S on the corrosion behavior of carbon steel in the dynamic supercritical CO2 environments. Corros. Sci. 2016, 103, 132–144. [Google Scholar] [CrossRef]
- Abdar, P.S.; Hariri, M.B.; Kahyarian, A.; Nesic, S. A revision of mechanistic modeling of mild steel corrosion in H2S environments. Electrochim. Acta 2021, 382, 138231. [Google Scholar] [CrossRef]
- Kahyarian, A.; Nesic, S. On the mechanism of carbon dioxide corrosion of mild steel: Experimental investigation and mathematical modeling at elevated pressures and non-ideal solutions. Corros. Sci. 2020, 173, 108719. [Google Scholar] [CrossRef]
- Dong, B.; Liu, W.; Chen, L.; Zhang, T.; Fan, Y.; Zhao, Y.; Li, H.; Yang, W.; Sun, Y. Unraveling the effect of chloride ion on the corrosion product film of Cr-Ni-containing steel in tropical marine atmospheric environment. Corros. Sci. 2022, 209, 110741. [Google Scholar] [CrossRef]


| Total Pressure | Phase | Temperature | CO2 Content | H2S Content | Materials | |
|---|---|---|---|---|---|---|
| wellhead | 24 MPa | liquid | 30 | 55% | 45% | 35CrMo, 825, 718, 625 |
| gas | ||||||
| wellbore | 55 MPa | liquid | 60, 90,120, 150 | 55% | 45% | T95, G3 |
| gas | ||||||
| packer | 55 MPa | liquid | 90 | 55% | 45% | 35CrMo, 718 |
| gas |
| Steel | C | Si | Mn | P | S | Cr | Mo | Ni | Ti | V | Al | Fe | |
|---|---|---|---|---|---|---|---|---|---|---|---|---|---|
| Wellbore or Packer | 35CrMo | 0.35 | 0.22 | 0.50 | 0.02 | 0.03 | 0.85 | 0.2 | 0.2 | - | - | - | Bal. |
| 825 | 0.02 | 0.10 | 0.51 | - | - | 21.75 | 3.25 | 41.94 | 2.07 | - | 0.18 | Bal. | |
| 718 | 0.033 | 0.14 | 0.065 | 0.0024 | 0.0006 | 18.96 | 3.28 | Bal. | - | - | - | 18.67 | |
| 625 | |||||||||||||
| Tubing | T95 | 0.30 | 0.22 | 0.52 | 0.01 | 0.01 | 0.99 | 0.17 | 0.01 | 0.02 | 0.007 | 0.22 | Bal. |
| G3 | 0.02 | 1 | - | 0.04 | 0.03 | 22 | 7 | Bal. | - | - | 0.20 | 20 |
| Well Section | Tubing Size |
|---|---|
| 0 m~2000 m | φ 88.9 mm × 7.8 mm |
| 2000 m~4700 m | φ 73 mm × 5.5 mm |
| Materials | P (Ton/Ten Thousand Yuan) | M (Ton) | Pt (Ten Thousand Yuan) |
|---|---|---|---|
| T95 | 1.127 | 56.06 | 63.16 |
| G3 | 0.78 | 59.04 | 1771.2 |
| Materials | Pt | CL | Tubing Replacement Frequency | Total Costs | ||||
|---|---|---|---|---|---|---|---|---|
| 10 Year | 20 Year | 30 Year | 10 Year | 20 Year | 30 Year | |||
| T95 | 63.16 | 10 | 10 | 20 | 30 | 631.6 | 1263.2 | 1894.8 |
| G3 | 1771.2 | 10 | 1 | 2 | 4 | 1771.2 | 1771.2 | 1771.2 |
Publisher’s Note: MDPI stays neutral with regard to jurisdictional claims in published maps and institutional affiliations. |
© 2022 by the authors. Licensee MDPI, Basel, Switzerland. This article is an open access article distributed under the terms and conditions of the Creative Commons Attribution (CC BY) license (https://creativecommons.org/licenses/by/4.0/).
Share and Cite
Geng, Y.; Liu, Z.; Zeng, W.; Feng, Y.; Ding, B.; Li, W.; Wang, Q. How to Choose the Suitable Steel of Wellhead, Wellbore, and Downhole Tools for Acid Gas Reinjection Flooding. Processes 2022, 10, 2685. https://doi.org/10.3390/pr10122685
Geng Y, Liu Z, Zeng W, Feng Y, Ding B, Li W, Wang Q. How to Choose the Suitable Steel of Wellhead, Wellbore, and Downhole Tools for Acid Gas Reinjection Flooding. Processes. 2022; 10(12):2685. https://doi.org/10.3390/pr10122685
Chicago/Turabian StyleGeng, Yudi, Zhendong Liu, Wenguang Zeng, Yibo Feng, Baodong Ding, Wenxia Li, and Qinying Wang. 2022. "How to Choose the Suitable Steel of Wellhead, Wellbore, and Downhole Tools for Acid Gas Reinjection Flooding" Processes 10, no. 12: 2685. https://doi.org/10.3390/pr10122685