Article

Ecological Environmental Effects and Their Driving Factors of Land Use/Cover Change: The Case Study of Baiyangdian Basin, China

1
School of Economics, Hebei University, Baoding 071000, China
2
Research Center for Resource Utilization and Environmental Protection, Hebei University, Baoding 071000, China
*
Authors to whom correspondence should be addressed.
Processes 2022, 10(12), 2648; https://doi.org/10.3390/pr10122648
Submission received: 5 November 2022 / Revised: 27 November 2022 / Accepted: 6 December 2022 / Published: 8 December 2022
(This article belongs to the Special Issue Sanitary and Environmental Engineering: Relevance and Concerns)

Abstract

:
Due to the combined effects of the natural environment, climate change and human activities, profound changes have occurred in terms of the eco-environmental effects of land use/cover change (LUCC) in the Baiyangdian basin. Therefore, based on land remote sensing monitoring data from 2000 to 2020, the Eco-environmental Quality Index (EQI) was introduced in this study to measure the eco-environmental effects of land use change in the Baiyangdian basin. Subsequently, the GeoDetector model was applied to detect the formation mechanism of the eco-environmental effects in the Baiyangdian basin from 2000 to 2020. The results of the study showed that cropland, woodland and grassland were the most widely distributed land use types in the Baiyangdian basin. The area of cropland declined the most and was mostly converted to construction land. The EQI increased slightly during the study period. The eco-environment of the mountainous areas in the western part of the basin and in Baiyangdian Lake was better than that of other areas. Land use intensity had a significantly stronger influence on the quality of the eco-environment than other factors. The interaction between the influencing factors was mainly a non-linear enhancement and a two-factor enhancement, with non-linear enhancement dominating.

1. Introduction

Ecological and environmental problems are one of the most important global issues faced by mankind today. Natural disasters such as sea level rises [1] and extreme weather phenomena [2] caused by global ecological problems such as the greenhouse effect and the sharp decline in forest resources are seriously threatening the survival and development of mankind [3]. As the most prominent landscape marker of the Earth’s surface system, the study of land use/cover change (LUCC) is an important element of global climate and environmental research, which plays an important role in global environmental change [4]. Since 1992, LUCC has been the focus of global environmental change and sustainability research, such as that of the International Institute for Applied Systems Analysis (IIASA), the International Geosphere–Biosphere Program (IGBP) and the International Human Dimensions Program on Global Environmental Change (IHDP) [5,6]. Previous studies on LUCC have focused on the spatial and temporal patterns as well as the evolution of LUCC [7], the driving forces and driving mechanisms of LUCC [8], the modelling and sustainable use of LUCC [9] and the ecological and environmental effects of LUCC [10], the first three studies of which were relatively more mature. Research on the eco-environmental effects of LUCC and its formation mechanisms has received increasing attention in recent years due to the significant environmental impact of human activities, including land use, land development and economic growth [11].
An accurate understanding of the eco-environmental effects, processes and formation mechanisms of regional LUCC is an important way to improve the eco-environment of the region. By influencing the structure and function of natural elements such as soil, climate, hydrology and biodiversity through ecological processes including energy exchange, water cycling, soil erosion and accumulation, as well as crop production, LUCC ultimately results in changes in the environment and ecosystems [12,13,14]. In recent years, with the development of satellite remote sensing technology, breakthroughs have been made in the measurement methods and indicators of the eco-environmental effects of LUCC. The most obvious manifestation is that some new methods and indicators have been applied to the study of the eco-environmental effects of LUCC. For example, the normalized difference vegetation index (NDVI) [15,16], enhanced vegetation index (EVI) [17] and other indicators can be used to evaluate changes in regional eco-environments by monitoring the amount of vegetation. In addition, the use of LUCC data interpreted from remote sensing imagery to study the eco-environmental effects of LUCC has become a mainstream academic practice. The emergence of new indicators such as the ecosystem services value (ESV) [18], the new remote-sensing-based ecological index (RSEI) [19] and the eco-environmental quality index (EQI) [20] has largely filled the gap in academic research. Among them, EQI is widely used in ecological research because it can better reflect the relationship between land use and the ecological environment [21].
In recent years, studies on the eco-environmental effects of LUCC have been characterized by the following features. The focus of research has gradually expanded from the eco-environmental effects of single factors such as water bodies, forests and carbon to the overall eco-environmental effects of the region [22,23]; the study objects are mainly in cities, and most of the studies focus on the impact of urbanization or human activities on the regional eco-environment, ignoring natural factors as a prerequisite for the formation and evolution of the regional eco-environment [11,24]. In addition, ecological environmental change is the result of complex interactions between multiple factors, i.e., the interactions between drivers have a strong spatial heterogeneity on ecological environmental change, but previous studies have not provided a comprehensive explanation for this complex interaction [25]. The GeoDetector method is a spatial statistical method that can not only detect the explanatory power of the main driving factors but also express the interactions between different driving factors [26]. The method has a higher explanatory efficiency than other spatial heterogeneity detection tools [23] and has been widely used in research on public health [27], socio-economics [28] and urban thermal environments [29].
As the largest freshwater lake in North China, Baiyangdian Lake provides an important supporting role for regional biodiversity and eco-environmental protection. In recent years, with the implementation of regional planning, the establishment of the Xiong’an New Area and the layout of new industries, the land cover in the Baiyangdian basin has changed dramatically [30]. These changes have also profoundly altered the spatial pattern of EQI in the Baiyangdian basin. It is important to monitor changes in the EQI of the Baiyangdian basin and identify the spatial heterogeneity and driving mechanisms of EQI in order to understand the regional ecological environment, the rational use of land resources, the restoration and management of the ecological environment and ecosystem service functions. The main objectives of this study included: (1) a comprehensive analysis of the land use and its characteristics of the Baiyangdian basin from 2000 to 2020; (2) an evaluation of the EQI changes caused by land use change; and (3) an exploration of the spatial and temporal patterns and formation mechanisms of EQI.

2. Materials and Methods

2.1. Study Area

Baiyangdian Lake, located in the North China Plain, is a lake in the southern branch of the Daqing River system and is one of the most important ecological water bodies in the Xiong’an New Area. With a total area of 366 km2 and an average water storage of 1.32 billion cubic meters, Baiyangdian Lake is the largest lake in Hebei Province and is known as the kidney of North China and the pearl of North China [31]. The Baiyangdian basin spans four provinces, namely Beijing, Tianjin, Hebei and Shanxi, and is located between 113°20′–116°54′ E and 38°05′–40°04′ N. The basin covers an area of approximately 33,096.57 km2 (Figure 1). Its topography slopes from northwest to southeast, forming three major landform units: mountains (hills), plains and wetlands. In terms of climate, the Baiyangdian basin belongs to a temperate continental monsoon climate zone, with four distinct seasons and simultaneous rain and heat. Precipitation in the basin is unevenly distributed spatiotemporally, with an annual average of about 640 mm. A total of 80% of the precipitation is concentrated in July, August and September with large inter-annual variations. Spatially, precipitation decreases from the mountains to the plains. The average annual temperature of the basin ranges from 7.3 to 12.7 °C and decreases from the plains in the southeast to the mountains in the northwest [32].

2.2. Methods

2.2.1. Direction of Land Use Change

This study used the land use transfer matrix to construct an index to quantify the transfer direction of each land use type in the Baiyangdian basin. The land use transfer matrix is a visual representation of the area transferred in and out of a land type from the start year to the end year over a period of change as well as the direction of change for each land type and is widely used in LUCC studies. The calculation is as follows:
S i j = S 11         S 12       S 13         S 1 n S 21       S 22       S 23         S 2 n                                                           S n 1       S n 2       S n 3       S n n
where S is the area of the transferred land type; i and j are the beginning and end periods, respectively; n is the number of land use types; the number of rows indicates the part of the land use type in period i that changed to the land use type in period j; and the diagonal part indicates the part of the same land type that did not change from period i to period j. The land use net change area (NC) clearly reflects the direction of land use change over the study period and is expressed as follows:
N C = S i j S j i , S i j S j i S j i S i j , S i j < S j i
where Sij is the area of land type j changed to land type i; Sji is the area of land type i changed to land type j; and NC denotes the net area of change between land type i and land type j.

2.2.2. Land Use Intensity Index

The land use intensity index mainly reflects the breadth and depth of land use in a given region, but it also reflects the extent to which socio-economic factors interfere with the natural complex of the land. The land use intensity analysis method proposed by Xianghong et al. [33] classifies land use types according to the degree of influence of social factors and assigns a graded index to each land use type separately. The calculation is as follows:
L = 100 × i = 1 n A i × C i
where L is the land use intensity comprehensive index in a certain region; Ai is the grade index of land use type i; Ci is the area percentage of land use type i; and n is the number of land use types. According to the degree of influence of human activities on each land use type, a value of 4 is assigned to construction land, 3 to cropland, 2 to woodland, water and grassland areas, and 1 to unused land.

2.2.3. Eco-Environmental Quality Index

The eco-environmental quality index (EQI) expresses the overall characteristics of eco-environmental quality in a region by constructing a quantitative relationship between LUCC and eco-environmental quality. According to the needs of this study, the Baiyangdian basin was divided into 1465 eco-environmental units using a 5 km × 5 km square grid. As the secondary land use classification system has a high resolution and reflects obvious differences in ecological functions, this study used the secondary classification system to assess the eco-environmental quality of each eco-environmental unit in the Baiyangdian basin with reference to relevant studies at home and abroad [28]. The reference EQI background values for each land use type were determined by expert scoring and hierarchical analysis taking into account previous studies [24]. The calculation is as follows:
E Q I t = i = 1 n L U A i . t × E V i i = 1 n L U A i . t .  
where EQIt denotes the eco-environmental quality index in period t; EVi denotes the background value of eco-environmental quality corresponding to land use type i (Table 1); LUAi.t represents the area of land use type i in period t; and n denotes the number of land use types in a certain region.

2.2.4. GeoDetector

The GeoDetector model is a new model for detecting the variability of an attribute value of a geographical thing between different regions and the driving factors behind it [34]. GeoDetector is widely used in nature, society, environment and other related fields because of its advantages such as less sample size limitations, no multicollinearity and it being good at handling type volume. GeoDetector consists of four detectors: a factor detector, an interaction detector, an ecological detector and a risk detector. In this study, the factor detector and the interaction detector were used to reveal the effects of different factors and their interactions on the EQI.
The factor detector is used to identify the extent to which factors affect the eco-environmental quality and whether there is significant spatial consistency. The calculation is as follows:
q = 1 h = 1 L N h σ h 2 N σ 2
where q is the impact detecting indicator for the EQI and takes values in the range [0, 1]; N is the number of units across the region; Nh is the number of sample units in layer h; h is the classification of factors affecting EQI; and σ2 and σh2 are the variances of indicators in the study area and the variances of layer i, respectively.
The interaction detector is used to reflect the impact of the interaction between the 2 influencing factors on the EQI. First, we computed the q-values of the two factors X1 and X2. Then, we superimposed these two factors and computed their q-values q(X1 ∩ X2). Finally, we compared the values of q(X1), q(X2) and q(X1 ∩ X2). The interaction of the two factors will result in one of the following five situations:
(1)
Non-linear reduction: q(X1 ∩ X2) < Min(q(X1), q(X2)).
(2)
Single-factor non-linear attenuation: Min(q(X1), q(X2)) < q(X1 ∩ X2) < Max(q(X1), q(X2)).
(3)
Two-factor enhancement: q(X1 ∩ X2) > Max(q(X1), q(X2)).
(4)
Independent: q(X1 ∩ X2) = q(X1) + q(X2).
(5)
Non-linear enhancement: q(X1 ∩ X2) > q(X1) + q(X2).
The spatial and temporal pattern of the eco-environmental effect of LUCC in the Baiyangdian basin is formed by the combined effect of many factors. By referring to previous studies and repeated experiments, this paper selected thirteen factors from five aspects: topography, climate, soil and vegetation, human activities and location, to explore the mechanism of the formation of the spatial pattern of the eco-environment in the Baiyangdian basin. Topography is a decisive factor in the formation of the spatial and temporal distribution of the eco-environment. Since the Earth was formed, the structure of its crust and surface form has been changing. Changes in land and sea, mountains and rivers, as well as the birth and death of life, are all the result of changes in the Earth’s surface morphology. This paper, therefore, selected topographic relief (X1), slope (X2) and altitude (X3) to detect the influence of topography on the spatial and temporal evolution of the quality of the eco-environment [35,36]. Over historical periods, topography has determined the evolutionary processes and trends in eco-environmental quality. Climate, soil and vegetation, human activities and location are the main drivers of the spatial and temporal evolution of eco-environmental quality over short periods. Climate is the most direct and sensitive factor in the evolution of regional eco-environmental quality, which can influence the evolution of regional eco-environmental quality at any spatial or temporal scale as well as play an important role in the evolution of regional eco-environmental quality. This paper therefore selected precipitation (X4) and temperature (X5) to detect the influence of climate on the spatial and temporal evolution of the eco-environmental quality [26]. Soil and vegetation are the most prominent sign of the surface system of the Earth and have a significant impact on eco-environmental quality. Therefore, in this study, soil type (X6), organic carbon content of soil (X7) and NDVI (X8) were chosen to characterize the influence of soil and vegetation on the spatial and temporal evolution of eco-environmental quality [37]. Human activity is the most dynamic factor influencing the evolution of eco-environmental quality. In this study, land use intensity (X9), population density (X10) and nighttime lighting (X11) were chosen to detect the influence of human activities on eco-environmental quality [21]. Among these indicators, with reference to the research of Cai et al. [38], this study introduced nighttime lighting to indicate the socio-economic level of the Baiyangdian basin. In addition, the distance from roads (X12) and the distance from railways (X13) were also included in the model to explore the influence of accessibility on the spatial heterogeneity of the eco-environment in the Baiyangdian basin [21].

2.3. Data Source

The data required for this study included normalized difference vegetation index (NDVI) data, land use data, soil type data, digital elevation data (DEM), precipitation data, temperature data and nighttime lighting data (Table 2). The NDVI and land use data were for the five periods of 2000, 2005, 2010, 2015 and 2020; the soil type data were 1 km raster data; and the land use data were 30 m raster data. The above data were obtained from the Resource and Environment Science and Data Centre of the Chinese Academy of Sciences (http://www.resdc.cn/, accessed on 1 September 2021). DEM data were obtained from the Geospatial Data Cloud (http://www.gscloud.cn/, accessed on 1 September 2021). Population density data (100 m resolution) were obtained from worldpop (https://www.worldpop.org/, accessed on 1 January 2022). Nighttime lighting data for 2000–2020 were derived from the National Geophysical Data Center (NGDC), part of the National Oceanic and Atmospheric Administration (NOAA) (https://www.ngdc.noaa.gov/eog/download.html, accessed on 1 January 2022). The boundary of the Baiyangdian basin was extracted with reference to the study by Haag et al. [39] and Sliwinski et al. [40].

3. Results

3.1. Land Use/Cover Change Analysis of the Baiyangdian Basin

Overall, there were more land use types in the Baiyangdian basin during the study period, containing a total of six primary land use types and twenty-one secondary land use types. The mutual transformation between the different types of land use in the Baiyangdian basin from 2000 to 2020 was very clear (Table 3). Cropland was the predominant land use type in the study area. The relatively low altitude and suitable climate have contributed to the development of the agricultural sector in the Baiyangdian basin [26]. However, since 2000, the proportion of cropland in the basin declined from 44.63% to 40.49% in 2020, showing a phenomenon of gradual decline. Woodland was mainly located in the Taihang Mountains of the western part of the basin, and its area increased from 21.09% in 2000 to 21.11% in 2020. This includes an increase of 1.64% in the area of forestland over the study period. Compared to woodland, the proportion of grassland decreased from 23.80% in 2000 to 22.61%, showing a significant downward trend.
Water areas were not the dominant land use type in the study area, but water, as a source of life, has an essential function in the eco-environment of the Baiyangdian basin. From 2000 to 2015, due to the large-scale reclamation of the lake for farming by the people in the study area, the water area (excluding bottom land) in the basin showed a gradual decline. After 2015, along with the introduction of the Beijing–Tianjin–Hebei Coordinated Development and the establishment of the Xiong’an New Area, the local government carried out large-scale work on the Baiyangdian basin to return cropland to the lake as well as to provide eco-environmental protection. Until 2020, the proportion of water area in the basin grew to 1.07%, which was the highest level during the study period. Compared to other land use types, the area of construction land increased significantly over the study period, with its proportion of the total area increasing from 7.82% in 2000 to 12.95% in 2020. Among the construction land, both rural settlements and the urban land expanded more significantly, with their proportion increasing from 1.18% and 6.24% in 2000 to 2.23% and 8.84% in 2020, respectively. The expansion of rural settlements and urban land was mainly due to population growth and migration. Between 2000–2020, the population density in the Baiyangdian basin rose from 431 to 500 people per square kilometer. Notably, 2000–2020 was a period of accelerated infrastructure development in China [41]. As a result, the area of other construction land also increased to a greater extent, with its proportion increasing from 0.40% in 2000 to 1.88% in 2020. The unused land in the Baiyangdian basin was dominated by marshland. Prior to 2015, there was no marshland in the study area. However, in 2015, the majority of the bottom land in Baiyangdian Lake was transformed into marshland. As of 2020, marshland accounted for 0.52% of the basin’s total area, indicating that water storage in Baiyangdian Lake had increased to a large extent since 2015, roughly coinciding with the return of cropland to the lake.
Table 4 shows the direction of change for each land use type in the Baiyangdian basin from 2000 to 2020 (due to space constraints, this paper only shows the direction of land use change for larger areas). During the study period, the conversion of dry land to construction land was the main direction of land use change in the Baiyangdian basin. From 2000 to 2020, the dry land area in the Baiyangdian basin decreased by a total of 1304.8263 km2, 1261.5756 km2 of which was converted to construction land, accounting for 96.67% of its total converted area. The reduction in the dry land area included 755.3776 km2 converted to rural settlements, 266.3679 km2 converted to urban land and 266.3679 km2 converted to other construction land. The expansion of construction land came mainly from the occupation of farmland, with most of the cropland converted to construction land located near cities and villages (Figure 2). The conversion trend of rural settlements to urban land within the study area is notable. From 2000 to 2020, a total of 48.3221 km2 of rural settlement was transformed into urban land. This indicated that the urban expansion not only involved the occupation of cropland but also that more and more rural areas around cities will gradually be incorporated into the urban sphere with economic development. The conversion of shrub forest to forestland was also evident. During the study period, 473.6854 km2 of shrub forest was converted to forestland, accounting for 88.97% of the area converted from shrub forest. It indicated that, after a period of prohibition of indiscriminate logging and the protection of forests, the forest area and quality of the Baiyangdian basin improved to a great extent. However, according to the above study, most of the reduced cropland was converted into construction land, suggesting that the local government’s policy of returning cropland to woodland was not effectively implemented by the local people. The transfer of grassland and other land types also occurred more frequently during the study period. On the one hand, 117.4426 km2 of medium-cover grassland was converted to high-cover grassland from 2000 to 2020, indicating that grassland was effectively protected in some areas. On the other hand, 102.8970 km2 and 80.9788 km2 of medium-cover grassland was converted to other construction land and low-cover grassland, respectively, indicating that eco-environmental degradation and the encroachment of ecological land by construction land existed in the Baiyangdian basin. In terms of the change from bottom land to marshland, a total of 135.2766 km2 of bottom land was converted to marshland during the study period, accounting for 62.21% of the reduction in bottom land area, and the conversion was mainly in the vicinity of Baiyangdian Lake (Figure 2). This indicated that the water storage capacity of Baiyangdian Lake increased to a large extent over the study period. It also indicated that the eco-environment of Baiyangdian Lake improved considerably after a period of treatment of the lake and its upstream basin.

3.2. Spatial and Temporal Evolutionary Characteristics of the EQI

The results of the Baiyangdian basin EQI measurement between 2000 and 2020 are shown in Figure 3. Since the 21st century, China has made great achievements in terms of urbanization and industrialization. However, this has inevitably led to the encroachment of cropland and ecological land by construction land. The increasingly serious contradiction between man and land has also led to a series of serious ecologically damaging land use activities such as deforestation and the reclamation of lakes into cropland. It is in this context that the EQI of the Baiyangdian basin fell from 0.4199 to 0.4191 between 2000 and 2005. From 2005 to 2010, the EQI of the Baiyangdian basin increased from 0.4191 to 0.4192. The improvement in the quality of the eco-environment was related to the policies that have been implemented by the local government in the Baiyangdian basin, including the Key Shelterbelt Construction Program (KSCP), the Natural Forest Conservation Program (NFCP), the Afforestation Program for Taihang Mountain (APTM) and the Grain to Green Program (GTGP) [42,43]. During this period, the area of sparse forestland and high-cover grassland in the Baiyangdian basin increased by 14.05 km2 and 115.33 km2, respectively, which led to an increase in the EQI to some extent. Since 2010, China has gradually stepped into a new normal of economic development. As a result of increased pressure on resources and the environment, as well as increased consumer awareness of environmental protection, China has also become more aware of the importance of environmental protection. All provinces, autonomous regions and municipalities directly under the central government, and this includes the Baiyangdian basin governments at all levels, have actively introduced measures related to ecological restoration. As a result, between 2010 and 2015, the EQI of the Baiyangdian basin improved to a greater extent, with its value increasing from 0.4192 to 0.4225. However, the previously emerged conflict between humans and land has shown an explosive trend in recent years, manifested by a decline in the EQI, whose value dropped from 0.4225 in 2015 to 0.4214 in 2020. This was mainly due to a certain conflict between the restrictions on the red line of cropland in the Baiyangdian basin and urbanization. In conclusion, the EQI of the Baiyangdian basin generally showed a fluctuating upward trend from 2000 to 2020. However, the decline in the EQI in recent years indicates that the contradiction between humans and land in the Baiyangdian basin is becoming more pronounced. How to manage the balance between cropland, construction land and ecological land in the future is an urgent issue for local governments in the Baiyangdian basin.
The spatial and temporal pattern of the EQI in the Baiyangdian basin is shown in Figure 4. The results of the study showed that the spatial and temporal patterns of eco-environmental quality in the Baiyangdian basin remained generally stable during the study period. The EQI showed a trend of being higher in the northwest and lower in the southeast, indicating that the eco-environmental quality of the Taihang Mountains in the western part of the study area was generally better than that of the North China Plain in the eastern part of the study area. The North China Plain, where the eastern part of the Baiyangdian basin is located, is a population and economic agglomeration in northern China. Socio-economic development and population agglomeration were the main reasons for the poorer eco-environmental quality in the eastern part of the basin. Baiyangdian Lake is a hotspot of eco-environmental quality in the North China Plain, and it plays an integral role in the ecological regulation function of the core area of the Beijing–Tianjin–Hebei urban agglomeration as well as the Baiyangdian basin. From 2000 to 2020, the EQI of Baiyangdian Lake showed a fluctuating upward trend, indicating an improvement in the quality of the eco-environment near Baiyangdian Lake. The Taihang Mountains, where the northwestern part of the basin is located, is an area with high values of the EQI. The main characteristics of the Taihang Mountains in the western part of the basin are higher altitude, complex natural conditions, lower average temperatures and more luxuriant vegetation cover, hence its higher EQI. Moreover, the EQI of the Taihang Mountains in the western part of the basin continued to rise gradually over the study period.

3.3. Driving Factors for the Spatial and Temporal Evolution of EQI

3.3.1. Detection and Analysis of Impact Factors

With reference to the specific situation of the Baiyangdian basin, this study used the GeoDetector model to detect the spatial and temporal patterns of land use eco-environmental quality in the basin (Figure 5). At a certain level of a significance test, a larger q-value for an indicator indicates a greater influence of that indicator on the spatial and temporal evolution of the EQI. All the influencing factors from 2000–2020 passed the significance test at the 1% level. At the 1% significance level, the combined influence of the driving factors in the Baiyangdian basin from 2000 to 2020 were ranked as follows: land use intensity > altitude > topographic relief > slope > temperature > population > nighttime lighting > soil type > organic carbon content of soil > distance from road > distance from railway > NDVI > precipitation. From 2000 to 2020, the influence of land use intensity on the EQI of the Baiyangdian basin was significantly stronger than the other factors, and it was the most important driving factor in the spatial and temporal evolution of eco-environmental quality. Specifically, the influence of topographic factors, including topographic relief, slope and altitude, on the quality of the eco-environment showed a fluctuating downward trend during the study period. The impact of temperature on the eco-environmental quality of the Baiyangdian basin showed a fluctuating downward trend. Compared to other influencing factors, soil and vegetation factors had a relatively small impact on the spatial and temporal evolution of the eco-environmental quality of the Baiyangdian basin. In particular, the NDVI was still at a relatively low level, although it showed a slow increase during the study period. In 2020, the q-value for NDVI was only 0.164, which was still low, although it was a significant increase compared to 0.011 in 2000. The q-values for soil type and organic carbon content of soil were also relatively small and remained generally stable over the study period. In terms of human activity factors, the impact of land use intensity on eco-environmental quality was higher than the other two factors, indicating that the eco-environmental quality of the Baiyangdian basin was more susceptible to the impact of human land development activities. The impact of population on the eco-environmental quality of the Baiyangdian basin decreased gradually, while the impact of nighttime lighting increased. Overall, human activities played a significant role in the spatial and temporal evolution of the eco-environmental quality of the Baiyangdian basin. Railways had a higher impact on the EQI than roads; however, location had a smaller impact on the EQI over the study period.

3.3.2. Detection and Analysis of Interaction Factors

Based on the results of the GeoDetector interaction detector analysis, it can be seen that the influence of the impact factors on the EQI during the period 2000–2020 did not occur in isolation. During the study period, all the interactions between the influencing factors had an enhancing effect on the EQI of the Baiyangdian basin (Figure 6). The two main types of synergistic enhancement were two-factor enhancement and non-linear enhancement, but the former was significantly stronger than the latter in the Baiyangdian basin. Land use intensity, as the factor with the highest q-value, reflected the extent to which human society has exploited the natural complex of the land. The link between the factors and land use intensity was stronger, so the strength of the effect between land use intensity and other factors within the Baiyangdian basin was significantly stronger than the strength of the effect between any two other factors. However, there was more of a two-factor enhancement between land use intensity and the other factors. The number of non-linear enhancements decreased gradually over time. Prior to 2005, the interaction of precipitation and NDVI with other factors was more of a non-linear enhancement. From 2010–2020, only a few of the interactions between the factors were non-linear enhancements, while other interactions between the factors were two-factor enhancements. In conclusion, the interactions between the factors exhibited significant non-linear enhancement and two-factor enhancement effects over the study period. The combined effects of topography, climate, soil and vegetation, location and human activities influenced the spatial and temporal patterns of eco-environmental quality in the Baiyangdian basin.

4. Discussion

4.1. Comparing with Previous Studies

The eco-environment is the basis for the survival and development of human society, and no civilization can develop in isolation from the natural environment [44]. At the same time, human development can have an impact on the natural environment in return [45]. Since the reform and opening up, China has made tremendous achievements in economic development, which has led to profound changes in land use while also causing a series of eco-environmental problems [24]. Previous studies have shown that with industrialization and urbanization, the eco-environment across China has shown a trend of gradual deterioration [11,28]. In this study, however, the EQI of the Baiyangdian basin increased during the study period. This was mainly due to the low level of urbanization in the Baiyangdian basin, where the problem of conflict between people and land was not as significant compared to hotspot regions. At the same time, the protection of ecological land by local governments in the Baiyangdian basin also played a non-negligible role.
Some scholars have argued that socio-economic factors are the most direct influences on the quality of the ecological environment [46]. However, based on a geographically weighted regression model, Fang et al. concluded that precipitation and the proportion of forestland were the dominant factors influencing the spatial and temporal variation in the value of ecosystem services in the Yangtze and Yellow River basins, meaning that natural factors were the dominant factors leading to the spatial and temporal evolution of the ecological environment [10]. Similar conclusions were reached by Guo et al. in their study of desertification in the Yellow River source area [47]. This paper creatively introduced nighttime lighting (X11) to represent the socio-economic level and incorporated it into the model. Nighttime lighting data is an unbiased, labor-saving type of remote sensing data that has been successfully used in recent years for many aspects such as economic output estimation, the analysis of urbanization processes and energy consumption calculations [48,49]. Different from previous studies, this paper found that the combined effects of topography, climate, soil and vegetation, human activities and location drove the spatial and temporal patterns of eco-environmental quality in the Baiyangdian basin. In comparison, the impact of human activities on the EQI of the Baiyangdian basin was stronger than the impact of topography, climate, soil and vegetation as well as location in this paper, and similar conclusions were reached in the research of Ge et al. [46]. The topography of the basin is complex, so topographic factors such as topographic relief, slope and altitude also had a significant impact on the EQI of the Baiyangdian basin.

4.2. Policy Implications

Exploring the eco-environmental effects and driving factors of LUCC in the Baiyangdian basin is important for scientific research and sustainable regional development [28,50,51]. In 2018, the Chinese government formulated the Baiyangdian eco-environmental management and protection plan, aiming to maintain ecological security and promote sustainable development in northern China [52]. However, how to translate the specific entries of the plan into reality is a problem faced by local governments in the Baiyangdian basin. The results of this study provide an important reference for ecological conservation and restoration in the Baiyangdian basin. Consistent with previous studies, the findings of this paper suggested that ecological environments tended to be poorer in largely populated and economically developed regions [28,53,54]. It showed that in recent decades, people focused more on economic development, industrialization and urbanization rather than on the protection of the eco-environment. Although the eco-environmental quality of the Baiyangdian basin has improved, the EQI tended to be lower in urban areas. In addition, as the urban areas expanded, this impact was gradually spread to the periphery of the urban areas. Therefore, the eco-environmental problems associated with urban expansion should be fully considered. Land use intensity was an important factor affecting the EQI of the Baiyangdian basin. Therefore, the rationality of land use type conversion should be emphasized in the construction of the Beijing–Tianjin–Hebei urban agglomeration and the Xiong’an New Area. In addition, the natural ecosystem should be protected, and measures should be taken in accordance with local conditions. Efforts should be made to rebuild the ecosystem in Baiyangdian Lake and the Taihang Mountains in the western part of the basin by limiting or avoiding human activities that lead to negative developments in the ecosystem. At the same time, the self-healing function of the ecosystem should be fully utilized. Finally, in terms of cropland, local governments should earnestly implement the policy of compensating the balance of land acquisition, strictly abide by the red line of cropland protection and ensure the efficient use of cropland resources in the Baiyangdian basin based on eco-environmental restoration [55].

4.3. Limitations and Future Directions

There were still some limitations in this study. (1) The existing methods for evaluating eco-environmental quality are lacking in perfection. The EQI of LUCC cannot fully represent the overall eco-environmental quality. Eco-environmental quality is a complex concept, and the broad definition of eco-environmental quality should also take into account factors such as biodiversity and the atmosphere. As far as the EQI of LUCC itself is concerned, there is still room for perfection. The ecosystem is a natural complex, and features ranging from a large basin to a small urban park can be described as an ecosystem. Urban land can still be subdivided into land types such as parks and green belts to evaluate the quality of the ecological environment in different areas of a city. A comprehensive discussion of the above issues was beyond the scope of this study due to the limitations of the data sources, but these factors are crucial to exploring micro-level studies of eco-environmental quality. Therefore, further research is needed in the future to make the EQI more realistic and to better evaluate the impact of different scales and different land use classification systems on ecological and environmental quality assessment results. (2) In terms of influencing factors, although nighttime lighting can reflect the road density of a region to some extent, road density should also be taken into account in future studies, considering the integrity of the detection factor system. Furthermore, the interactions between different influencing factors are very complex. Due to methodological limitations, only the strength of the interaction between the two factors was investigated in this paper. The interactions between more than two factors and the driving mechanisms of the interactions between the influencing factors need to be further refined in subsequent studies.

5. Conclusions

This paper investigated the spatial and temporal distribution patterns of eco-environmental quality in the Baiyangdian basin based on LUCC data and EQI from 2000 to 2020. Based on the GeoDetector model, ten detecting factors were then selected from four aspects, topography, climate, soil and vegetation, human activities and location, to explore and analyze the spatial and temporal evolution mechanisms of eco-environmental quality in the Baiyangdian basin. The spatial and temporal distribution patterns of eco-environmental quality in the Baiyangdian basin and their influencing factors were effectively revealed. The specific results of the study were as follows:
(1)
The spatial and temporal land cover changes in the Baiyangdian basin from 2000 to 2020 were complex. During the study period, the area of cropland in the Baiyangdian basin decreased gradually, but the dominance of cropland was difficult to shake. The area of woodland and grassland remained stable in general, and the area of forestland and high-cover grassland increased. In terms of water area, the proportion of water area gradually decreased before 2010, and after 2010, the proportion of both water area and marshland showed an increasing trend. The evolution of the water area roughly coincided with the reclamation of the lake into cropland in the early years and the return of cropland to the lake in the later years. The proportion of construction land was lower, but the expansion of construction land was the fastest during the study period. In terms of the direction of land cover change, dry land had the largest area of conversion outward, and most of the dry land was converted into urban land, rural settlements and other construction land. This indicated that as the scope of human activities has increased, the conflict between people and land has become an urgent problem in the Baiyangdian basin. The change from shrub forest to forestland was also evident. Also evident was the change from bottom land to marshland and from medium- to high-cover grassland. However, there still existed a shift from medium-cover grassland to low-cover grassland and from medium-cover grassland to other construction land in the Baiyangdian basin during the study period. This indicated that some areas in the Baiyangdian basin are still experiencing some eco-environmental degradation and encroachment by human activities on ecological land during the study period. The transformation of rural settlement into urban land is noteworthy. Although the area transferred from rural settlement to urban land was only 48.3221 km2, this represents the future direction of land use change to a certain extent, which is to alleviate the contradiction between people and land while at the same time providing sufficient labor for the cities as well as promoting economic development [56].
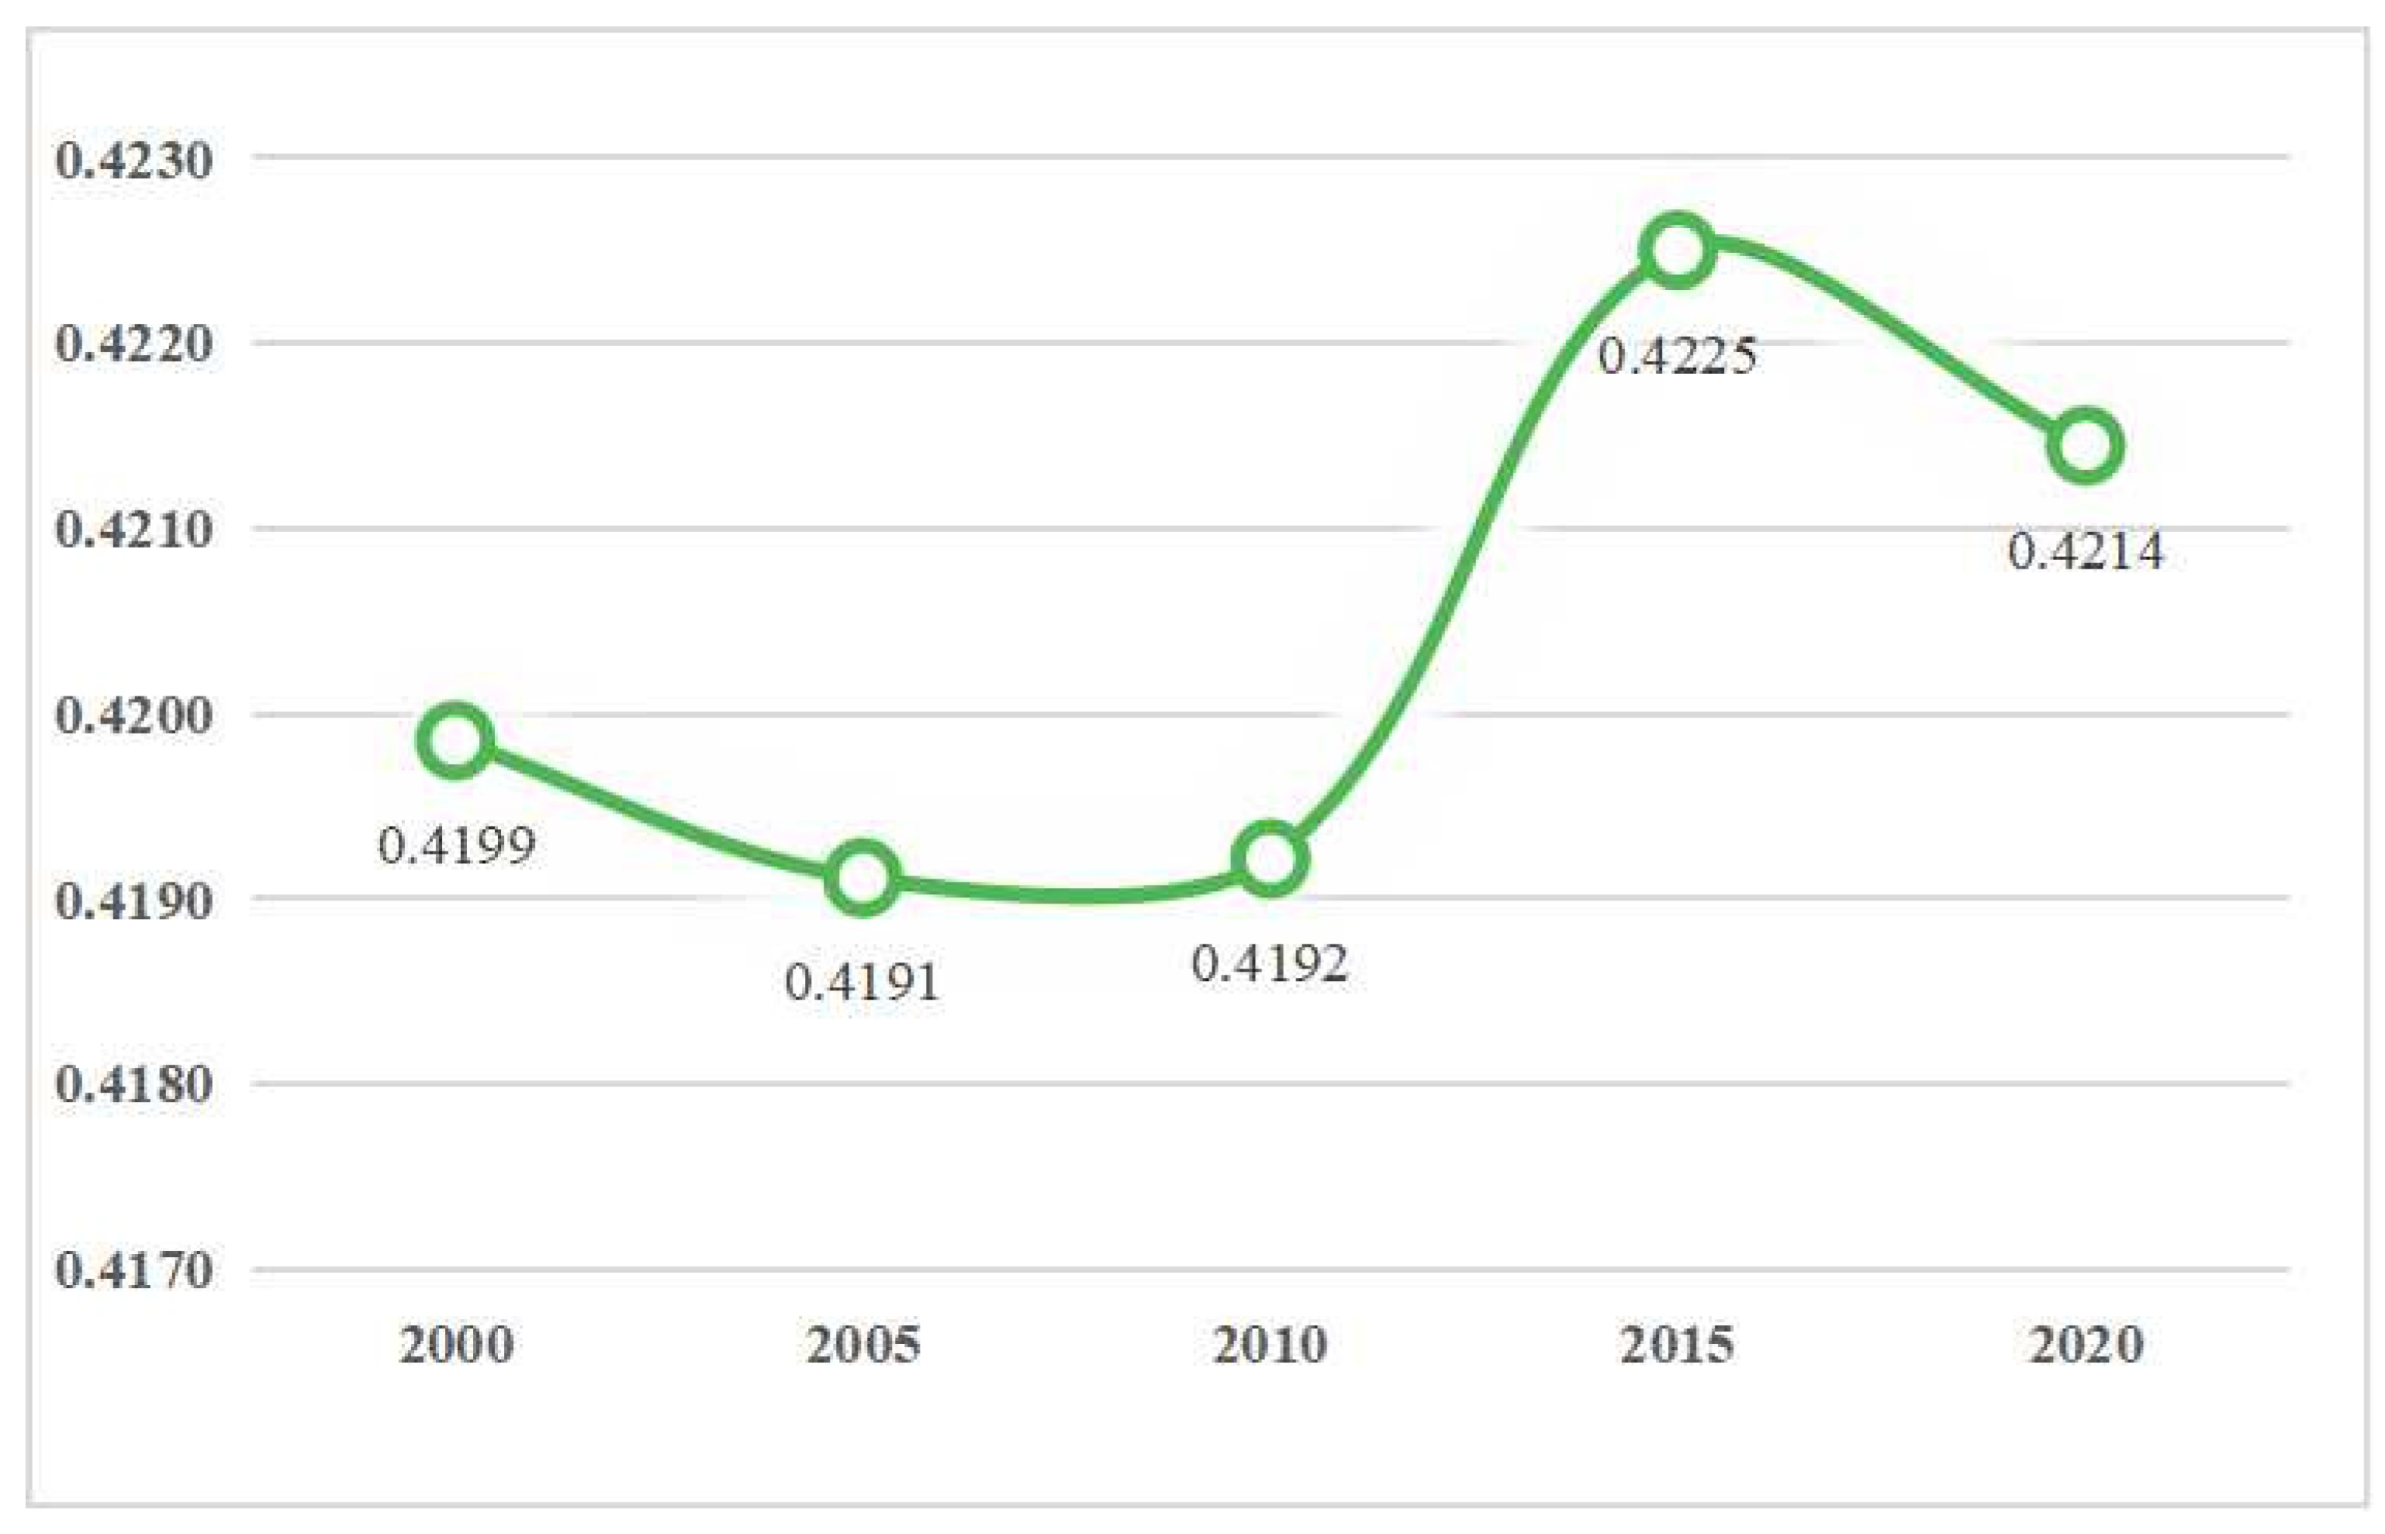
(2)
Overall, the EQI in the Baiyangdian basin showed significant spatial and temporal heterogeneity over the study period. From 2000 to 2020, the EQI of the Baiyangdian basin showed a fluctuating upward trend. Specifically, the EQI of the Baiyangdian basin declined slowly before 2005. From 2005 to 2015, the EQI of the Baiyangdian basin increased significantly. After 2015, the EQI of the Baiyangdian basin showed a small decline. Spatially, the eco-environmental quality index of the Baiyangdian basin had the characteristic of gradually decreasing from northwest to southeast. The EQI of the Taihang Mountains in the western part of the study area was higher than that of the North China Plain in the east, mainly due to the fact that the North China Plain is a population and economic agglomeration in northern China. The concentration of population and economy can easily cause the deterioration of the ecological environment. Baiyangdian Lake, located in the central part of the North China Plain, had a higher EQI and was the hotspot of the EQI in the eastern part of the whole basin.
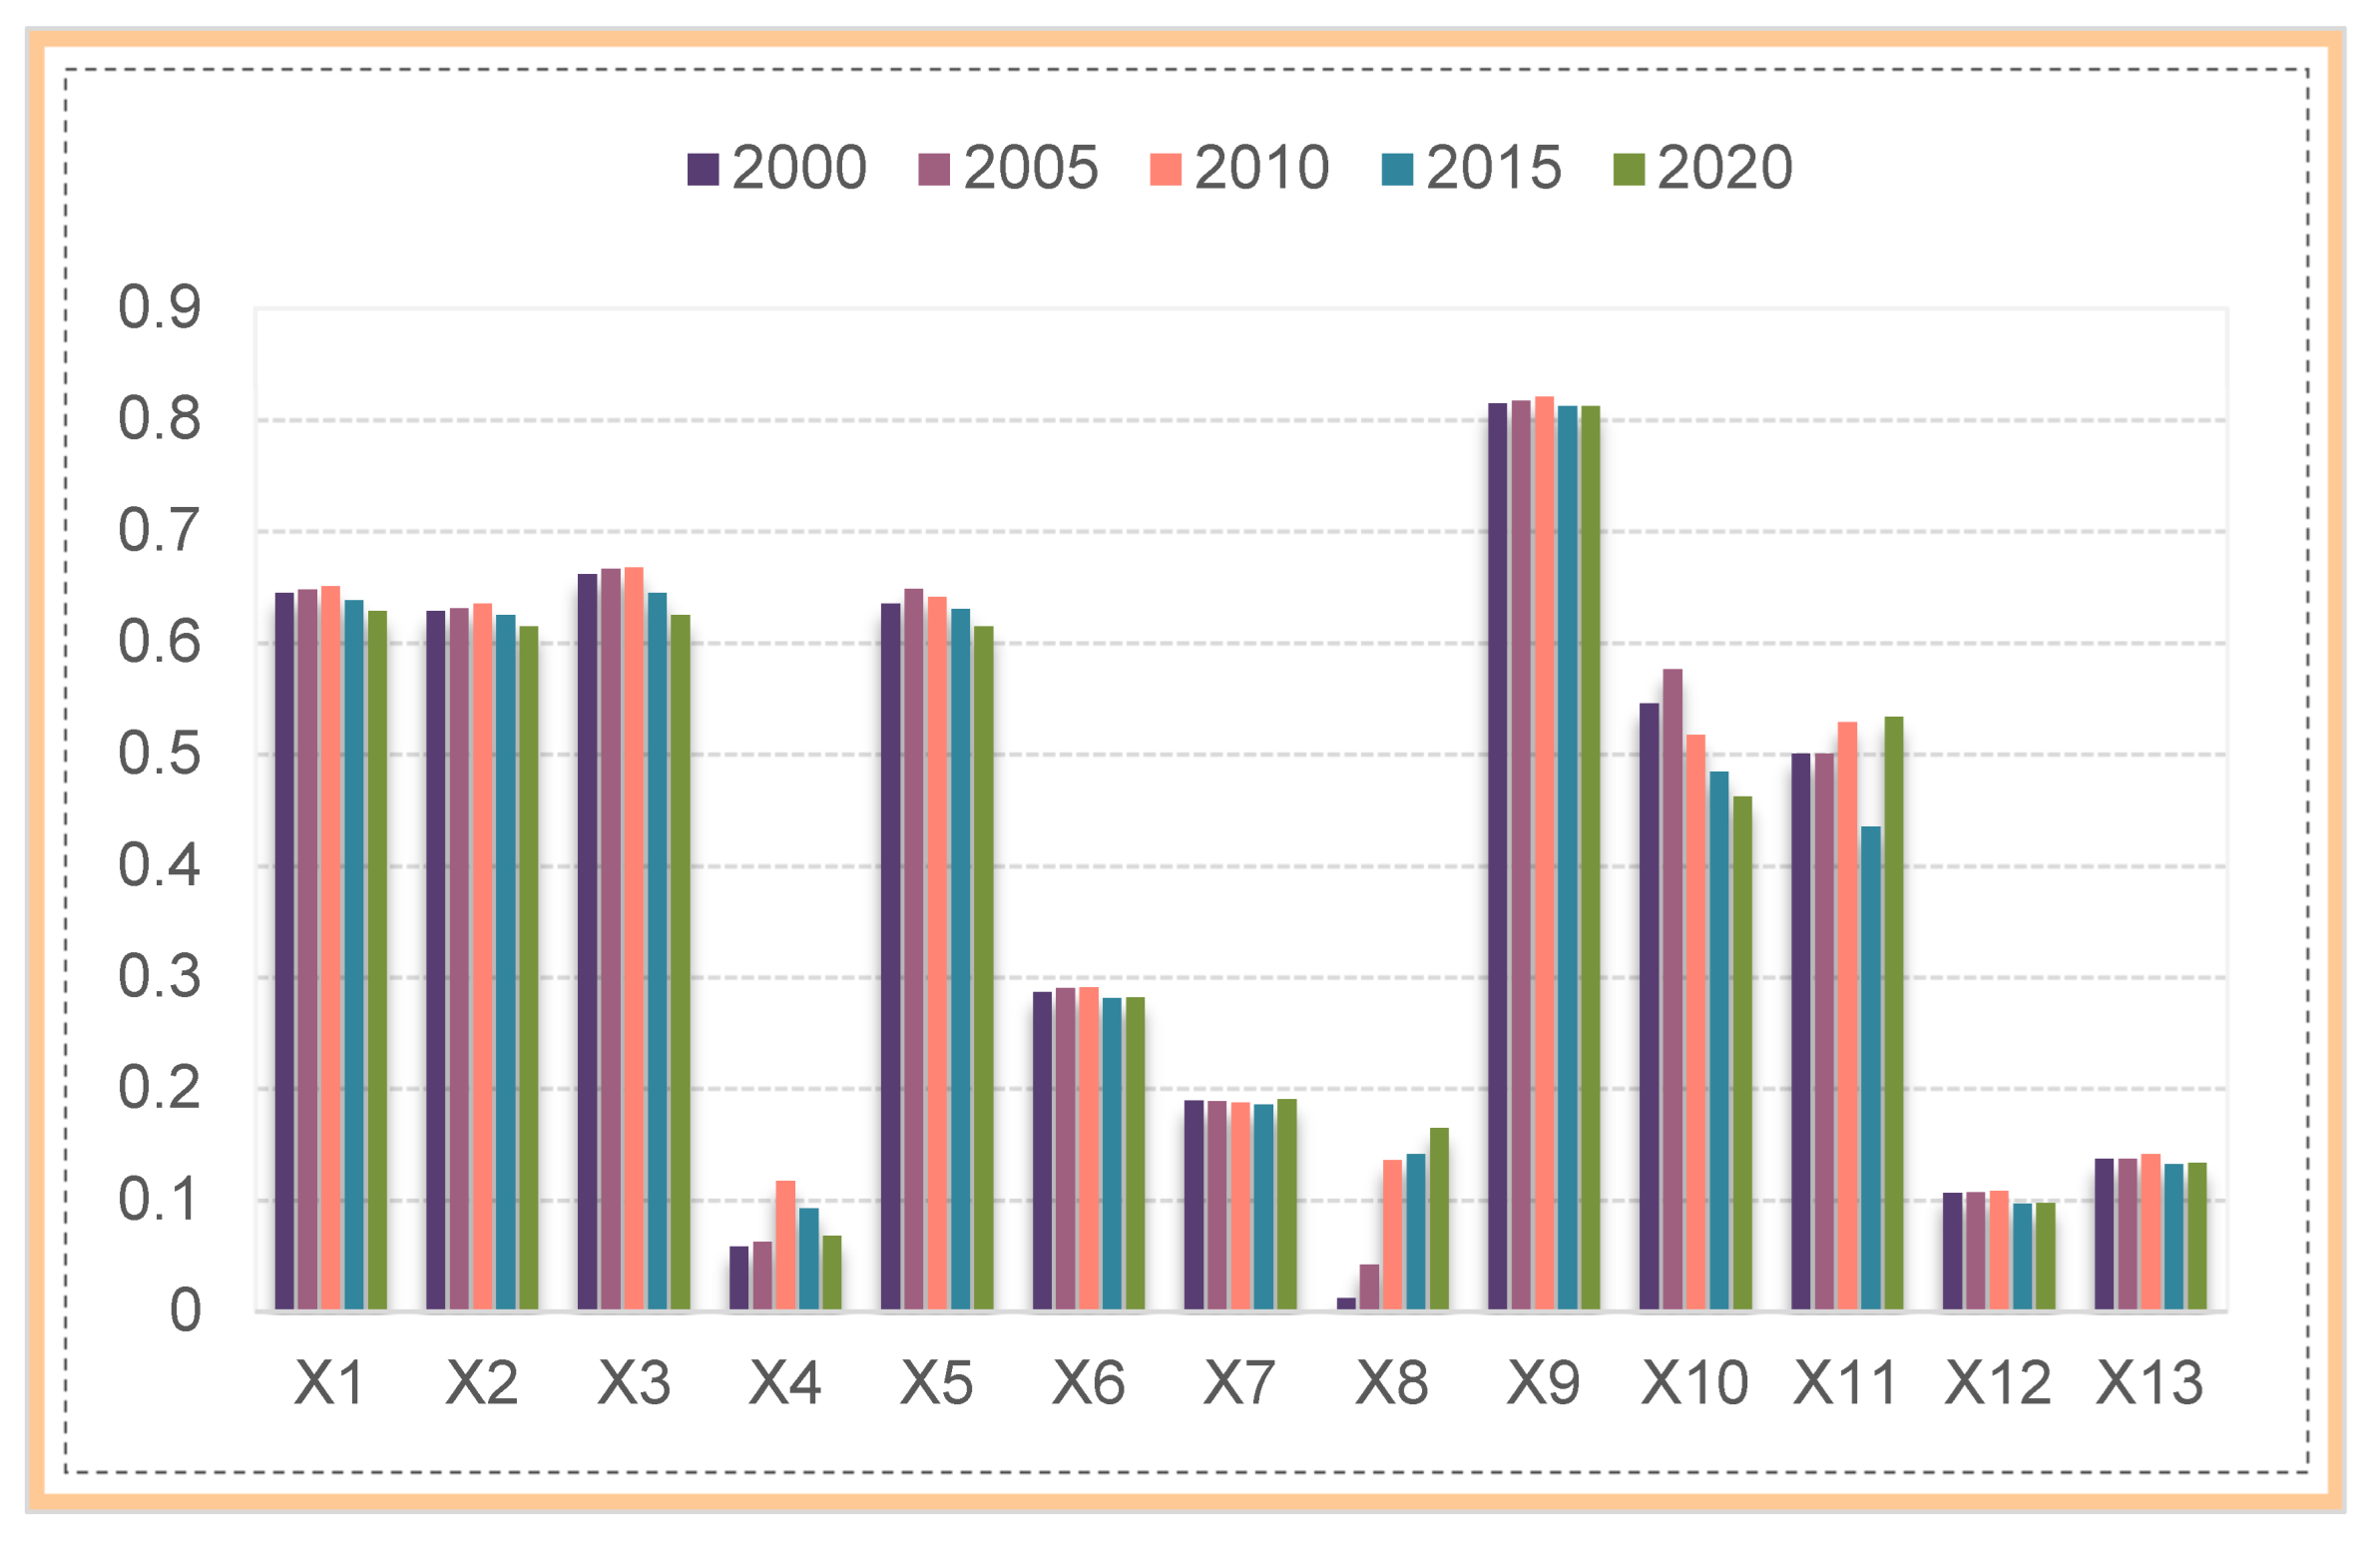
(3)
The results of the factor detector from 2000 to 2020 showed that the impact of land use intensity on the eco-environmental quality was significantly higher than that of the other detecting factors in the Baiyangdian basin. The spatial and temporal evolution of the eco-environmental quality of the Baiyangdian basin was significantly influenced by human activities, whose impact remained generally stable. The influence of topography on the spatial and temporal evolution of eco-environmental quality was relatively strong, but its influence tended to fluctuate downwards during the study period. Climate, soil and vegetation as well as location had some influence on the spatial and temporal evolution of the eco-environmental quality of the Baiyangdian basin, but their influence was weaker compared to topography and human activities. The strength of the interaction between the influencing factors was greater than that of a single factor. The types of effects were mainly non-linear enhancement and two-factor enhancement.

Author Contributions

B.X. wrote this paper; supervision, B.X. and L.Z.; funding acquisition, L.Z. All authors have read and agreed to the published version of the manuscript.

Funding

This work was funded by the National Social Science Fund of China (Grant No. 20ATJ004) and the Humanities and Social Science major Project of Hebei Education Department (Grant No. ZD201811).

Institutional Review Board Statement

Not applicable.

Informed Consent Statement

Not applicable.

Data Availability Statement

Details in Section 2.3 Data Source.

Conflicts of Interest

The authors declare no conflict of interest.

References

  1. Koerper, J.; Hoeschel, I.; Lowe, J.A.; Hewitt, C.D.; Salas y Melia, D.; Roeckner, E.; Huebener, H.; Royer, J.-F.; Dufresne, J.-L.; Pardaens, A.; et al. The Effects of Aggressive Mitigation on Steric Sea Level Rise and Sea Ice Changes. Clim. Dyn. 2013, 40, 531–550. [Google Scholar] [CrossRef] [Green Version]
  2. Liu, L.; Wen, Y.; Liang, Y.; Zhang, F.; Yang, T. Extreme Weather Impacts on Inland Waterways Transport of Yangtze River. Atmosphere 2019, 10, 133. [Google Scholar] [CrossRef] [Green Version]
  3. Arrow, K.; Bolin, B.; Costanza, R.; Dasgupta, P.; Folke, C.; Holling, C.S.; Jansson, B.-O.; Levin, S.; Mäler, K.-G.; Perrings, C.; et al. Economic Growth, Carrying Capacity, and the Environment. Ecol. Econ. 1995, 15, 91–95. [Google Scholar] [CrossRef]
  4. Vitousek, P. Beyond Global Warming: Ecology and Global Change. Ecology 1994, 75, 1903–1910. [Google Scholar] [CrossRef]
  5. Yi, L.; Zhang, Z.; Zhao, X.; Liu, B.; Wang, X.; Wen, Q.; Zuo, L.; Liu, F.; Xu, J.; Hu, S. Have Changes to Unused Land in China Improved or Exacerbated Its Environmental Quality in the Past Three Decades? Sustainability 2016, 8, 184. [Google Scholar] [CrossRef] [Green Version]
  6. Zhang, Z.; Wang, X.; Zhao, X.; Liu, B.; Yi, L.; Zuo, L.; Wen, Q.; Liu, F.; Xu, J.; Hu, S. A 2010 Update of National Land Use/Cover Database of China at 1:100000 Scale Using Medium Spatial Resolution Satellite Images. Remote Sens. Environ. 2014, 149, 142–154. [Google Scholar] [CrossRef]
  7. Dewan, A.M.; Yamaguchi, Y. Land Use and Land Cover Change in Greater Dhaka, Bangladesh: Using Remote Sensing to Promote Sustainable Urbanization. Appl. Geogr. 2009, 29, 390–401. [Google Scholar] [CrossRef]
  8. Lambin, E.F.; Turner, B.L.; Geist, H.J.; Agbola, S.B.; Angelsen, A.; Bruce, J.W.; Coomes, O.T.; Dirzo, R.; Fischer, G.; Folke, C.; et al. The Causes of Land-Use and Land-Cover Change: Moving beyond the Myths. Glob. Environ. Chang. 2001, 11, 261–269. [Google Scholar] [CrossRef]
  9. Tan, R.; Liu, Y.; Zhou, K.; Jiao, L.; Tang, W. A Game-Theory Based Agent-Cellular Model for Use in Urban Growth Simulation: A Case Study of the Rapidly Urbanizing Wuhan Area of Central China. Comput. Environ. Urban Syst. 2015, 49, 15–29. [Google Scholar] [CrossRef]
  10. Fang, L.; Wang, L.; Chen, W.; Sun, J.; Cao, Q.; Wang, S.; Wang, L. Identifying the Impacts of Natural and Human Factors on Ecosystem Service in the Yangtze and Yellow River Basins. J. Clean. Prod. 2021, 314, 127995. [Google Scholar] [CrossRef]
  11. Du, X.; Huang, Z. Ecological and Environmental Effects of Land Use Change in Rapid Urbanization: The Case of Hangzhou, China. Ecol. Indic. 2017, 81, 243–251. [Google Scholar] [CrossRef]
  12. Chase, T.N.; Pielke, R.A., Sr.; Kittel, T.G.F.; Nemani, R.R.; Running, S.W. Simulated Impacts of Historical Land Cover Changes on Global Climate in Northern Winter. Clim. Dyn. 2000, 16, 93–105. [Google Scholar] [CrossRef]
  13. Houghton, R.A.; Hackler, J.L.; Lawrence, K.T. The U.S. Carbon Budget: Contributions from Land-Use Change. Science 1999, 285, 574–578. [Google Scholar] [CrossRef]
  14. Sala, O.E.; Chapin, F.S.; Armesto, J.J.; Berlow, E.; Bloomfield, J.; Dirzo, R.; Huber-Sanwald, E.; Huenneke, L.F.; Jackson, R.B.; Kinzig, A.; et al. Global Biodiversity Scenarios for the Year 2100. Science 2000, 287, 1770–1774. [Google Scholar] [CrossRef]
  15. Li, Y.; Cao, Z.; Long, H.; Liu, Y.; Li, W. Dynamic Analysis of Ecological Environment Combined with Land Cover and NDVI Changes and Implications for Sustainable Urban–Rural Development: The Case of Mu Us Sandy Land, China. J. Clean. Prod. 2017, 142, 697–715. [Google Scholar] [CrossRef]
  16. Moreira, A.; Bremm, C.; Fontana, D.C.; Kuplich, T.M. Seasonal Dynamics of Vegetation Indices as a Criterion for Grouping Grassland Typologies. Sci. Agric. 2019, 76, 24–32. [Google Scholar] [CrossRef]
  17. Kumari, N.; Srivastava, A.; Dumka, U.C. A Long-Term Spatiotemporal Analysis of Vegetation Greenness over the Himalayan Region Using Google Earth Engine. Climate 2021, 9, 109. [Google Scholar] [CrossRef]
  18. Chen, S.; Feng, Y.; Tong, X.; Liu, S.; Xie, H.; Gao, C.; Lei, Z. Modeling ESV Losses Caused by Urban Expansion Using Cellular Automata and Geographically Weighted Regression. Sci. Total Environ. 2020, 712, 136509. [Google Scholar] [CrossRef]
  19. Jiang, F.; Zhang, Y.; Li, J.; Sun, Z. Research on Remote Sensing Ecological Environmental Assessment Method Optimized by Regional Scale. Environ. Sci. Pollut. Res. 2021, 28, 68174–68187. [Google Scholar] [CrossRef]
  20. Peng, J.; Xu, Y.; Cai, Y.; Xiao, H. Climatic and Anthropogenic Drivers of Land Use/Cover Change in Fragile Karst Areas of Southwest China since the Early 1970s: A Case Study on the Maotiaohe Watershed. Environ. Earth Sci. 2011, 64, 2107–2118. [Google Scholar] [CrossRef]
  21. Xu, Y.; Li, P.; Pan, J.; Zhang, Y.; Dang, X.; Cao, X.; Cui, J.; Yang, Z. Eco-Environmental Effects and Spatial Heterogeneity of “Production-Ecology-Living” Land Use Transformation: A Case Study for Ningxia, China. Sustainability 2022, 14, 9659. [Google Scholar] [CrossRef]
  22. Abera, W.; Tamene, L.; Abegaz, A.; Hailu, H.; Piikki, K.; Söderström, M.; Girvetz, E.; Sommer, R. Estimating Spatially Distributed SOC Sequestration Potentials of Sustainable Land Management Practices in Ethiopia. J. Environ. Manag. 2021, 286, 112191. [Google Scholar] [CrossRef] [PubMed]
  23. Yang, Z.; Fang, H.; Xue, X. Sustainable Efficiency and CO2 Reduction Potential of China’s Construction Industry: Application of a Three-Stage Virtual Frontier SBM-DEA Model. J. Asian Archit. Build. Eng. 2021, 21, 604–617. [Google Scholar] [CrossRef]
  24. Liu, Y.; Huang, X.; Yang, H.; Zhong, T. Environmental Effects of Land-Use/Cover Change Caused by Urbanization and Policies in Southwest China Karst Area—A Case Study of Guiyang. Habitat Int. 2014, 44, 339–348. [Google Scholar] [CrossRef]
  25. Ren, Y.; Lü, Y.; Fu, B.; Comber, A.; Li, T.; Hu, J. Driving Factors of Land Change in China’s Loess Plateau: Quantification Using Geographically Weighted Regression and Management Implications. Remote Sens. 2020, 12, 453. [Google Scholar] [CrossRef] [Green Version]
  26. Liu, Y.; Wu, K.; Cao, H. Land-Use Change and Its Driving Factors in Henan Province from 1995 to 2015. Arab. J. Geosci. 2022, 15, 247. [Google Scholar] [CrossRef]
  27. Wang, J.-F.; Hu, Y. Environmental Health Risk Detection with GeogDetector. Environ. Modell. Softw. 2012, 33, 114–115. [Google Scholar] [CrossRef]
  28. Hu, P.; Li, F.; Sun, X.; Liu, Y.; Chen, X.; Hu, D. Assessment of Land-Use/Cover Changes and Its Ecological Effect in Rapidly Urbanized Areas—Taking Pearl River Delta Urban Agglomeration as a Case. Sustainability 2021, 13, 5075. [Google Scholar] [CrossRef]
  29. Zhao, X.; Liu, J.; Bu, Y. Quantitative Analysis of Spatial Heterogeneity and Driving Forces of the Thermal Environment in Urban Built-up Areas: A Case Study in Xi’an, China. Sustainability 2021, 13, 1870. [Google Scholar] [CrossRef]
  30. Luo, X.; Tong, X.; Pan, H. Integrating Multiresolution and Multitemporal Sentinel-2 Imagery for Land-Cover Mapping in the Xiongan New Area, China. IEEE Trans. Geosci. Remote Sens. 2021, 59, 1029–1040. [Google Scholar] [CrossRef]
  31. Li, Y.; Lv, J.; Li, L. Coordinated Development of Water Environment Protection and Water Ecological Carbon Sink in Baiyangdian Lake. Processes 2021, 9, 2066. [Google Scholar] [CrossRef]
  32. Li, J.; Fang, Z.; Zhang, J.; Huang, Q.; He, C. Mapping Basin-Scale Supply-Demand Dynamics of Flood Regulation Service-A Case Study in the Baiyangdian Lake Basin, China. Ecol. Indic. 2022, 139, 108902. [Google Scholar] [CrossRef]
  33. Xianghong, D.; Xiyong, H.; Yuandong, W.; Li, W. Spatial-Temporal Characteristics of Land Use Intensity of Coastal Zone in China During 2000-2010. Chin. Geogr. Sci. 2015, 25, 51–61. [Google Scholar] [CrossRef]
  34. Wang, J.; Li, X.-H.; Christakos, G.; Liao, Y.-L.; Zhang, T.; Gu, X.; Zheng, X.-Y. Geographical Detectors-Based Health Risk Assessment and Its Application in the Neural Tube Defects Study of the Heshun Region, China. Int. J. Geogr. Inf. Sci. 2010, 24, 107–127. [Google Scholar] [CrossRef]
  35. Li, Z.; Liu, W.; Zheng, F. The Land Use Changes and Its Relationship with Topographic Factors in the Jing River Catchment on the Loess Plateau of China. SpringerPlus 2013, 2, S3. [Google Scholar] [CrossRef] [Green Version]
  36. Lin, J.; Chen, W.; Qi, X.; Hou, H. Risk Assessment and Its Influencing Factors Analysis of Geological Hazards in Typical Mountain Environment. J. Clean. Prod. 2021, 309, 127077. [Google Scholar] [CrossRef]
  37. Wang, J.-F.; Wang, Y.; Zhang, J.; Christakos, G.; Sun, J.-L.; Liu, X.; Lu, L.; Fu, X.-Q.; Shi, Y.-Q.; Li, X.-M. Spatiotemporal Transmission and Determinants of Typhoid and Paratyphoid Fever in Hongta District, Yunnan Province, China. PLoS Neglect. Trop. Dis. 2013, 7, e2112. [Google Scholar] [CrossRef]
  38. Cai, B.; Shao, Z.; Fang, S.; Huang, X.; Huq, M.E.; Tang, Y.; Li, Y.; Zhuang, Q. Finer-Scale Spatiotemporal Coupling Coordination Model between Socioeconomic Activity and Eco-Environment: A Case Study of Beijing, China. Ecol. Indic. 2021, 131, 108165. [Google Scholar] [CrossRef]
  39. Haag, S.; Shakibajahromi, B.; Shokoufandeh, A. A New Rapid Watershed Delineation Algorithm for 2D Flow Direction Grids. Environ. Model. Softw. 2018, 109, 420–428. [Google Scholar] [CrossRef]
  40. Sliwinski, D.; Konieczna, A.; Roman, K. Geostatistical Resampling of LiDAR-Derived DEM in Wide Resolution Range for Modelling in SWAT: A Case Study of Zglowiaczka River (Poland). Remote Sens. 2022, 14, 1281. [Google Scholar] [CrossRef]
  41. Banerjee, A.; Duflo, E.; Qian, N. On the Road: Access to Transportation Infrastructure and Economic Growth in China. J. Dev. Econ. 2020, 145, 102442. [Google Scholar] [CrossRef] [Green Version]
  42. Xu, Z.; Wei, H.; Fan, W.; Wang, X.; Huang, B.; Lu, N.; Ren, J.; Dong, X. Energy Modeling Simulation of Changes in Ecosystem Services before and after the Implementation of a Grain-for-Green Program on the Loess Plateau-A Case Study of the Zhifanggou Valley in Ansai County, Shaanxi Province, China. Ecosyst. Serv. 2018, 31, 32–43. [Google Scholar] [CrossRef]
  43. Zhou, T.; Shen, W.; Qiu, X.; Chang, H.; Yang, H.; Yang, W. Impact Evaluation of a Payments for Ecosystem Services Program on Vegetation Quantity and Quality Restoration in Inner Mongolia. J. Environ. Manag. 2022, 303, 114113. [Google Scholar] [CrossRef] [PubMed]
  44. Yang, Y.; Cai, Z. Ecological Security Assessment of the Guanzhong Plain Urban Agglomeration Based on an Adapted Ecological Footprint Model. J. Clean. Prod. 2020, 260, 120973. [Google Scholar] [CrossRef]
  45. Costanza, R.; de Groot, R.; Sutton, P.; van der Ploeg, S.; Anderson, S.J.; Kubiszewski, I.; Farber, S.; Turner, R.K. Changes in the Global Value of Ecosystem Services. Glob. Environ. Chang. 2014, 26, 152–158. [Google Scholar] [CrossRef]
  46. Ge, F.; Tang, G.; Zhong, M.; Zhang, Y.; Xiao, J.; Li, J.; Ge, F. Assessment of Ecosystem Health and Its Key Determinants in the Middle Reaches of the Yangtze River Urban Agglomeration, China. Int. J. Environ. Res. Public Health 2022, 19, 771. [Google Scholar] [CrossRef]
  47. Guo, B.; Wei, C.; Yu, Y.; Liu, Y.; Li, J.; Meng, C.; Cai, Y. The Dominant Influencing Factors of Desertification Changes in the Source Region of Yellow River: Climate Change or Human Activity? Sci. Total Environ. 2022, 813, 152512. [Google Scholar] [CrossRef]
  48. Keola, S.; Andersson, M.; Hall, O. Monitoring Economic Development from Space: Using Nighttime Light and Land Cover Data to Measure Economic Growth. World Dev. 2015, 66, 322–334. [Google Scholar] [CrossRef]
  49. Lv, Q.; Liu, H.; Wang, J.; Liu, H.; Shang, Y. Multiscale Analysis on Spatiotemporal Dynamics of Energy Consumption CO2 Emissions in China: Utilizing the Integrated of DMSP-OLS and NPP-VIIRS Nighttime Light Datasets. Sci. Total Environ. 2020, 703, 134394. [Google Scholar] [CrossRef]
  50. Kang, P.; Chen, W.; Hou, Y.; Li, Y. Linking Ecosystem Services and Ecosystem Health to Ecological Risk Assessment: A Case Study of the Beijing-Tianjin-Hebei Urban Agglomeration. Sci. Total Environ. 2018, 636, 1442–1454. [Google Scholar] [CrossRef]
  51. Tang, D.; Liu, X.; Zou, X. An Improved Method for Integrated Ecosystem Health Assessments Based on the Structure and Function of Coastal Ecosystems: A Case Study of the Jiangsu Coastal Area, China. Ecol. Indic. 2018, 84, 82–95. [Google Scholar] [CrossRef]
  52. Zhao, Y.; Wang, S.; Zhang, F.; Shen, Q.; Li, J.; Yang, F. Remote Sensing-Based Analysis of Spatial and Temporal Water Colour Variations in Baiyangdian Lake after the Establishment of the Xiong’an New Area. Remote Sens. 2021, 13, 1729. [Google Scholar] [CrossRef]
  53. Peng, J.; Liu, Y.; Wu, J.; Lv, H.; Hu, X. Linking Ecosystem Services and Landscape Patterns to Assess Urban Ecosystem Health: A Case Study in Shenzhen City, China. Landsc. Urban Plan. 2015, 143, 56–68. [Google Scholar] [CrossRef]
  54. Xiao, R.; Yu, X.; Shi, R.; Zhang, Z.; Yu, W.; Li, Y.; Chen, G.; Gao, J. Ecosystem Health Monitoring in the Shanghai-Hangzhou Bay Metropolitan Area: A Hidden Markov Modeling Approach. Environ. Int. 2019, 133, 105170. [Google Scholar] [CrossRef]
  55. Sklenicka, P. Classification of Farmland Ownership Fragmentation as a Cause of Land Degradation: A Review on Typology, Consequences, and Remedies. Land Use Policy 2016, 57, 694–701. [Google Scholar] [CrossRef] [Green Version]
  56. Cao, S.; Yu, N.; Wu, Y.; Wang, Z.; Mi, J. The Educational Level of Rural Labor, Population Urbanization, and Sustainable Economic Growth in China. Sustainability 2020, 12, 4860. [Google Scholar] [CrossRef]
Figure 1. Location of the study area and its topographic features.
Processes 10 02648 g001
Figure 2. Spatial and temporal distribution of land use types in the Baiyangdian basin from 2000 to 2020.
Processes 10 02648 g002
Figure 3. The EQI of the Baiyangdian basin from 2000 to 2020.
Processes 10 02648 g003
Figure 4. Spatial and temporal distribution of EQI in the Baiyangdian basin from 2000 to 2020.
Processes 10 02648 g004
Figure 5. Results of impact factor detection for the spatial and temporal evolution of the EQI.
Processes 10 02648 g005
Figure 6. Results of interaction factor detection for the EQI in the Baiyangdian basin. Note: + means that the two detection factors were non-linear enhancement, and no + means that the two detection factors were two-factor enhancement.
Processes 10 02648 g006
Table 1. Land use classification and eco-environmental indicators.
Level 1 Land Use TypesLevel 2 Land Use TypesBackground Value of Eco-Environmental Quality
CodePrimary Land Use TypesCodeSecondary Land Use Types
1Cropland11Paddy land0.30
12Dry land0.25
2Woodland21Forestland0.95
22Shrub forest0.65
23Sparse forestland0.45
24Other forestland0.40
3Grassland31High-cover grassland0.75
32Medium-cover grassland0.45
32Low-cover grassland0.20
4Water area41River canal0.55
42Lake0.75
43Reservoir pit0.55
46Bottom land0.55
5Construction land51Urban land0.20
52Rural settlement0.20
53Other construction land0.15
6Unused land61Sand0.01
63Saline-alkali land0.05
64Marshland0.65
65Bare land0.05
66Exposed rock land0.01
Table 2. GeoDetector indicator system and unit.
CategoryDetecting FactorsUnit
TopographyTopographic relief (X1)m
Slope (X2)°
Altitude (X3)m
ClimatePrecipitation (X4)mm
Temperature (X5)°C
Soil and vegetationSoil type (X6)Dimensionless
Organic carbon content of soil (X7)g/kg
NDVI (X8)Value
Human activitiesLand use intensity (X9)Value
Population density (X10)person/km2
Nighttime lighting (X11)Value
LocationDistance from road (X12)km
Distance from railway (X13)km
Table 3. Land use patterns in the Baiyangdian basin from 2000 to 2020.
20002005201020152020
Area
km2
ProportionArea
km2
ProportionArea
km2
ProportionArea
km2
ProportionArea
km2
Proportion
Paddy land1040.31%1510.46%1620.49%910.28%420.13%
Dry land14,66044.32%14,56544.03%14,48243.78%13,47940.75%13,35640.36%
Forestland24617.44%24627.44%24647.45%30049.08%30379.18%
Shrub forest367911.12%367811.12%367411.11%31359.48%31469.51%
Sparse forestland6722.03%6722.03%6862.07%6902.09%6832.06%
Other forestland1670.50%1780.54%1780.54%1270.38%1240.38%
High-cover grassland28998.76%29008.77%30159.11%29939.05%29598.94%
Medium-cover grassland373211.28%372211.25%355510.75%348710.54%33009.97%
Low-cover grassland12433.76%12373.74%12273.71%11213.39%12413.75%
River canal1130.34%1130.34%1130.34%1740.53%1740.52%
Lake510.15%480.14%370.11%340.10%680.21%
Reservoir pit970.29%950.29%910.27%1070.32%1130.34%
Bottom land5971.80%5361.62%5181.57%3331.01%3801.15%
Urban land3901.18%4771.44%5101.54%7522.27%7382.23%
Rural settlement20646.24%20716.26%20846.30%28218.53%29268.84%
Other construction land1310.40%1550.47%2610.79%5201.57%6231.88%
Sand40.01%40.01%40.01%10.00%10.00%
Saline-alkali land00.00%00.00%00.00%10.00%00.00%
Marshland00.00%00.00%00.00%2060.62%1720.52%
Bare land80.03%80.02%80.02%10.00%10.00%
Exposed rock land100.03%100.03%100.03%00.00%70.02%
Table 4. Direction of land use change in the Baiyangdian basin from 2000 to 2020.
RankThe Direction of Land Use ChangeNC (km2)
1Dry land→rural settlement755.3776
2Shrub forest→forestland473.6854
3Dry land→urban land266.3679
4Dry land→other construction land239.8301
5Bottom land→marshland135.2766
6Medium-cover Grassland→high-cover Grassland117.4426
7Medium-cover Grassland→other construction land102.8970
8Medium-cover Grassland→low-cover Grassland80.9788
9Rural settlement→urban land48.3221
10Paddy land→dry land47.8082
Publisher’s Note: MDPI stays neutral with regard to jurisdictional claims in published maps and institutional affiliations.

