Article

Experiment on Gas–Liquid Sulfur Relative Permeability under High-Temperature High-Pressure Sour Gas Reservoir Condition

1
State Key Laboratory of Oil and Gas Reservoir Geology and Exploitations, Southwest Petroleum University, Chengdu 610500, China
2
PetroChina Southwest Oil & Gas Field Company, Chengdu 610500, China
3
Sinopec Zhongyuan Oilfield Company, Puyang 457001, China
*
Author to whom correspondence should be addressed.
Processes 2022, 10(10), 2129; https://doi.org/10.3390/pr10102129
Submission received: 29 August 2022 / Revised: 11 October 2022 / Accepted: 12 October 2022 / Published: 19 October 2022

Abstract

:
In the development of high temperature sour gas reservoirs, gas–liquid sulfur two phase percolations exist, which have a significant impact on the gas permeability and gas well productivity. There are currently few reports on experimental studies on gas–liquid sulfur relative permeability. This study improves the experimental equipment and process, and it proposes an experimental method for measuring the gas–liquid sulfur relative permeability curve. Several typical core samples from a sour gas reservoir in Sichuan Basin, China were selected for experimental study, and the gas–liquid sulfur relative permeability under high temperature and high pressure (HTHP) was measured. The results show that, first, the critical flowing saturation of liquid sulfur was 40%, and the gas–liquid sulfur co-flow zone was narrow. With the increase in the liquid sulfur saturation, the gas relative permeability decreased rapidly. Second, the better the physical properties of the core, the greater the damage of liquid sulfur to the core properties. The residual liquid sulfur saturation of the fractured core was higher than matrix core, and as liquid sulfur saturation increased, so did the damage to gas permeability. Third, temperature had an effect on the gas–liquid sulfur relative permeability. Gas relative permeability decreased as the temperature rose, while the liquid sulfur relative permeability remained essentially constant. Fourth, the rock effective stress had a significant impact on the gas–liquid sulfur relative permeability. The relative permeability of gas and liquid sulfur decreased as the effective stress increased, and the fractured core was more sensitive to stress.

1. Introduction

Natural gas is a high-quality, eco-friendly energy source and fuel, and its share of the world’s primary energy constituent is growing. Sour gas reservoirs are abundant and widely distributed all over the world, which is an important part of natural gas exploitation [1]. When the sulfur concentration exceeds the sulfur solubility during the development of sour gas reservoirs, dissolved elemental sulfur will be precipitated from natural gas and deposited in the formation as pressure decreases. Solid sulfur deposition will significantly reduce the porosity and permeability in conventional sour reservoirs. The formation temperature of some HTHP sour gas reservoirs is higher than the melting point of elemental sulfur (119 °C), and the sulfur precipitated exists in the liquid phase. When the liquid sulfur saturation exceeds the residual saturation, two phase gas–liquid sulfur percolations form in the reservoir. The continuous precipitation and deposition of liquid sulfur reduces porosity and permeability, affecting the gas flow ability and reducing the gas well productivity [2]. The measurement of the gas–liquid sulfur relative permeability is useful for studying the effect of liquid sulfur on gas well productivity and gas reservoir development, and it is critical for analyzing the gas well production status, predicting the gas reservoir production performance, and guiding the development of gas reservoir development plans.
The liquid sulfur precipitation process is similar to the gas condensate and asphaltene precipitation processes. Changes in pressure or temperature cause the fluid’s constituents to precipitate. Liquid sulfur precipitation has a lower flow capacity than condensate precipitation, and the precipitation is more similar to asphaltene precipitation, which is difficult to deal with. At the moment, research on gas-condensate relative permeability and asphaltene precipitation has made some headway. Jamolahmady [3] carried out a gas-condensate relative permeability measurement experiment of a low permeability core. Kalla [4] conducted relative permeability measurements and concluded that laboratory measurements must be performed under reservoir conditions using actual reservoir fluids. Rahimzadeh [5] studied the effect of condensate blockage on the pressure drop near the well bore. Hassan [6] analyzed and summarized the condensate removal treatments as well as the causes and instants of condensate banking in gas reservoirs. Khormali [7,8] investigated the effect of reservoir pressure and temperature on the amount of asphaltene precipitation, and developed a new asphaltene inhibitor to reduce the occurrence of the asphaltene precipitate. The above research findings are helpful to investigate the impact of liquid sulfur precipitation on sour gas reservoirs.
However, the relevant experimental study on the relative permeability of gas–liquid sulfur is insufficient. Existing studies have mainly focused on the theoretical study and the impact of solid sulfur deposition on sour gas reservoirs and gas wells. Kuo [9] established the empirical relationship between sulfur deposition and permeability. Based on thermodynamics, Chrastil [10] developed an equation model that can be used to calculate the sulfur solubility. Roberts [11] fitted the Chrastil model and investigated the effect of sulfur deposition near the wellbore, believing that the rate of sulfur buildup in the formation is inversely proportional to the square of the radial distance from the well. Mei [12] presented an evaluation method for assessing the effect of sulfur deposition on gas deliverability. Guo [13] developed a gas–liquid–solid mathematical model to predict sulfur deposition based on the characteristics of the composition and phase behavior of a gas–liquid system. Mahmoud [14] developed analytical and numerical models to predict the effect of sulfur adsorption and deposition on near-wellbore damage. Hu [15] established a reservoir damage model in the presence of non-Darcy flow, which can be used to describe the pressure changes caused by deposited sulfur. Guo [16] established a modified sulfur saturation prediction model and investigated the effect of sulfur deposition on the gas well deliverability. Li [17] proposed a numerical simulation method for high sulfur gas reservoirs with released sulfur in liquid form. Hu [18] proposed an analytical model for dual porosity media that took sulfur deposition into account in order to analyze the effects of sulfur deposition on the well performance in sour carbonate fractured gas reservoirs. Liu [19] developed a model for predicting the gas–liquid sulfur relative permeability by combining a flow resistance model with the fractal theory of porous media. Xu [20] proposed a mathematical model for sulfur deposition that took into account the sulfur particle release; the model could reflect the flow transport during the sulfur deposition process in porous media. Li [21] presented a fractal model for predicting the elemental sulfur saturation in the presence of natural fracture. Based on the partition model and transient percolation theory, Zou [22] developed a numerical model to predict production from fractured horizontal wells in high-sulfur-content gas reservoirs, taking into account the effect of sulfur deposition with pressure changes on the reservoir porosity and permeability.
In terms of experimental research, Coşkuner [23] carried out microvisualization experiments on a gas–water–liquid sulfur three-phase system and discovered that liquid sulfur had little effect on the gas percolation ability. Abou-Kassem [24] investigated the deposition of elemental sulfur in carbonate cores in two separate sets of experiments and discovered that the severity of sulfur plugging depended on the flow rate and initial sulfur concentration. Shedid [25] experimentally studied the influence of elemental sulfur and asphaltene on reservoir damage under joint deposition. Guo [26] investigated the effect of sulfur deposition on reservoir permeability in a sour gas reservoir from a laboratory perspective, and the experimental results showed that the higher the hydrogen sulfide concentration, the more sulfur deposition occurs, and the rock permeability decreases rapidly. Hu [27] carried out core sulfur deposition experiments, and the results indicate that non-movable water can help improve core permeability. Yang [28] developed a method of determining the elemental sulfur deposition at a formation temperature and pressure. Mahmoud [29] performed a coreflood experiment to determine the effect of sulfur deposition on the permeability, porosity, and wettability of carbonate rocks. Maffeis [30] used PVT laboratory equipment to simulate the conditions for the formation of elemental sulfur plugs in wells.
In summary, previous studies have primarily focused on the influence of solid sulfur deposition on the formation physical properties and gas well production due to the shallow burial depth and low formation temperature of previously developed sour gas reservoirs. The majority of liquid sulfur research is based on theoretical models that simulate or predict reservoir damage. There have been few experimental studies on liquid sulfur, particularly on the relative permeability of gas and liquid sulfur.
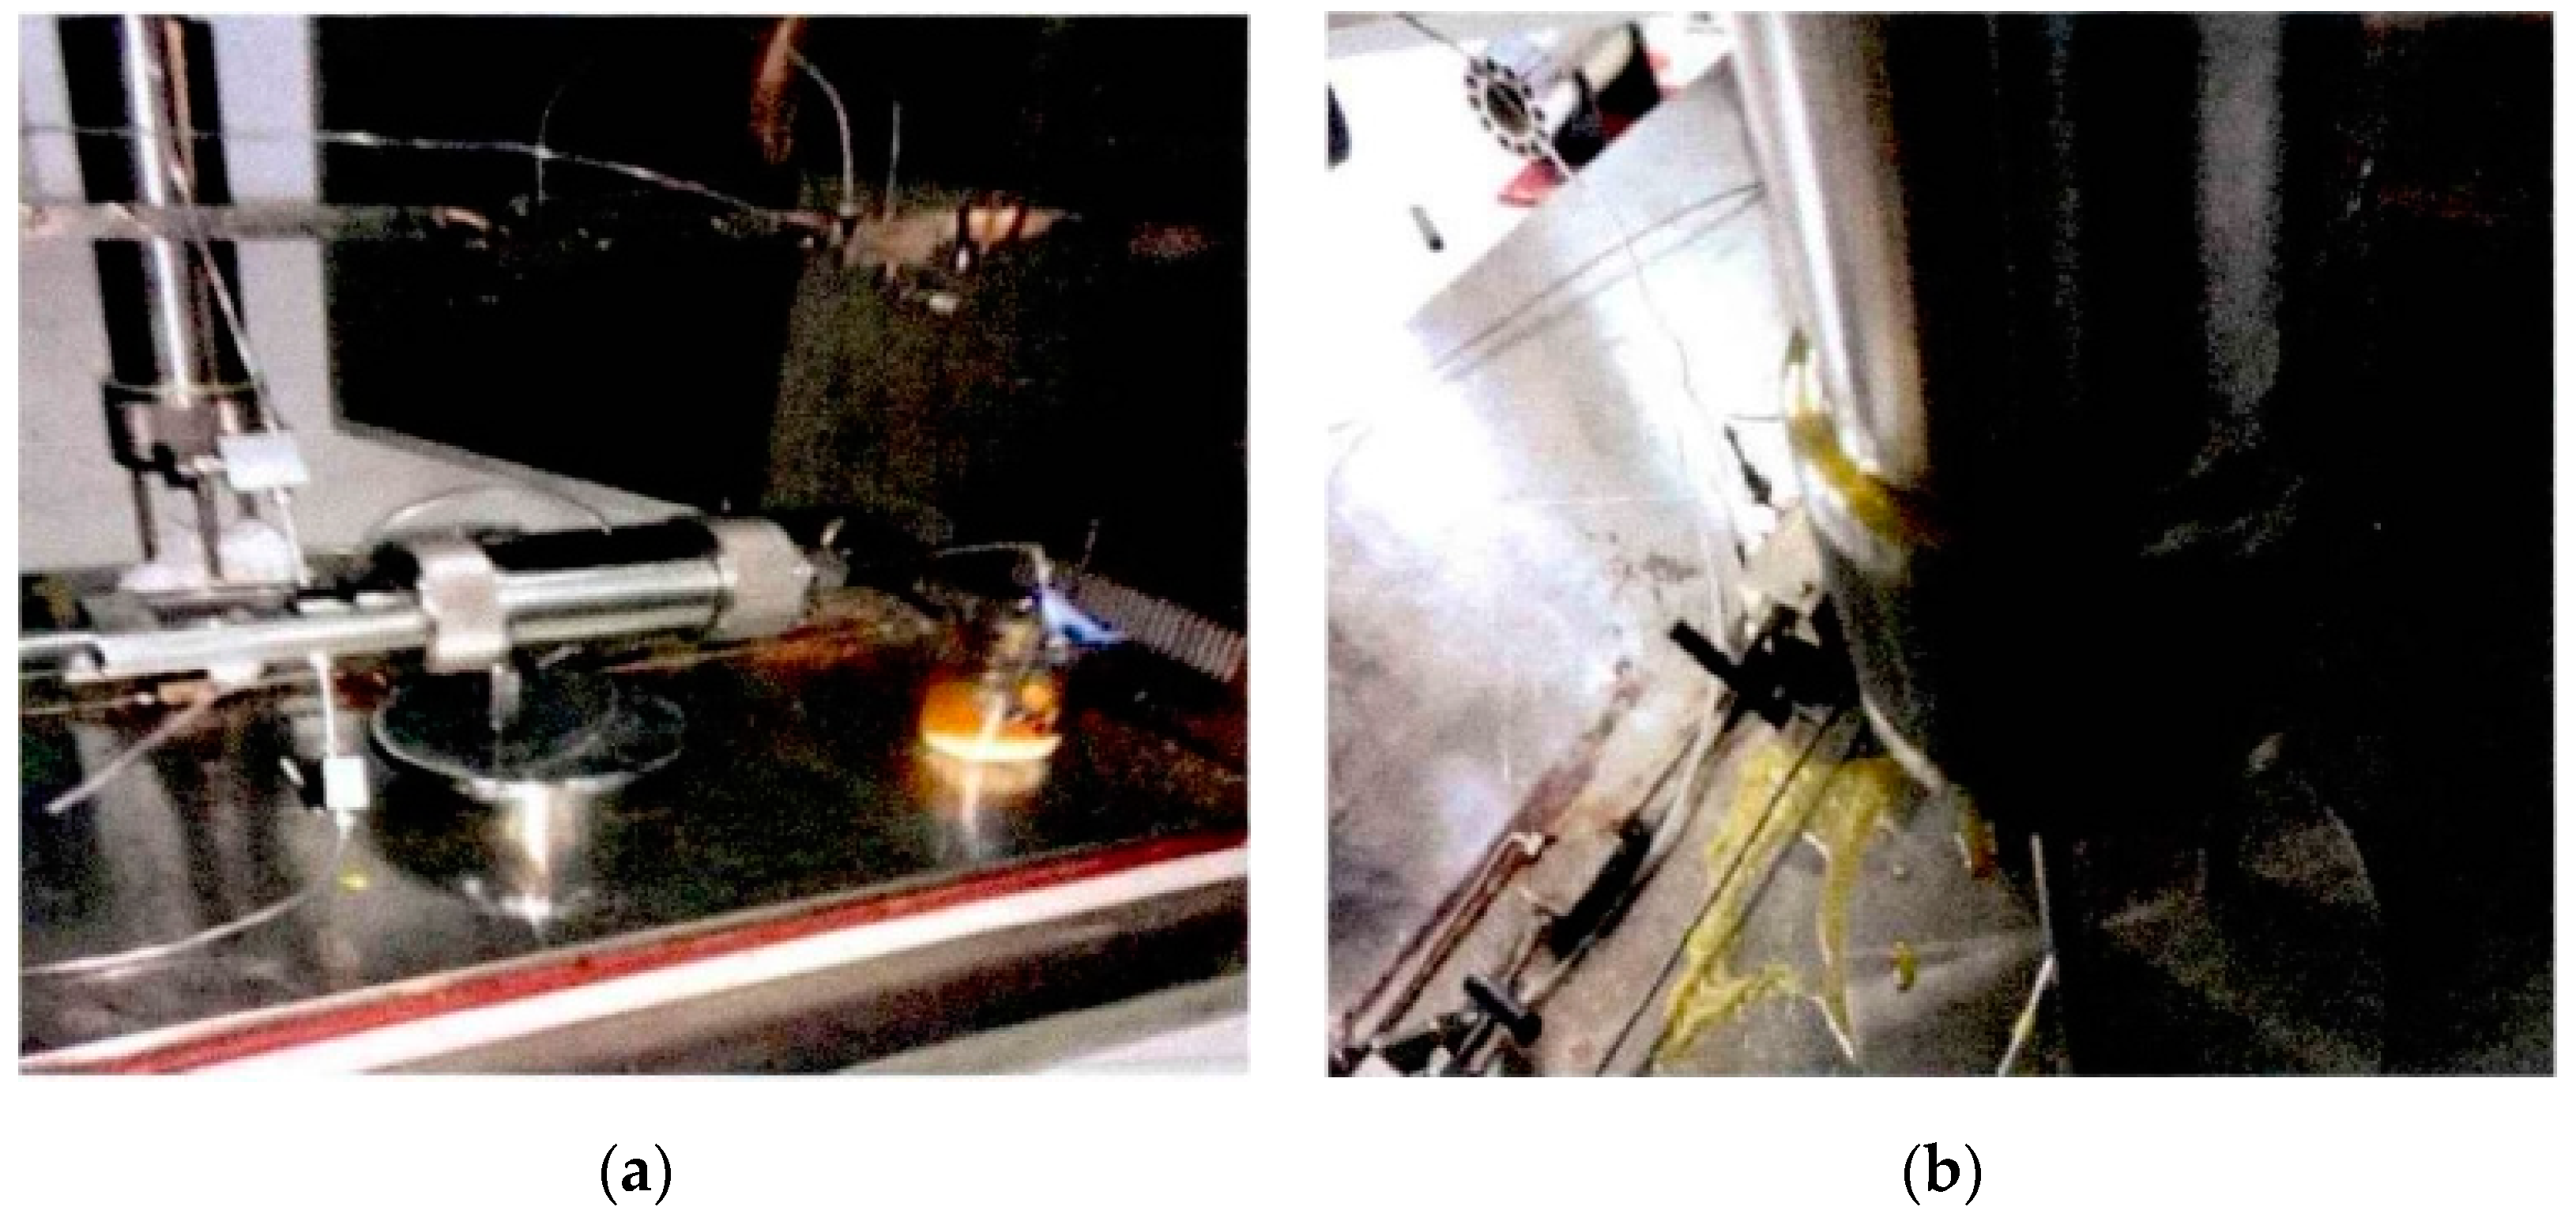
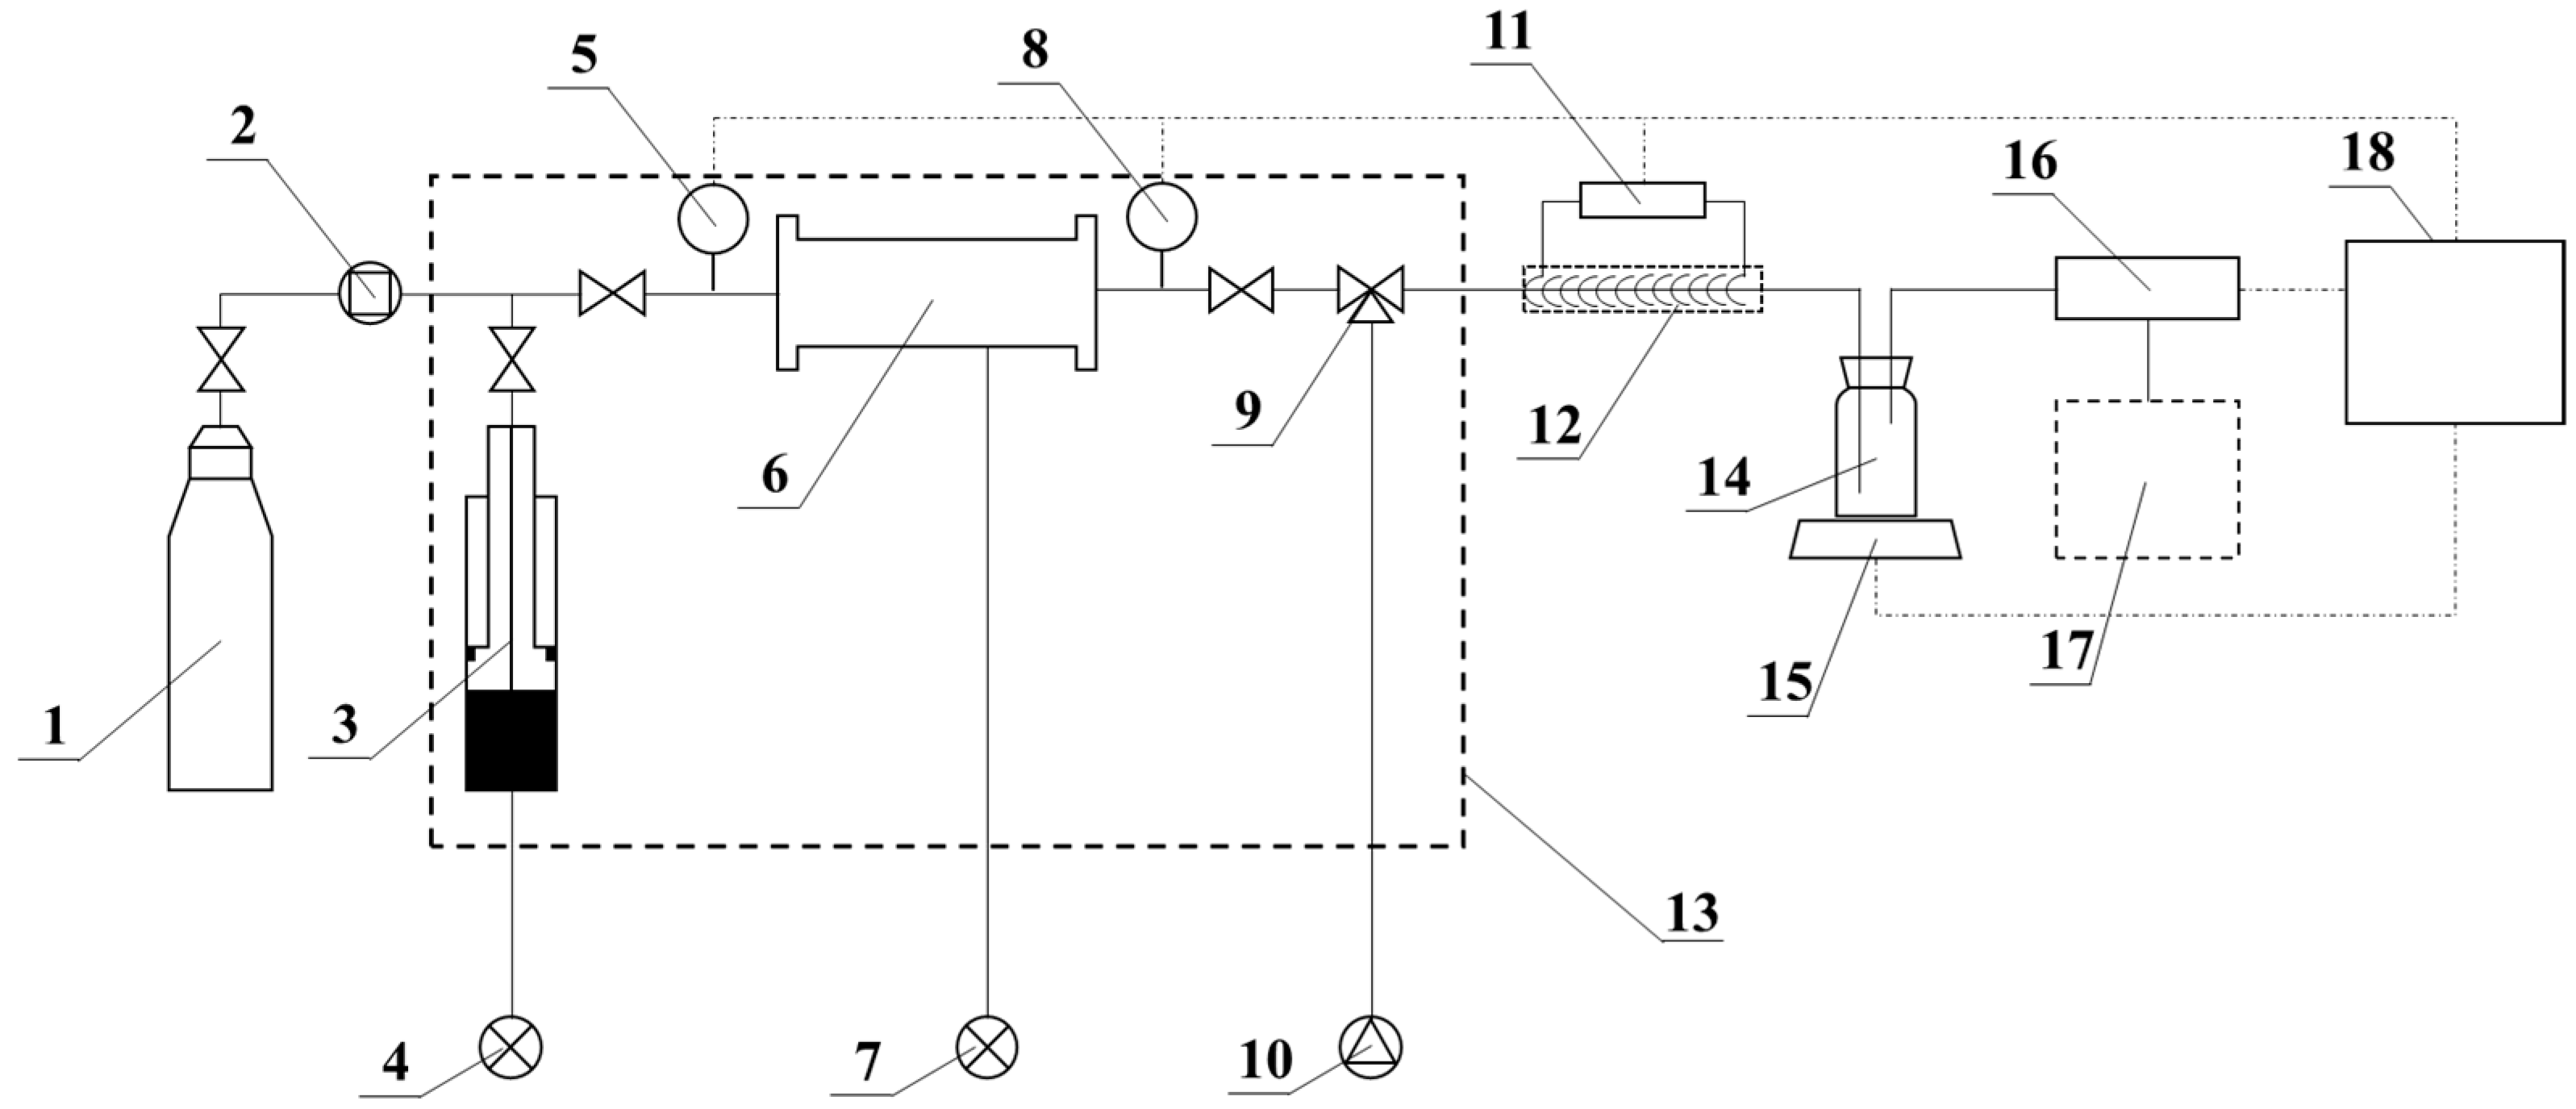
The experimental equipment and process of the HTHP oil–gas–water seepage test device were improved in this study, and an experimental method for measuring the gas–liquid sulfur relative permeability curve proposed to measure the gas–liquid sulfur relative permeability of different core types, temperatures, and confining pressures by the unsteady method, and the characteristics of the gas–liquid sulfur relative permeability curve were analyzed. The findings can be used to assess the productivity of HTHP sour gas wells and guide the rational development of sour gas reservoirs.

2. Experimental Methodology

2.1. Experimental Principle

The experimental methods for measuring relative permeability primarily include the steady-state method and the unsteady-state method. The steady-state method, which is based on one-dimensional Darcy flow theory, is the most fundamental method for calculating relative permeability. This method’s operation principle is straightforward, and the parameters are simple to obtain. The relative permeability curve can be calculated just by the Darcy formula. However, because this method requires the pressure difference and gas flow rate of the core inlet and outlet to be stable, the test period is lengthy.
The unsteady-state method is based on the one-dimensional displacement theory of Buckley–Leverett [31], which states that the saturation distribution varies with time and distance during displacement. The relative permeability of each fluid at the core cross section varies with saturation, and the flow rate of each fluid at the core cross section varies with time. As a result, the relative permeability curve can only be calculated by recording the pressure and flow rate changes of each fluid during displacement. This method can significantly reduce the test time, but data processing is complicated.
The carbonate rock core chosen for this experiment had poor physical properties and a high degree of heterogeneity. When the steady-state method is used, the pressure fluctuation is large and the stability time is long. The gas–liquid sulfur relative permeability testing process is risky, and HTHP conditions have high experimental equipment requirements, so the experimental test time should be as short as possible. As a result, the unsteady-state method was used in this paper.

2.2. Experimental Equipment and Conditions

2.2.1. Experimental Equipment

In this paper, the HA-III Anti-H2S-CO2 HTHP oil–gas–water relative permeability testing equipment was used to carry out the experiment. The equipment consists primarily of a displacement system, a simulation system, a data acquisition system, and a control system. Each system’s devices and functions are as follows:
(a)
Displacement system including the gas booster pump, displacement pump, medium container.
(b)
Simulation system including the core holder, automatic tracking confining pressure pump, back-pressure valve, back-pressure bump, and thermotank.
(c)
Data acquisition and control system including the pressure transmitter, temperature controller, electronic balance, electronic gas flowmeter, and computer. The system can collect the values of pressure, temperature, flow velocity and other parameters as well as control the flow path of the process in real-time.
Some device parameters are shown in Table 1.

2.2.2. Experimental Conditions

(1)
Temperature and pressure: 130–150 °C; 10–50 MPa.
(2)
Experimental sulfur: industrial sulfur with a purity of 99.5%.
(3)
Displacement gas: standard nitrogen with a purity of 99.9%.
(4)
Experimental core: drilling core samples from a typical sour gas reservoir in Sichuan Basin, China.

2.3. Experimental Preparation

2.3.1. Core Selection and Preparation

Since sour gas reservoirs are often characterized by strong heterogeneity, this paper adopted three representative rock samples including one sample with poor physical properties (porosity < 1% and permeability < 10 mD) and two samples with good physical properties (porosity > 1% and permeability > 10 mD). One of the rock samples with good physical properties was made into the fracture rock sample. All rock samples were prepared into standard cores, and after cleaning and drying, the basic parameters of cores were measured and put into the core gripper to prepare for the experiment. The component and basic parameters of the cores are shown in Table 2 and Table 3.

2.3.2. Liquid Sulfur Preparation

To ensure an adequate supply of liquid sulfur during the experiment, liquid sulfur should be prepared separately in the intermediate container prior to the experiment. The following are the steps for making liquid sulfur:
(a)
Wrap the intermediate container evenly with the electric heat-tracing wire, secure it with cable ties.
(b)
Add solid sulfur powder to the intermediate container, and close the intermediate container. The sulfur powder should not exceed the bottom of the screw cap.
(c)
Turn on the power to heat the intermediate container until the sulfur powder turns into liquid sulfur. Choose a ventilated area for heating.
(d)
Because the volume of sulfur powder decreases after it becomes liquid sulfur, the intermediate container must be refilled with sulfur powder and heated again. Repeat the above steps until the liquid sulfur is nearly filled with the intermediate container. Close the intermediate container for experimental use.

2.3.3. Improvement of Experimental Equipment and Process

During the experiment, it was found that the following problems made it difficult to use the experimental equipment directly:
(a)
Liquid sulfur burning (Figure 1a). When the displacement liquid sulfur entered the pipeline at the simulated formation temperature (150 °C) at the start of the experiment, it spontaneously ignited and produced sulfur dioxide, which harmed the experiment process and jeopardized the experimenter’s safety.
(b)
Pipeline plugging by sulfur (Figure 1b). Because the terminal pipeline was not placed in the thermotank during the experiment, its temperature could not be maintained above the melting point of sulfur, resulting in sulfur plugging in the pipeline. Furthermore, even after reheating the pipeline, the sulfur plugging could not be completely removed.
In light of the aforementioned issues, the experimental equipment and process were improved by:
(a)
Cleaning the experiment process with nitrogen in advance to ensure that there was no oxygen in the experiment process and nitrogen was used instead of natural gas to test the gas–liquid sulfur relative permeability.
(b)
Wrapping the asbestos mesh evenly around the electric heat-tracing wire and placing the pipeline outside the thermotank. Connect the electric heat-tracing wire to the temperature controller to ensure that the temperature of the pipeline outside the thermostat corresponds to the temperature inside the thermostat.
The schematic diagram of the improved experimental equipment is shown in Figure 2.

2.4. Experimental Procedures

(1)
Connect each flow line according to the schematic diagram (Figure 3), put the prepared core into the core holder.
(2)
Purge and replace the residual air in the experimental equipment with standard nitrogen, and test the air tightness of each sealing link and equipment connection. After the pressure difference and flow rate have been stabilized, record the inlet and outlet pressures and use the Darcy formula to calculate the absolute permeability of the cores. The permeability calculation formula is as follows:
K = 2 P 0 Q μ L A ( P 1 2 P 2 2 ) × 100
(3)
Put the intermediate container filled with liquid sulfur into the thermotank for heating. Adjust the constant temperature system to 50 °C, 90 °C, 120 °C, and 150 °C successively to let the temperature of the constant temperature system rise slowly and steadily. The melted sulfur powder is heated at 150 °C for more than half an hour to ensure the stable liquid state of sulfur.
(4)
Maintain the thermotank temperature, turn on the electric heat-tracing wire and temperature controller, and set the temperature to 150 °C. Set the liquid injection rate, then gradually and synchronously increase the pressure of the back pressure valve and the confining pressure of the core gripper to the simulated formation pressure until the core is fully saturated with liquid sulfur.
(5)
Replace the liquid sulfur with nitrogen, record the pressure at the core’s inlet and outlet in real-time using the pressure transmitter, and record the total gas production and total liquid sulfur production in real-time using the metering system. The experiment is over when there is no liquid sulfur output at the outlet end.
(6)
Repeat the above experimental steps until the difference in the gas relative permeability at critical flow saturation of liquid sulfur between the last two measurements is less than 5%.
(7)
Change the core type, temperature, and confining pressure, then repeat the experiment to determine the relative permeability of the gas–liquid sulfur under different core properties, temperature, and stress sensitivity. The experimental scheme is shown in Table 4.

2.5. Data Processing

The improved J-B-N method [32] was used in this study to process the experimental data and obtain the gas–liquid sulfur relative permeability curve. The calculation steps are as follows:
(1)
Amend the cumulative gas production measured at atmospheric pressure at the core’s outlet to the cumulative gas production measured at the average core pressure:
V i = V i - 1 + Δ V s i + 2 p a Δ p + 2 p a Δ V g i
V g = V i V s
(2)
Plot the relationship between cumulative gas production ∑Vg, cumulative sulfur production ∑Vs, and cumulative injection time ∑t to obtain the relation curve of Vgt and Vst.
(3)
Take points on the curve to obtain the corresponding gas production ΔVg and sulfur production ΔVs at the same time interval Δt.
(4)
Calculate the gas relative permeability Krg and liquid sulfur relative permeability Krs under different liquid sulfur saturation Sg by using the following formula:
S s = 1 V s V p
q gi = Δ V gi Δ t
q g = K A μ g L Δ p
K rg = q gi q g
f s = Δ V s i Δ V i
f g = Δ V g i Δ V i
K rs = K rg f s f g μ s μ g
(5)
Draw a relationship curve between the relative permeability of the gas–liquid sulfur and the saturation of liquid sulfur.

3. Results and Discussion

3.1. Characteristics of Gas-Liquid Sulfur Relative Permeability Curve

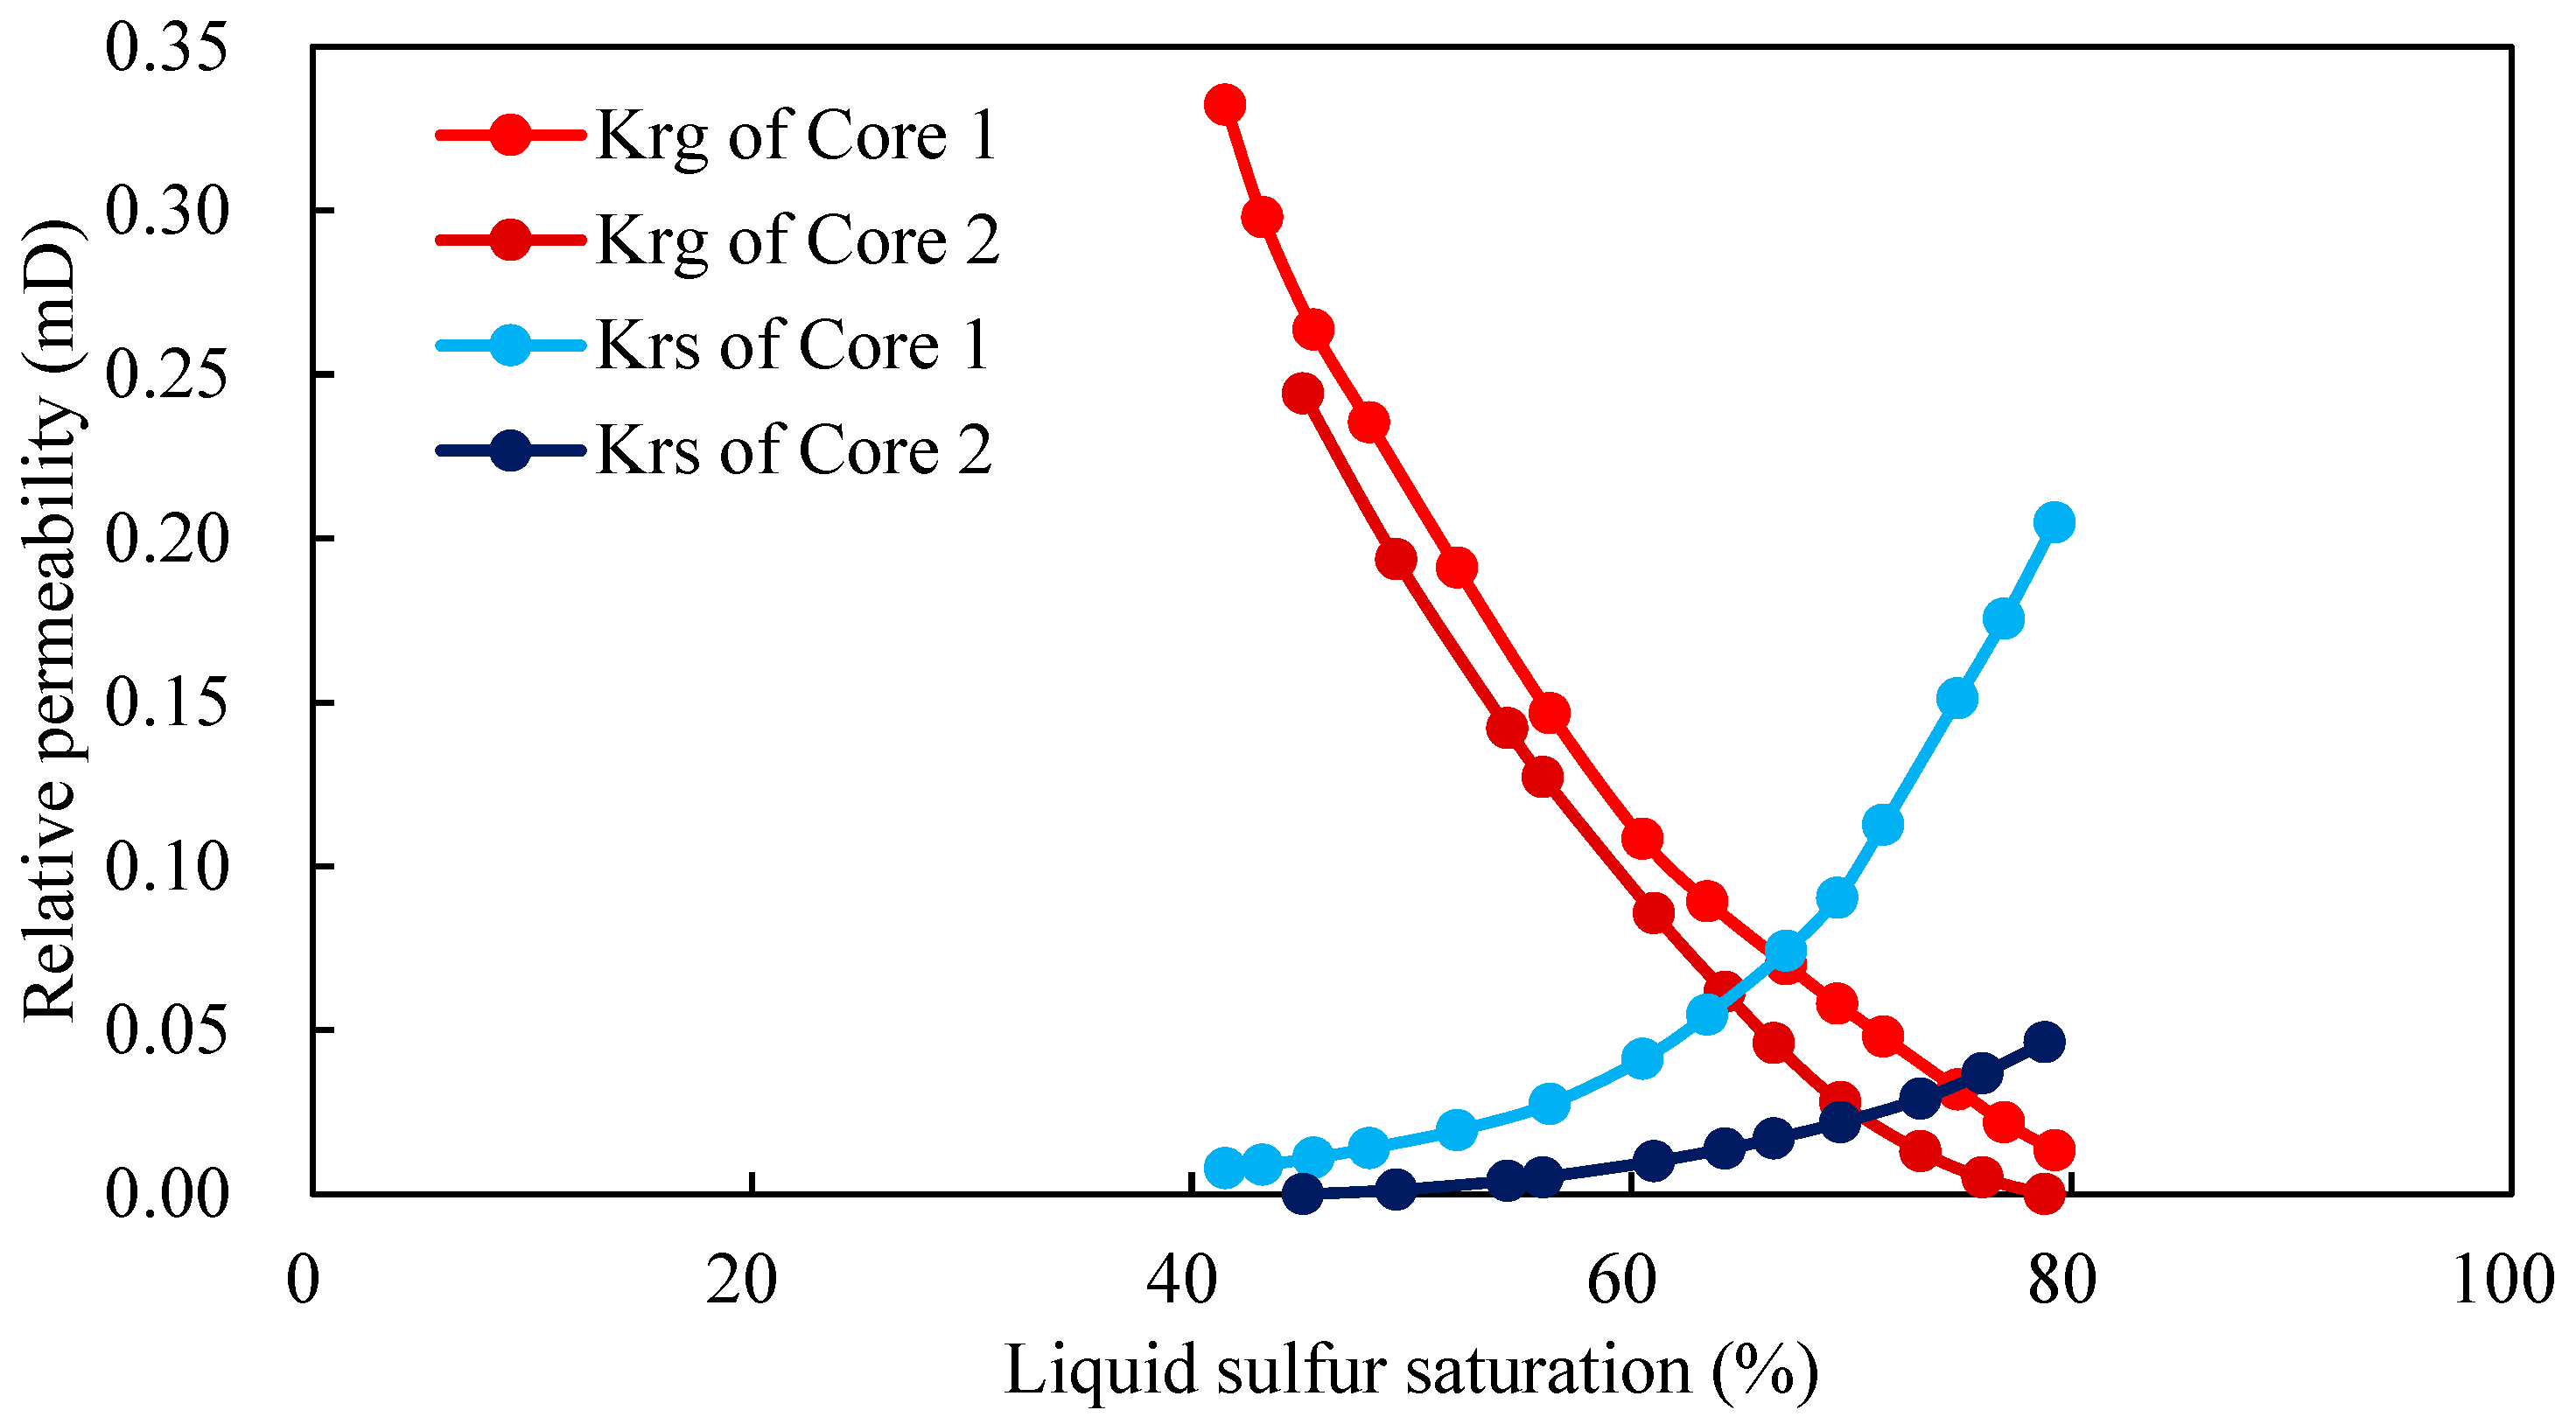
The relative permeability curves measured for each core had roughly the same shape and were all concave curves. As shown in Figure 3, the gas–liquid sulfur relative permeability curve of Core 1 was used as an example (test temperature 150 °C, pressure 50 MPa) to analyze the curve characteristics.
It can be seen that as the liquid sulfur saturation increased, the gas relative permeability decreased rapidly while the liquid sulfur relative permeability increased slowly. The critical flow saturation of liquid sulfur is high, and it can only flow when the saturation of liquid sulfur exceeds 40%. The gas–liquid sulfur co-flow interval is narrow, with a liquid sulfur saturation range of 40–80% in the co-flow interval. As a result, as the amount of liquid sulfur precipitated far from the wellbore is usually small, the majority of the precipitated liquid sulfur in the reservoir will not flow during the production of sour gas reservoirs. Liquid sulfur is easily adsorbed in reservoir pores. For the near-wellbore zone, the amount of precipitated liquid sulfur is large due to the large pressure drop. Meanwhile, a small amount of liquid sulfur far from the wellbore will be carried by gas to the near-wellbore zone, resulting in a relatively high liquid sulfur saturation and mobility. However, high liquid sulfur saturation reduces the gas relative permeability, resulting in lower gas well productivity.

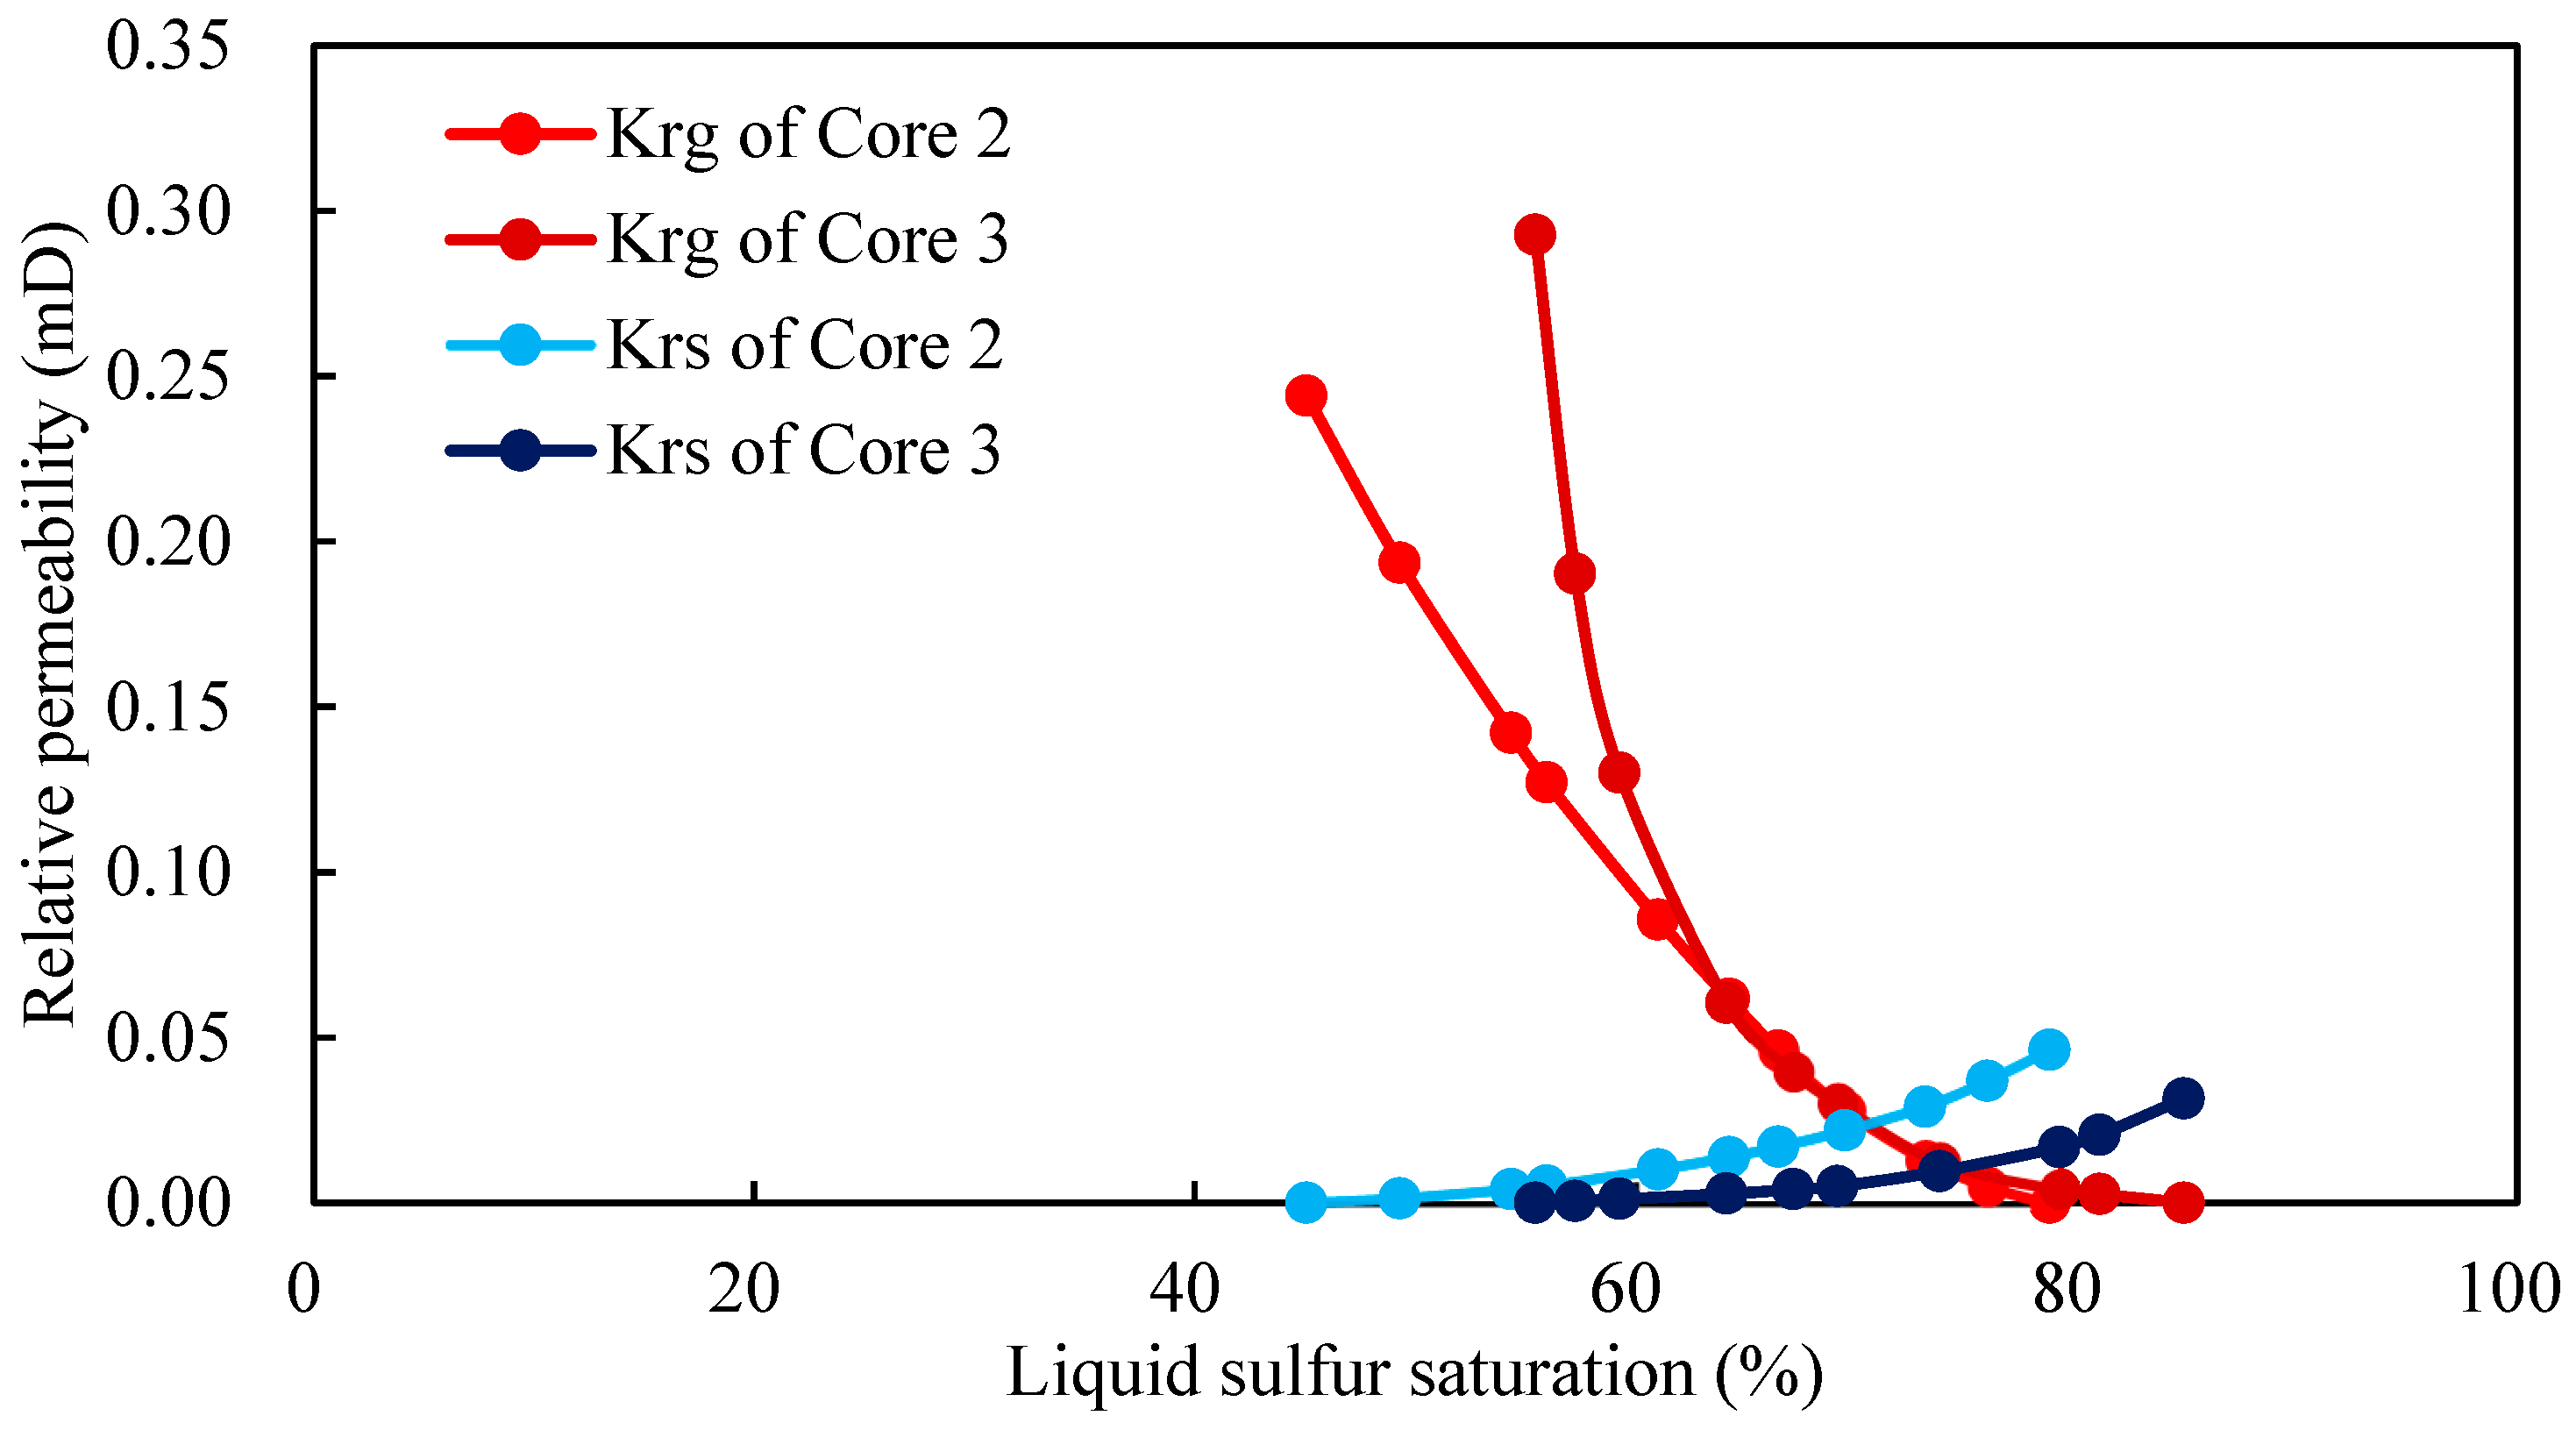
3.2. Effect of Core Type on Relative Permeability Curve

The relative permeability of the gas–liquid in Cores 1, 2, and 3 was measured at the same experimental temperature and confining pressure (150 °C, 30 MPa). The results are shown in Figure 4 and Figure 5 and Table 5.
Comparing the relative permeability curves of Core 1 and Core 2, it can be seen from Figure 4 that the overall curve of Core 2 moved to the lower right. Compared with Core 1, the gas relative permeability of Core 2 was slightly lower, while the liquid sulfur relative permeability was more obvious. The residual liquid sulfur saturation was greater, and the gas–liquid sulfur co-flow interval was narrower. The liquid sulfur saturation at the isopermeability point was higher, while the relative permeability at the isopermeability point was lower. Because Core 2 has good overall physical properties and high absolute permeability, the relative permeability of gas and liquid sulfur was low. Furthermore, the greater the porosity and permeability of the core, the easier it is to form gas breakthrough channeling, resulting in a smaller gas sweep area to the core and lower displacement efficiency to the liquid sulfur. This indicates that in reservoirs with poor physical properties, the adsorbed and deposited liquid sulfur is relatively easy to flow. However, it will be more difficult for liquid sulfur to flow in reservoirs with better physical properties, and the damage to the physical properties of the reservoir will be more severe.
From Figure 5, compared with Core 2, the relative permeability curve of Core 3 moved to the lower right. The gas relative permeability of Core 3 was larger, but the gas–liquid sulfur co-flow interval was narrower, and the gas relative permeability decreased more as the liquid sulfur saturation increased. The saturation of residual liquid sulfur was higher. At the gas–liquid sulfur isopermeability point, the liquid sulfur saturation was higher and the relative permeability was lower. This suggests that the pore structure of reservoir rocks has a significant impact on the relative permeability of the gas–liquid sulfur. The presence of fractures in the reservoir increases the gas permeability, reduces the residual gas saturation, and allows for more gas production. However, it reduces the gas’s displacement efficiency to liquid sulfur. The relative permeability of the gas decreases more rapidly as the liquid sulfur saturation increases. As a result, for wells with natural and artificial fractures in the near-wellbore zone, liquid sulfur adsorption and deposition have little effect on gas well productivity in the early and middle production stages, but productivity declines rapidly in the late production period when the near-wellbore zone liquid sulfur saturation exceeds the critical flow saturation.

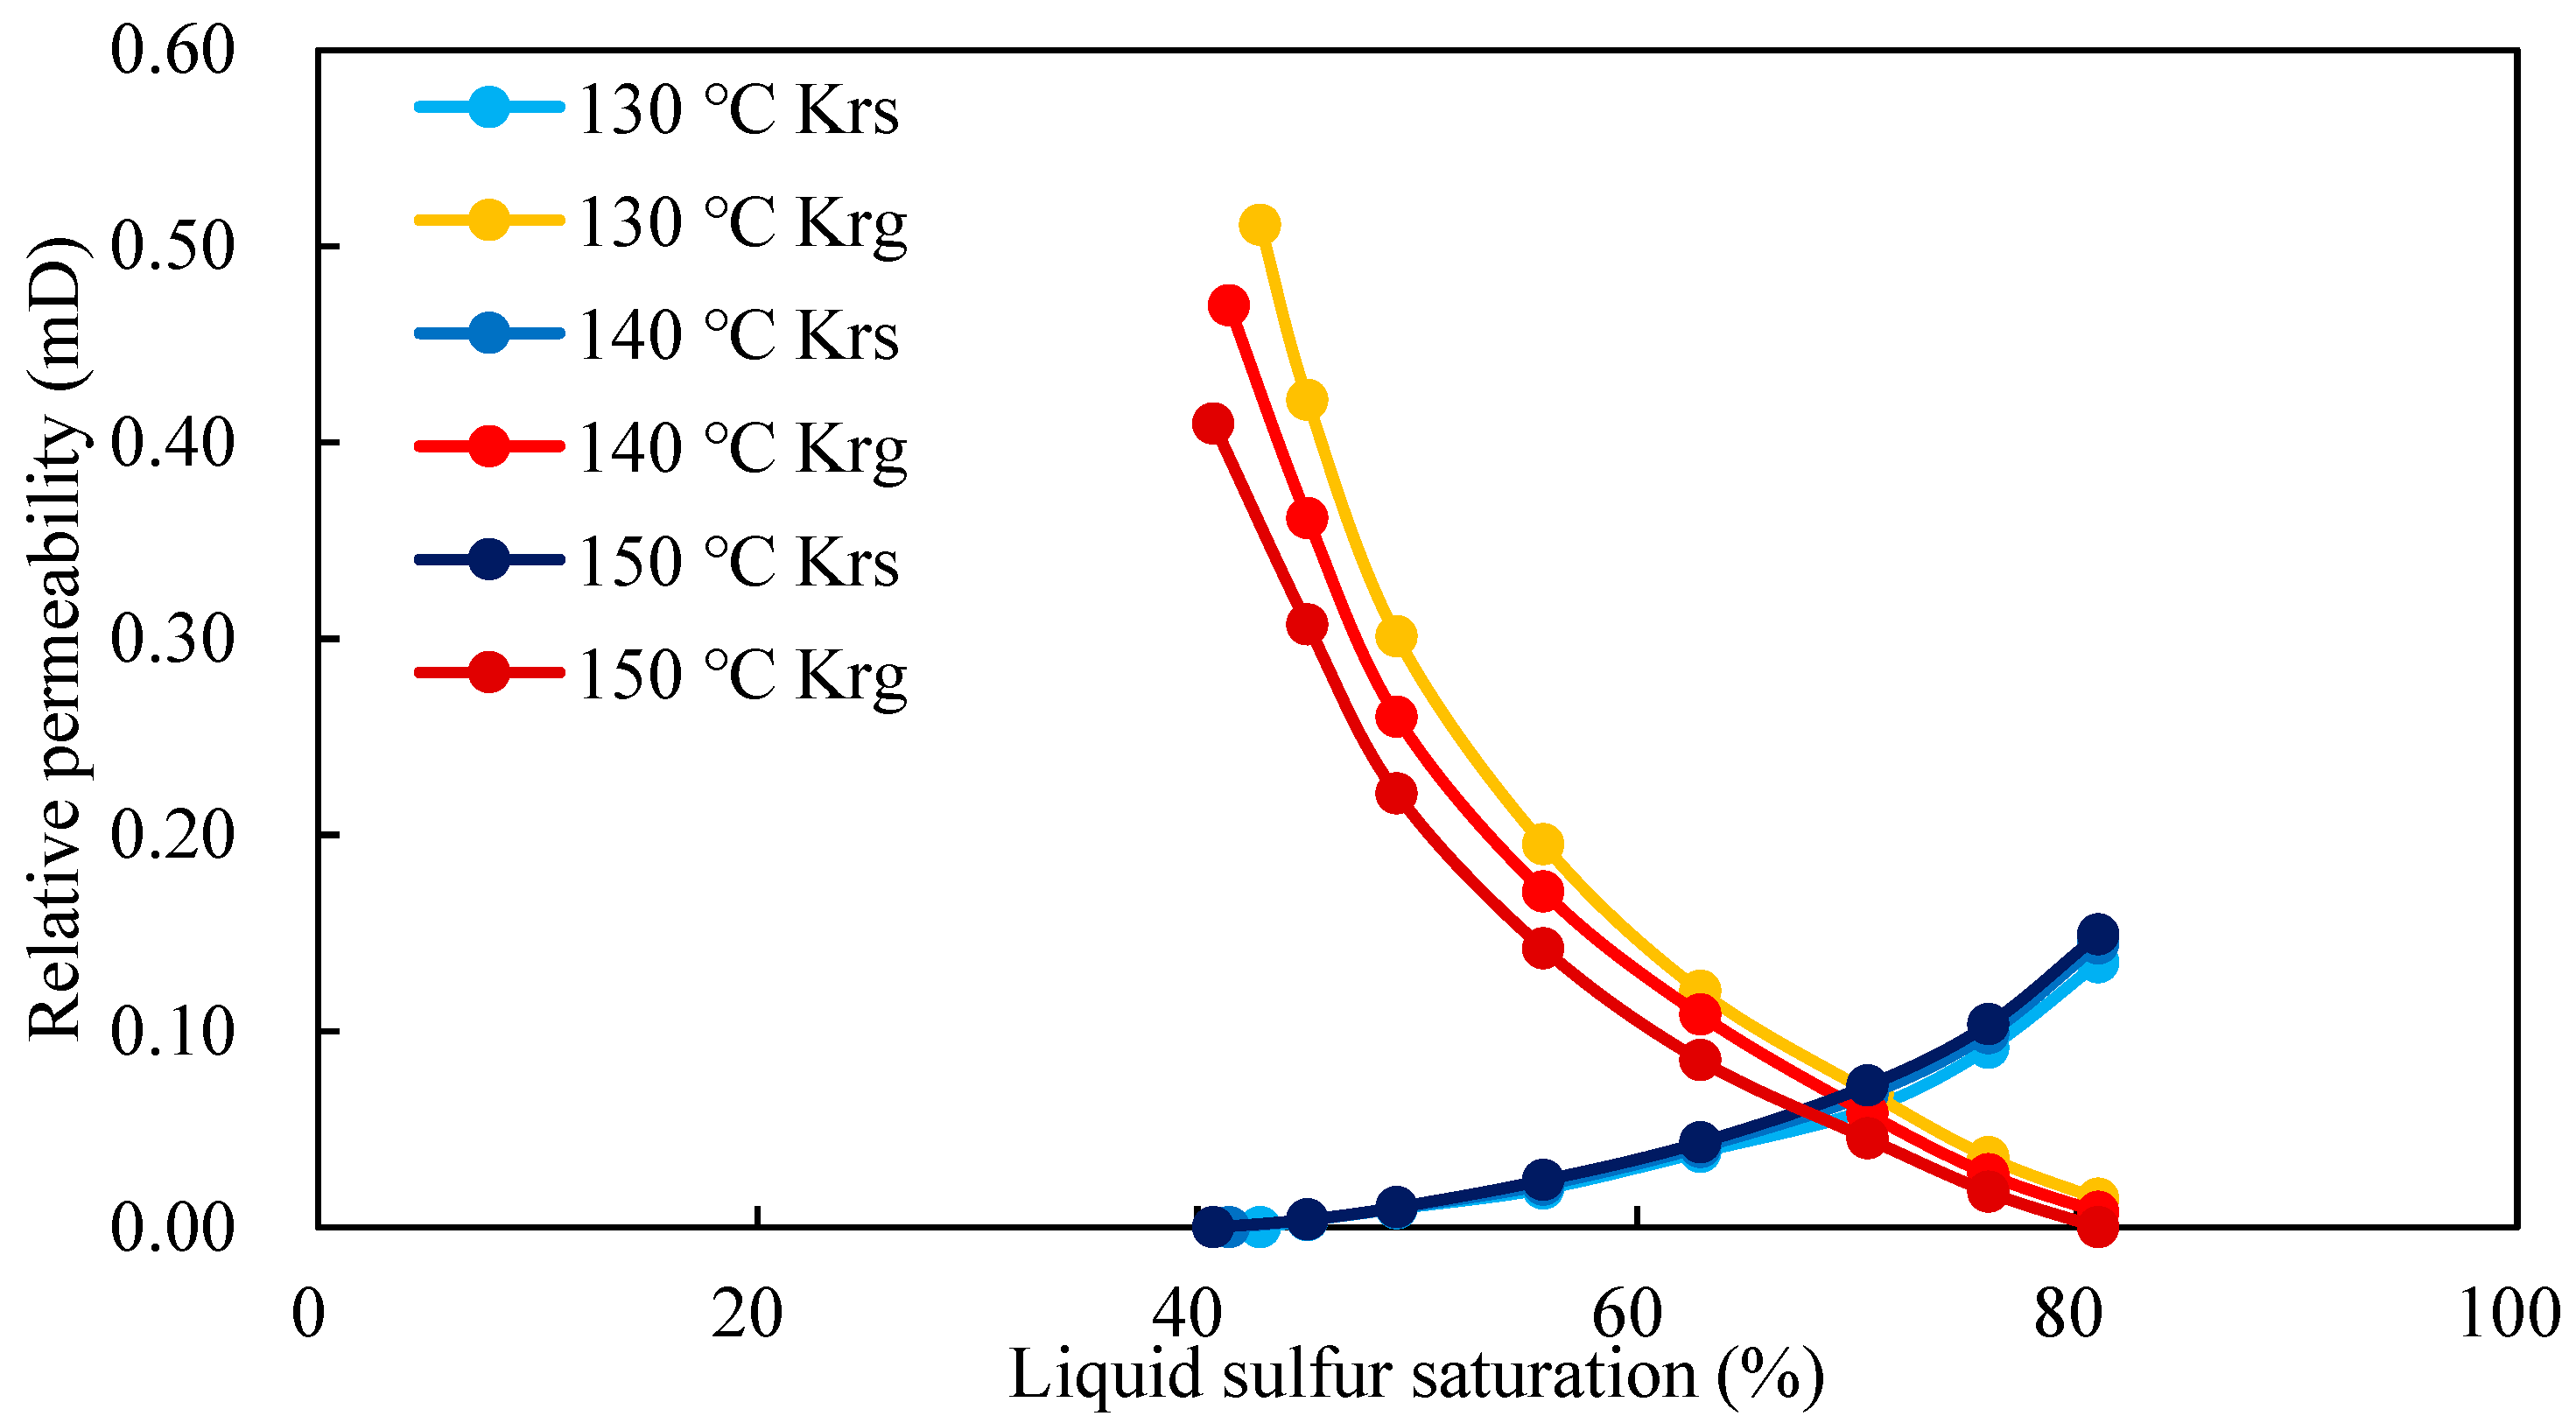
3.3. Effect of Temperature on Relative Permeability Curve

The relative permeability of Core 1 was measured at 130 °C, 140 °C, and 150 °C by changing the experimental temperature, and the results are shown in Figure 6.
It can be seen that temperature had an effect on gas relative permeability, but less so on the liquid sulfur relative permeability. The gas relative permeability decreased as the temperature rose, while the liquid sulfur relative permeability decreased slightly but essentially remained unchanged. The isopermeability point shifted to the lower left, the corresponding liquid sulfur saturation and relative permeability dropped, and the area of the two-phase co-flow interval remained essentially unchanged. This phenomenon corresponds to previous theoretical research findings [33]. This is because temperature changes cause changes in the density, viscosity, and other physical properties of the gas, reducing the gas flow capacity. Furthermore, as temperature rises, the core skeleton is slightly deformed and expanded, some throats close and dead pores form, reducing the effective porosity and permeability of the core [34,35]. Furthermore, temperature changes may affect the adsorption capacity of liquid sulfur on the rock surface, affecting the relative permeability of liquid sulfur and gas. However, the related phenomenon is still unknown, and more research is required. With increasing temperature, these combined effects result in a significant decrease in the gas relative permeability.

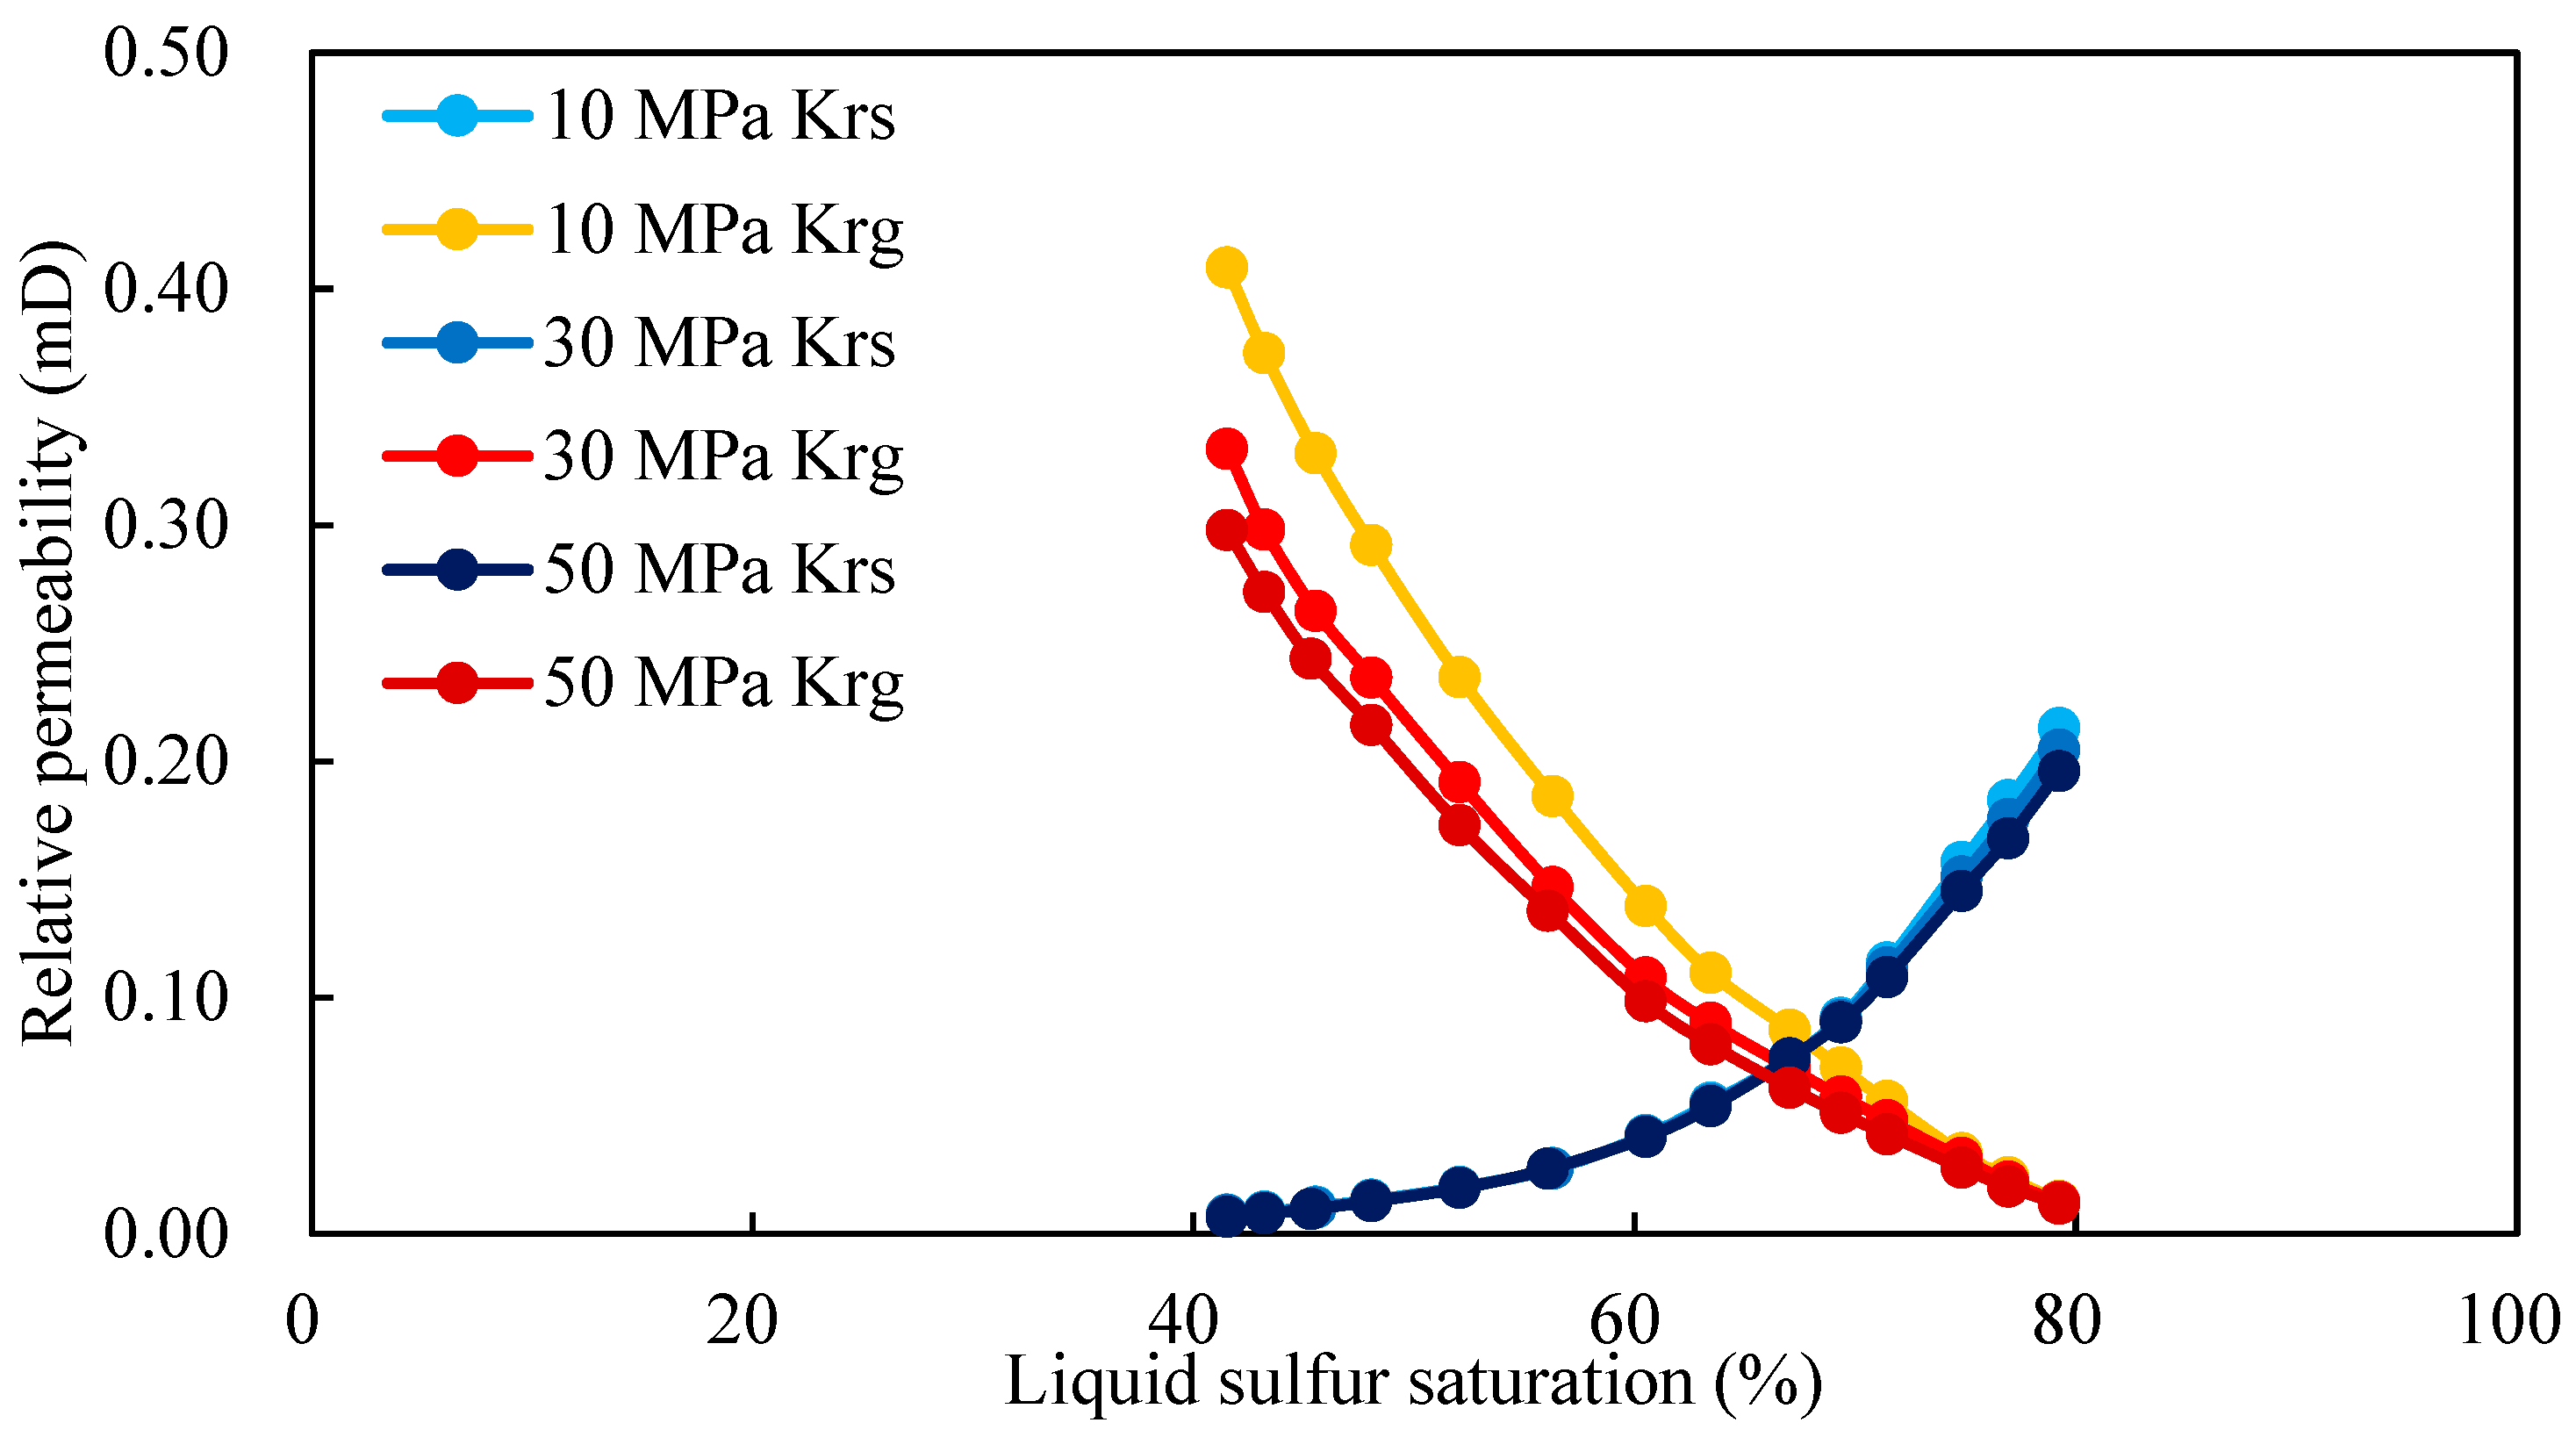
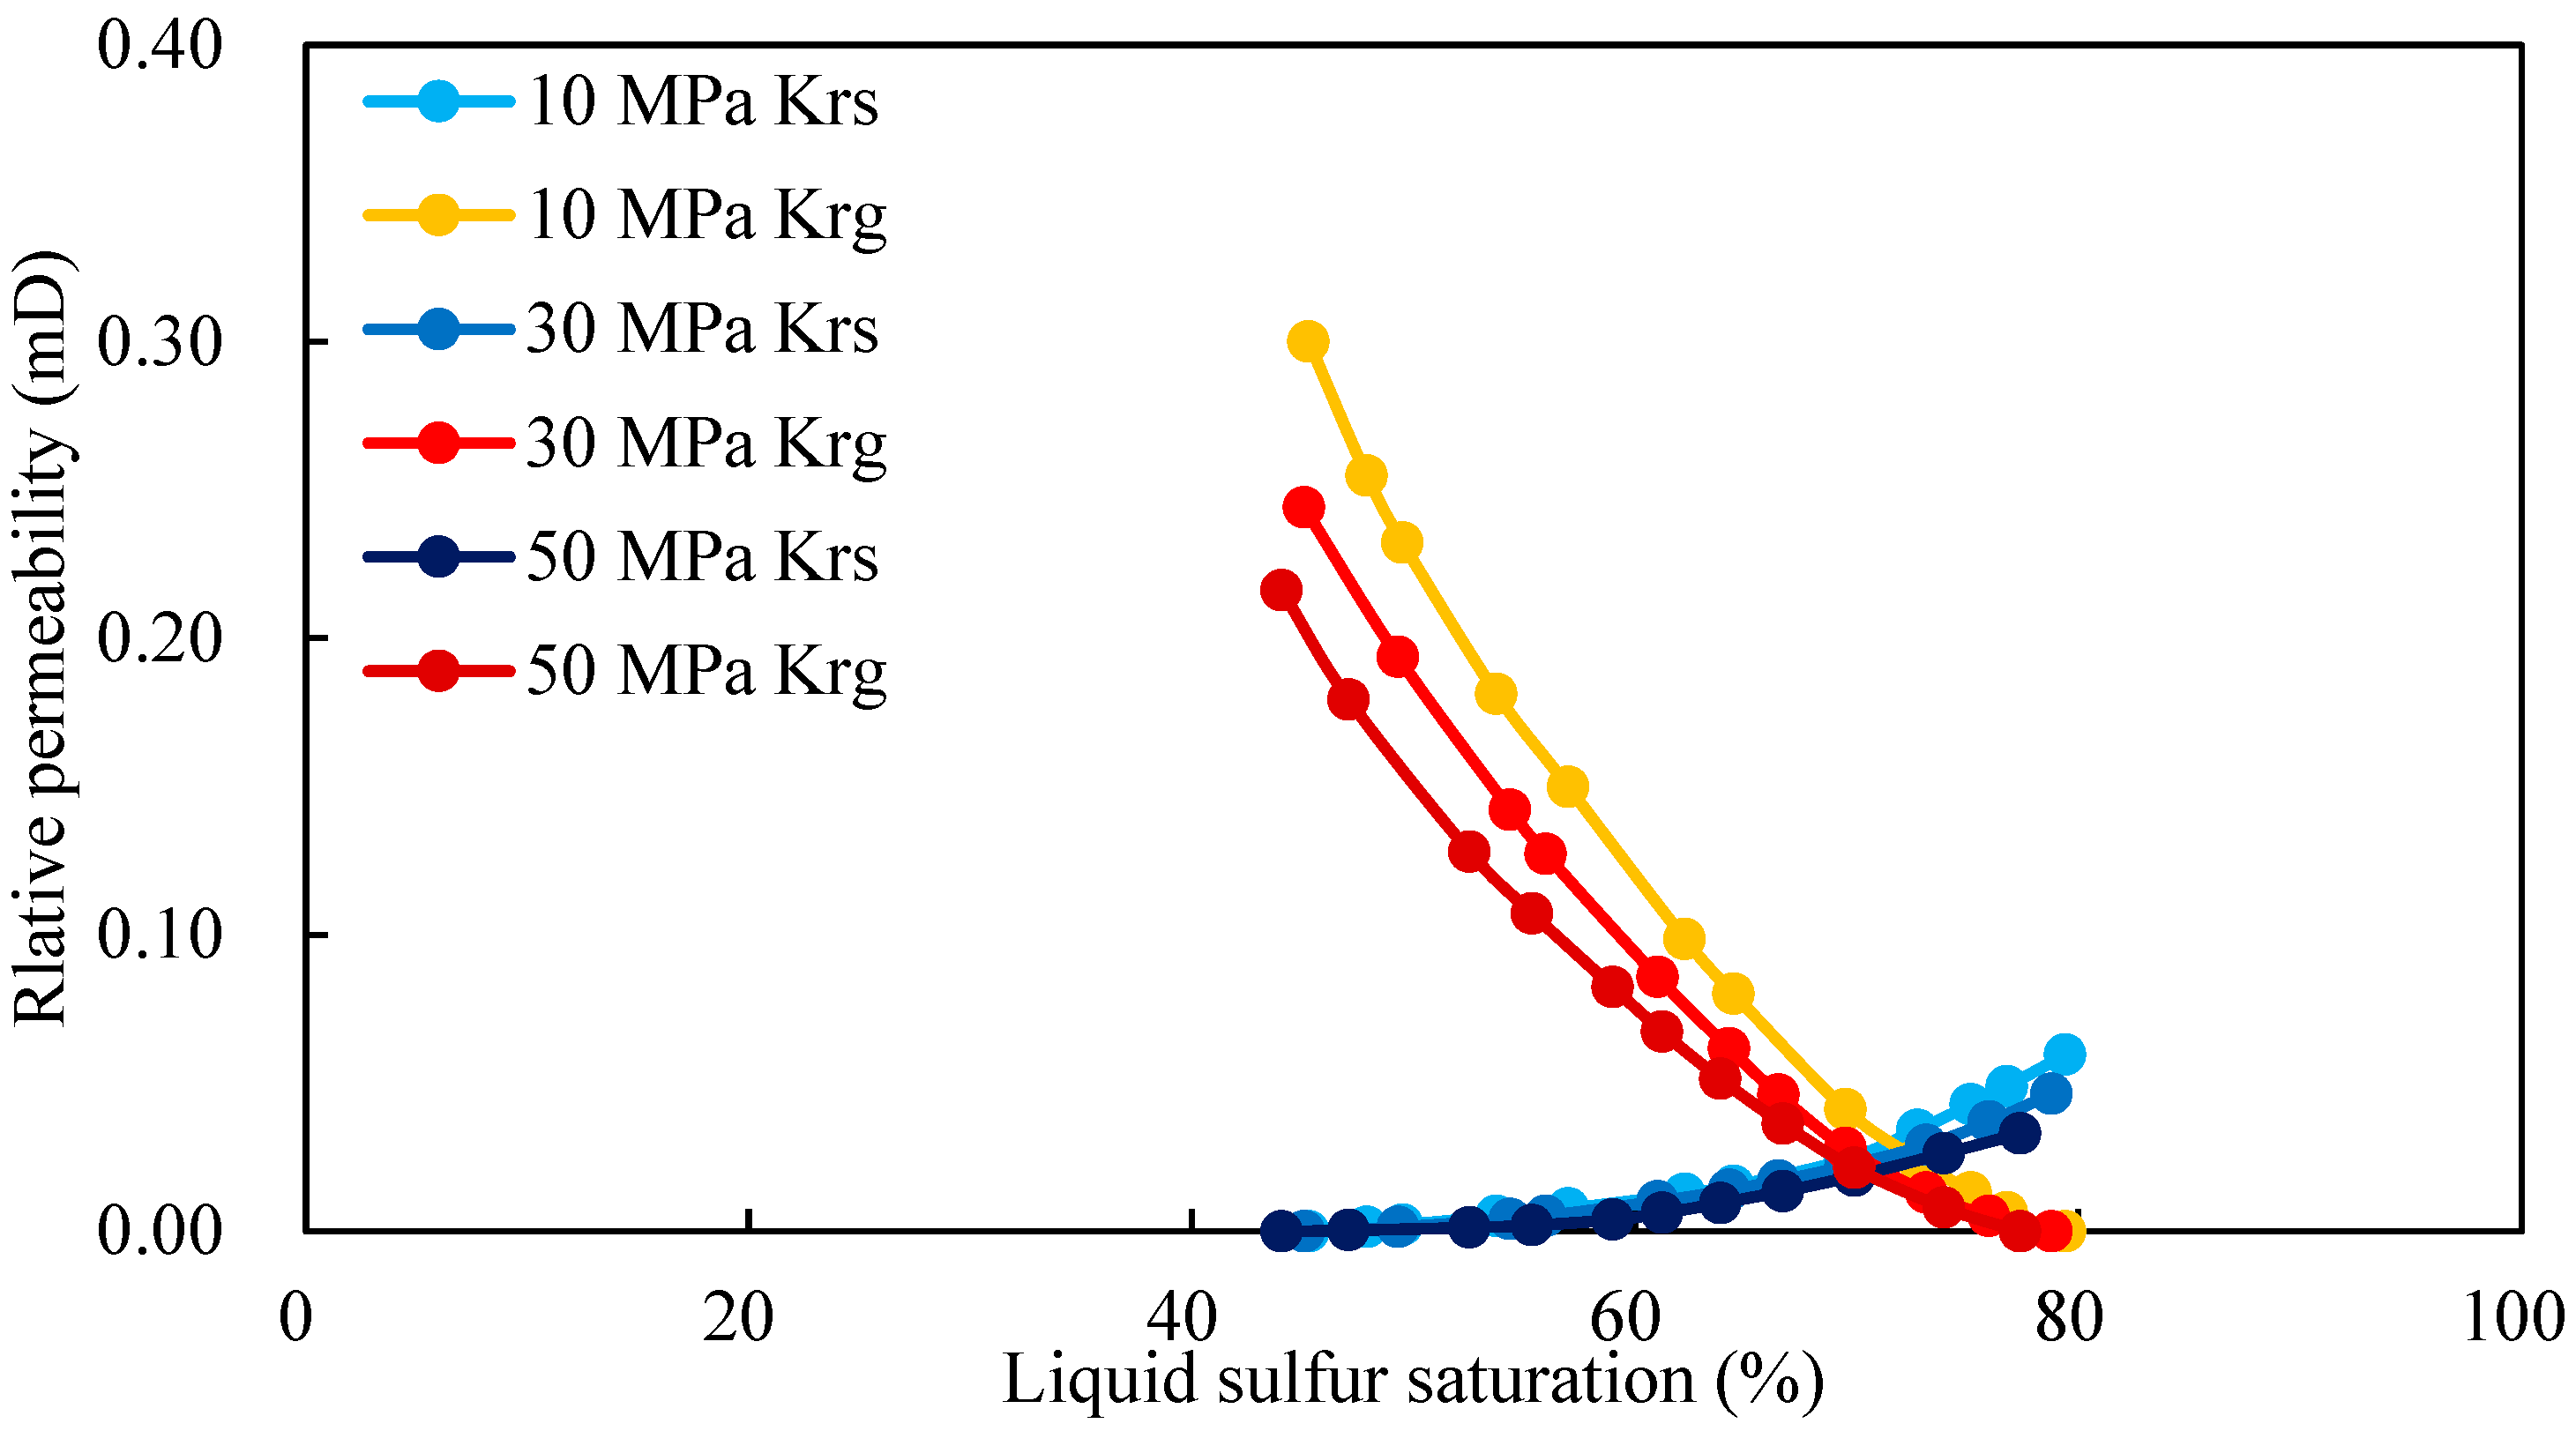
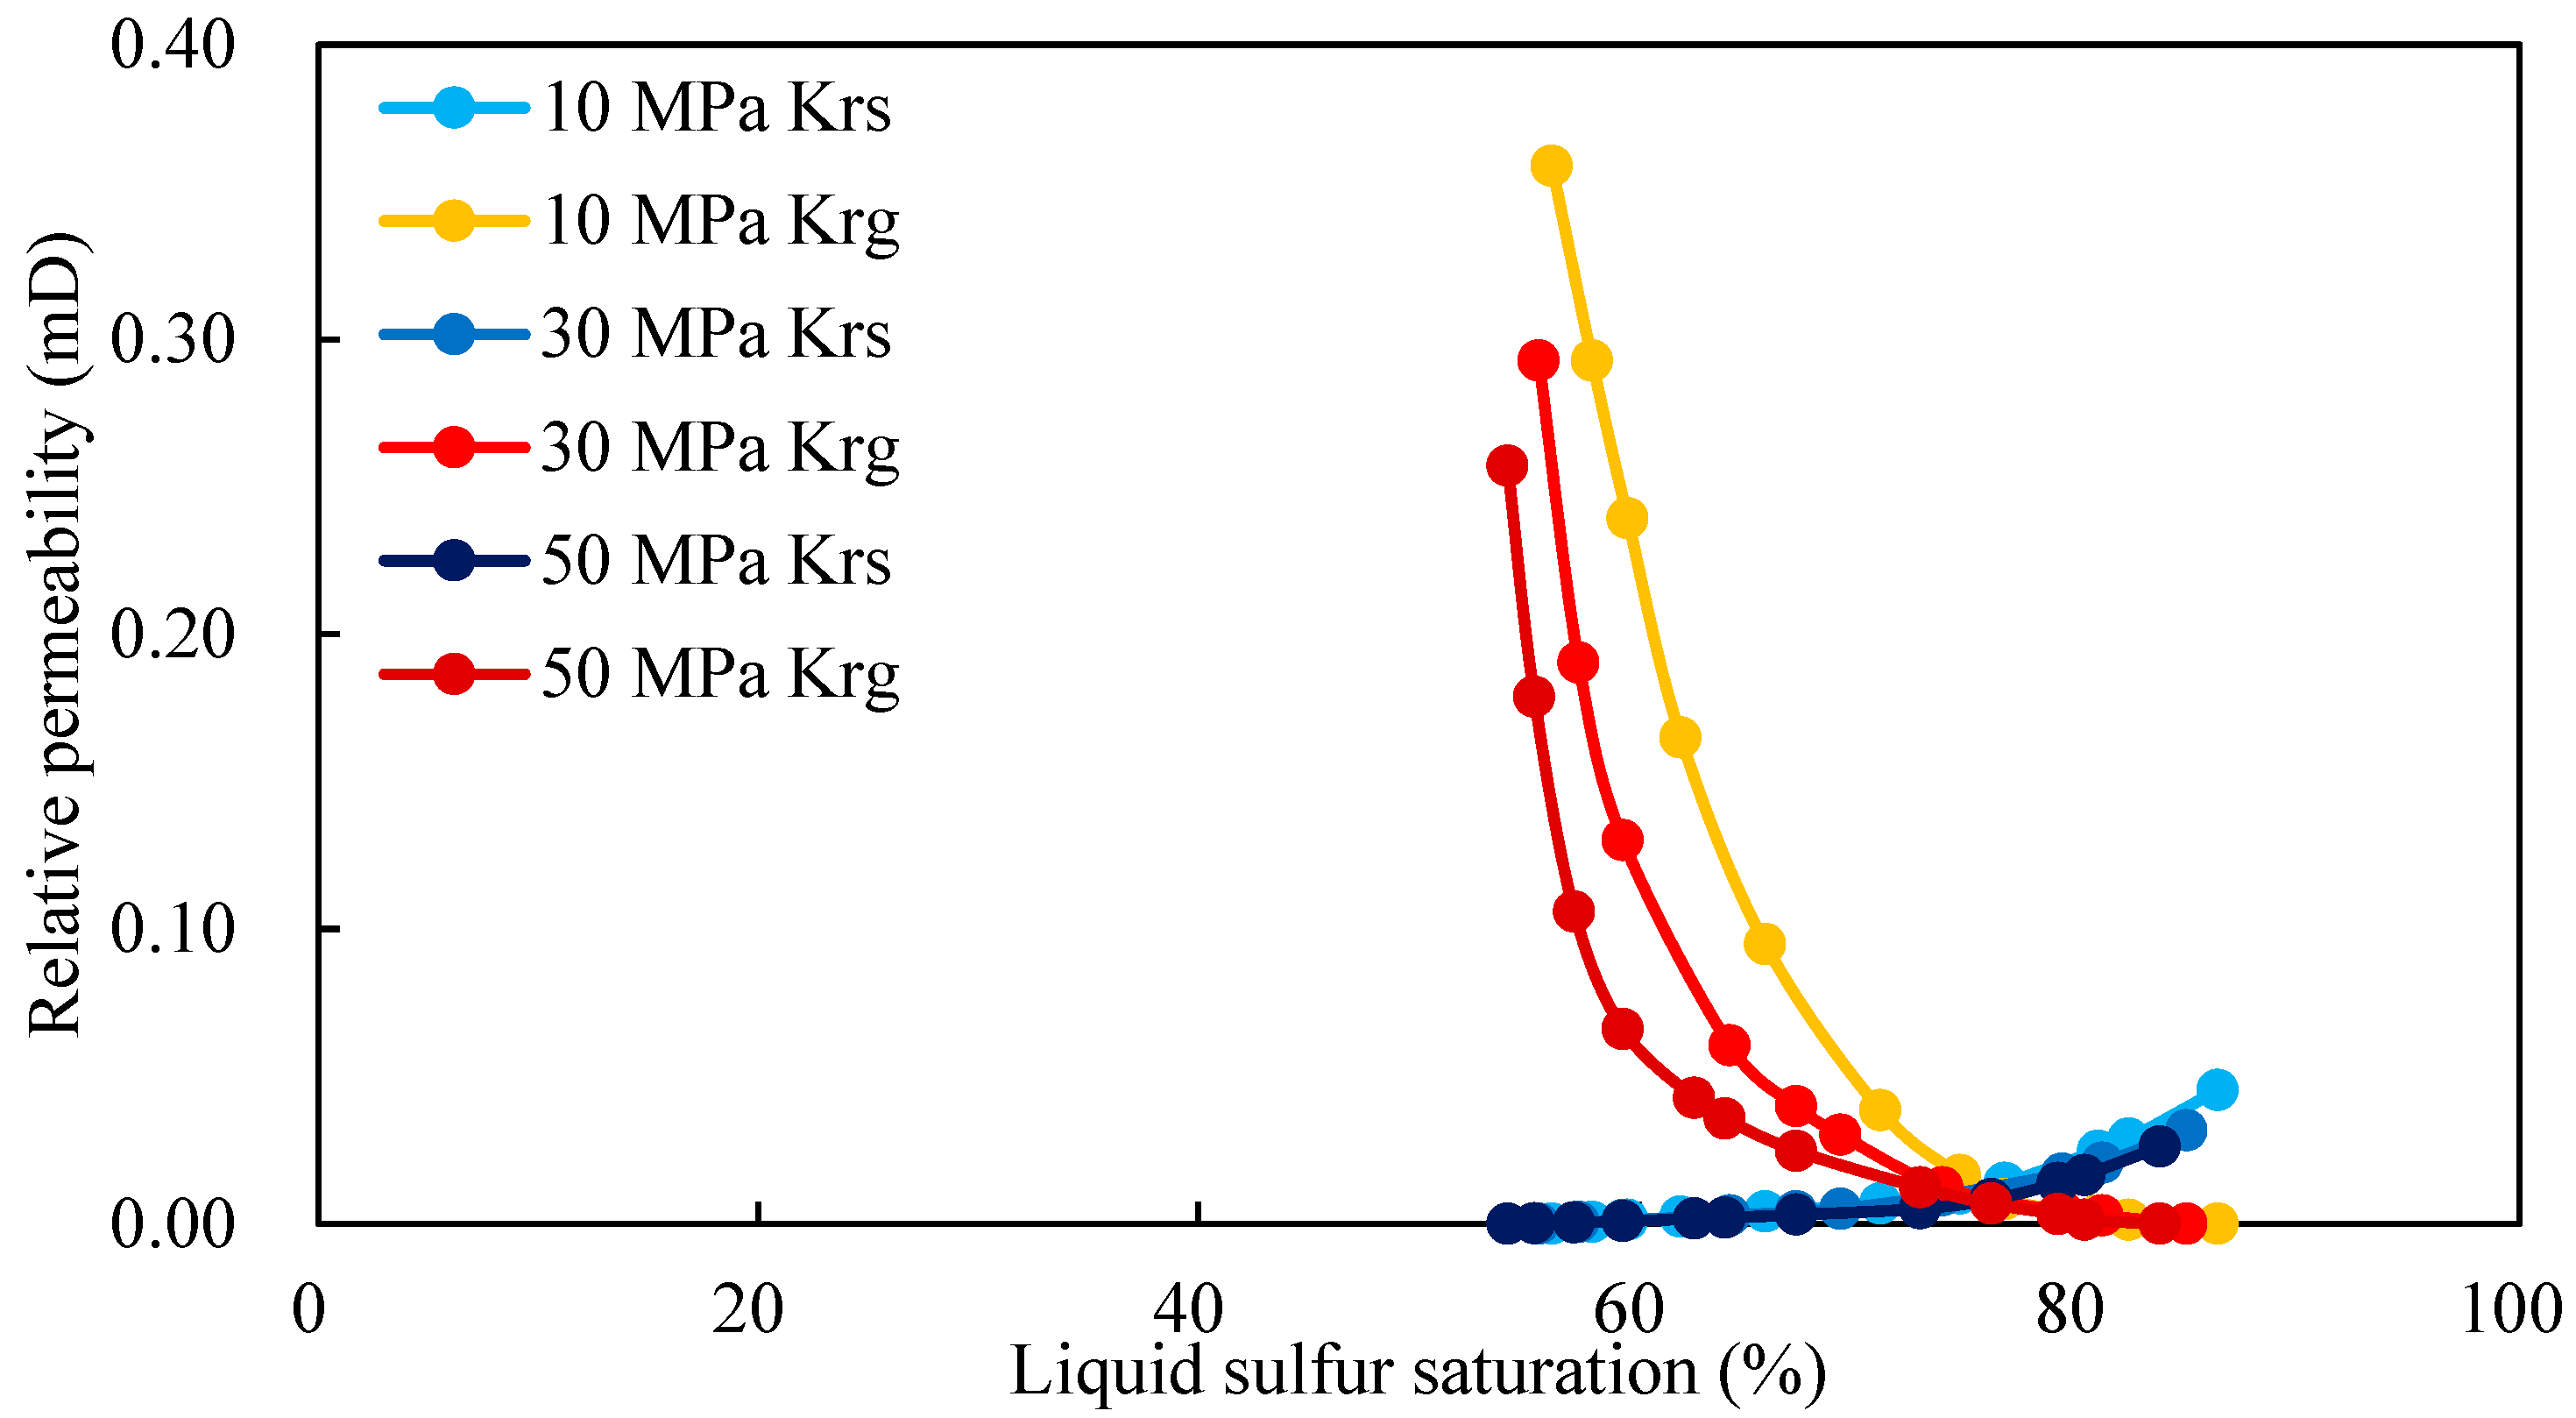
3.4. Effect of Confining Pressure on Relative Permeability Curve

The relative permeability of Core 1–3 was measured under simulated formation pressures of 10 MPa, 30 MPa, and 50 MPa by changing the experimental confining pressure, and the results are shown in Figure 7, Figure 8 and Figure 9.
It can be seen that the gas–liquid sulfur relative permeability curves of different cores showed roughly the same trend. The relative permeability of gas and liquid sulfur decreased as the confining pressure increased, and the influence on the gas relative permeability increased. The liquid sulfur saturation and relative permeability corresponding to the isopermeability point decreased as the isopermeability point moved to the lower left, and the range of the gas–liquid sulfur co-flow interval decreased slightly. This is because increasing the confining pressure increases the effective stress on the core, reducing the pore volume and throat radius and even closing part of the pore throat, reducing the gas and liquid sulfur permeability. Furthermore, because the gas is more sensitive to effective stress due to its higher compressibility, the decrease in gas phase permeability is more significant.
Comparing the gas–liquid sulfur relative permeability curves of different cores, it was shown that the gas relative permeability of Core 3 decreased more with the increase in confining pressure, indicating that the stress sensitivity of the fractured core was more significant. This is because the presence of fractures increases the contact area between the liquid sulfur and core, resulting in more liquid sulfur absorption and deposition in the core pores, resulting in less pore space occupied by gas. At the same time, the fracture space is the primary gas flow channel, and gas easily forms cross-flow in the fracture. The fracture space is more compressible than the pore space of matrix cores. As a result, the gas permeability damage in fractured cores with effective stress is more severe.
Due to the experimental conditions and safety concerns, the gas used in this paper was standard nitrogen, which has physical properties that differ from the actual sour gas. However, these findings are still important for understanding the characteristics of the gas–liquid sulfur phase permeability curve and guiding the efficient and reasonable development of sour gas reservoirs. It is suggested that the experimental equipment and process can be improved further in order to conduct gas–liquid sulfur permeability measurements with various actual sour gases and study the effect of sour gas components and content on the gas–liquid sulfur relative permeability.

4. Conclusions

The gas–liquid sulfur relative permeability of typical cores obtained in sour gas reservoirs was measured and analyzed in this paper using an unsteady method and an improved experimental equipment and process. The following findings were revealed:
(a)
The characteristics of the gas–liquid sulfur relative permeability curve were analyzed. Liquid sulfur had a critical flow saturation of 40%. The gas–liquid sulfur co-flow interval was narrow, with a liquid sulfur saturation range of 40–80% in the co-flow interval. This means that the majority of the precipitated liquid sulfur cannot flow, and only near-wellbore sulfur saturation may be higher than the critical flow saturation, resulting in lower gas well productivity.
(b)
The physical properties and structure type of the formation rocks have a significant impact on the relative permeability of gas–liquid sulfur. Because the gas–liquid sulfur relative permeability is low and the co-flow interval is small in matrix cores with good physical properties, it will be more difficult for the liquid sulfur to flow effectively, causing more damage to the reservoir with good physical properties. When compared to the matrix, the fractured cores had higher liquid sulfur residual saturation, a smaller gas–liquid sulfur co-flow interval, and greater gas relative permeability damage as the liquid sulfur saturation increased. In fractured reservoirs, liquid sulfur had little effect on the gas well productivity in the early and middle production stages; however, when the liquid sulfur saturation exceeded the residual liquid sulfur saturation, the gas well productivity decreased faster as the production time increased.
(c)
Temperature had a certain influence on the gas–liquid sulfur relative permeability. With the increase in temperature, the relative permeability of the gas decreased obviously, while that of the liquid sulfur decreased slightly and remained basically unchanged.
(d)
The relative permeability of the gas–liquid sulfur was affected by the confining pressure, particularly in the fractured core. The gas–liquid sulfur co-flow interval decreased slightly as the confining pressure increased, as did the relative permeability, and the decrease in the gas relative permeability was greater. For the fractured core, the decrease in the gas relative permeability was more substantial with the increase in the confining pressure, indicating that the stress sensitivity of fractured cores is more significant.

Author Contributions

Conceptualization, X.G.; Methodology, X.G. and P.W.; Software, X.G.; Validation, J.M. and T.L.; Investigation, P.W.; Resources, X.G.; Data curation, P.W.; Writing—original draft preparation, P.W.; Writing—review and editing, X.G.; Project administration, J.M. and T.L.; Funding acquisition, X.G. All authors have read and agreed to the published version of the manuscript.

Funding

This research was funded by the General Program of National Natural Science Foundation of China, grant number 51874249; the State Key Program of National Natural Science Foundation of Sichuan Province, grant number 2022NSFSC0019; the Joint Funds of National Natural Science Foundation of China, grant number U21A20105; and the Project funded by China Postdoctoral Science Foundation, grant number 2022TQ0264.

Institutional Review Board Statement

Not applicable.

Informed Consent Statement

Not applicable.

Data Availability Statement

The data presented in this study are available through email upon request to the corresponding author.

Conflicts of Interest

The authors declare no conflict of interest.

Error Analysis Statement

The experimental data of the relative permeability in this paper were obtained by the unsteady-state method combined with the improved J-B-N method. The purpose of the experiment was to obtain the overall shape of the relative permeability curve, which is a qualitative experiment and cannot analyze the experimental error of one or several experimental data. In addition, the experimental data are relative to the physical properties of the core. There are many factors that affect the experimental results and most of them cannot quantitatively characterize their influence on the experimental results. That is, the experiment belongs to the semi-qualitative type, and the correctness of the experimental results is usually tested by repeated experiments. Therefore, the error analysis of the experimental results was not carried out in this paper.

Nomenclature

K Absolute permeability of core, mD
P 0 Atmospheric pressure under standard conditions, MPa
Q Nitrogen flow rate under standard conditions, cm3/s
μ Nitrogen viscosity at experimental temperature and pressure, mPa·s
L Core length, cm
A Cross-sectional area of core, cm2
P 1 Core inlet pressure, MPa
P 2 Core outlet pressure, MPa
V i Cumulative fluid production at time i, mL
V i 1 Cumulative fluid production at time i − 1, mL
Δ V s i Liquid sulfur production change from time i − 1 to time i, mL
p a Atmospheric pressure, MPa
Δ p Core inlet and outlet pressure difference, MPa
Δ V g i Gas change at atmospheric pressure from time i − 1 to time i, mL
V g Cumulative gas production, mL
V s Cumulative liquid sulfur production, mL
S s Liquid sulfur saturation, %
V p Core pore volume, cm3
q gi Gas flow rate under gas-liquid sulfur two-phase flow, mL/s
q g Gas flow rate under gas single-phase flow, mL/s
μ g Gas viscosity at average core pressure, mPa·s
μ s Viscosity of liquid sulfur, mPa·s
f s Liquid sulfur void fraction, decimals
f g Gas void fraction, decimals
K rg Gas relative permeability, decimals
K rs Liquid sulfur relative permeability, decimals

References

  1. Burgers, W.F.J.; Northrop, P.S.; Kheshgi, H.S.; Valencia, J.A. Worldwide development potential for sour gas. Energy Procedia 2011, 4, 2178–2184. [Google Scholar] [CrossRef] [Green Version]
  2. Roberts, B.E. Flow impairment by deposited sulfur-a review of 50 years of research. J. Nat. Gas Eng. 2017, 2, 84–105. [Google Scholar] [CrossRef]
  3. Jamiolahmady, M.; Sohrabi, M.; Ghahri, P.; Ireland, S. Gas/Condensate Relative Permeability of a Low Permeability Core: Coupling vs. Inertia. SPE Res. Eng. 2010, 13, 214–227. [Google Scholar] [CrossRef]
  4. Kalla, S.; Leonardi, S.A.; Berry, D.W.; Poore, L.D.; Sahoo, H.; Kudva, R.A.; Braun, E.M. Factors That Affect Gas-Condensate Relative Permeability. SPE Res. Eng. 2015, 18, 5–10. [Google Scholar] [CrossRef]
  5. Rahimzadeh, A.; Bazargan, M.; Darvishi, R.; Mohammadi, A.H. Condensate blockage study in gas condensate reservoir. J. Nat. Gas Sci. Eng. 2016, 33, 634–643. [Google Scholar] [CrossRef]
  6. Hassan, A.; Mahmoud, M.; Al-Majed, A.; Alawi, M.B.; Elkatatny, S.; BaTaweel, M.; Al-Nakhli, A. Gas condensate treatment: A critical review of materials, methods, field applications, and new solutions. J. Pet. Sci. Eng. 2019, 177, 602–613. [Google Scholar]
  7. Khormali, A.; Sharifov, A.R.; Torba, D.I. The control of asphaltene precipitation in oil wells. Pet. Sci. Technol. 2018, 36, 443–449. [Google Scholar]
  8. Khormali, A.; Sharifov, A.R.; Torba, D.I. Experimental and modeling analysis of asphaltene precipitation in the near wellbore region of oil wells. Pet. Sci. Technol. 2018, 36, 1030–1036. [Google Scholar] [CrossRef]
  9. Kuo, C.H. On the production of hydrogen sulfide-sulfur mixtures from deep formations. J. Pet. Technol. 1972, 24, 1142–1146. [Google Scholar] [CrossRef]
  10. Chrastil, J. Solubility of solids and liquids in supercritical gases. J. Phys. Chem. 1982, 86, 3016–3021. [Google Scholar] [CrossRef]
  11. Roberts, B.E. The effect of sulfur deposition on gaswell inflow performance. SPE Res. Eng. 1997, 12, 118–123. [Google Scholar] [CrossRef]
  12. Mei, H.; Zhang, M.; Yang, X. The effect of sulfur deposition on gas deliverability. In Proceedings of the SPE Gas Technology Symposium, Calgary, AB, Canada, 15–17 May 2006. [Google Scholar]
  13. Guo, X.; Du, Z. EOS-Related mathematical model to predict sulfur deposition and cost-effective approach of removing sulfides from sour natural gas. In Proceedings of the Production and Operations Symposium, Oklahoma City, OK, USA, 31 March–3 April 2007. [Google Scholar]
  14. Mahmoud, M.A. New numerical and analytical models to quantify the near-wellbore damage due to sulfur deposition in sour gas reservoirs. In Proceedings of the SPE Middle East Oil and Gas Show and Conference, Manama, Bahrain, 10–13 March 2013. [Google Scholar]
  15. Hu, J.; He, S.; Zhao, J.; Li, Y. Modeling of sulfur plugging in a sour gas reservoir. J. Nat. Gas Sci. Eng. 2013, 11, 18–22. [Google Scholar] [CrossRef]
  16. Guo, X.; Zhou, X.; Zhou, B. Prediction model of sulfur saturation considering the effects of non-Darcy flow and reservoir compaction. J. Nat. Gas Sci. Eng. 2015, 22, 371–376. [Google Scholar] [CrossRef]
  17. Li, J.; Qi, Z.; Hu, S.; Yuan, Y.; Yan, W.; Xiang, Z. A numerical simulation method for high-sulfur gas reservoirs with liquid released sulfur. Natur. Gas Ind. 2015, 35, 40–44. [Google Scholar]
  18. Hu, J.; Chen, Z.; Liu, P.; Liu, H. A comprehensive model for dynamic characteristic curves considering sulfur deposition in sour carbonate fractured gas reservoirs. J. Pet. Sci. Eng. 2018, 170, 643–654. [Google Scholar] [CrossRef]
  19. Liu, J.; Jiang, L.; Liu, M.; Yi, S.; Liu, Z.; Dai, X.; Xie, Y.; Chen, Y. Fractal prediction model of gas-liquid sulfur phase permeability curve with boundary layer considered. In Proceedings of the International Conference on Applied Energy, Bangkok, Thailand, 1–10 December 2020. [Google Scholar]
  20. Xu, Z.; Gu, S.; Zeng, D.; Sun, B.; Xue, L. Numerical simulation of sulfur deposit with particle release. Energies 2020, 13, 1522. [Google Scholar] [CrossRef] [Green Version]
  21. Li, T.; Shao, M.; Yang, Q.; Zhang, J.; Ahmad, F.A. Fractal model for predicting elemental sulfur saturation in the presence of natural fracture. ACS Omega 2021, 6, 14394–14398. [Google Scholar] [CrossRef]
  22. Zou, C.; Wang, X.; Hu, J.; Lv, Y.; Fang, B.; Zhang, Y. A novel model for predicting the well production in high-sulfur-content gas reservoirs. Geofluids 2021, 2021, 5529908. [Google Scholar] [CrossRef]
  23. Coşkuner, G. Flow of sour gas, liquid sulfur, and water in porous media. J. Colloid Interface Sci. 1994, 165, 526–531. [Google Scholar] [CrossRef]
  24. Abou-Kassem, J.H. Experimental and numerical modeling of sulfur plugging in carbonate reservoirs. J. Pet. Sci. Eng. 2000, 26, 91–103. [Google Scholar] [CrossRef]
  25. Shedid, S.A.; Zekri, A.Y. Formation damage due to simultaneous sulfur and asphaltene deposition. In Proceedings of the SPE International Symposium and Exhibition on Formation Damage Control, Lafayette, Louisiana, 18–20 February 2004. [Google Scholar]
  26. Guo, X.; Du, Z.; Yang, X.; Zhang, Y.; Fu, D. Sulfur deposition in sour gas reservoirs: Laboratory and simulation study. Pet. Sci. 2009, 6, 405–414. [Google Scholar] [CrossRef] [Green Version]
  27. Hu, J.; He, S.; Zhao, J.; Li, Y.; Yang, X. Sulfur deposition experiment in the presence of non-movable water. J. Pet. Sci. Eng. 2012, 100, 37–40. [Google Scholar] [CrossRef]
  28. Yang, X.; Hu, Y.; Zhong, B.; Yang, H.; Wang, S. The damage appraisal on elemental sulfur deposition in high sulfur content gas reservoirs. In Proceedings of the International Petroleum Technology Conference, Beijing, China, 26–28 March 2013. [Google Scholar]
  29. Mahmoud, M.A. Effect of elemental-sulfur deposition on the rock petrophysical properties in sour-gas reservoirs. SPE J. 2014, 19, 703–715. [Google Scholar] [CrossRef]
  30. Maffeis, I.; de Angelis, A.R.; Guernelli, R.; Croce, E.; Luigi, R. Experimental methods for the evaluation of the efficiency of an innovative sulfur-dissolving product in HP-HT conditions. In Proceedings of the Abu Dhabi International Petroleum Exhibition & Conference, Abu Dhabi, United Arab Emirates, 15–18 November 2021. [Google Scholar]
  31. Buckley, S.E.; Leverett, M.C. Mechanism of fluid displacement in sands. Trans. AIME 1942, 146, 107–116. [Google Scholar] [CrossRef]
  32. Johnson, E.F.; Bossler, D.P.; Naumann Bossler, V.O. Calculation of relative permeability from displacement experiments. Trans. AIME 1959, 216, 370–372. [Google Scholar] [CrossRef]
  33. Guo, X.; Du, Z.; Jiang, Y.; Sun, L.; Liu, X.; Zhang, N. Can gas-water relative permeability measured under experiment conditions be reliable for the development guidance of a real HPHT reservoir. Natur. Gas Ind. 2014, 34, 1000-0976. [Google Scholar]
  34. Benzagouta, M.S.; Amro, M.M. Pressure and temperature effect on petrophysical characteristics: Carbonate reservoir case. In Proceedings of the SPE Saudi Arabia Section Technical Symposium, Al-Khobar, Saudi Arabia, 9–11 May 2009. [Google Scholar]
  35. Yavuz, H.; Demirdag, S.; Caran, S. Thermal effect on the physical properties of carbonate rocks. Int. J. Rock Mech. Min. Sci. 2010, 47, 94–103. [Google Scholar] [CrossRef]
Figure 1. Problems during the experiment: (a) Liquid sulfur burning; (b) pipeline plugging by sulfur.
Processes 10 02129 g001
Figure 2. Schematic diagram of the experimental equipment. 1. Nitrogen cylinder; 2. Gas booster pump; 3. Medium container containing sulfur powder; 4. Displacement pump; 5. Pressure transmitter; 6. Core holder; 7. Automatic tracking confining pressure pump; 8. Pressure transmitter; 9. Back-pressure valve; 10. Back-pressure bump; 11. Temperature controller; 12. Electric heat-tracing wire (with asbestos mesh); 13. Thermotank; 14. Volumetric flask; 15. Electronic balance; 16. Electronic gas flowmeter; 17. Gas treatment system; 18. Computer.
Processes 10 02129 g002
Figure 3. Gas–liquid relative permeability curve of Core 1.
Processes 10 02129 g003
Figure 4. Gas–liquid sulfur relative permeability curve of Core 1 and Core 2.
Processes 10 02129 g004
Figure 5. Gas–liquid sulfur relative permeability curve of Core 2 and Core 3.
Processes 10 02129 g005
Figure 6. Gas–liquid sulfur relative permeability curves of Core 1 at different temperatures.
Processes 10 02129 g006
Figure 7. Gas–liquid sulfur relative permeability curves of Core 1 at different confining pressures.
Processes 10 02129 g007
Figure 8. Gas–liquid sulfur relative permeability curves of Core 2 at different confining pressures.
Processes 10 02129 g008
Figure 9. Gas–liquid sulfur relative permeability curves of Core 3 at different confining pressures.
Processes 10 02129 g009
Table 1. Device parameters.
DeviceRange of ApplicationAccuracy
Thermotank0–200 °C0.5 °C
Gas booster pump0–70 MPa0.1 MPa
Automatic tracking confining pressure pump0–120 MPa0.1 MPa
Electronic balance0–500 g0.001 g
Electronic gas flowmeter0.1–100 mL0.01 mL
Table 2. Core components.
Core Number123
Dolomite98.0497.2296.73
Calcite1.242.402.33
Plagioclase0.520.380.94
Quartz0.2000
Total100100100
Table 3. Core basic parameters.
Core Number123
Length (cm)4.9504.8624.857
Cross sectional area (cm2)4.9524.9774.974
Porosity (%)0.4521.7694.431
Permeability (mD)2.2313.4223.79
TypePoor propertyGood propertyFracture
Table 4. Experimental scheme.
Core NumberConfining Pressure (MPa)Temperature (°C)
110150
30130
30140
30150
50150
210150
30150
50150
310150
30150
50150
Table 5. Endpoints and isopermeability point parameters of the relative permeability of different cores.
Core Number123
Critical flow saturation of liquid sulfur (%)41.5245.0555.44
Corresponding gas relative permeability0.33220.24410.2928
Liquid sulfur saturation at isopermeability point (%)66.6770.5174.67
Corresponding relative permeability0.07200.02320.0104
Residual gas saturation (%)20.7521.2115.12
Corresponding liquid sulfur relative permeability0.20480.04630.0316
Critical flow saturation of liquid sulfur (%)41.5245.0555.44
Publisher’s Note: MDPI stays neutral with regard to jurisdictional claims in published maps and institutional affiliations.

