
Influence of Power Supply Ripple on Injection Locking of Magnetron with Frequency Pushing Effect


Abstract
:1. Introduction
2. Theory and Analysis
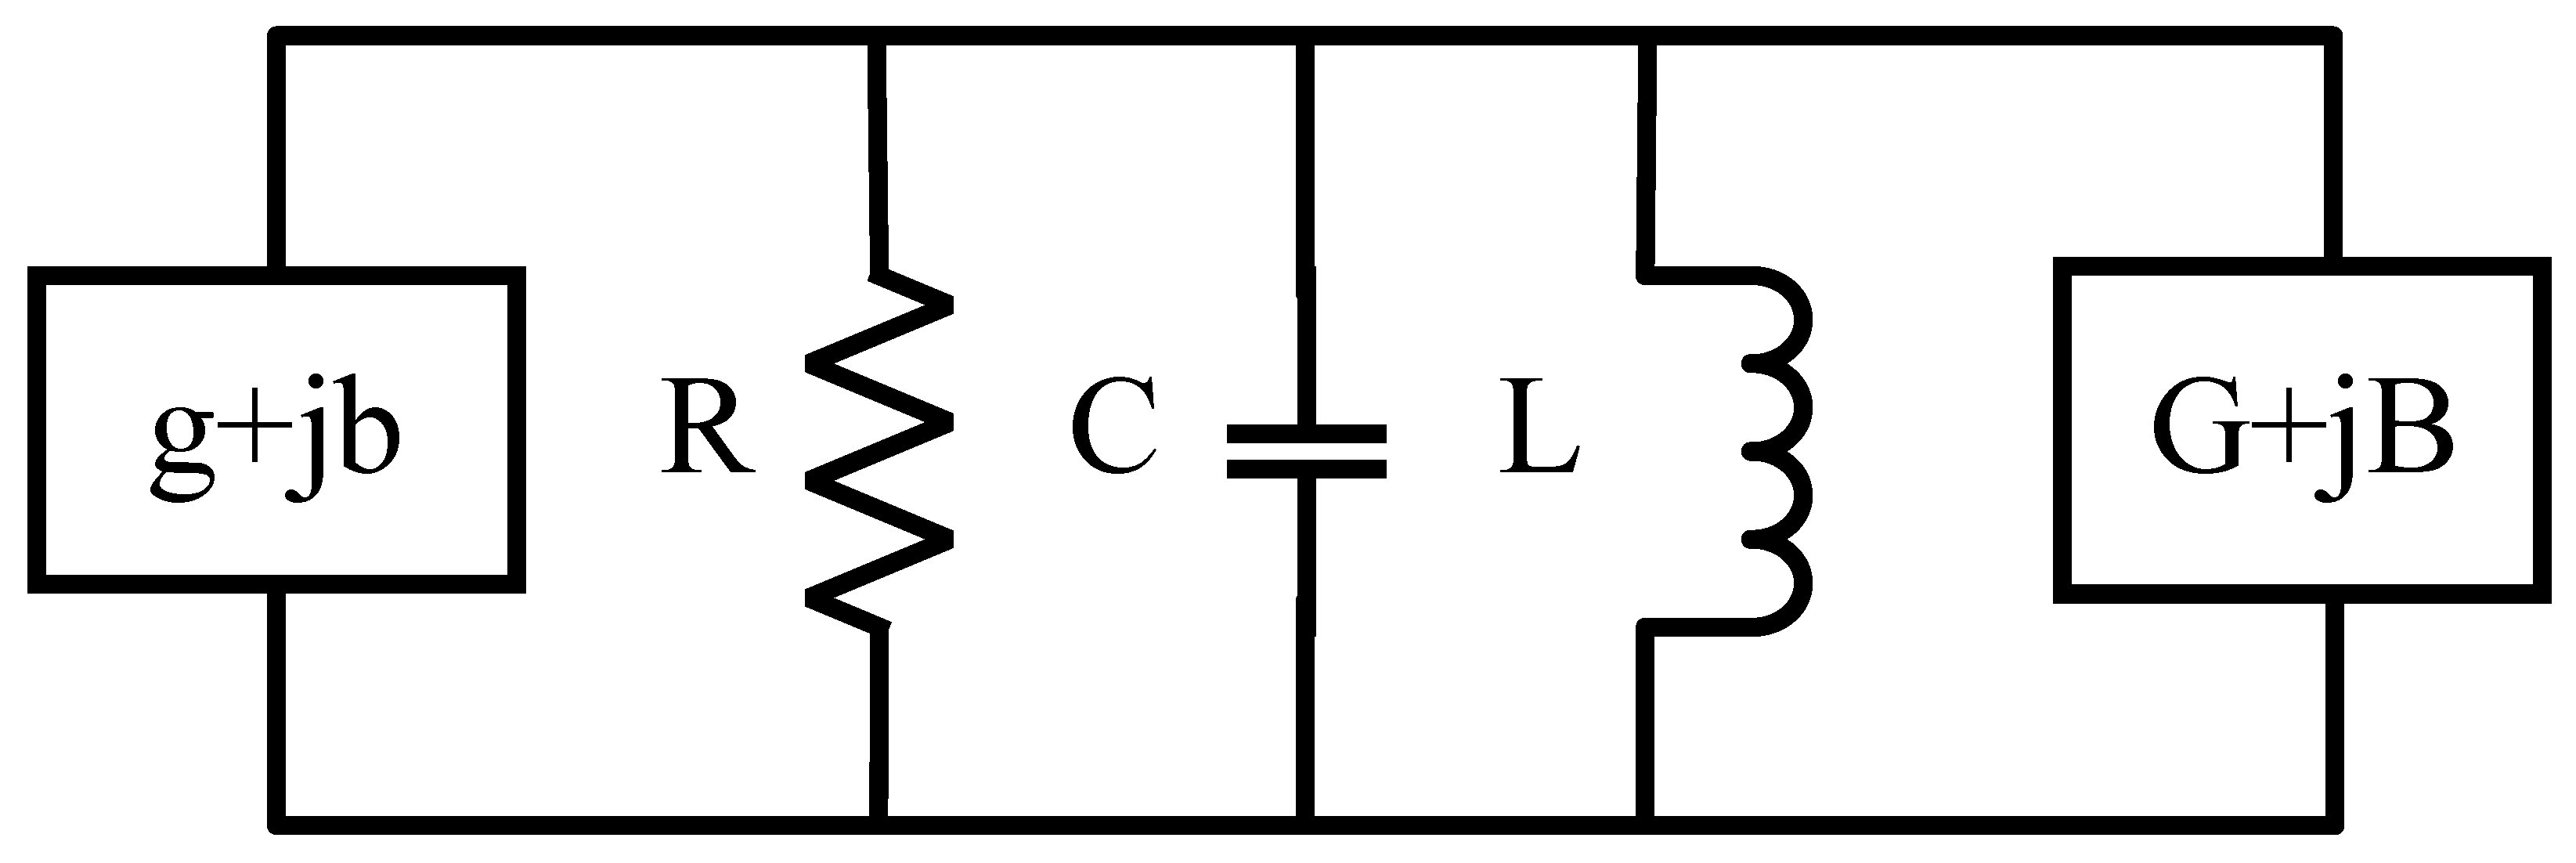
2.1. Theoretical Analysis of Injection Locking with Ripple and Frequency Push Effect
2.2. Numerical Simulation of Injection Locking with Ripple and Frequency Push Effect
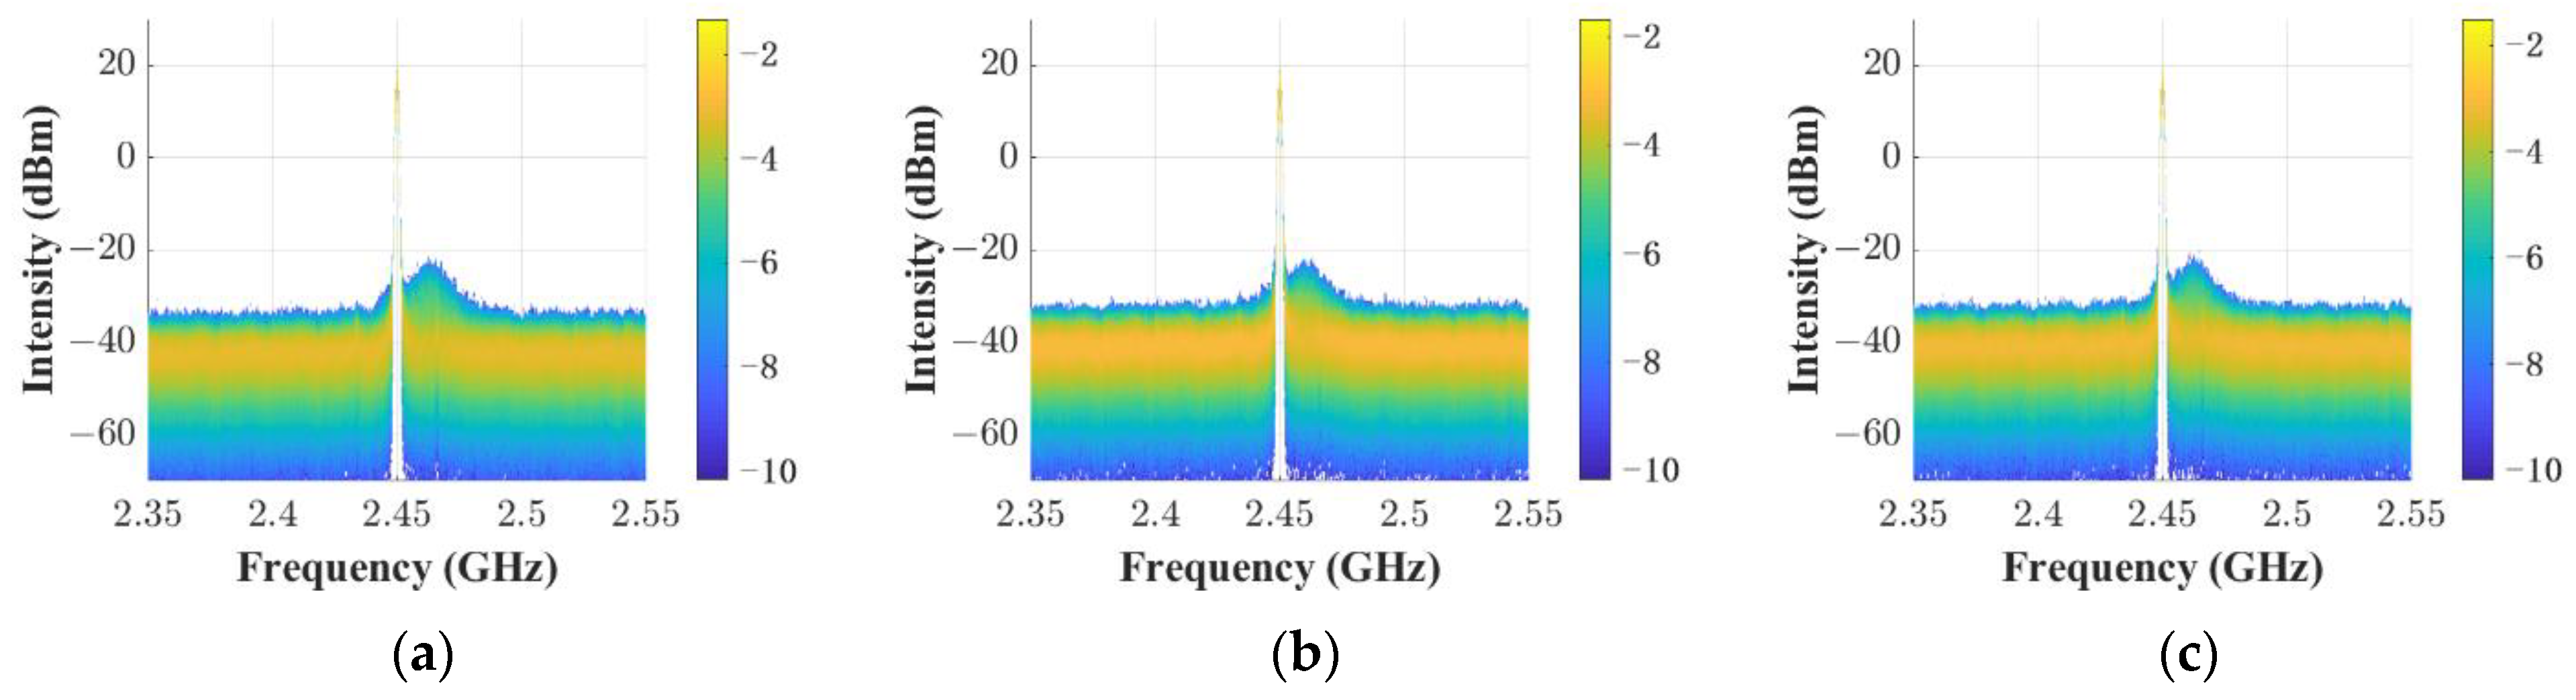
3. Experimental Setup
4. Results and Discussions
5. Conclusions
Author Contributions
Funding
Data Availability Statement
Conflicts of Interest
References
- Gilmour, A.S. Klystrons, Traveling Wave Tubes, Magnetrons, Crossed-field Amplifiers, and Gyrotrons; Artech House: Norwood, MA, USA, 2011. [Google Scholar]
- Chen, C.; Huang, K.; Yang, Y. Microwave transmitting system based on four-way master–slave injection-locked magne-trons and horn arrays with suppressed sidelobes. IEEE Trans. Microw Theory Tech. 2018, 66, 2416–2424. [Google Scholar]
- Booske, J.H. Plasma physics and related challenges of millimeterwave-to-terahertz and high-power microwave generation. Phys. Plasmas 2008, 15, 459–597. [Google Scholar] [CrossRef] [Green Version]
- Yang, Y.; Fan, Z.; Hong, T.; Chen, M.; Tang, X.; He, J.; Chen, X.; Liu, C.; Zhu, H.; Huang, K. Design of Microwave Directional Heating System Based on Phased-Array Antenna. IEEE Trans. Microw. Theory Tech. 2020, 68, 4896–4904. [Google Scholar] [CrossRef]
- Zhang, W.; Tao, J.; Huang, K.; Wu, L. Numerical Investigation of the Surface Wave Formation in a Microwave Plasma Torch. IEEE Trans. Plasma Sci. 2017, 45, 2929–2939. [Google Scholar] [CrossRef]
- Yang, Y.; Li, K.; Li, J.; Zhu, H.; Zhang, Y.; Huang, K. Low-Cost, High-Power Jamming Transmitter Based on Magnetron. IEEE Trans. Electron Devices 2020, 67, 2912–2918. [Google Scholar] [CrossRef]
- Brown, W. The History of Power Transmission by Radio Waves. IEEE Trans. Microw. Theory Tech. 1984, 32, 1230–1242. [Google Scholar] [CrossRef] [Green Version]
- Shinohara, N. Beam Control Technologies with a High-Efficiency Phased Array for Microwave Power Transmission in Japan. Proc. IEEE 2013, 101, 1448–1463. [Google Scholar] [CrossRef] [Green Version]
- Adler, R. A study of locking phenomena in oscillators. Proc. Inst. Radio Eng. 1946, 34, 351–357. [Google Scholar] [CrossRef]
- Mitani, T.; Shinohara, N.; Matsumoto, H.; Aiga, M.; Kuwahara, N. Experimental research on noise reduction of magnetrons for solar power station/satellite. In Proceedings of the 2004 Asia-Pacific Radio Science Conference, Qingdao, China, 24–27 August 2005. [Google Scholar] [CrossRef]
- Chen, X.; Yu, Z.; Lin, H.; Zhao, X.; Liu, C. Improvements in a 20-kW Phase-Locked Magnetron by Anode Voltage Ripple Suppression. IEEE Trans. Plasma Sci. 2019, 48, 1879–1885. [Google Scholar] [CrossRef]
- Zhou, Y.; Zhang, Y.; Zhu, H.; Yang, Y. Study of the Influence of Power Supply Ripple on Magnetron’s Output Spectrum. IEEE Trans. Electron Devices 2021, 68, 4698–4704. [Google Scholar] [CrossRef]
- Chen, S.C. Growth and frequency pushing effects in relativistic magnetron phase-locking. IEEE Trans. Plasma Sci. 1990, 18, 570–576. [Google Scholar] [CrossRef]
- Li, K.; Zhang, Y.; Zhu, H.; Huang, K.; Yang, Y. Theoretical and experimental study on frequency pushing effect of magnetron. Chinese Physics B 2019, 11, 431–436. [Google Scholar]
- Su, J.; Li, Y.; Ding, M.; Tang, W. Development of cylinderical cavity type microwave plasma chemical vapor deposition reactor for diamond films deposition. In Proceedings of the Abstracts IEEE International Conference on Plasma Science (ICOPS), San Francisco, CA, USA, 16–21 June 2013; p. 1. [Google Scholar] [CrossRef]
- Chandra, R.; Zhou, H.; Balasingham, I.; Narayanan, R.M. On the Opportunities and Challenges in Microwave Medical Sensing and Imaging. IEEE Trans. Biomed. Eng. 2015, 62, 1667–1682. [Google Scholar] [CrossRef] [PubMed]
- Wang, W.; Mandelis, A. Microwave-heating-coupled photoacoustic radar for tissue diagnostic imaging. J. Biomed. Opt. 2016, 21, 066018. [Google Scholar] [CrossRef] [PubMed]
- Huang, K.; Zhou, Y.; Wu, L. Research on Microwave Chemistry in Sichuan University. In Proceedings of the 2018 Asia-Pacific Microwave Conference (APMC), Kyoto, Japan, 6–9 November 2018. [Google Scholar] [CrossRef]
- Slater, J.C. The phasing of magnetrons. In Research Laboratory of Electronics; MIT: Cambridge, MA, USA, 1947; Volume 35. [Google Scholar]


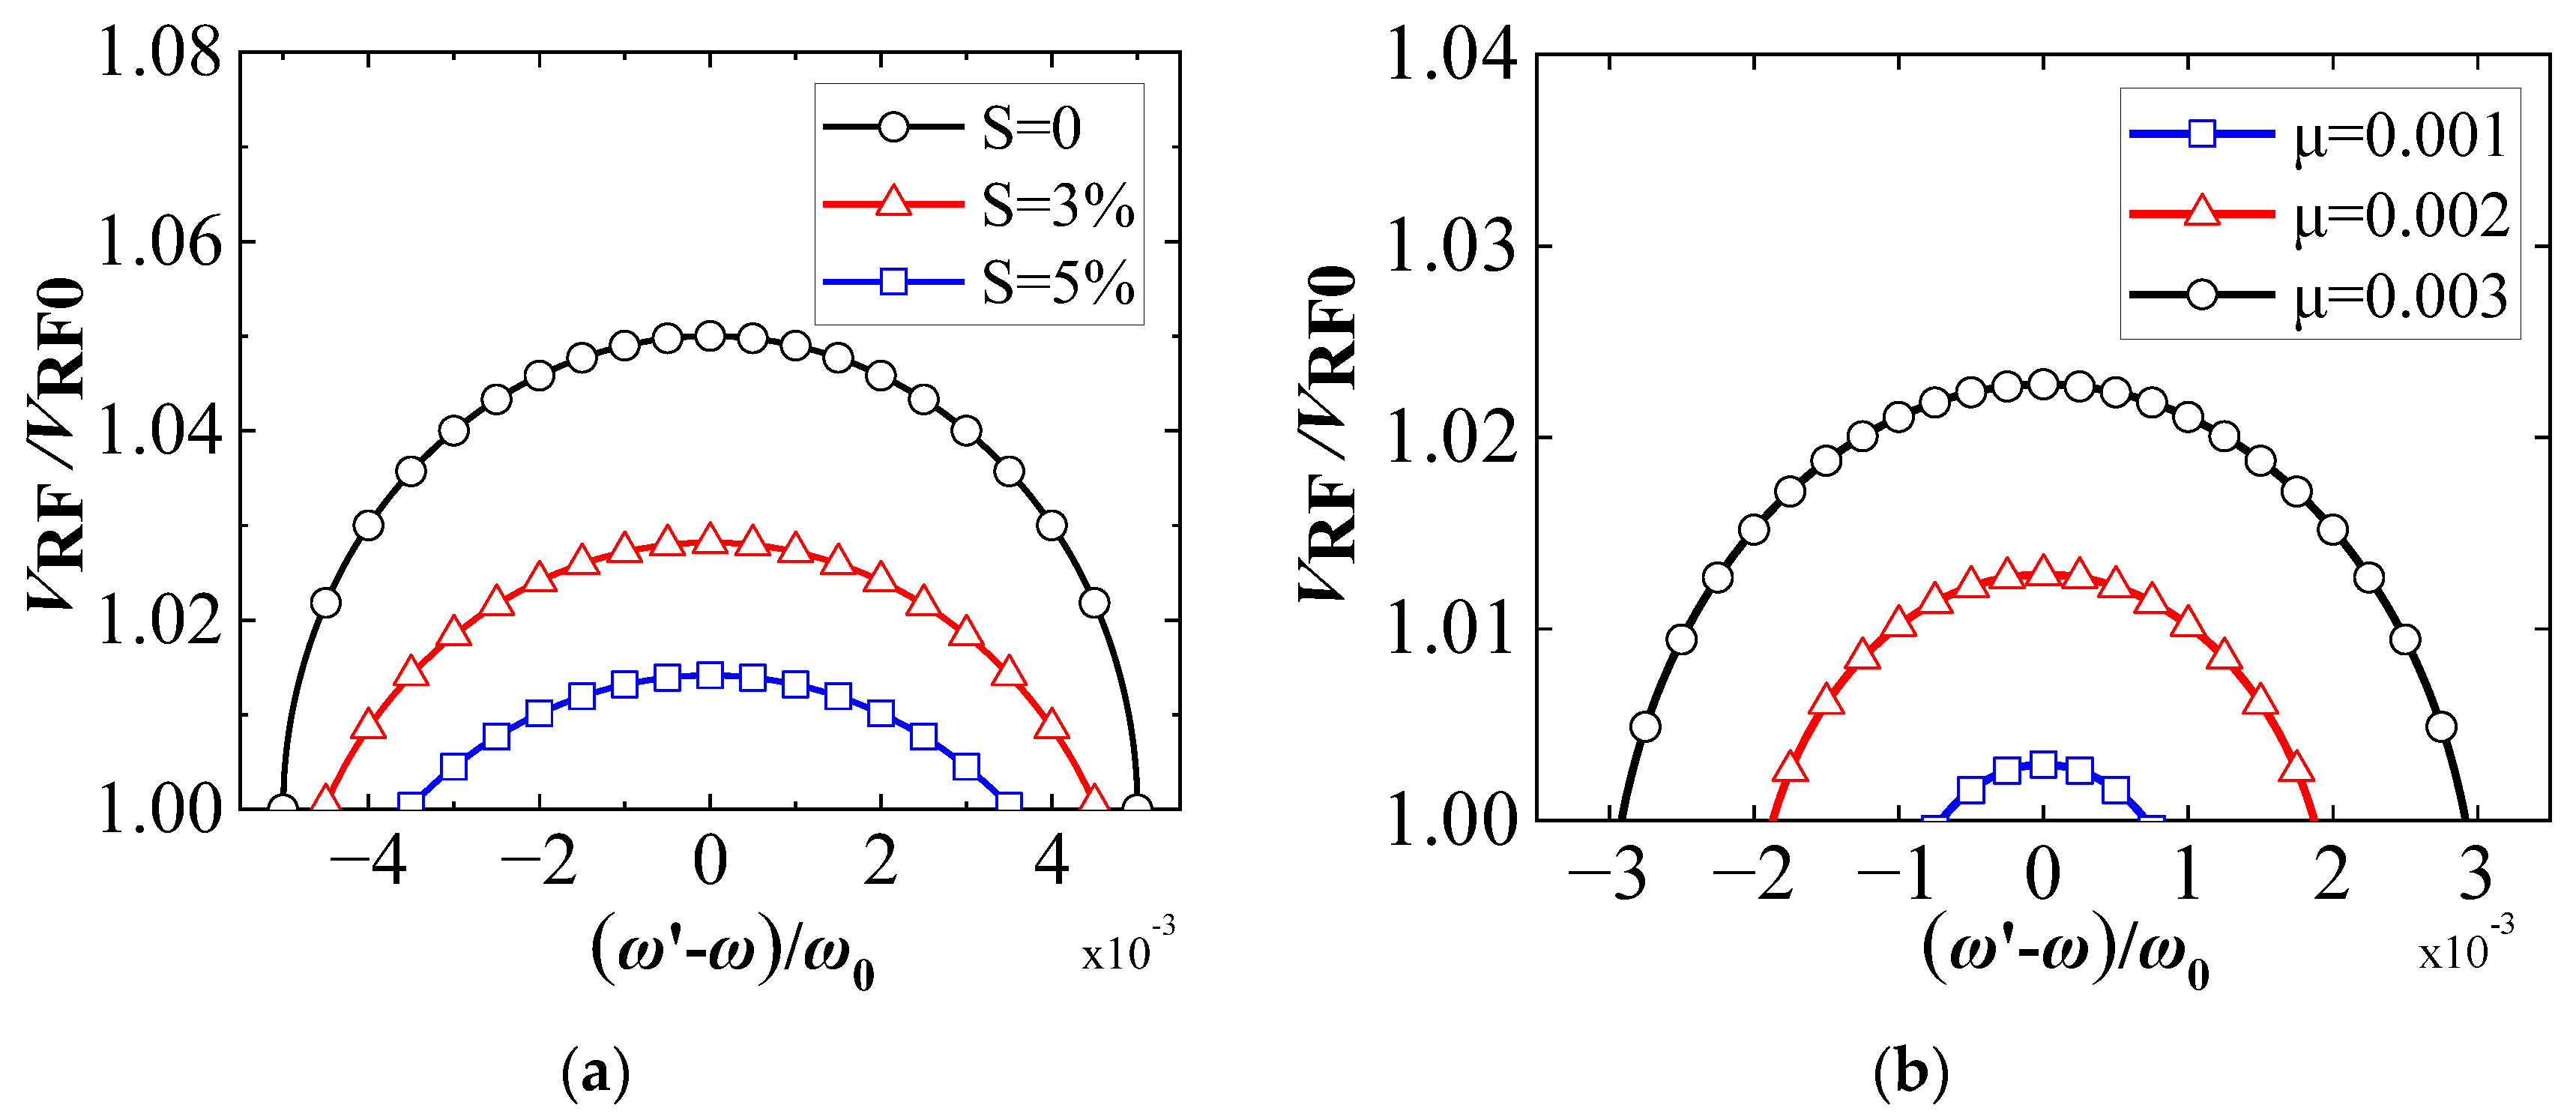
| Ripples S | 0% | 3% | 5% |
|---|---|---|---|
| Locking bandwidth | |||
| Injection frequency with largest output amplitude | 0 | 0 | 0 |
| Largest output amplitude | 1.050 | 1.028 | 1.014 |
| Injection Amplitude | 0.001 | 0.002 | 0.003 |
|---|---|---|---|
| Locking bandwidth | 0.68 | 1.85 | 2.90 |
| Injection frequency with largest output amplitude | 0 | 0 | 0 |
| Largest output amplitude | 1.003 | 1.013 | 1.023 |
| Ripples S | 0% | 1% | 2% |
|---|---|---|---|
| Locking bandwidth | |||
| Injection frequency with largest output amplitude | |||
| Largest output amplitude | 1.020 | 1.013 | 1.006 |
| Injection Amplitude | 0.001 | 0.002 | 0.003 |
|---|---|---|---|
| Locking bandwidth | |||
| Injection frequency with largest output amplitude | |||
| Largest output amplitude | 1.003 | 1.013 | 1.023 |
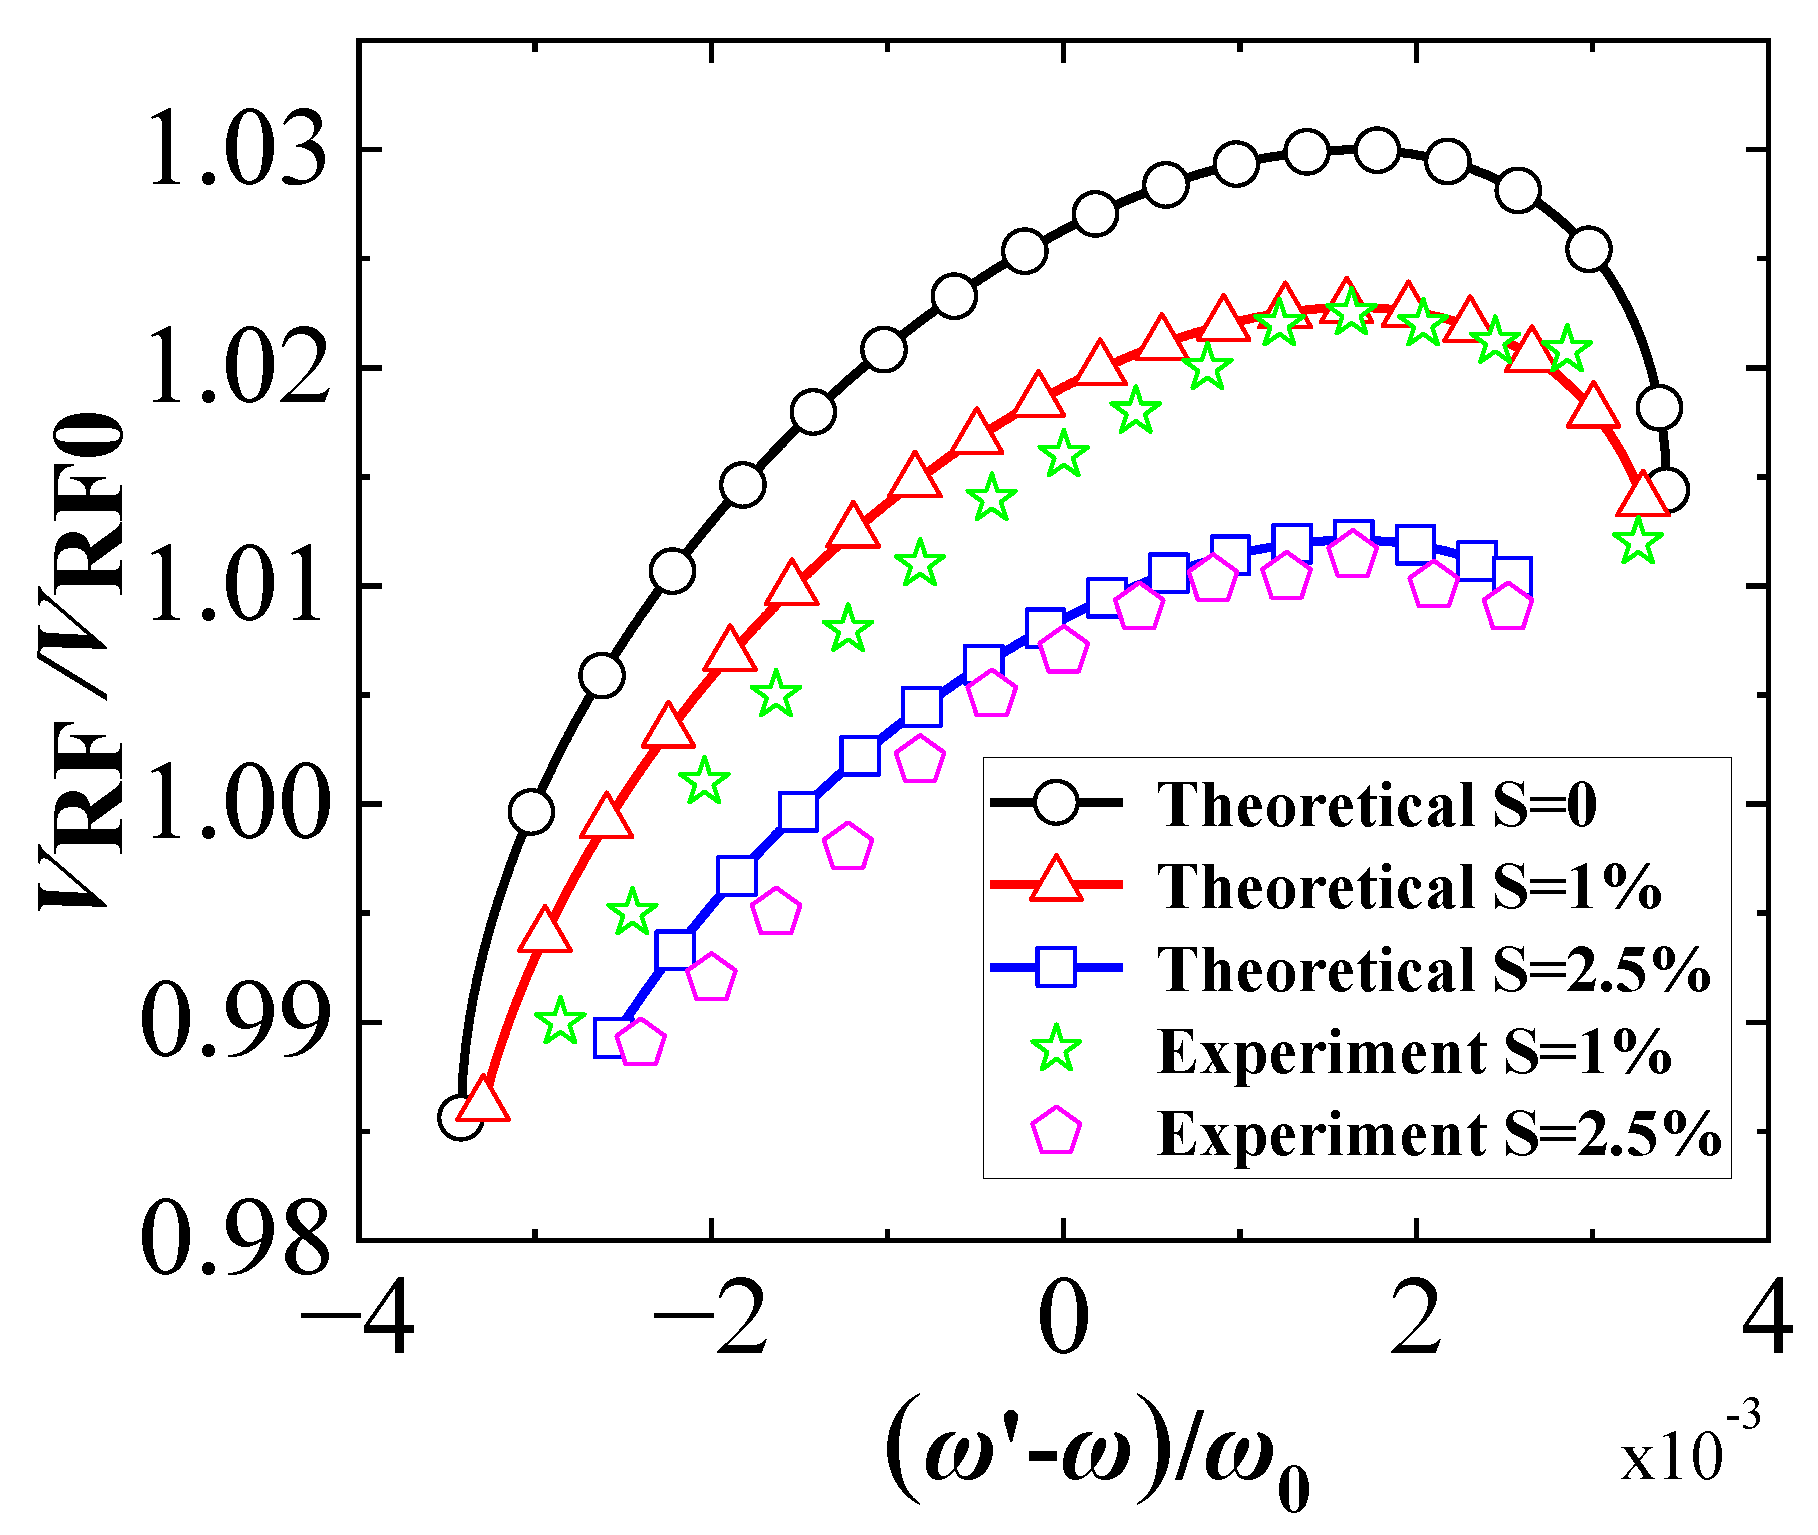
| Ripples S | 0% | 1% | 2.5% |
|---|---|---|---|
| Theoretical locked bandwidth in | |||
| Theoretical locked bandwidth in | 8.38 | 8.06 | 6.26 |
| Measuredlocked bandwidth in | 7.99 | 6.17 | |
| Theoretical injection frequency with largest output amplitude in | |||
| Theoretical Largest output amplitude in | 1.030 | 1.023 | 1.012 |
| Measuredinjection frequency with largest output amplitude in | |||
| MeasuredLargest output amplitude in | 1.022 | 1.011 |
Publisher’s Note: MDPI stays neutral with regard to jurisdictional claims in published maps and institutional affiliations. |
© 2022 by the authors. Licensee MDPI, Basel, Switzerland. This article is an open access article distributed under the terms and conditions of the Creative Commons Attribution (CC BY) license (https://creativecommons.org/licenses/by/4.0/).
Share and Cite
Zhang, Z.; Zhou, Y.; Lai, S.; Wang, G.; Zhu, H.; Yang, Y. Influence of Power Supply Ripple on Injection Locking of Magnetron with Frequency Pushing Effect. Processes 2022, 10, 2124. https://doi.org/10.3390/pr10102124
Zhang Z, Zhou Y, Lai S, Wang G, Zhu H, Yang Y. Influence of Power Supply Ripple on Injection Locking of Magnetron with Frequency Pushing Effect. Processes. 2022; 10(10):2124. https://doi.org/10.3390/pr10102124
Chicago/Turabian StyleZhang, Zihao, Yongjie Zhou, Shimiao Lai, Ge Wang, Huacheng Zhu, and Yang Yang. 2022. "Influence of Power Supply Ripple on Injection Locking of Magnetron with Frequency Pushing Effect" Processes 10, no. 10: 2124. https://doi.org/10.3390/pr10102124