1. Introduction
Rapid technological progress allows for the initiation of more accurate, rapid, and cost-effective methods for determining the quality of solid drug forms. Numerous novel techniques, e.g., Raman spectroscopy, scanning electron microscopy, computed microtomography, directional hyperspectral reflectance, and hyperspectral analyses, allow analyses of the quality, authenticity, and stability of tested substances and drug forms [
1,
2]. The unquestionable advantage of these methods is that they save both time as well as the analyzed samples themselves, thanks to which they can still be used after testing.
Absorption, reflection, refraction, polarization, scattering, and emission of electromagnetic radiation occur as a result of the interaction between light and the medium on which the light falls. However, the effect of light falling on an object cannot be described by just one of the above terms. Some of the effects may be dominant, others marginal, depending on the wavelength and type of object. Reflectance is a quantity that describes the ratio of the light beam reflected from the boundary to the beam incident on the object [
3]. It depends on the existing conditions, the type of material, and the surface roughness and slope. Reflectance values range from 0 to 1; however, reflectance values can be above 1, e.g., for highly reflective surfaces [
4]. Total reflectance, total integrated scatter (TIS), as well as the mean squared deviation of the height of the roughness (σ) can be calculated [
5,
6].
In turn, hyperspectral imaging combines the advantages of spectroscopic and imaging techniques. A hyperspectral camera captures the radiation of a sample. This technology enables the simultaneous acquisition of chemical information about heterogeneous samples and the spatial distribution of chemical components [
7]. The recorded luminance is affected by various factors, such as the spectrum of the illumination source, the angle of incidence on the sample, atmospheric effects, shading, and sensor effects. Therefore, it is necessary to convert radiance to spectral reflectance with the various factors removed. Hyperspectral imaging devices acquire thousands of spectra in a short time, resulting in what amounts to a huge amount of data. This allows for the analysis of many aspects in a single analysis [
1,
8].
X-ray microtomography (computer microtomography) is a radiographic imaging technique in which X-rays are absorbed when passing through the evaluated object. The method allows for the non-destructive characterization of the microstructure of samples, distinguishing elements with an accuracy of up to 1 μm. Several factors are related to the radiation path as well as the amount of absorbed radiation, e.g., the size of the sample (the larger the sample, the longer the radiation path, and, in consequence, the more radiation is absorbed) and the material of which the object is made (the higher the density of this material, the higher the absorption of X-rays). In pharmacy, X-ray microtomography helps to observe all the defects caused by mechanical damage as well as those arising in the process of manufacturing samples, such as micro-cracks, air bubbles, and delamination [
9,
10].
The aim of the present study was to determine the usefulness of total directional hemispherical reflectance (THR), hyperspectral imaging, and computer microtomography in the analysis of the stability of tablets containing nifuroxazide during storage. These methods allow for rapid, non-destructive analysis of the structure of pharmaceutical forms, e.g., tablets, and require no sample preparation. The proposed methods can be used to document the aging process, by recording selected physicochemical parameters characterizing changes in the stored drug product. Nifuroxazide was selected as a model drug for this study. It is an oral nitrofuran antibiotic used to treat bacterial diarrhea [
11]. It has been shown to be active against most bacteria causing intestinal infections, both the Gram-positive ones (e.g.,
Staphylococcus and
Streptococcus) and the Gram-negative ones (e.g.,
Salmonella,
Shigella,
Klebsiella, Escherichia, Citrobacter, Enterobacter, Yersinia, as well as
Vibrio cholerae). In addition, the anti-cancer activity of nifuroxazide and nitrofuran derivatives has also been documented [
12]. It can also be used in the treatment of some inflammatory diseases [
13,
14].
2. Methods
2.1. Evaluation of Selected Preparations
Expired (n = 10; expiry date: November 2019; lot number: 111216) and unexpired (n = 10; expiry date: November 2024; lot number: 011221) coating tablets containing nifuroxazide (HASCO-LEK S.A., Poland) were analyzed. Additionally, four randomly selected unexpired tablets containing nifuroxazide were stored at 40 °C for 3 months (stressed tablets). All tested tablets were carefully evaluated in terms of dimensions and weight. Their external appearance was also assessed.
2.2. Analysis of Directional Hemispherical Reflectance
Directional reflectance was determined using an SOC-410 Directional Hemispherical Reflectometer (Surface Optics Corporation, San Diego, CA, USA) with seven wavelength bands from 335 nm to 2500 nm, i.e., in ultraviolet, visible, and near-infrared light. The results for total, diffuse, and specular reflectance were obtained for the beam at an angle of 20°. Two calibration coupons (mirror and diffuse, certified by the American National Institute of Standards and Technology) were used to calibrate the device before the measurement. Each tablet was measured in triplicate. The calibration process was repeated after testing 4 tablets.
In the study, total integrated scatter (TIS), mean squared deviation of the height of the roughness (σ), as well as the emissivity of the tablets (ε) were calculated based on the basis of reflectance values in each wavelength range.
TIS is the ratio of diffuse reflectance to total reflectance:
where Rd = diffuse reflectance; Rt = total reflectance.
The TIS value may be used to calculate σ from the following equation [
6]:
where λ = wavelength; ϴi = beam angle; TIS = total integrated scatter.
In addition, the emissivity (ε) of the analyzed tablets was evaluated according to the relationship:
where ε = emissivity; R = reflectance.
Emissivity is an important property of thermal control materials. According to Planck’s law, radiation is affected by surface temperature, and the intensity of radiation increases with temperature. The spectral emissivity of a given sample is hard to obtain at low temperatures. In our study, one emissivity ratio was determined for each type of tablet analyzed (i.e., expired, unexpired, and stressed tablets) for solar radiation, since the SOC-410 reflectometer emits radiation that is equivalent to solar radiation with respect to both wavelength and intensity for individual spectral ranges.
2.3. Hyperspectral Analysis
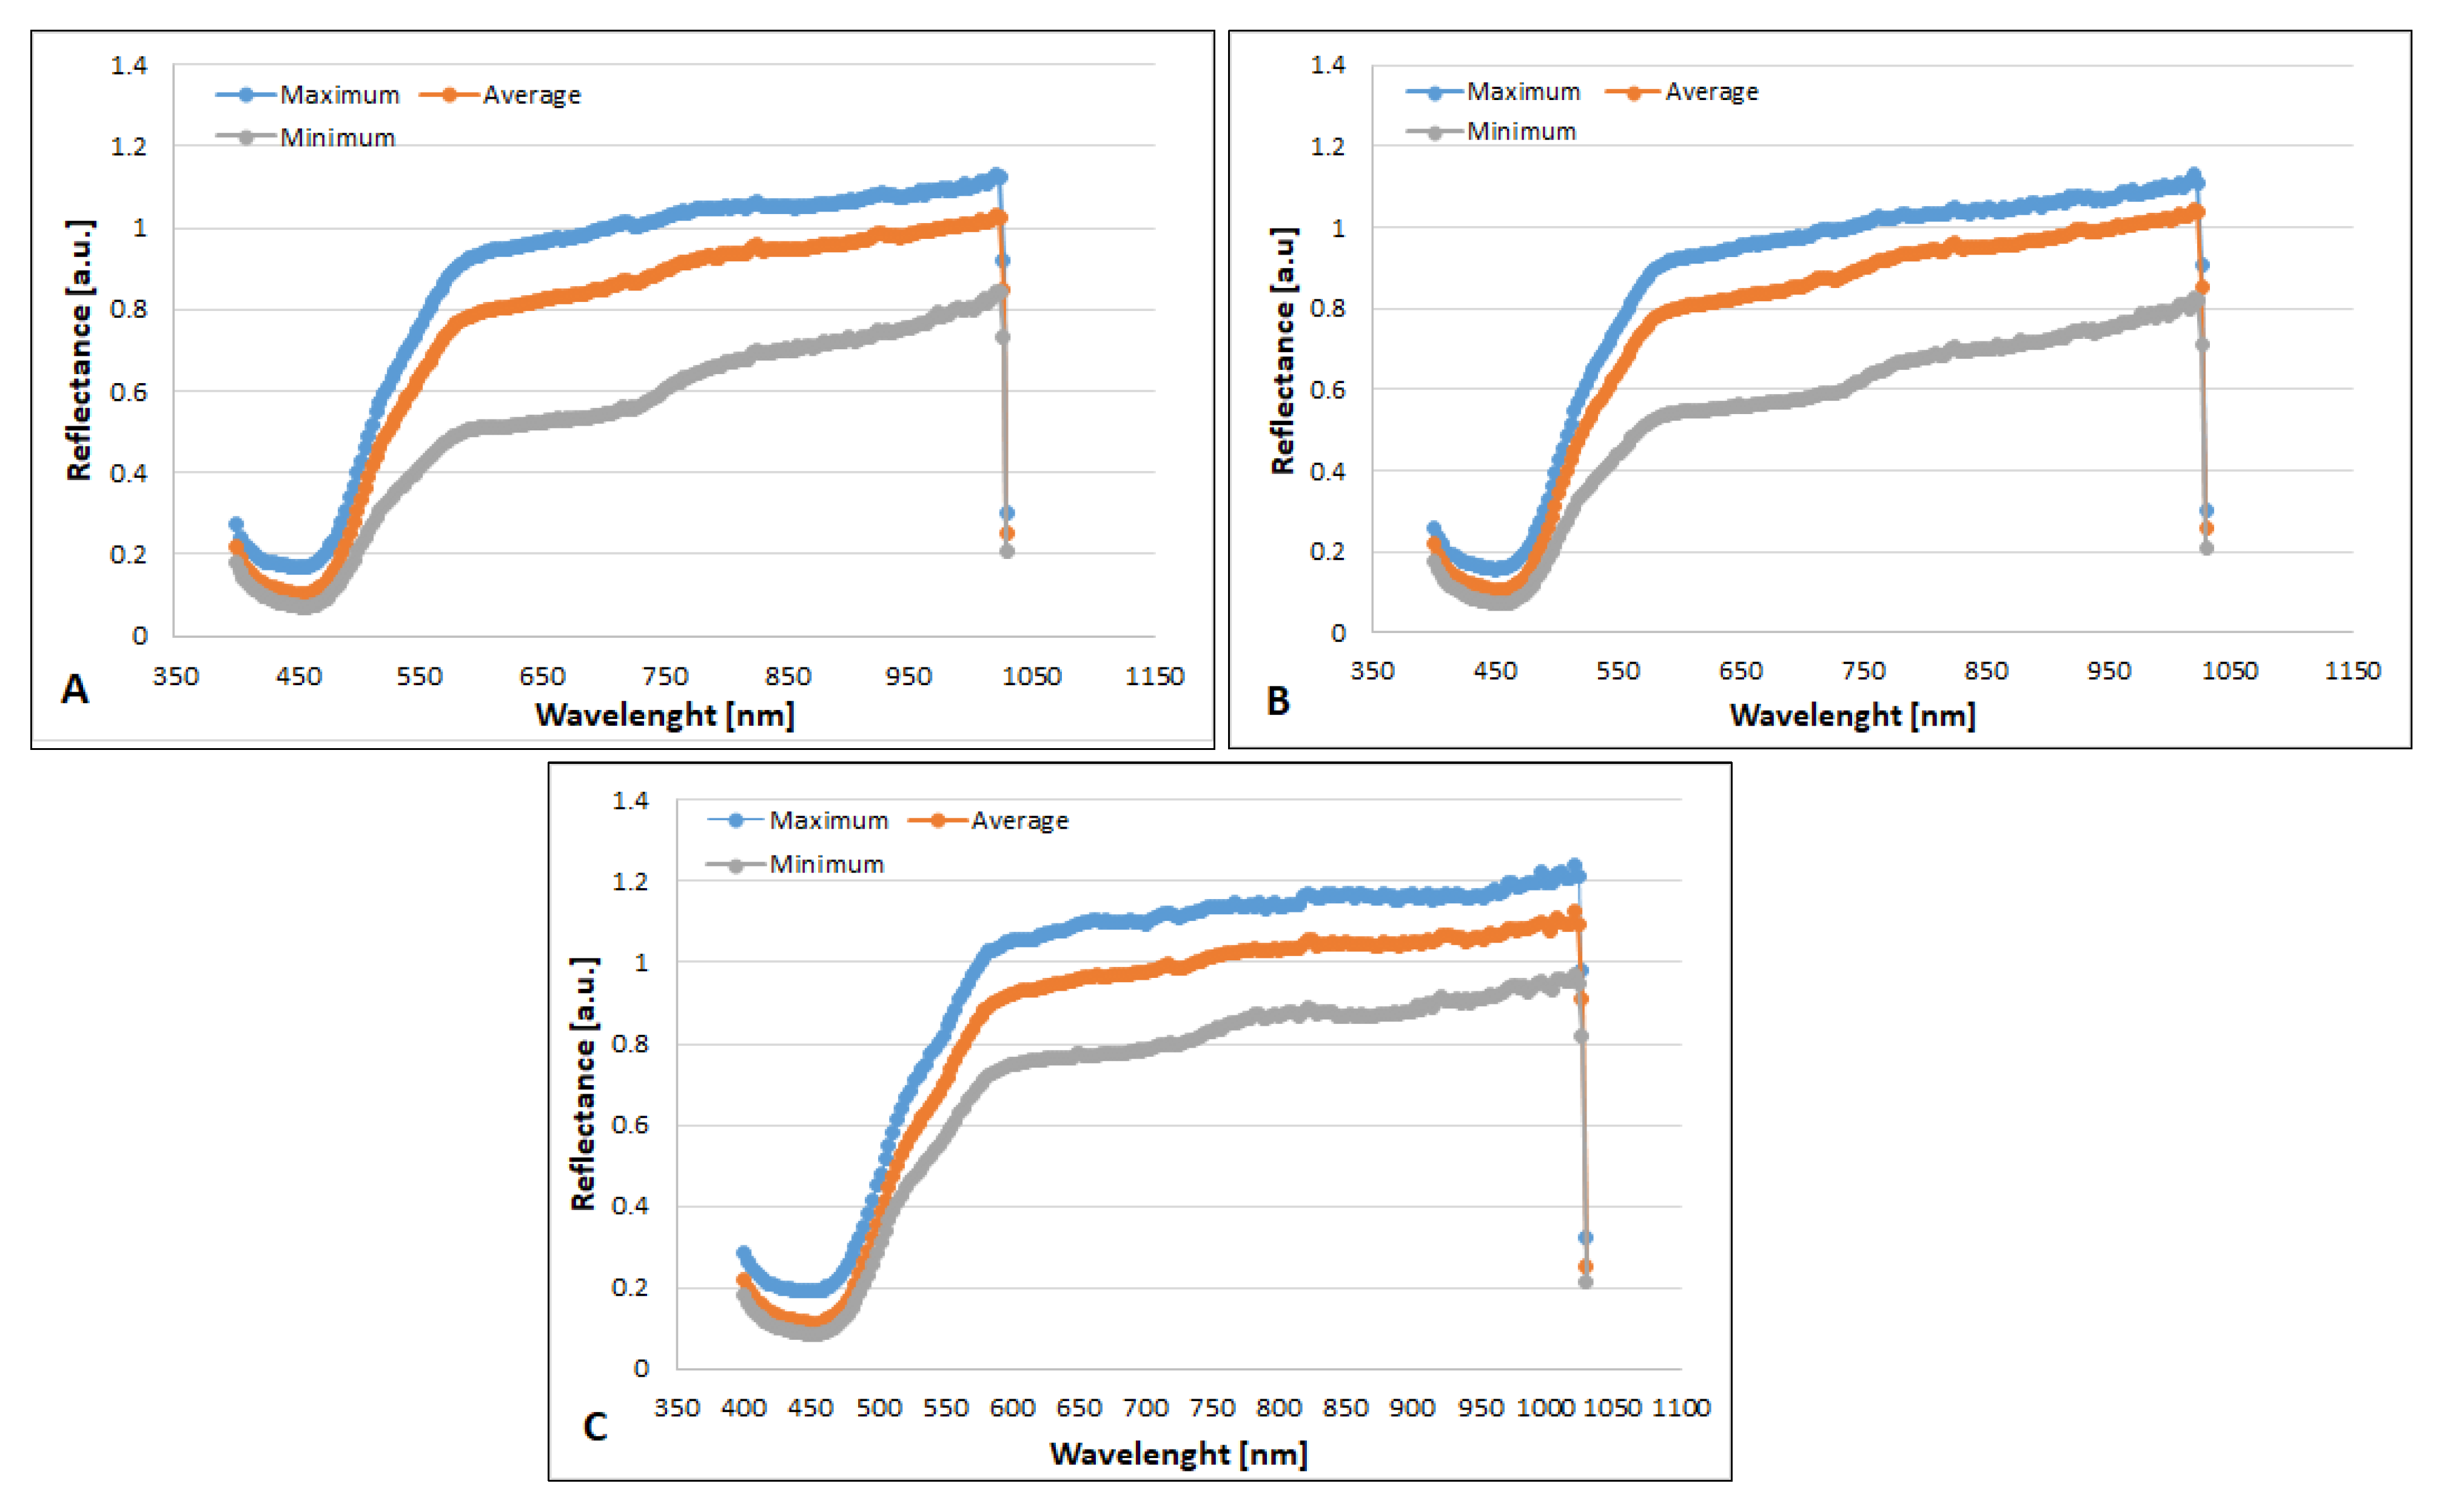
A hyperspectral analysis to compare the expired and unexpired nifuroxazide tablets was performed using a Specim IQ hyperspectral camera (Spectral Imaging Ltd., Oulu, Finland). Images with a resolution of 512 × 512 pixels and 204 spectral bands across the wavelength range from 400 nm to 1030 nm were obtained. Image analysis, conversion of raw data into a matrix, and extraction of the selected features were performed with the use of MATLAB Version 7.11.0.584 (R2010b) software.
The hyperspectral profiles of the analyzed tablets were compared to evaluate the homogeneity of the ingredients. There was an association between the differences between the curves in the hyperspectral profiles and the homogeneity of the ingredients of the tablets, i.e., the greater the difference between the maximum and minimum reflectance of the hyperspectral profile of the analyzed tablet, the lower the homogeneity.
2.4. X-ray Computer Microtomography
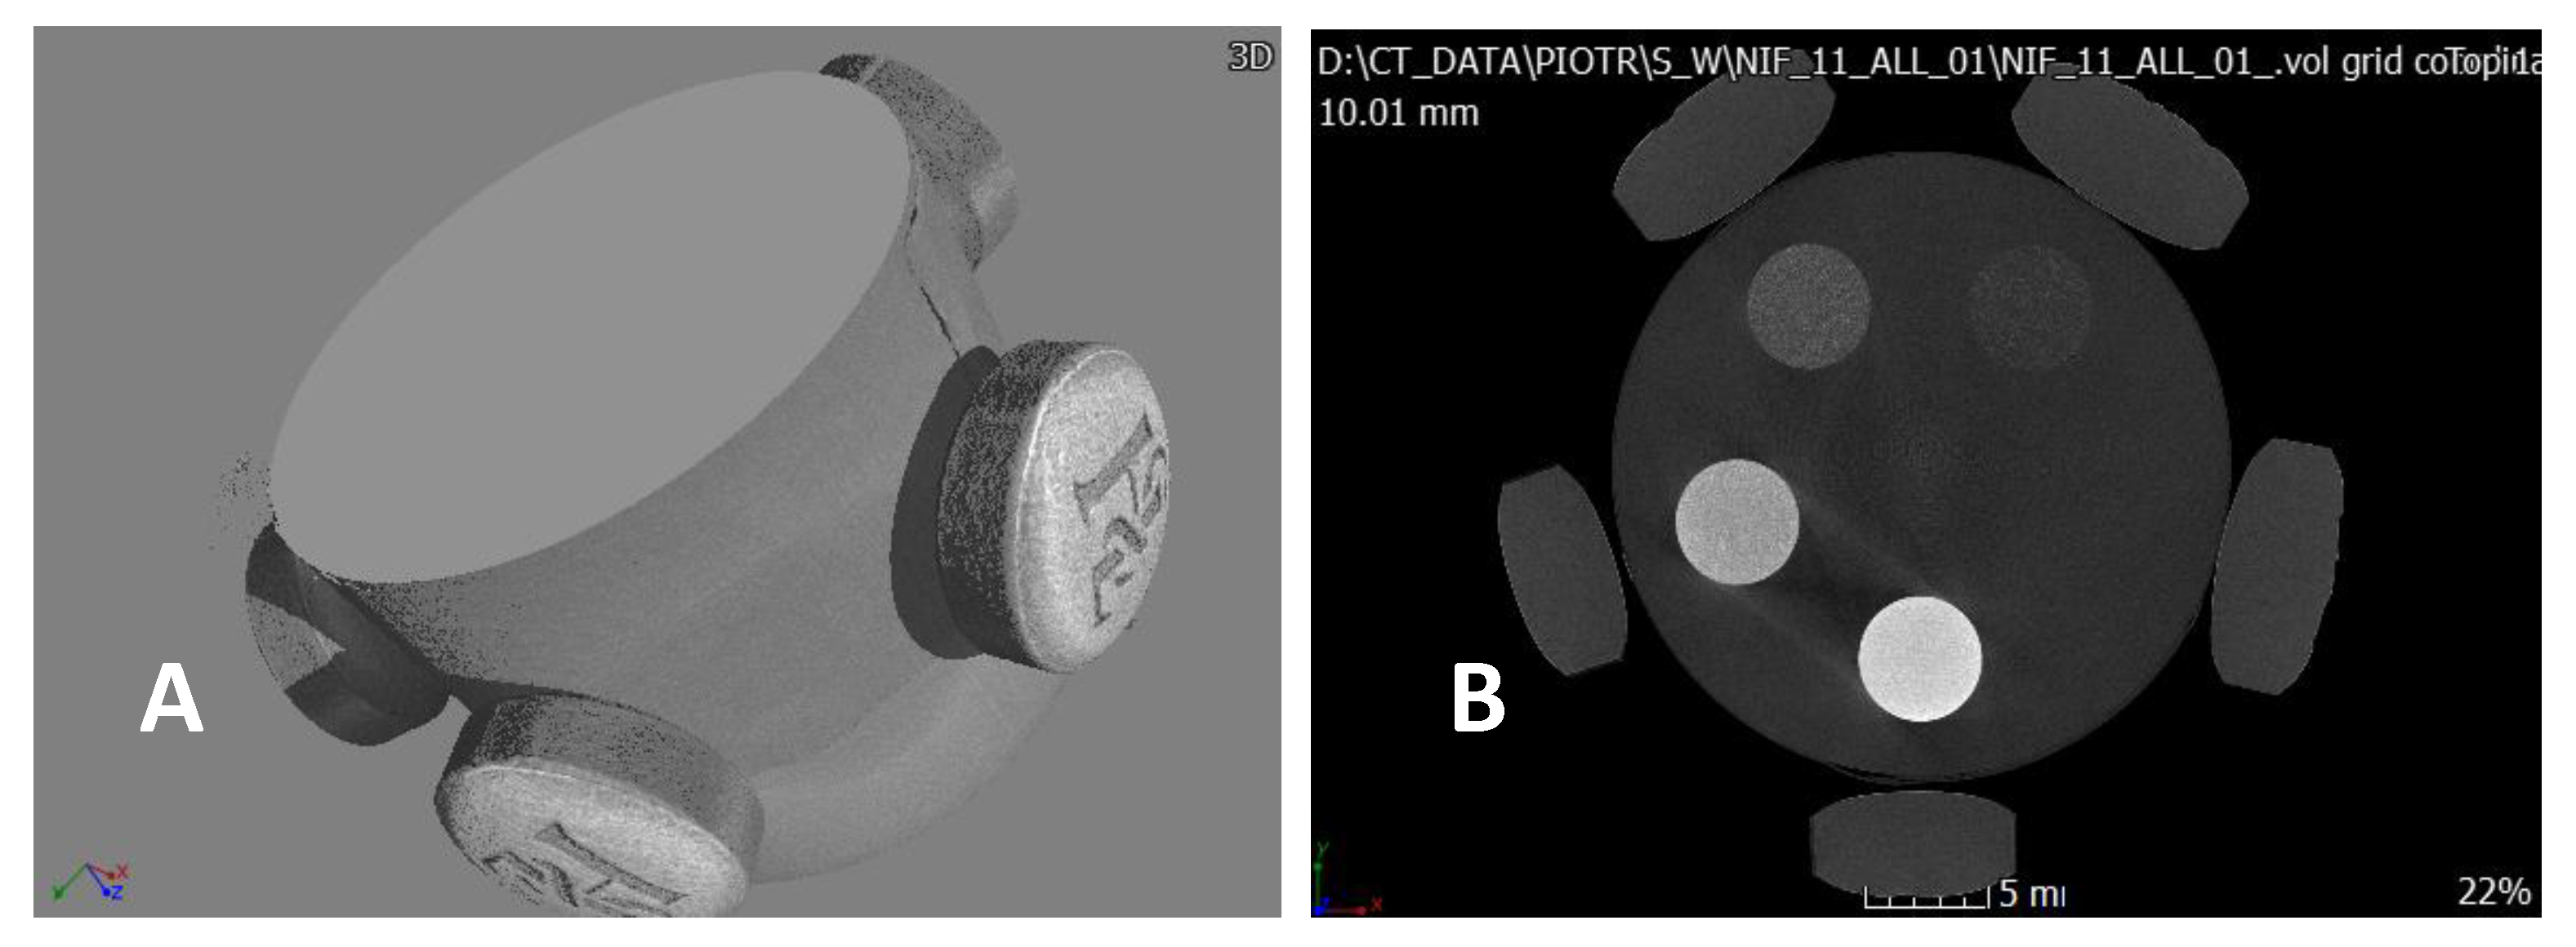
Each tablet was scanned using X-ray microtomography (Phoenix vǀtomeǀx, GE Sensing & Inspection Technologies GmbH, Wunstorf, Germany). The scanner manufacturer’s software, Phoenix Datos|x 2.0, was used for image acquisition and image reconstruction.
The tablets were scanned at an energy of 150 kV. X-rays passing through the sample were converted into visible radiation using a YAG: Ce scintillator. This allowed for image recording with a resolution of 2024 × 1200 pixels. A total of 2000 scans were recorded for each tablet, with a total scan time of 50 min and an amperage of 80 μA. To obtain the smallest possible voxel (i.e., the maximum image resolution), the appropriate distance between the sample and the matrix was established. Projections were acquired every 0.4°, with a total object rotation of 180°. The images with optimal contrast were registered with a resolution of 6.5 μm.
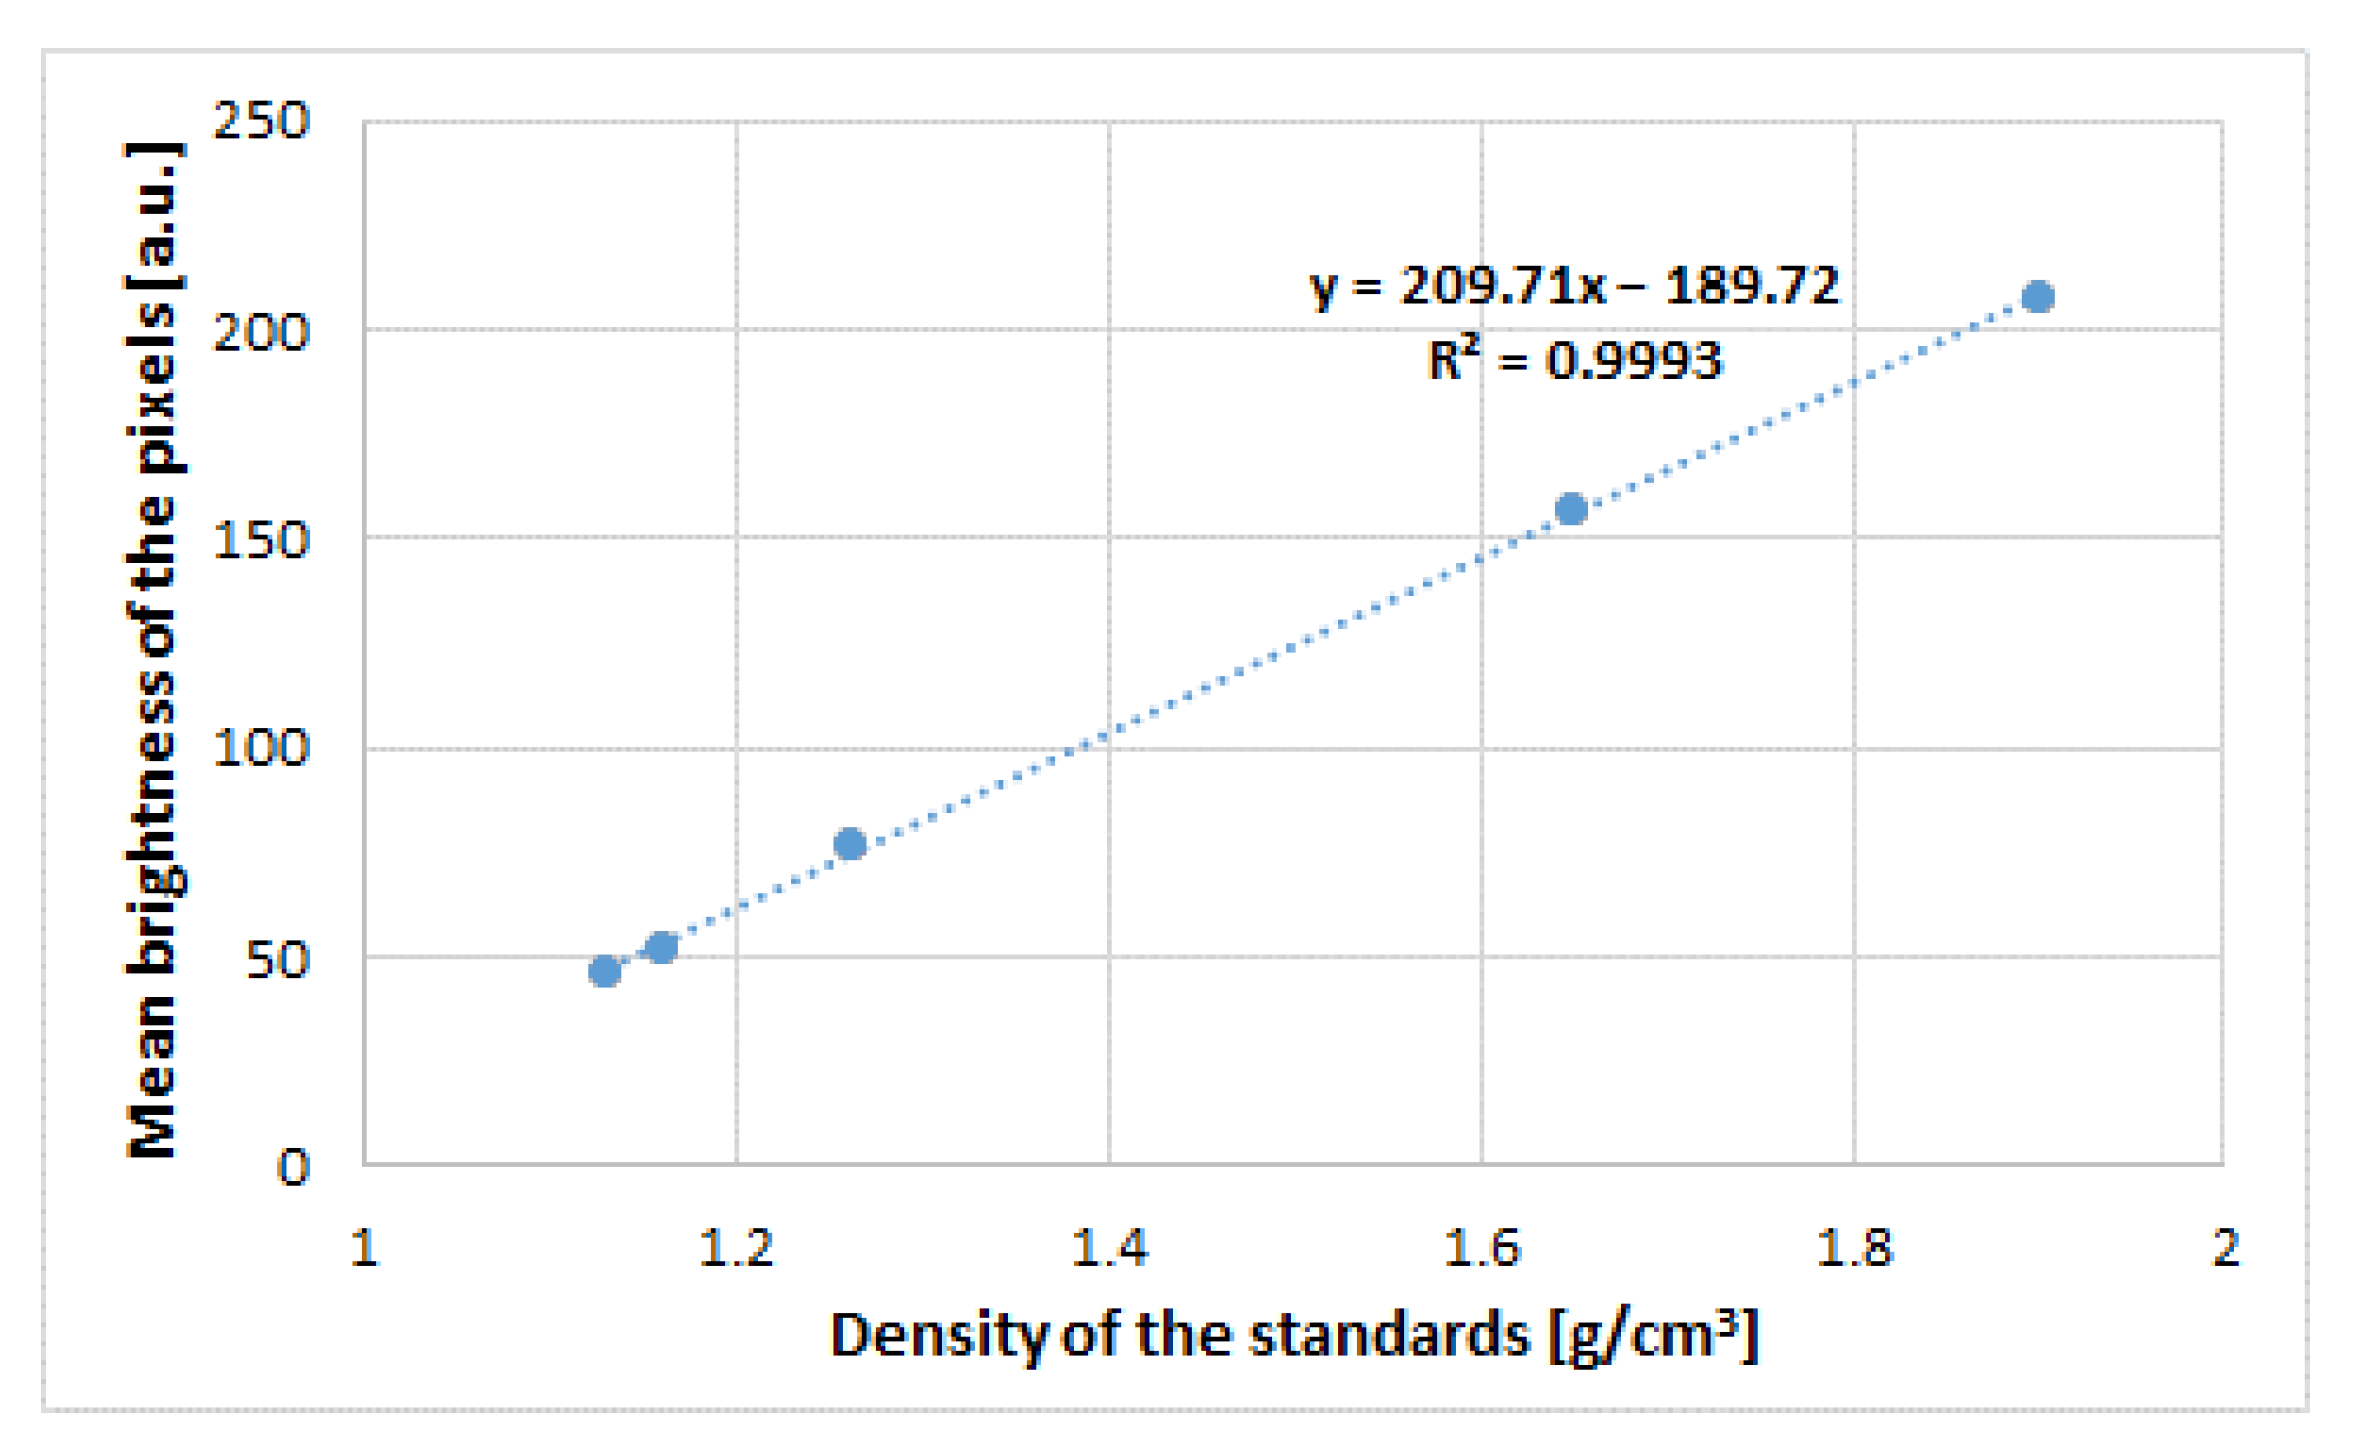
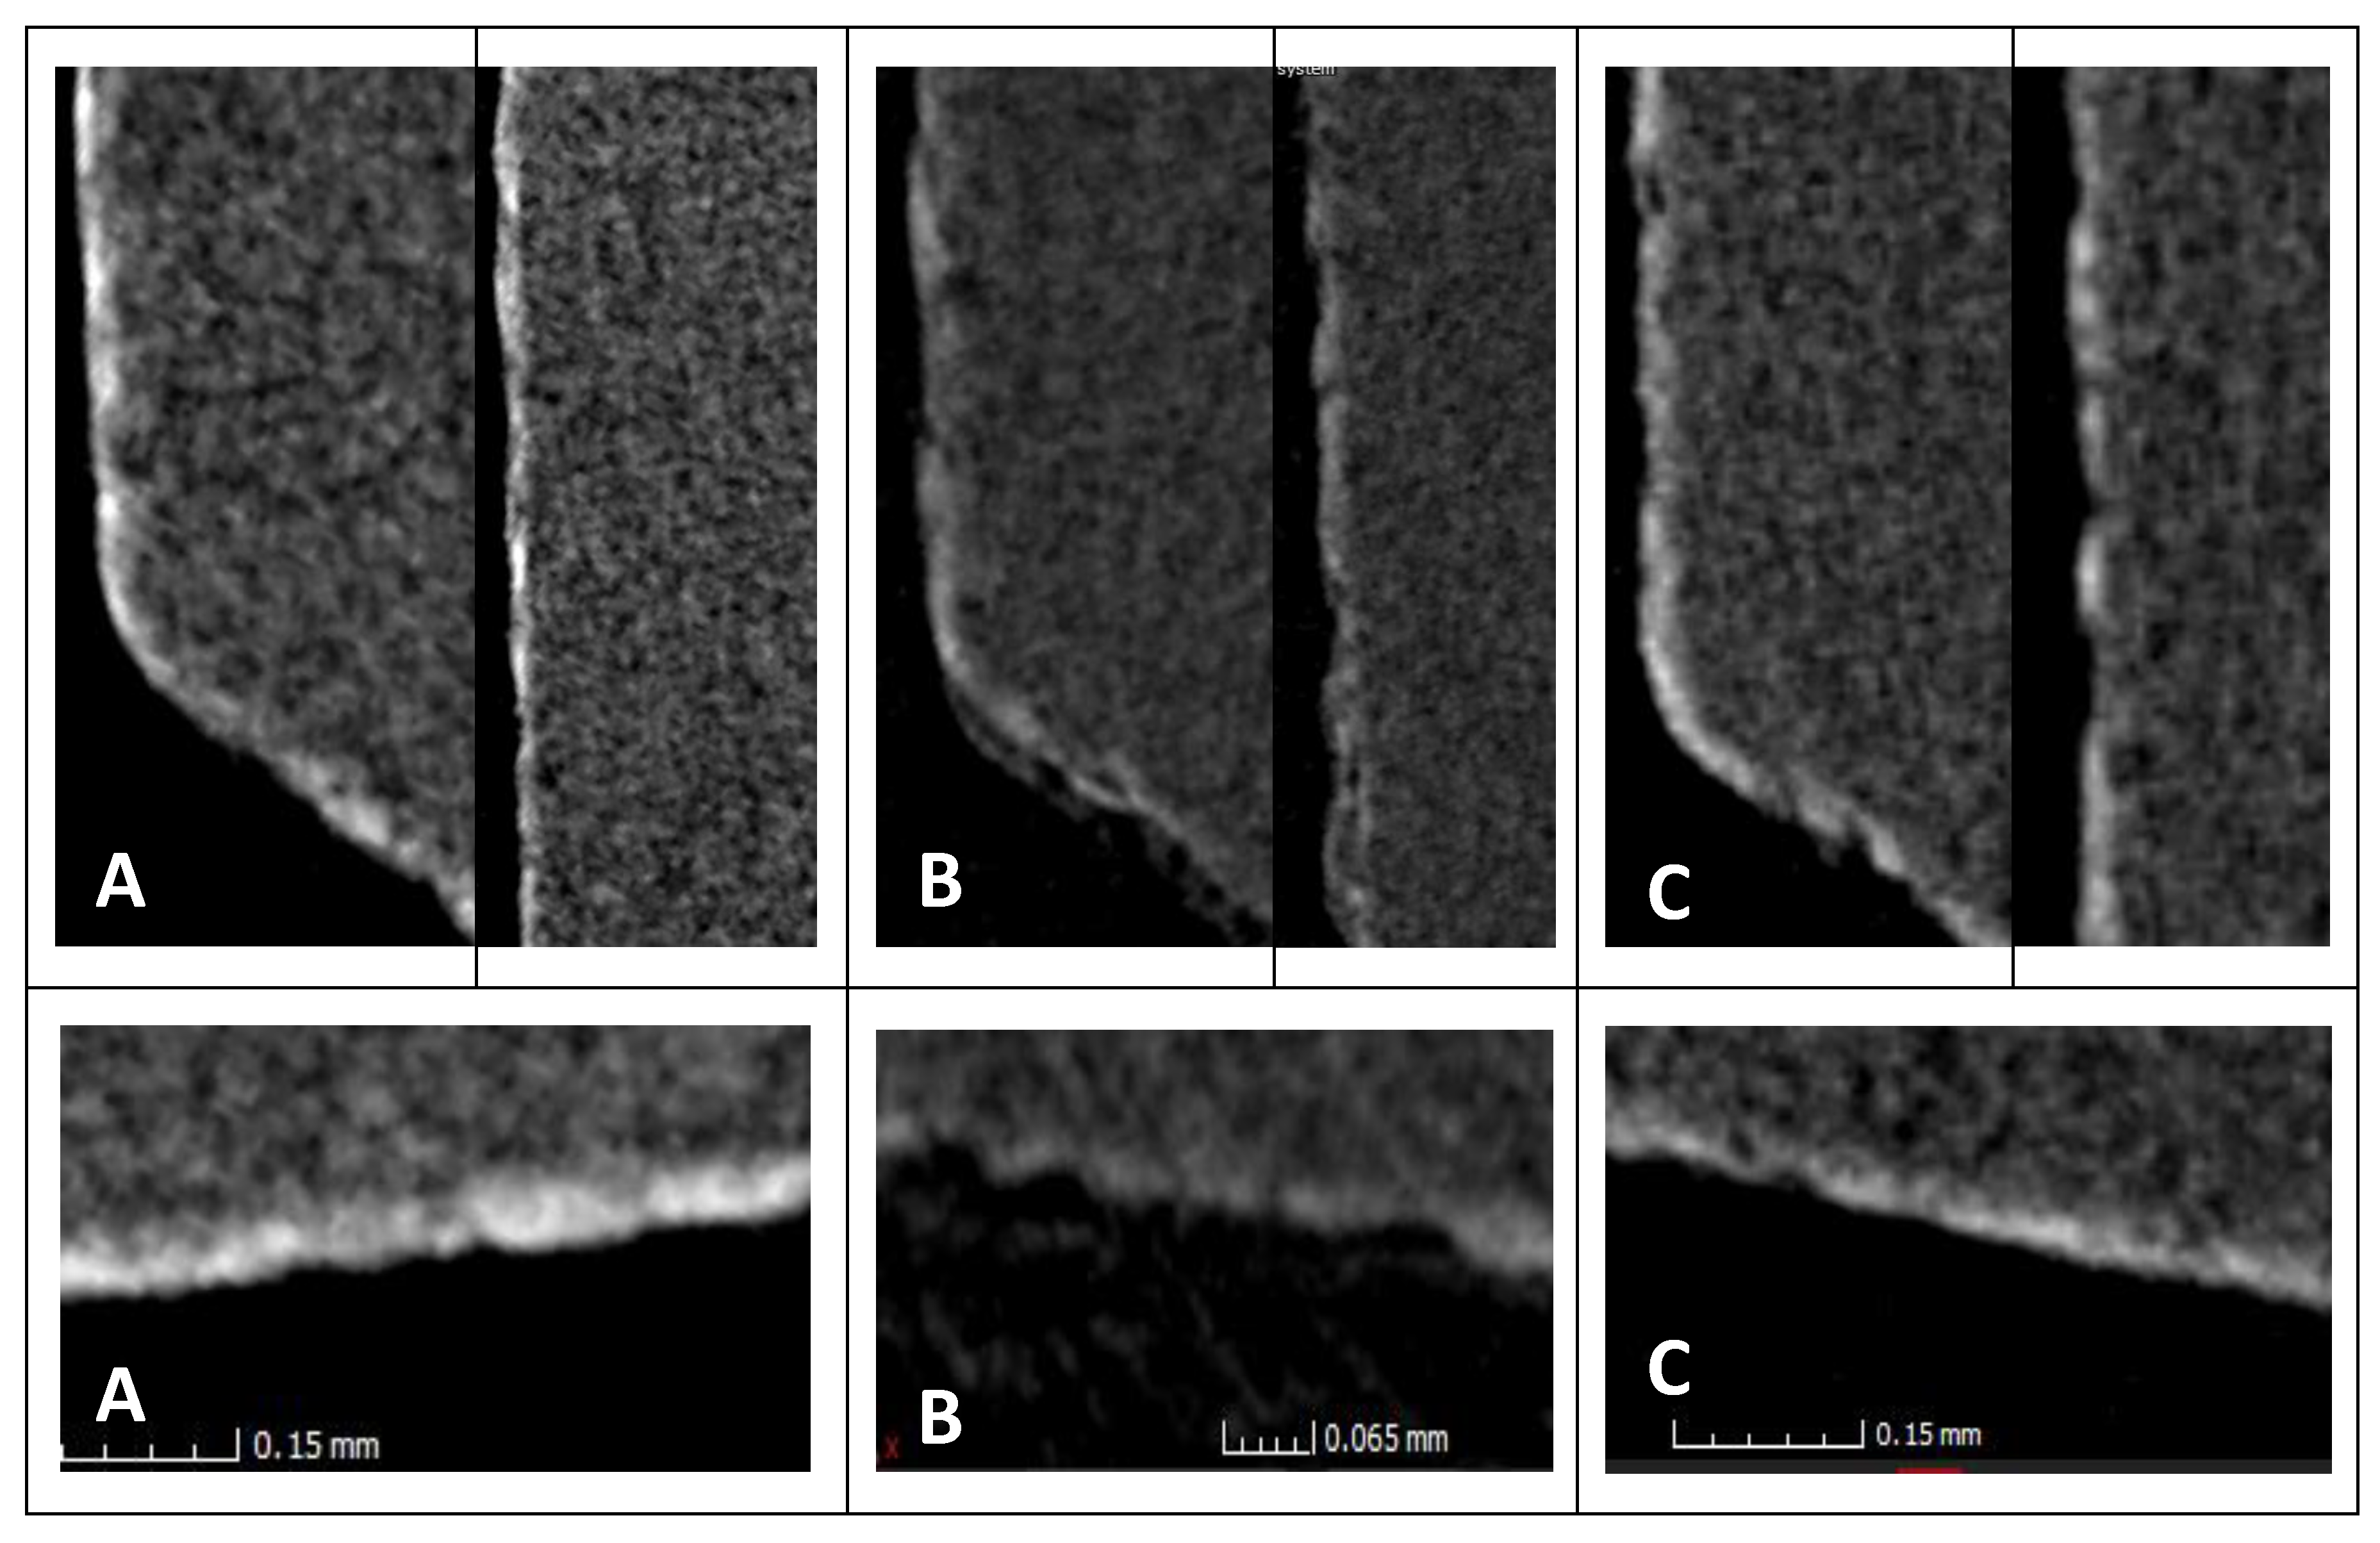
To compare the interiors of the expired and unexpired tablets, an analysis of density was performed, since the absorption of X-rays by a sample is proportional to its density. The measure of a sample’s density in a microtomographic image is the grayscale level. To establish the grayscale level of the reference density, a calibration phantom (Micro-CT HA Phantom D32) was simultaneously scanned under the same conditions as the analyzed tablets. We assumed that "bright" pixels represented high-density areas, while “dark” pixels represented low-density areas. Based on the histograms obtained with ImageJ software (ImageJ 1.53a; National Institutes of Health, Bethesda, MD, USA), a calibration curve was determined which in turn allowed assessment of the density of any area of a tablet’s scan.
2.5. Statistical Analysis
Statistical analyses were performed with the use of Statistica 13.0 software (STATSOFT; Statistica, Tulsa, OK, USA). Data were shown as means (Ms) with standard deviations (SDs). The normality of the distribution of quantitative data was evaluated by the Shapiro–Wilk W test. For the homogeneity of the variance, Levene’s test was used. Comparisons of the mean values of quantitative data among all analyzed tablets containing nifuroxazide (i.e., unexpired, expired, and unexpired stored at 40 °C) were performed using the following tests: analysis of variance (ANOVA), when no difference from the normal distribution was observed, or the Kruskal–Wallis test, when the distributions of quantitative data did differ from the normal distribution or the assumption of homogeneity was violated. In the case of significant differences observed using the Kruskal–Wallis test, post hoc pairwise comparisons between the tablets were performed using the Mann–Whitney U test. The value of p ≤ 0.05 was considered statistically significant.
4. Discussion
The effectiveness and safety of a medicinal product depends on its quality, not only during and after its manufacture but also during storage. Its quality can be defined as the degree to which the various requirements of the specification are met when the product properties are assessed. Most drugs are not properly stored when they reach patients, they may be exposed to adverse conditions (e.g., high temperature or high humidity), and, consequently, may become ineffective and not meet therapeutic requirements. Currently, thanks to the possibility of using the available modern analytical methods, the stability of medicinal products can be considered with respect to a wide range of factors, so that no features influencing the course of pharmacotherapy are overlooked. Machine vision, which provides qualitatively and quantitatively new data for imaged objects, is an area that is undergoing intensive development.
In the present study, three novel techniques were used to analyze the effects of tablet aging, i.e., THR, hyperspectral imaging, and X-ray microtomographic analysis. Until now, no data on the stability of solid drug forms obtained using these methods have been available, and, in general, data on their use in pharmacy are scarce. The study by Wilczyński et al. [
15] demonstrated the possible use of X-ray microtomography to distinguish original tablets from counterfeit ones. Similarly, this research team proposed hemispherical directional reflectance also for distinguishing falsified pharmaceuticals [
16]. On the other hand, analysis of reflectance and transmittance allows the prediction of drug contents in intact tablets over a wide range of tablets containing theophylline [
17]. In turn, Donoso et al. [
18] used the near-infrared diffuse reflectance spectroscopy method to measure the hardness and porosity of theophylline tablets, and the obtained results were comparable to the results from laboratory tests.
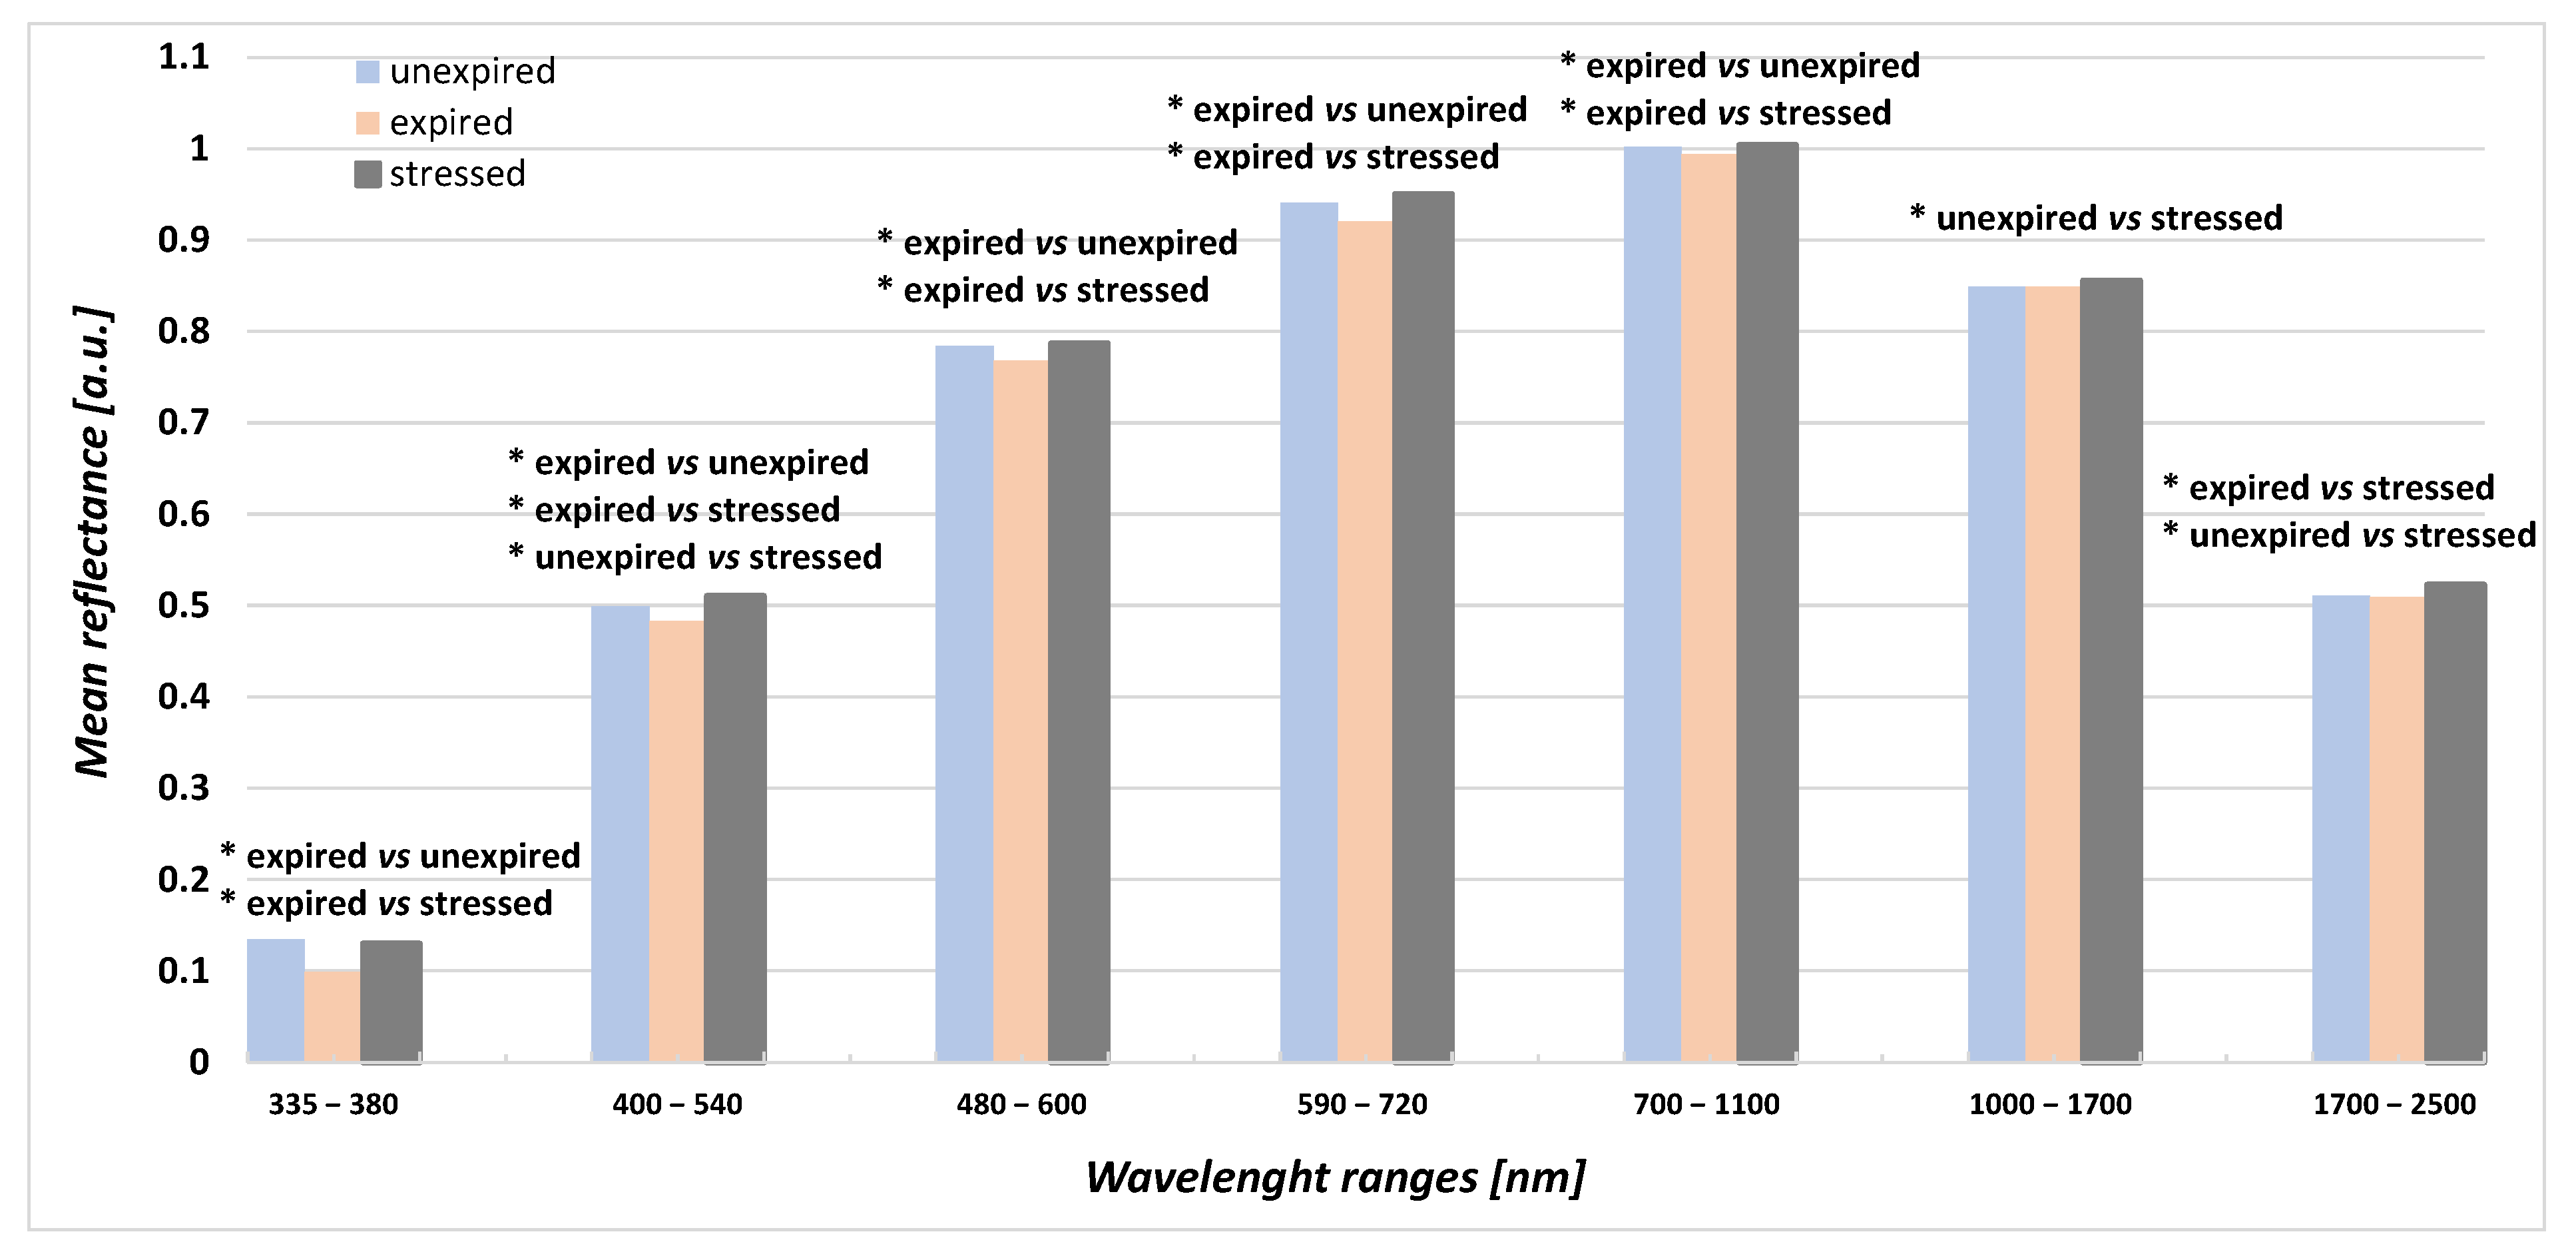
In our study, three groups of coating tablets containing nifuroxazide were used: unexpired, expired, as well as stressed tablets stored at 40 °C. In the reflectance analysis within the wide range of 335–2500 nm (seven spectral bands), the differences in mean THR values between all types of analyzed tablets were statistically significant for all spectral bands. The highest mean THR values were observed for the ranges of 590–720 nm and 700–1100 nm, while the lowest values were observed for the range of 335–380 nm, for all tablets. Within the range of 335–380 nm, the lowest mean THR values were found for expired tablets, while the highest were found for unexpired tablets. Lower hemispherical reflectance for the expired samples may be explained by some physicochemical changes that may have occurred during the storage, and, in this state, the reflectance of the light beam was lower, since more light was transmitted inside the tablet. In turn, no significant differences were found between the TIS and the mean squared deviation of the height of the roughness (σ) values. Reflectance, within the range of 400–1030 nm, was also assessed using a hyperspectral camera. The differences between the maximum and minimum reflectances varied significantly between the three analyzed types of tablets, indicating that the homogeneity of ingredient distribution in the unexpired tablets was similar to that in the expired tablets but surprisingly lower than in the stressed tablets.
The homogeneity of the distribution of the active ingredients of different densities in a pharmaceutical product can be determined using X-ray microtomography, as the brightness of the pixels in an X-ray scan correspond to the density of the analyzed area. This feature is the most important condition, allowing for the identification of the precise distribution of a substance throughout the sample volume.
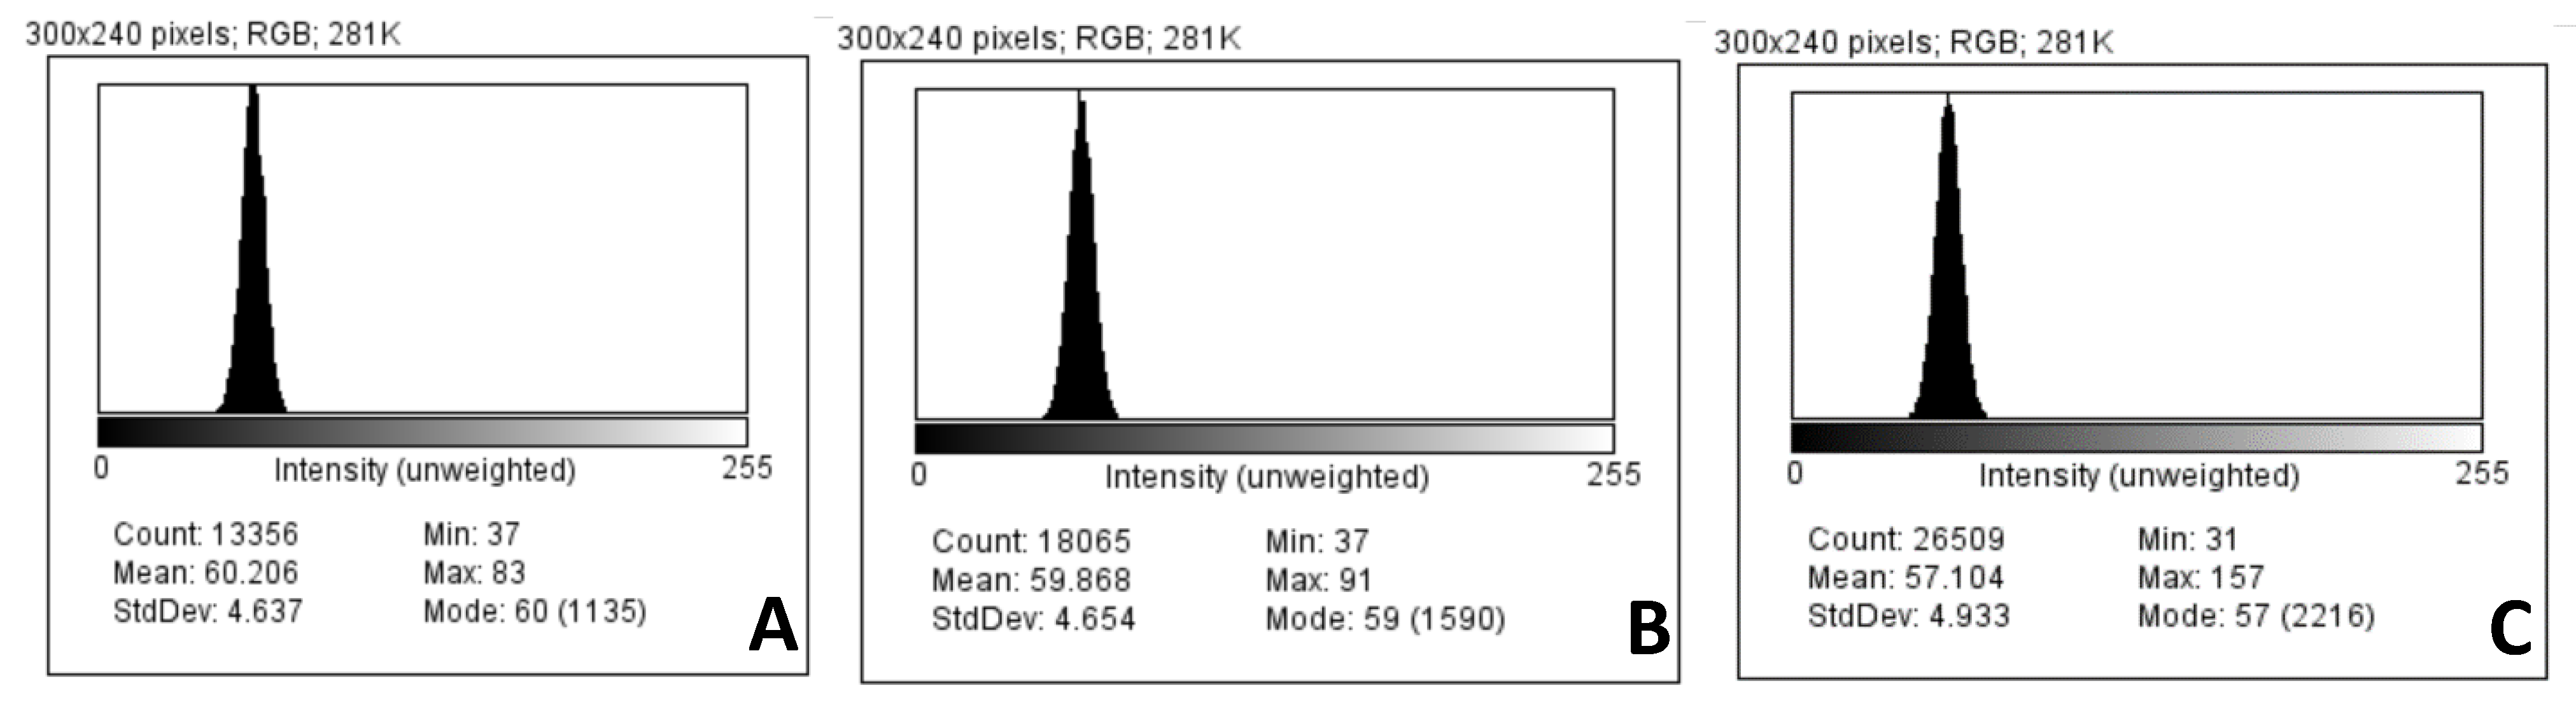
Our results demonstrated that stressed tablets had the lowest densities, which significantly differed when compared to those of unexpired and expired tablets. It was also shown that the densities of unexpired tablets were at a similar level to the densities of expired tablets. Thus, storage under stressful conditions may influence the density of tablet interiors.
Similarly, the assessment of average coating thickness based on microtomographic scans showed that temperature and storage time may have impacts on this parameter. We observed significant differences in coating thickness between the tested tablets. Expired tablets or stressed tablets had a significantly thinner coating layer compared to the unexpired tablets. Interestingly, it was observed that the thicknesses of the bottom and side surfaces of a single tablet, regardless of batch, differed from one another. Previous data demonstrated that several factors may affect coating uniformity [
19,
20]. Wilson and Crossman [
20] found that tablet shape significantly influenced intra-tablet coating uniformity. The authors observed the lowest relative thickness variation for round tablets: the more oval the shape, the greater the differences. In turn, Markl et al. [
19] showed that the thickness of the coating is thinner near the edges, where the convex side of the tablet meets the band. The use of imaging techniques in pharmaceutical sciences provides spatially separated information that can be used to better understand the quality, operation, and release mechanisms of solid dosage forms. There are few data, for example, on the effects of the storage conditions of pharmaceuticals on coating thickness. Earlier, terahertz pulsed imaging (TPI) was used to investigate the structure of tablet coatings before and after an accelerated aging process [
21]. The authors demonstrated that the coatings were reduced from 50 µm up to 40 µm in thickness and exhibited higher densities after being stored under accelerated conditions for four weeks. The study found no significant effects of physical changes on the coatings of the stressed tablets with respect to drug-release efficiency.
Tablet coating is a common process in the pharmaceutical industry. Several coating methods can be distinguished, of which by far the most frequently used method is coating with a polymeric coating. This process eliminates many potential problems, including masking the taste and smell, increasing patient comfort, ensuring better stability of the active pharmaceutical ingredient (API), and improving the appearance of the tablet. In turn, coating the tablets with functional coatings allows control of the time and place of release of API. Being able to accurately determine the quality of the coating is of great importance to determine not only the release profile (dissolution rate) but also the stability of the finished product. However, in the quality control of the finished product with a coating, in accordance with pharmacopoeial requirements, the assessment of pharmaceutical availability in vitro is practiced. It is a labor-intensive and cost-ineffective test and requires the use of several control apparatuses to conduct the dissolution and/or disintegration test and analyze the amount of the released API.
In the case of automated production, in order to obtain a product with appropriate parameters and reduce product failure, the process is controlled in real time (with process analysis technologies (PATs)), using different techniques, both spectroscopic, e.g., Raman or near-infrared spectroscopy, and microscopic, e.g., atomic force microscopy [
22,
23,
24,
25,
26,
27,
28,
29,
30,
31]. In industrial conditions, alternative methods are used to assess the effectiveness of tablet coatings to determine, among other attributes, coating thickness, color uniformity, surface roughness, and tablet erosion [
32]. Several research groups have shown that optical coherence tomography (OCT) can be used to monitor the coatings of tablets [
20,
22] and pellets [
33], and, very importantly, this method does not require the development of multidimensional analytical models and the destruction of tablets, as is the case with other methods, e.g., near-infrared [
34,
35] or Raman spectroscopy [
36,
37].
In addition, in order to optimize the coating process, mathematical modeling (e.g., computational fluid dynamics (CFD), the discrete element method (DEM), and Monte Carlo methods) is also used to determine the thicknesses and porosities of the shells in fluidized bed coatings [
38].
5. Conclusions
The methods presented in the study, i.e., hyperspectral imaging, X-ray microtomography, and hemispheric directional reflectance facilitate quantitative and qualitative analysis, including the assessment of parameters, such as coating thickness and uniformity, roughness, density, and homogeneity of distribution of both APIs and excipients. These techniques may be useful novel tools for monitoring the stability and quality control of solid dosage forms. The results indicated that total reflectance was lower in expired than in unexpired tablets for all spectral bands, except for 700–1100 nm and 1700–2500 nm. However, stressed tablets showed higher THR values than expired tablets for all spectral bands, except for 1000–1700 nm. In addition, hyperspectral analysis of the homogeneity of the tablets, as well as X-ray microtomography of tablet density and coating thickness, indicated that these parameters differed significantly between the analyzed tablets.
The photostability of solid drug formulations depends largely on the thickness of the coating layers, but it can also be affected by the concentration of the opacifying agent which absorbs or reflects light entering the drug product [
39]. Appropriate packaging also blocks the access of light to the drug. Particles that absorb light at wavelengths greater than 330 nm are considered unstable, although photodegradation can also occur at shorter wavelengths, in the order of 280 nm.
It should be noted that the present study has some limitations. First, the analysis of THR using the reflectometer did not take into account the radiation range below 335 nm. Second, the observed changes in the coating thicknesses of the stressed tablets require further study, using, for example, scanning electron microscopy. Moreover, in order to confirm the usefulness of the obtained data with respect to the use of the proposed methods for rapid screening assessment of physical changes occurring in stored pharmaceutical tablets, their possible correlation with the data obtained via the use of pharmacopoeial stability assessment methods should be assessed.


