Article

Box Girder Optimization by Orthogonal Experiment Design and GA-BP Algorithm in the Gondola Car Body

1
School of Intelligent Manufacture, Taizhou University, Taizhou 318000, China
2
Baotou Beifang Chuangye Co., Ltd., Baotou 014032, China
*
Author to whom correspondence should be addressed.
Processes 2022, 10(1), 74; https://doi.org/10.3390/pr10010074
Submission received: 23 November 2021 / Revised: 21 December 2021 / Accepted: 27 December 2021 / Published: 30 December 2021
(This article belongs to the Topic Modern Technologies and Manufacturing Systems)

Abstract

:
Box girder is an important bearing and force transmitting component in the gondola car body; the rationality of its structure directly affects the life of the whole car body. In order to solve disadvantage of the traditional box girder optimization method, which mainly depends on design experience, the combined method of orthogonal experimental design and the genetic algorithm-back propagation (GA-BP) algorithm is used for the structural optimization of bolster beam in this paper. Nine groups of parameters were established by orthogonal experiment, which can give typical samples for GA-BP optimization. Then, the bolster beam is optimized by the GA-BP algorithm, and the new gondola car body model is established with the optimized parameters. The finite element analysis results show that the minimum stress is found by using the GA-BP algorithm, which is basically consistent with the simulation results. Finally, the results show that the combined method of orthogonal experimental design and GA-BP algorithm is feasible to the box girder optimization of the gondola car body. Meanwhile, the optimization results of bolster beam will provide a reference for the structural design of the heavy haul wagon body.

1. Introduction

The box girder is generally welding or riveting from the outer plate and the internal stiffened plate, which has good characteristics such as high strength, high rigidity, and light weight. It is widely used in the fields of aerospace, aircraft, ship, railway vehicles, automobiles, machine tools, etc. [1,2,3,4], especially in the field of bridges [5,6]. In recent years, many scholars have widely studied the boxed girder structure design. The three-dimensional spreading of the tendon force in flanged sections is researched, and a computer-based tool is developed for plotting load paths in 3D bodies, from which the flow of forces in the box girder anchorage zone can be clearly visualized [7]. The study [8] dealt with the multi-scale optimization of composite structures by adopting a general global-local modeling strategy to assess the structure responses at different scales. The study [9] used the initial parameter method to analyze the distortion of simply supported box girders with an inner diaphragm considering the shear deformation of the diaphragm. The ultimate strength experiment was performed on different box girders, and the theoretical algorithm of ultimate strength was improved by comparative analysis of the experimental results [10]. The progressive collapse behaviors and ultimate strength characteristics of ship hull box girder models, made of high strength steel and ordinary strength steel, are studied by experimental method [11]. Cui [12] optimized the welding sequence of the box girder by the genetic algorithm, and its goal is to achieve reduced welding deformation.
With ten-year’s rapid development and innovation, China railway has achieved the development of speed-up and heavy haul with Chinese characteristics. Whether it is the high-speed railway passenger train or the heavy-duty railway heavy haul wagon, their car body includes a lot of box structures. Box structures are connected with each other in the underframe, which forms the main bearing structure of the car body. At present, the total number of wagons is 929,000 in China. Among them, the number of gondola cars is 528,600 [13]. Therefore, it is of profound significance for the optimization of the box structure in the gondola cars. In addition, the structural optimization of box girder is widely studied in the fields of bridge, ship, high-speed railway bogie, etc. However, the research on the gondola car body is still blank.
This paper systematically researched the optimization method and the optimization process of the box girder of the gondola car body. Meanwhile, according to the important role of bolster beams in the gondola car body, they was determined to be the research object. Firstly, the GA-BP algorithm based on orthogonal experimental design method and its optimization process are researched. Secondly, nine sets of parameters are obtained according to the orthogonal test method, then the finite element models are established and simulated. Finally, the structure of bolster beam is optimized, and the feasibility of the optimization method in this paper is verified.

2. Combination of Orthogonal Experiment and GA-BP

2.1. Mathematical Model

In structural optimization design, most of the optimization problems belong to the constrained optimization [14], and its mathematical expression is generally written as follows:
{ min f ( x ) x R n s . t . g j ( x ) = 0 j = 1 , 2 , , m h k ( x ) 0 k = 1 , 2 , , p
where x is design variables vector; f ( x ) is the objective function; g j ( x ) = 0 and h k ( x ) 0 are the equality and inequality constraints, respectively.
The box structure in the gondola car body is the most critical load-bearing component, and the fatigue cracks often appear in the box structure. Meanwhile, it is not significant to reduce the weight of the box girder as the optimization target, because the weight of the box girder has little effect on the tare weight. Therefore, the welded joint stress around the box girder is minimized as an optimized goal, and Equation (1) can be rewritten as follows:
{ min σ ( x ) x R n s . t . a h k ( x ) b k = 1 , 2 , , p
where x is the thickness of the part or the distance between parts; σ ( x ) is the stress of welded joint around the box girder; a and b are the value ranges of h k ( x ) .

2.2. Orthogonal Experimental Design

At present, there have been many experimental design methods, such as single factor test, double factor test, full factor test, Latin hypercube design, orthogonal experimental design, uniform experimental design, central composite design, Box-Behnken design, robust experimental design, etc. [15]. Each test method has a specific statistical model and applicability. Therefore, it is necessary to select the optimal test method according to the specific analysis model. The optimization of box structure is usually to optimize the position between parts or the parts’ dimension and thickness, and the control parameters are relatively few. Orthogonal experimental design has the characteristic that can give the optimal test scheme for the smaller number of levels.
The orthogonal test method is based on the principles of mathematical statistics. It selects the representative test samples from a large number of samples and uses the standardized orthogonal table to schedule a multiple factors test. Meanwhile, it has the characteristics of homogeneity and regularity, test efficiency can be improved, and the number of tests is reduced [16]. The accuracy of the neural network response surface is closely related to its generalization capabilities, generally by training and learning a set of samples and learning the relationship between sample input and output. Therefore, training samples are very important for neural networks. The training sample given by the orthogonal test form is not only general and can guarantee a certain number of samples, reducing the time of network learning sample training, increasing efficiency, and ensuring the generalization ability of the neural network response surface model.

2.3. Genetic Algorithm

Genetic algorithm (GA) can simulate the natural selection of organisms in nature and the biological evolution based on the genetic theory that derived from Darwin’s theory of evolution [17]. It has many advantages, such as it directly operates on objects so there is no limitation of derivation and continuity of function; it has inherent parallelism and fine global search capability; it uses a probabilistic optimization method, which can automatically obtain the search space and adaptively adjust the search direction without the certain rules. If the reasonable fitness function is selected, the structural optimization based on GA can achieve faster convergence calculation, and the optimization result is more reasonable. The calculation flow of the GA algorithm is shown in Figure 1.
According to the Figure 2, the calculation process of GA is as follows:
  • Coding. Coding is similar to a gene that represents the necessary information in DNA, the selected features that are coded, and the solution is a chromosome that is composed of a set of genes. The chromosome of the BP neural network is composed of weights and thresholds, and its length is determined by the numbers of input layers, hidden layers, and output layers.
  • Generating initial population. The individuals are randomly generated as the initial population, and the population is a set of feasible solutions of the objective function. The parameter N is determined according to the scale of the problem.
  • Individual evaluation. The initial population is substituted into the objective function, and the fitness of each population in the current population is calculated according to the fitness function. If the calculation result satisfies the requirements, the highest fitness individual in the objective function is obtained, which is output as the optimal solution of the problem, and the calculation is terminated. Otherwise, the calculation process is transferred to the selection operation.
  • Selection operation. The selection operation is to select excellent individuals from the population. Then it is used as a parent to breed offspring. This operation embodies the principle of survival of the fittest in Darwin’s theory of evolution.
  • Crossover operation. The crossover operation is to exchange some genes in the two parents by the crossover probability, to realize the exchange of information between individuals. This operation realizes the information exchange between individuals.
  • Mutation operation. Mutation operation is to select a certain number of individuals in the population and randomly change a certain gene value with the probability for the selected individuals. This operation provides opportunities for new individuals.

2.4. Combination of Orthogonal Experiment and GA-BP

Back propagation (BP) neural network is a multi-layer feedforward neural network that is trained with error back propagation [18]. According to the characteristics of the box girder optimization in the gondola car body, the three-layer BP neural network can be used, and literature [19] gives the basic principle and calculation method of the three-layer BP neural network in detail.
BP algorithm is a local search optimization method [20], it is easy to fall into local optimum, especially when the quantity of the sample is small, but we need to find the global optimal solution in structural optimization. Genetic algorithm has a good global search ability, and it can quickly search out all solutions in the solution space without falling into the trap of local optimal solutions; it can take advantage of inherent parallelism to solve quickly. However, the local search ability of genetic algorithm is poor, which makes the pure genetic algorithm time-consuming, and the search efficiency is low in the later stage of evolution. Therefore, GA and BP algorithm are combined to find the optimal solution in structural optimization. In addition, the orthogonal experimental design can provide the most typical samples. The calculation flowchart of the combined method is shown in Figure 2.
According to Figure 2, the detailed calculation process is as follows:
  • The three-layer BP neural network is adopted and coded with real numbers. The chromosome is encoded by the weight V, W, thresholds A, B of the BP neural network, and the chromosome length is
    S = n × m + m × l + m + l
  • The genetic algorithm is based on the fitness function during the evolutionary search process, and the fitness value of each chromosome is a basis for a gene in the next generation probability. The reciprocal of average difference error is used as the fitness function, and its calculation formula is
    f ( r ) = 1 ( D O ) 2 N
    where f ( r ) is the fitness value of the rnd chromosome, and N is the quantity of chromosomes.
  • According to the fitness value of the individual, the individual selection probability is calculated using a roulette gamble. Meanwhile, single point cross and uniform variation are used for genetic operation.
  • Finally, the initial weight and threshold of the BP neural network are obtained, and the calculation of the neural network is performed.

3. Research on Stress Distribution of Box Girder

3.1. The Structure of Gondola Car Body and Bolster Beam

In general, the gondola car body is welded with weathering steel Q450NQR1, and the study [21] gives structure introduction in detail. The car body includes two key types of box girders, which are the bolster beam and cross bearer. The 1/4 car body is shown in Figure 3.
The bolster beam is not only an important carrying component, but it is also the most important part used to transmit vertical and longitudinal forces that are from the coupler. Therefore, the bolster beam is taken as the research object in this paper. The bolster beam is the variable-section box structure, which is composed of upper cover, web, partition, lower cover, and bolster beam weld. The structure and part names are shown in Figure 4a. For easy description, the weld to the end of the car body is defined as bolster beam weld 1 (weld 1 for short), and the weld to the center of the car body is defined as bolster beam weld 2 (weld 2 for short), which are shown in Figure 4b.

3.2. Finite Element Model and Loading Method

The thickness of each plate is much smaller than the length, width, and height of the car body, so we can use shell elements for finite element simulation by Abaqus software. The mesh model is shown in Figure 5 and the weld line 1 is marked. The mesh is refined on a local part that connects with the bolster beam, and the model has 1,250,555 nodes and 1,262,507 units.
The load and loading method can refer to TB/T1335-1996 [22]. The load of the car body used in the finite element simulation is 80 tons, and the vertical force of the gondola car body is 1053.5 kN. The car body is respectively loaded with the stretch force of 1780 kN and the compression force of 1920 kN.

3.3. The Stress Distributions of Bolster Beam Welds

The finite element simulation results under vertical loading are shown in Figure 6, and the stresses of the bolster beam welds are extracted, which start from the side sill as shown in Figure 7. The same operation and the stress distributions under stretch force and compression force are shown in Figure 7. The following conclusions can be summarized as follows:
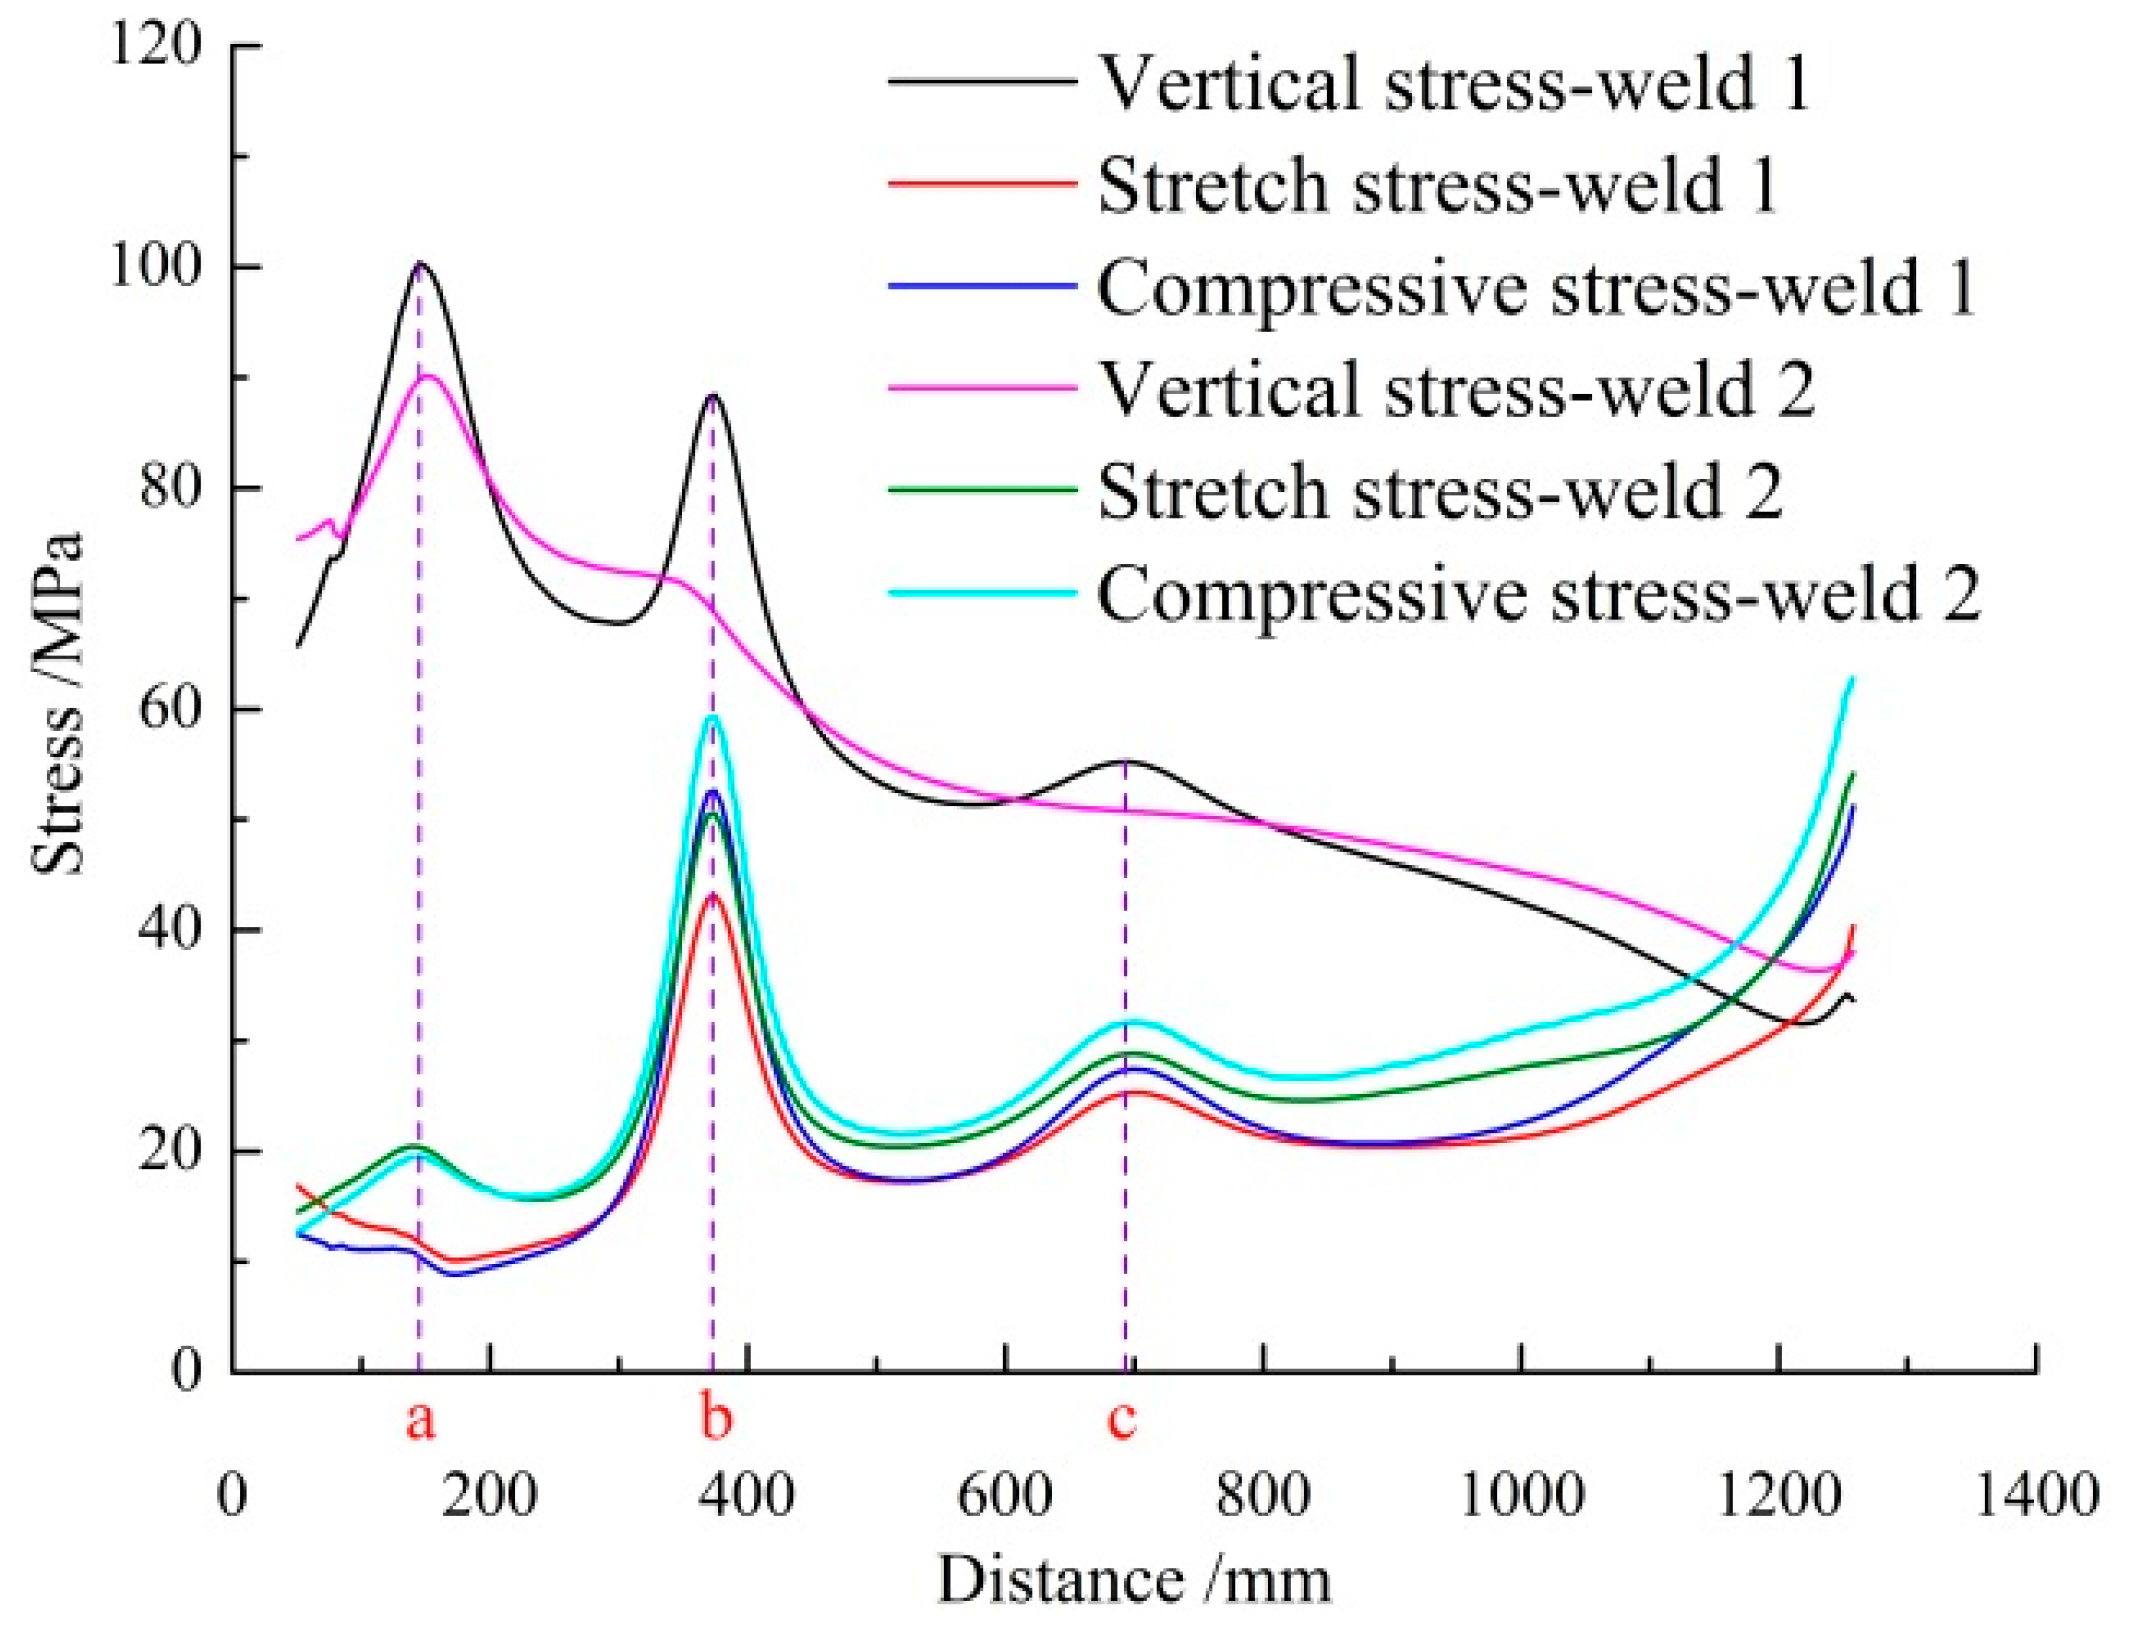
  • On the whole, the stress under vertical condition is highest, and the maximum of stress exceeds 100 MPa. Meanwhile, the stress gradient changes greatly, especially at 150 mm and 375 mm. The fundamental reason for the stress mutation is the stiffness mutation, and the positions of the stiffness mutations are shown in the Figure 7.
  • During vertical loading, the stress of weld 1 is higher than that of weld 2, and the stress of the two welds decreases gradually with the increase of distance. During stretch loading and compressive loading, the stress change trend is gentle and the upward trend except at 500 mm, and the stress is slightly fluctuated away from partition 1; the stress of weld 2 is higher than that of weld 1.
In addition, in the survey, the number of cracks in weld 1 is more than weld 2. Therefore, the stress distribution of weld 1 should be focused on analysis and research, and the stress on the key point can be considered as the optimized target in this paper.

4. Structure Optimization of Box Girder

4.1. Determination of Optimization Parameters

According to the structure of the gondola car body and bolster beam, we know that there are many factors affecting the stress of weld 1. The most important factors are the thickness of the upper cover and the web and the distance between two webs. Meanwhile, the increase or decrease the plate thickness of the bolster beam’s parts has little effect on the self-weight coefficient, so the lightweight design of the bolster beam is meaningless. In fact, during the actual application process, most of the cracks of the gondola car body are due to the low strength in key part. Therefore, the stress at the critical position is the most practical significance as optimization goals. In addition, combined with the design experience of the gondola car body, the mathematical model of bolster beam structure optimization is:
{ σ ( t u , t w , d ) 4 t u 8 4 t w 10 300 d 340
where σ ( t u , t w , d ) is the target function that is stress at the critical position; t u is the thickness of the upper cover; t w is the thickness of two webs; d is the distance between the two webs.

4.2. Stresses Extraction

In order to obtain the typical training samples of GA-BP, according to three independent variables of optimization functions, as well as typical plate’s thickness and distance between the two webs. We can define three levels of the orthogonal experiment table with t u , t w , and d , as shown in Table 1. Then, the orthogonal experiment table with four-factor and three-level is established, as shown in Table 2.
According to the Table 2, nine finite element models of the car body are established, and the finite element simulation is performed. The simulation results are shown in Figure 8.
According to Figure 8, the variation trend of the nine stress distribution curves is basically the same, and all points of the maximum stresses are around 150 mm. Therefore, we can take the minimum stress at 150 mm as the optimization goal. The stress of each model at 150 mm is shown in Table 2.

4.3. GA-BP Optimization Analysis

Firstly, according to the data from Table 2, we can use them as the training samples for BP neural networks, and they are normalized. Secondly, the three-layer neural network is created by the newff() function in the MATLAB toolbox, in which three input neurons, seven hidden layer neurons, one output neuron, and the mean variance target is 10−3. Thirdly, the GA method is used to further optimize the data. The initial population size is 50 and the number of iterations is 1000, which were coded with real numbers and new individuals were selected with the roulette method. In addition, in order to compare and analyze the convergence effect of method GA-BP, the data in Table 2 are also trained by the BP algorithm. The two average fitness curves are shown in Figure 9. We can clearly see from Figure 9 that the convergence speed by BP-GA algorithm is faster, and the efficiency is higher. The best fitness value is found after about 650 generations by BP-GA algorithm, in other words, the optimal solution is found, and the optimization results are listed in Table 3.

4.4. Optimization Results Verification

According to the optimization parameters, the new finite element model is established. In order to be clear, visible, and convenient for comparative analysis, this stress distribution curve is plotted in Figure 10, which is shown together with the curve in Figure 8. We can see that the optimized model is minimal at 150 mm, which is shown in Table 3, and the stress on the entire weld is less than other models. This result shows that the GA-BP method is reasonable and feasible in the box girder optimization of the gondola car body.

5. Conclusions

The main conclusions are as follows:
(a)
GA-BP algorithm and the orthogonal experiment method were first applied to optimize the box girder of the gondola car body, and the optimization process is systematically given in this paper. The results show that the stress of optimized bolster beam at 150 mm is the smallest, which is consistent with expectations.
(b)
The disadvantage of traditional car body finite element simulation analysis, that the designer only pays attention to the point of maximum stress, has been avoided, and the stress distribution curve of the bolster beam weld is also focused on. This analysis method can visually see the stress extreme points and can provide the basis for determining the optimization target of the bolster beam.
(c)
Nine bolster beam models have been established and simulated through orthogonal experimental design. The GA-BP algorithm calculated the stresses of nine stress distribution curves at 150 mm, and the results show that the algorithm converges fast and finds the optimal parameters easily.

Author Contributions

The following statements could be used. W.L. conceived and wrote the paper; W.L. and T.W. used abaqus software to simulate the gondola car body; Y.W. revised the paper. All authors have read and agreed to the published version of the manuscript.

Funding

This research was funded by the public technology application research of Zhejiang province (Grant number: LGG22E050014).

Conflicts of Interest

The authors declare no conflict of interest.

References

  1. Scardaoni, M.P.; Montemurro, M.; Panettieri, E. PrandtlPlane wing-box least-weight design: A multi-scale optimization approach. Aerosp. Sci. Technol. 2020, 106, 106156. [Google Scholar] [CrossRef]
  2. Feng, L.; Dong, S.; Wang, B.S.; Zhen, C. Simplified method for calculating ultimate bending moment of box girder. J. Harbin Eng. Univ. 2017, 38, 351–355. [Google Scholar]
  3. Bai, L.H.; Shen, R.L.; Yan, Q.S.; Wang, L.; Miao, R.; Zhao, Y. Progressive-models method for evaluating interactive stability of steel box girders for bridges-Extension of progressive collapse method in ship structures. Structures 2021, 33, 3848–3861. [Google Scholar] [CrossRef]
  4. Liu, W.F.; Liu, Z.M.; Hu, W.G.; Zhang, L.; Tian, Y.L. Structural Optimization of Wagon Body Based on Orthogonal Design and GA-BP Algorithm. J. China Railw. Soc. 2019, 41, 27–34. [Google Scholar]
  5. Agarwal, P.; Pal, P.; Mehta, P.K. Parametric study on skew-curved RC box-girder bridges. Structures 2020, 28, 380–388. [Google Scholar] [CrossRef]
  6. Song, L.; Li, X.Z.; Zheng, J.; Guo, M.; Wang, X. Vibro-acoustic analysis of a rail transit continuous rigid frame box girder bridge based on a hybrid WFE-2D BE method. Appl. Acoust. 2020, 157, 107028. [Google Scholar] [CrossRef]
  7. He, Z.Q.; Hong, H.; Liu, Z.; Ma, Z.J. Three-dimensional spreading of prestressing forces in box girders. Structures 2021, 33, 4803–4816. [Google Scholar] [CrossRef]
  8. Scardaoni, M.P.; Montemurro, M. A general global-local modelling framework for the deterministic optimisation of composite structures. Struct. Multidiscip. Optim. 2020, 62, 1927–1949. [Google Scholar] [CrossRef]
  9. Ren, Y.Z.; Cheng, W.M.; Wang, Y.Q.; Wang, B. Distortional analysis of simply supported box girders with inner diaphragms considering shear deformation of diaphragms using initial parameter method. Eng. Struct. 2017, 145, 44–59. [Google Scholar] [CrossRef]
  10. Nshihara, S. Analysis of ultimate strength of stiffened rectangular plate (4th report) on the ultimate bending moment of ship hull girders. J. Soc. Nav. Archit. Jpn. 1983, 154, 367–375. [Google Scholar] [CrossRef]
  11. Gordo, J.M.; Soares, C.G. Tests on ultimate strength of hull box girders made of high tensile steel. Mar. Struct. 2009, 22, 770–790. [Google Scholar] [CrossRef]
  12. Cui, X.F.; Ma, J.; Zhao, H.Y.; Zhao, W.Z.; Meng, K. Optimization of welding sequences of box-like structure based on a genetic algorithm method. Trans. China Weld. Inst. 2006, 27, 5–8. [Google Scholar]
  13. Liu, W. Research on Fatigue Strength Evaluation and Structure Optimization of Heavy Haul General Purpose Gondola Car Body; Beijing Jiaotong University: Beijing, China, 2019. [Google Scholar]
  14. Wei, Z.X.; Lu, S. Nonlinear Optimization Algorithm; Science Press: Beijing, China, 2015. [Google Scholar]
  15. Zhang, Y. Multidisciplinary Optimization of Railway Wheel Web Shape Based on Intelligent Algorithm; Beijing Jiaotong University: Beijing, China, 2018. [Google Scholar]
  16. Fang, K.T.; Ma, C.X. Orthogonal and Uniform Experimental Design; Science Press: Beijing, China, 2001. [Google Scholar]
  17. Zhai, Y.F.; Li, H.Y.; Liu, H.B.; Yuan, X.M. Method for Optimizing Initial Weights of ANNs by GAs. J. Jilin Univ. (Eng. Technol. Ed.) 2003, 33, 45–50. [Google Scholar]
  18. Huang, J.G.; Luo, H.; Wang, H.J.; Long, B. Prediction of time sequence based on GA-BP neural net. J. Univ. Electron. Sci. Technol. China 2009, 38, 687–692. [Google Scholar]
  19. Liu, W.F.; Zhang, Y.J.; Liu, Q.T.; Zhang, B.; Fu, Q. Structural optimization of the heavy haul wagon body based on MPSO-BP algorithm. Trans. Can. Soc. Mech. Eng. 2021, 45, 461–472. [Google Scholar] [CrossRef]
  20. Yan, C.L.; Hao, Y.X.; Liu, K.G. Fatigue life prediction of materials based on BP neural networks optimized by genetic algorithm. J. Jilin Univ. (Eng. Technol. Ed.) 2014, 44, 1710–1715. [Google Scholar]
  21. Liu, W.F.; Zhang, Y.J.; Li, N.; Wang, L. Research on stress intensity factor and fatigue crack propagation rate of the general-purpose gondola car body. Trans. Can. Soc. Mech. Eng. 2021, 45, 297–307. [Google Scholar] [CrossRef]
  22. TB/T1335. Code for Strength Design and Test Evaluation of Railway Rolling Stock; China Railway Publishing House: Beijing, China, 1996. [Google Scholar]
Figure 1. The flowchart of GA.
Processes 10 00074 g001
Figure 2. The flowchart of the combined method.
Processes 10 00074 g002
Figure 3. The structure of gondola car body and its key box girders.
Processes 10 00074 g003
Figure 4. Bolster beam and its weld (a) the structure and parts’ name; (b) the definition of bolster beam weld.
Processes 10 00074 g004
Figure 5. Finite element model of the gondola car body.
Processes 10 00074 g005
Figure 6. The finite element simulation results under vertical loading.
Processes 10 00074 g006
Figure 7. The stress distribution of bolster beam welds: (a) the distance between side sill and outer edge of interior reinforcement; (b) the distance between side sill and partition 1; (c) the distance between side sill and partition 2.
Processes 10 00074 g007
Figure 8. The stresses distributions of weld 1 under vertical conditions.
Processes 10 00074 g008
Figure 9. The average fitness curves.
Processes 10 00074 g009
Figure 10. Stress distribution curve before and after optimization.
Processes 10 00074 g010
Table 1. Factors and levels of orthogonal experiment.
Level t u   ( mm ) t w   ( mm ) d (mm)
144340
267320
3810300
Table 2. Orthogonal experiment data of L9(34).
Test Number t u   ( mm ) t w   ( mm ) d (mm) σ (Mpa)
144340122
247320113
341030098
464320121
56730096
661034081
784300107
88734081
981032079
Table 3. Comparative table before and after optimization.
Level t u   ( mm ) t w   ( mm ) d (mm) σ (Mpa)
Original67320100
GA-BP8731278
Verified by simulation8731074
Publisher’s Note: MDPI stays neutral with regard to jurisdictional claims in published maps and institutional affiliations.

