Review

Mathematical Models for Cholesterol Metabolism and Transport

Department of Chemical and Biological Engineering, Villanova University, Villanova, PA 19085, USA
*
Author to whom correspondence should be addressed.
Processes 2022, 10(1), 155; https://doi.org/10.3390/pr10010155
Submission received: 24 November 2021 / Revised: 23 December 2021 / Accepted: 5 January 2022 / Published: 13 January 2022
(This article belongs to the Special Issue Feature Review Papers in Advanced Process Systems Engineering)

Abstract

:
Cholesterol is an essential component of eukaryotic cellular membranes. It is also an important precursor for making other molecules needed by the body. Cholesterol homeostasis plays an essential role in human health. Having high cholesterol can increase the chances of getting heart disease. As a result of the risks associated with high cholesterol, it is imperative that studies are conducted to determine the best course of action to reduce whole body cholesterol levels. Mathematical models can provide direction on this. By examining existing models, the suitable reactions or processes for drug targeting to lower whole-body cholesterol can be determined. This paper examines existing models in the literature that, in total, cover most of the processes involving cholesterol metabolism and transport, including: the absorption of cholesterol in the intestine; the cholesterol biosynthesis in the liver; the storage and transport of cholesterol between the intestine, the liver, blood vessels, and peripheral cells. The findings presented in these models will be discussed for potential combination to form a comprehensive model of cholesterol within the entire body, which is then taken as an in-silico patient for identifying drug targets, screening drugs, and designing intervention strategies to regulate cholesterol levels in the human body.

1. Introduction

Cholesterol is an important precursor for the production of some molecules needed by the body, such as hormones, and vitamin D [1]. Besides, cholesterol is one of the main components in eukaryotic cellular membranes, which can maintain the fluidity of the membrane [2,3]. An approximate amount of 900 mg of cholesterol must be attained daily for those functions. However, a large accumulation of cholesterol may cause health problems [4]. The chances of having a heart attack can double for someone who has high cholesterol [5]. Cholesterol can either be produced by the body’s cells or can be absorbed through food [1,6]. If there is too much cholesterol accumulated in a cell, it will be excreted and enter the bloodstream [7]. The cholesterol in the bloodstream begins to accumulate and form arterial plaque on blood vessel walls. This increases the incidence rate of heart attacks and strokes [8]. This may result in hypercholesterolemia which accounted for the deaths of 4.3 million in 2017 worldwide [9]. According to the data posted by the CDC, there are 93 million US adults age 20 or more who have high cholesterol levels [10]. Additionally, cholesterol regulates the secretion and clearance of β-amyloid protein in the brain. Thus, the cholesterol homeostasis is very important to keep people from developing Alzheimer’s disease [11]. Cholesterol also plays an important role in the cancer metabolism, which makes cholesterol homeostasis a potential therapeutic target [12].
Mathematical models are of value on quantifying how cholesterol is metabolized and transferred throughout the body [13,14]. In particular, models that have been validated by experimental data are helpful in designing therapeutic approaches for regulating the cholesterol levels and compositions in human body. Mathematical models have the following essential elements: inputs, outputs, parameters, and equations (typically ordinary differential equations-ODE) that describe the biochemical processes for cholesterol metabolism and transport. The accuracy and value of models generally depend on the assumptions that are made and quantitative equations used to describe both specific and general processes [15]. Good mathematical models typically can be altered or updated if new information on a process is discovered [16,17,18,19]. In addition, reliable models are essential for discovering important drugs that target cholesterol-related diseases. The following two drugs have been found to regulate cholesterol biosynthesis: statins (also known as HMG-CoA reductase inhibitor) and squalene synthase inhibitors [20]. Statins can drastically reduce the rate of cholesterol production which further upregulates LDL receptors, increasing cellular cholesterol uptake [21]. Squalene synthase inhibitors are far less effective than statins but carry fewer side effects [22]. Therefore, good models for cholesterol metabolism and transport are still in high demand, as it may assist to identify more effective therapeutic approaches which might have fewer side effects. This is implied in several existing review papers published in the past five years, which discussed the cholesterol metabolism, regulation of metabolism, cholesterol transportation, and the effects of cholesterol metabolism in brain disease and cancer [23,24,25,26,27,28]. However, few review of computational models of cholesterol have been published in the past five years, as most of those existing review papers were focused on the effect of cholesterol metabolism on diseases or the relationship with aging [17,27,29,30,31,32,33,34]. This motivates us to conduct a comprehensive review on previous mathematical models of cholesterol metabolism. Suggestions on using the existing cholesterol models to treat cholesterol-related diseases are also discussed in this work.

2. Overview of Cholesterol Metabolism and Transport

Cholesterol transport can be seen in detail in the lipoprotein metabolism and transport models shown in Figure 1, in which previous published models are grouped in a diagram of how cholesterol is transported through the different parts of the body [22,35,36,37,38,39]. The names of models indexed in Figure 1, along with inputs, outputs, and known parameters of those models, are briefly summarized in Table 1. Cholesterol is transported through blood vessels and lymphatic vessels using lipoproteins [18,40,41]. There are five main kinds of lipoproteins: very low-density lipoproteins (VLDL), low density lipoprotein (LDL), intermediate density lipoproteins (IDL), high density lipoproteins (HDL), and chylomicrons [42,43]. Chylomicron transport cholesterol from the intestines to the liver [7,44]. The intestine also releases free cholesterol to HDL in the bloodstream. Cholesterol in HDL can be esterified and carried by cholesteryl ester transfer protein (CETP) either back to the liver or to other lipoproteins [45]. Cholesterol in the liver primarily leaves as VLDL. As it travels, the VLDL absorbs cholesteryl ester from CETP and becomes IDL [46]. As IDL continues to travel, lipoprotein lipases remove more triglycerides so that IDL is converted to LDL. LDL can then bind to LDL receptors and then enter the cells (e.g., liver cells). Since LDL is small, it can enter and supply tissues with cholesterol without the use of receptors [47]. Only nine models are shown in Figure 1. The 10th model is still listed in Table 1, but since it is drug delivery, it is not shown in the figure. The details of these models are given in the Section 3 (cholesterol synthesis and metabolisms in liver) and Section 4 (cholesterol transport and metabolisms between compartments in human body). Potential combinations of these models will be discussed in Section 5.

3. Mathematical Models of Cholesterol Synthesis and Metabolisms in Liver

The main location for cholesterol production and storage is the liver [50]. The liver has a regulatory process for cholesterol biosynthesis, and it also manages many of the lipoproteins in which cholesterol is transferred [51]. Liver cells produce HMG-CoA reductase which is an enzyme used in the first step of cholesterol biosynthesis [52]. Once cholesterol is made inside the liver cells, the regulation of cholesterol level begins [53]. If there is a high concentration of cholesterol in the cell, the cholesterol biosynthesis slows, while a low concentration of cholesterol increases the rate of cholesterol biosynthesis [6]. This process will be shown in greater detail in the Sterol Regulatory Element Binding Protein (SREBP) regulation model (Model 1 in Table 1). Besides producing cholesterol, the liver can receive cholesterol [53]. Surface liver cells have low density lipoprotein (LDL) and LDL-like receptors that are used to take in lipoproteins containing cholesterol [34,54]. The LDL receptor can take in LDL from the bloodstream, while the LDL-like receptor takes in the chylomicrons that are sent from the intestines. The LDL receptors on the liver are expressed when the concentration of cholesterol inside the liver falls below a certain point. The final way the liver can receive cholesterol is through reverse cholesterol transport [55]. This involves the cholesteryl ester transfer protein (CETP) taking cholesteryl ester from HDL and bringing it back to the liver [45]. The liver then takes all the cholesterol it has absorbed or produced and uses it to form bile salts or releases it into the bloodstream in lipoproteins. The bile salts produced by the liver make their way to the intestines where the cholesterol in them can either be reabsorbed or be excreted by the body [56]. Free cholesterol can also leave the liver and combine with HDL as it does in the intestines [57]. If the free cholesterol that leaves the liver does not combine with HDL, it will undergo catabolism. The final way cholesterol leaves the liver is by complexing with triglycerides and apolipoprotein B100 to form very low-density lipoproteins (VLDL) [58].

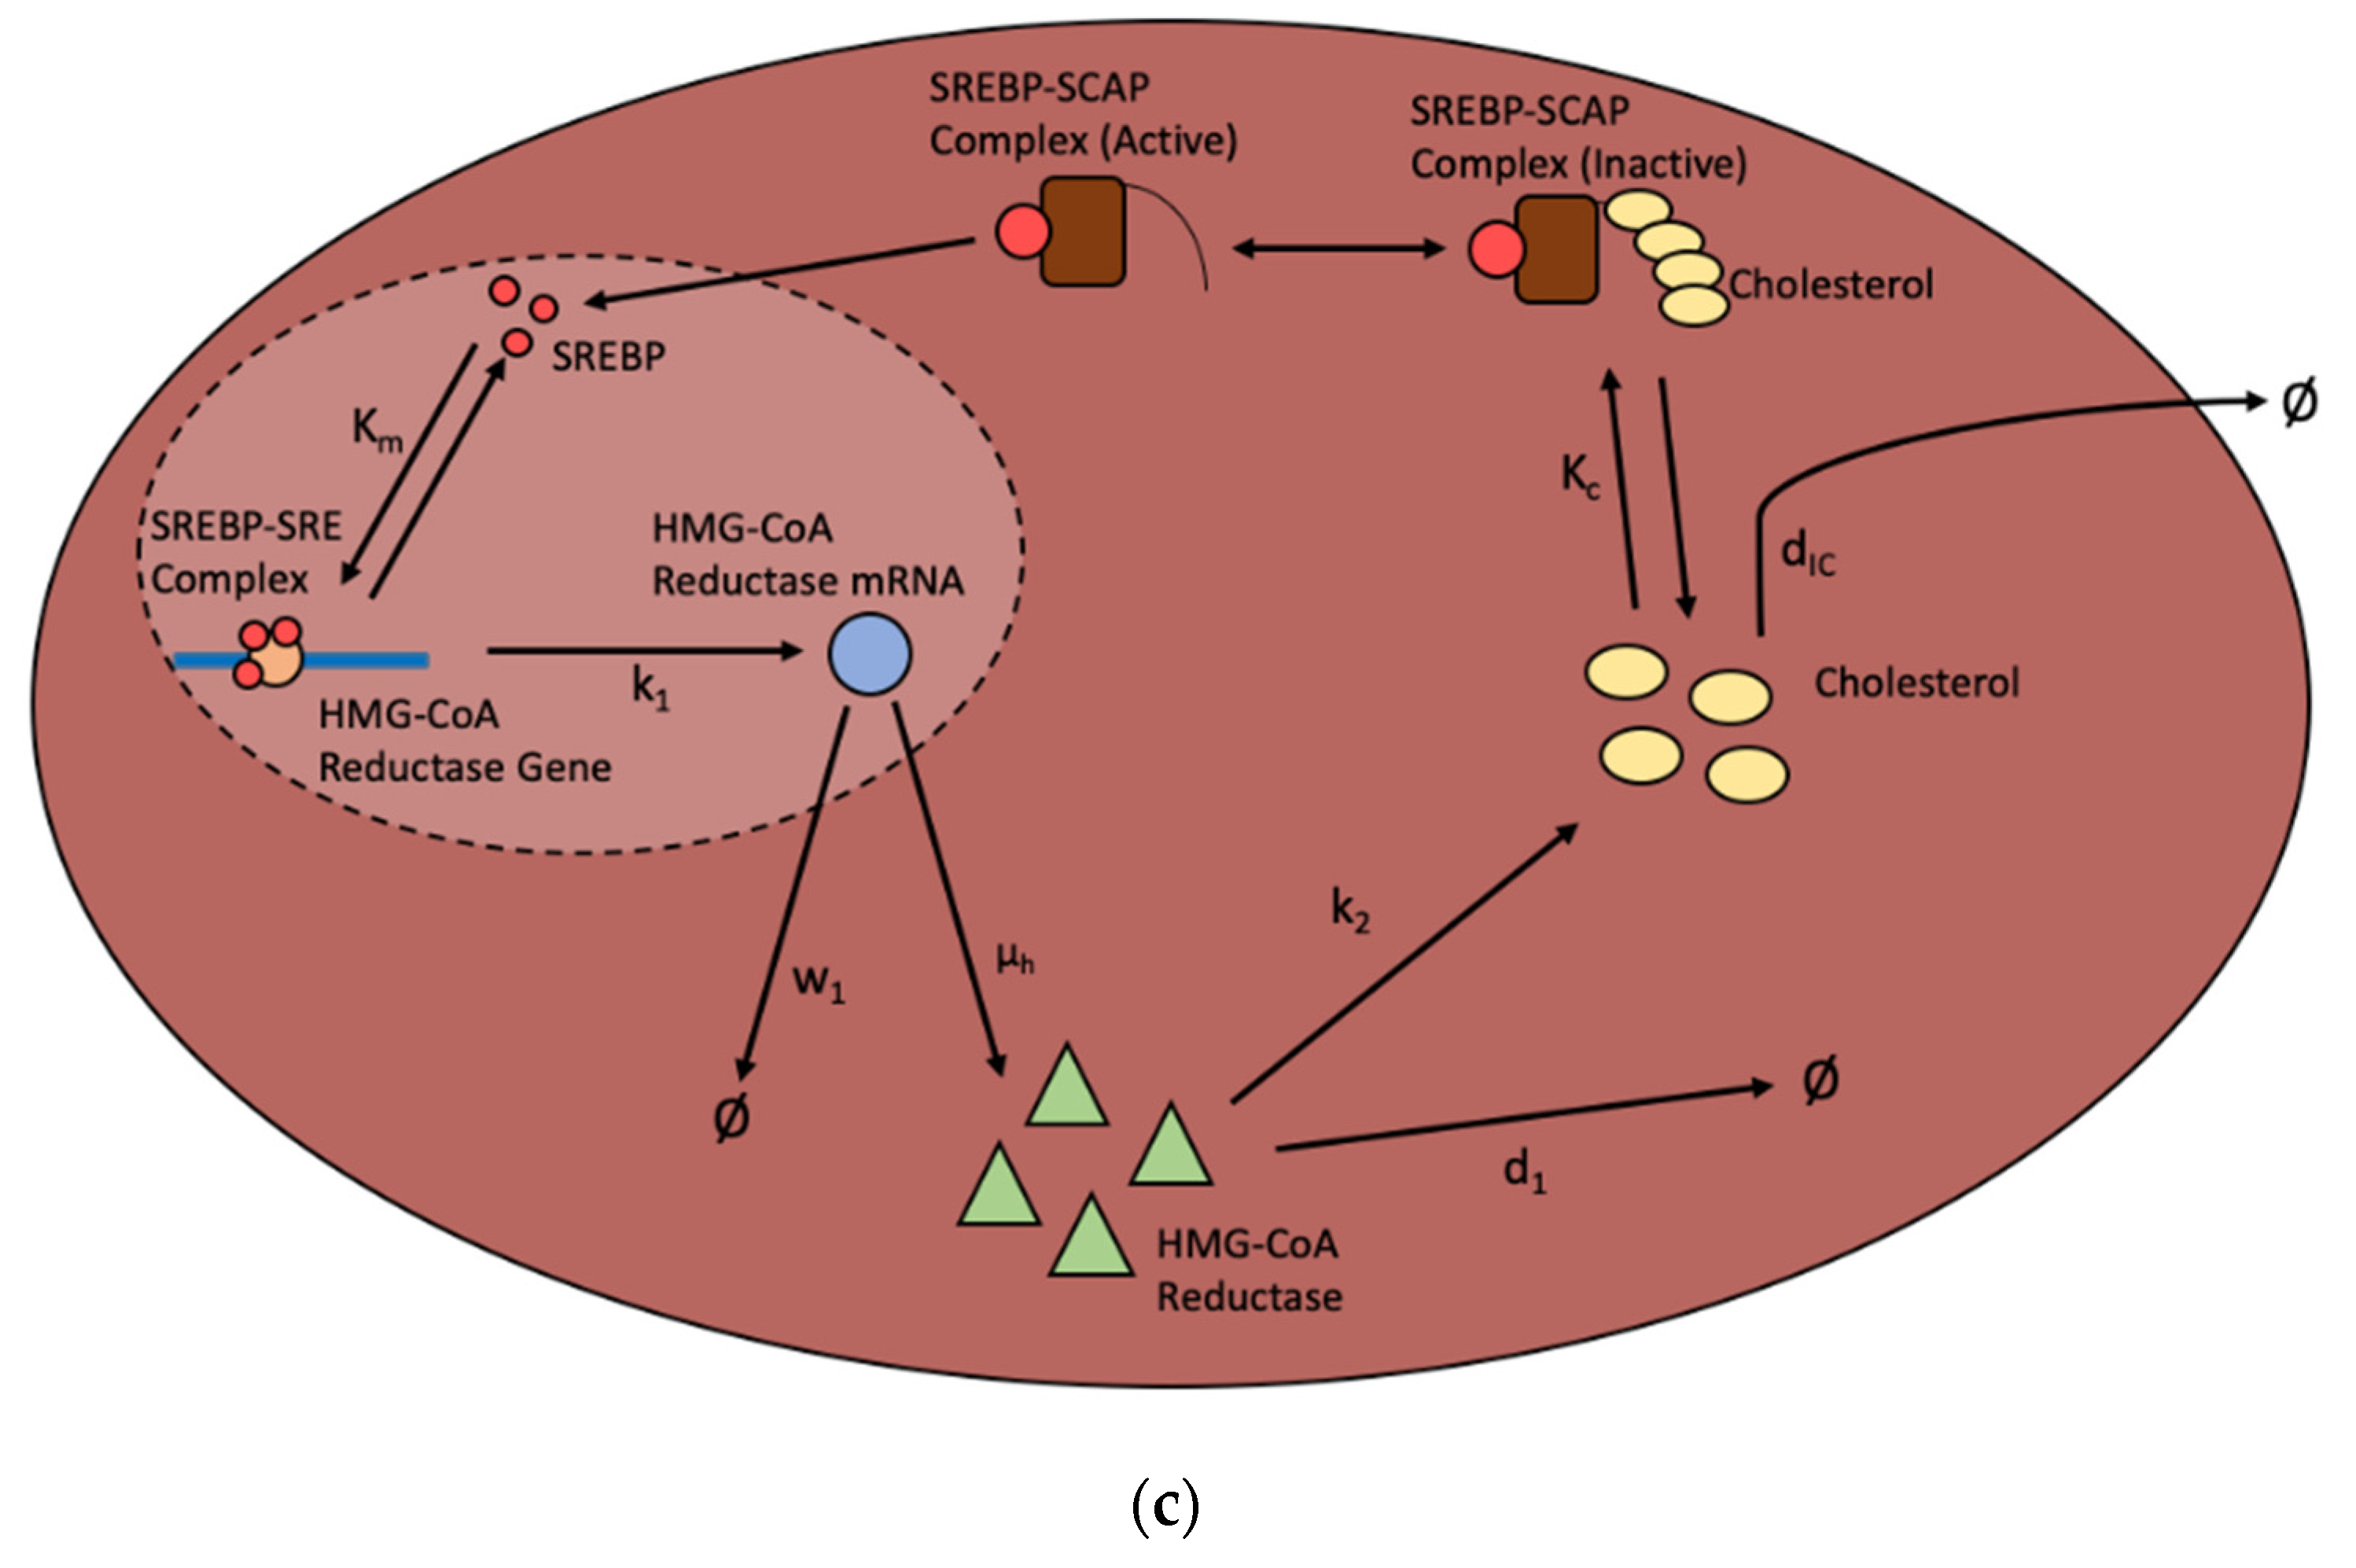
3.1. Cholesterol Metabolism with SREBP Negative Feedback

SREBP provides a negative feedback loop for cholesterol biosynthesis. Cholesterol remains in the endoplasmic reticulum until the level of cholesterol in the cell drops [59]. Then, it is brought to the Golgi apparatus by the SREBP cleavage activating protein (SCAP) and is cleaved by proteases [60]. This allows the SREBP to enter the nucleus, bind to the sterol regulatory element (SRE) gene, and induce transcription. When there is a high amount of cholesterol present in the cell, SCAP will lock SREBP into the endoplasmic reticulum, thereby preventing the transcription of the HMG-CoA reductase gene [35]. SREBP regulation model (Model 1 in Table 1) has been illustrated in Figure 2. When three SREBP molecules bind to the sterol regulatory element on the HMG-CoA reductase, gene transcription is induced. The mRNA then leaves the nuclear region, either degraded or translated by ribosomes. HMG-CoA reductase is then either used for cholesterol biosynthesis or degraded as well. Once cholesterol is formed, it can be degraded, moved outside the cell, or engage in SREBP-SCAP binding [35].
The SREBP regulation model demonstrates how the rate of cholesterol production can be affected by the overall cholesterol concentration in a cell. This is important because it shows a method of slowing down cholesterol production by rendering SREBP inactive by locking it in the endoplasmic reticulum. However, only the production of cholesterol has been included in the SREBP regulation model, it does not explain how the cholesterol in the cell is used or where it is transported to once it leaves the cell. Additionally, this model does not account for the possibility of cholesterol reentering the cell through reverse cholesterol transport. Lastly, this model only applies to liver cells. Considering the significantly slower rate of cholesterol production in other cells, the parameters in this model may not be used to model the cholesterol production in other cells [35].

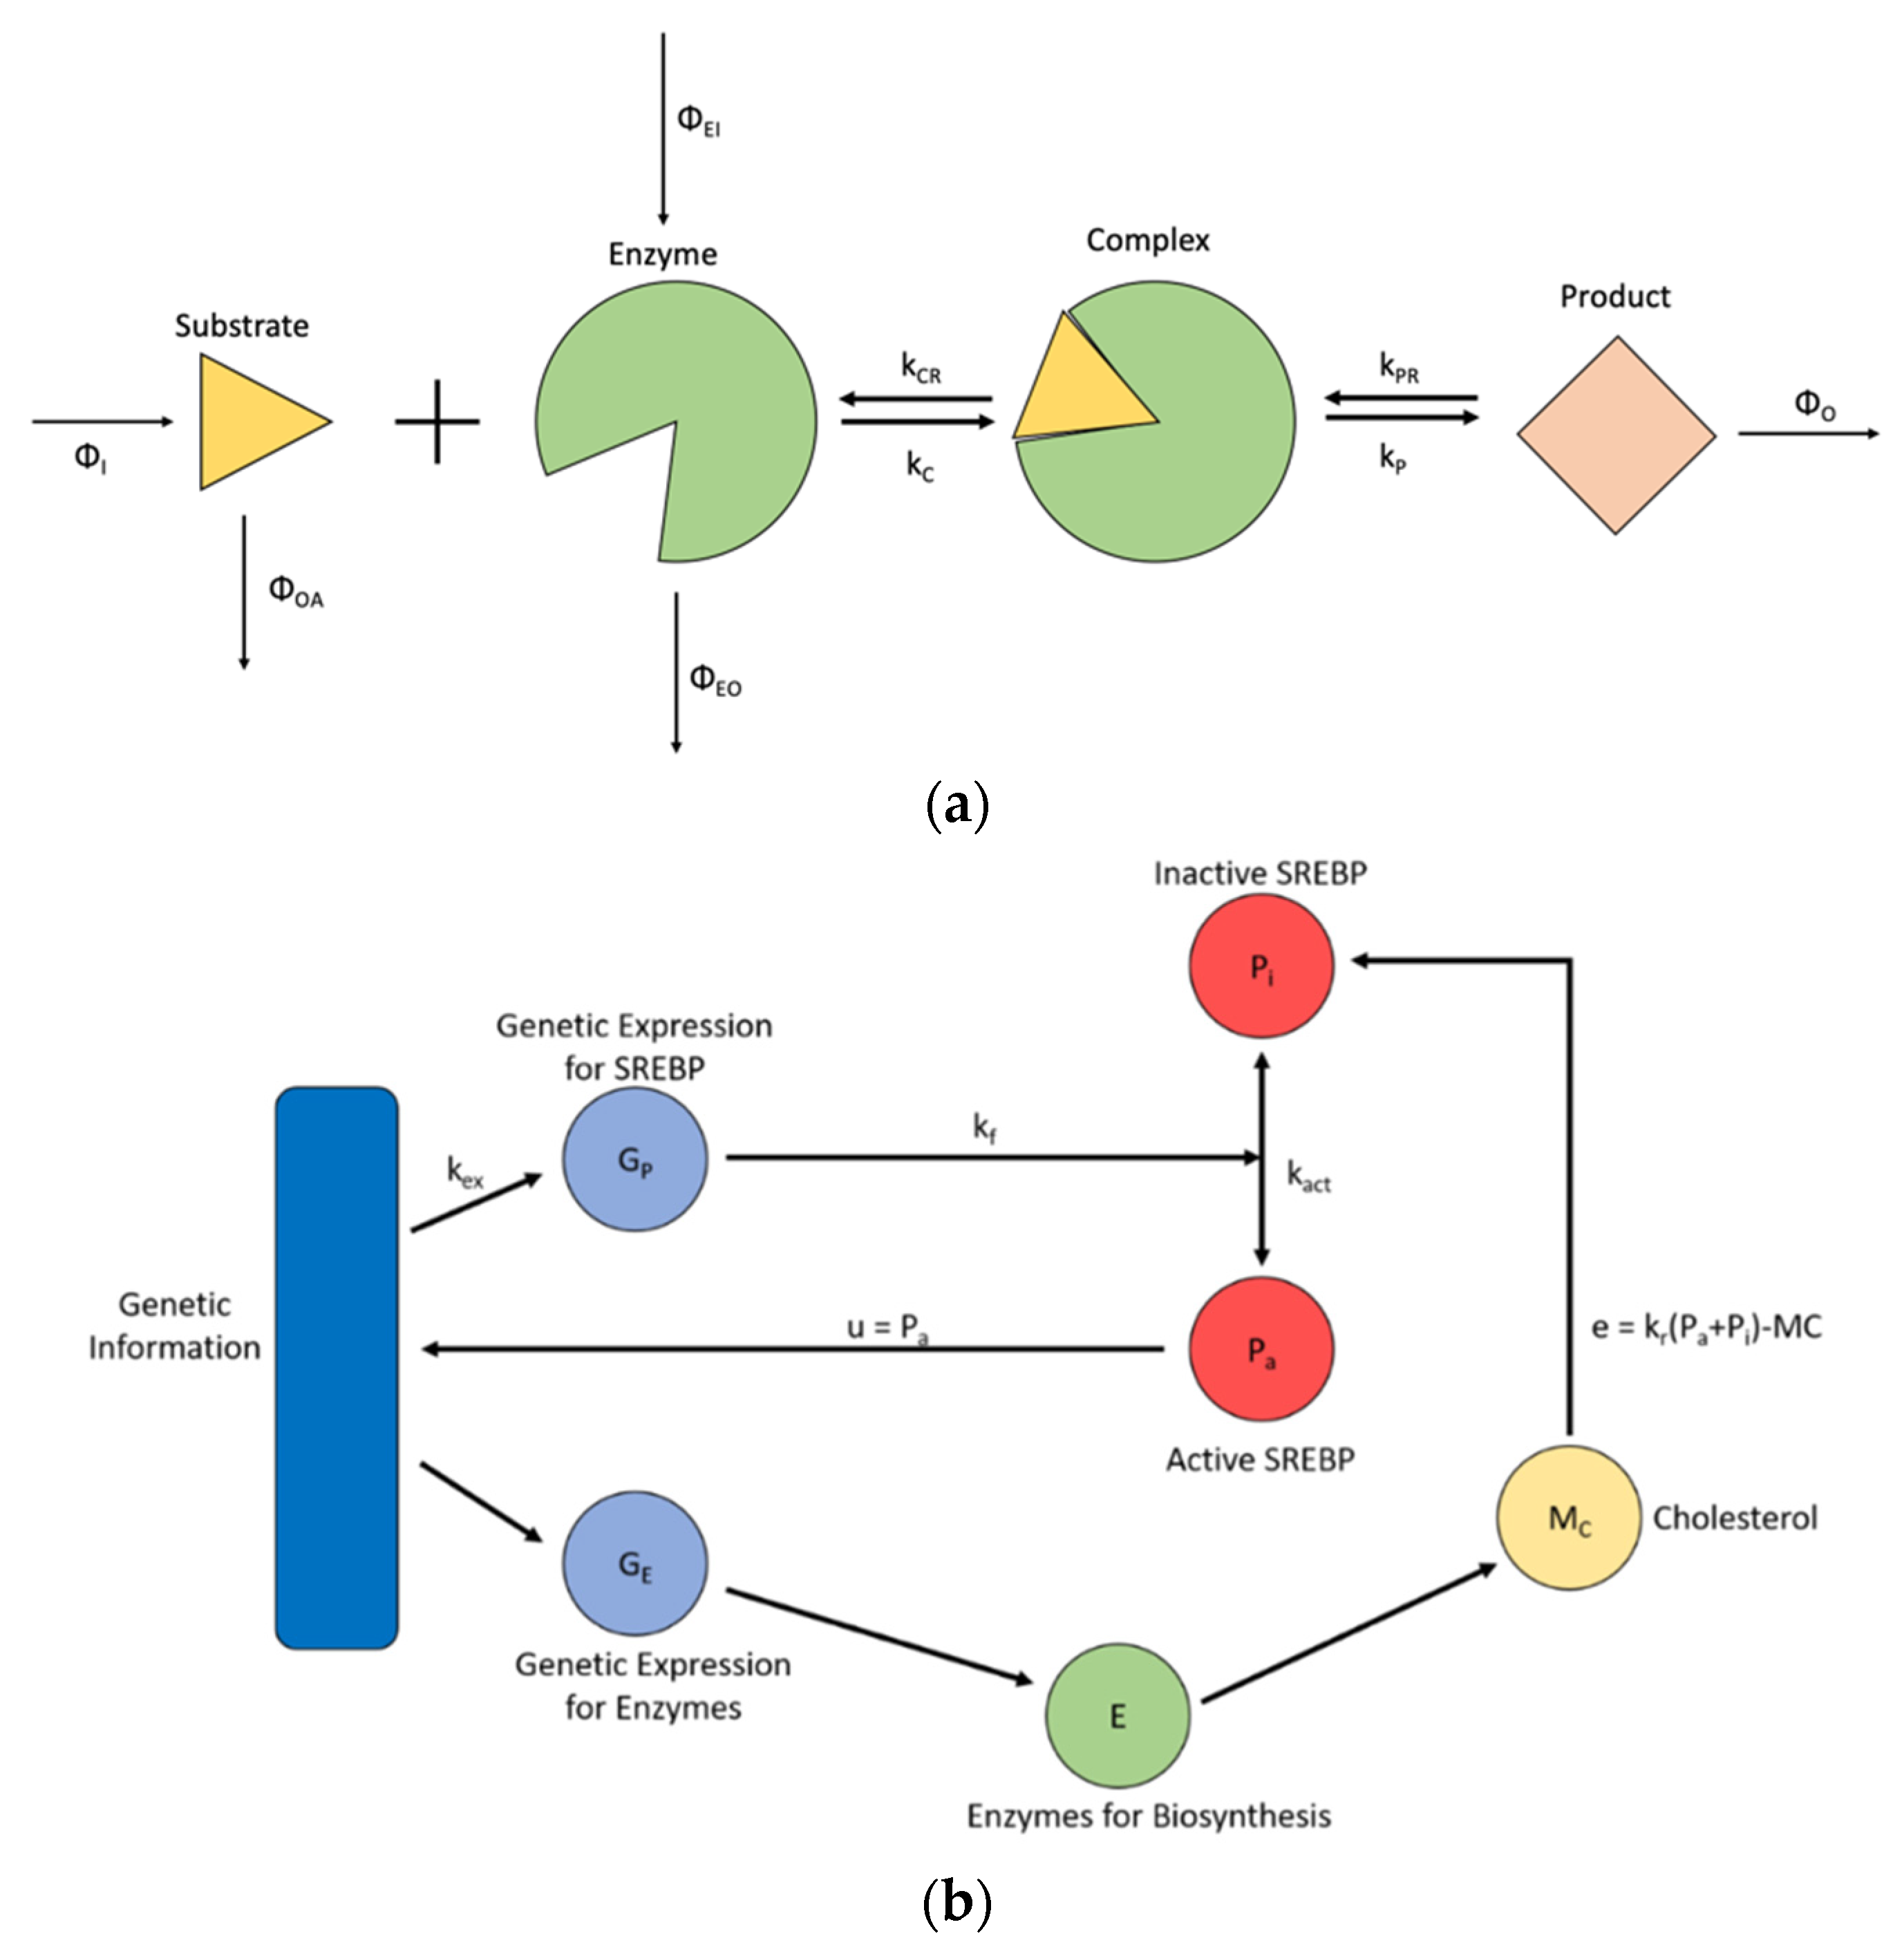
3.2. Steady State Cholesterol Biosynthesis

The steady state cholesterol biosynthesis model (Model 2 in Table 1) describes the cholesterol biosynthesis process. As shown in Figure 3, the steady state cholesterol biosynthesis model investigates how steady state cholesterol production can be altered by changing parameters (Figure 3a) as well as the SREBP regulation mechanism (Figure 3b) [38]. Since cholesterol metabolism occurs in an open system where things are exchanged with surrounding systems, simple Michaelis–Menten kinetics do not always apply. An open system is subject to different disturbances. It was determined that the ratios of the reaction rates remain relatively constant and do not have a large impact on the final concentrations [38]. Additionally, as shown in Figure 3b, Model 2 is used to show the relationship between the control signal of SREBP, u, and the error of the control signal, e. The control signal is the amount of active SREBP, while the error of the control signal is the difference between the total amount of cholesterol in the cell and the amount of cholesterol predicted by the product of the total amount of SREBP (i.e., Pa + Pi) and the ratio cholesterol/SREBP at equilibrium times (i.e., kr). Knowledge of the control signal gives us more information on the control mechanism of cholesterol biosynthesis. A zero error indicates an effective control strategy [38]. This model is valid for steady-state condition, and it depends on the parameter kr, which may change for different persons.
Model 2 shows how to obtain normalized concentrations at steady state for enzyme and substrate at each step of the cholesterol biosynthesis process. This model differs from other biosynthesis models because it analyzes the process as an open system. Additionally, this model can be used to show how the control signal can be changed based on the concentrations, reaction rates, and error of the control signal. However, the model does not come with values for the reaction rates and fluxes for the different steps of the biosynthesis. Those values must be experimentally determined before using this model. Since this model only covers a single step of enzyme activity, it can be applied to each enzymatic step if the values of the rates and fluxes are known. This model can also be used to analyze different types of cells if the values of reaction rates and fluxes for each step are known for that specific cell type. This model does not show any of the individual reactions involving the enzymes of the process either. Lastly, this model can only be used to describe liver cells since other cells do not engage in SREBP regulation. Model 2 only addresses the biosynthesis portion of cholesterol metabolism and does not touch upon cholesterol transport or usage [38].

3.3. De Novo Cholesterol Biosynthesis

De Novo Cholesterol Biosynthesis model (Model 3) seeks to describe cholesterol biosynthesis in cells. The process of this model is identical to the SREBP regulation model (as shown in Figure 2). Cholesterol is produced with HMG-CoA reductase as the rate limiting step. Since the HMG-CoA reductase step is relatively slow when compared with all other biosynthesis steps, this model is focused on this step. Model 3 assumes that change in intracellular cholesterol only applies to cholesterol made from biosynthesis, without incorporating cholesterol internalized from lipoproteins. Additionally, it is assumed that the concentration of HMG-CoA is high enough as the limiting component of the cholesterol biosynthesis [22]. The equations of Model 3 are shown in (A16) through (A20) in Appendix A. Model 3 explains well how the concentration of intracellular cholesterol changes due to cholesterol synthesis. It properly addresses the regulation due to SREBP while making basic assumptions on rate limiting steps and equilibriums. This model does not include changes in intracellular cholesterol due to lipoprotein internalization. While other changes to intracellular cholesterol are not included in this model, the equation can easily be adapted to add the change in intracellular cholesterol from existing models on lipoprotein metabolism [48]. This model also tends to focus more on the intracellular cholesterol output, similar to Model 1 [22].

3.4. Hepatocyte Cellular Cholesterol Biosynthesis and Lipoprotein Metabolism

The cholesterol biosynthesis cascade within the liver cell will be initiated by the reductase, 3-hydroxy-3-methyl-glutaryl-coenzyme A reductase (HMGCR) [61,62,63]. The cholesterol biosynthesis is then regulated by SREBP, as discussed in the section of Model 1 [6,48,64]. Besides that, the expression level of proteins involved in the cholesterol metabolism, such as LDLR, SREBP-2 and HMGCR, will also affect the cholesterol level within cells [48,65]. Hepatocyte cellular cholesterol biosynthesis and lipoprotein metabolism model (Model 4 in Table 1) includes the cholesterol biosynthesis under the regulation of HMGCR and LDLR, the VLDL and LDL breakdown, and the biosynthesis of cholesterol receptors in the liver cell [48]. Model 4 shows that compared to the uptake of lipoproteins from intestine, the hepatocyte biosynthesis of cholesterol has higher effect on cellular cholesterol levels, which is consistent with previous study in biology [48,54]. Model 4 includes the lipoprotein endocytosis, biosynthesis, genetic regulation processes. This model could be useful in predicting good therapeutic candidates. For example, the delipidation from VLDL to LDL process could be a therapies target, because the delipidation process had most effects on extracellular LDL. The equations of Model 4 are shown in (A21) through (A32) in Appendix A [48].

3.5. Boolean Modeling of Cholesterol Biosynthesis Regulation

Boolean mathematics is essential binary as variables are generally either active or inactive, with the value of one and zero representing active and inactive, respectively [37]. The equations take the form of logic statements in which binary variables are connected with logic operators AND, OR, or NOT [66]. Boolean modeling of cholesterol biosynthesis regulation (i.e., Model 5) examines the inhibition and activation of cholesterol biosynthesis [37]. Model 5 investigates the regulation of cholesterol biosynthesis by SREBP [67]. High level of cholesterol in the cell causes SREBP to remain trapped to slow cholesterol biosynthesis, while low amounts of cholesterol allow SREBP to cleave and induce the expression of HMG-CoA reductase [68,69]. This is one part of the rate limiting step of cholesterol biosynthesis [69]. The rate limiting step of cholesterol biosynthesis produces mevalonic acid, which then creates desmosterol and 7-dehydrocholesterol, both of which are cholesterol precursors [70].
Model 5 is a synchronous model with a finite space. This means that when the simulation has been run for enough time, it will return to a state it previously starts from. To get a full simulation, the model would need to be observed for each possible state for each substance. Since the amount of all possible combinations of variable values in this model is great, a random number generator is used to decide the state subsets and Markov process is implemented to further model the synthesis. The results indicate that three steady states exist, according to the involvement of Acetyl-CoA in the formation of HMG-CoA. The first occurs when the SREBP-SCAP complex is activated, but there is no Acetyl-CoA leading to a stop in cholesterol synthesis. The second is when there is Acetyl-CoA present, but statins are being used to inhibit HMG-CoA reductase. The final steady state happens when there are statins inhibiting HMG-CoA reductase as well as no Acetyl-CoA present. If any of the steady states are not present, the system adopts the following cycle: low cholesterol concentration causes SREBP to induce transcription, which in turn increases cholesterol synthesis, binding the SREBP-SCAP complex and slowing cholesterol synthesis and starting the cycle over again [37]. The equations of Model 5 are shown (A33) through (A37) in Appendix A. Model 5 describes the synthesis of cholesterol changes depending on manipulations of substances in the pathway. For example, certain intermediates can compensate for a lack of others to keep cholesterol synthesis regulated.

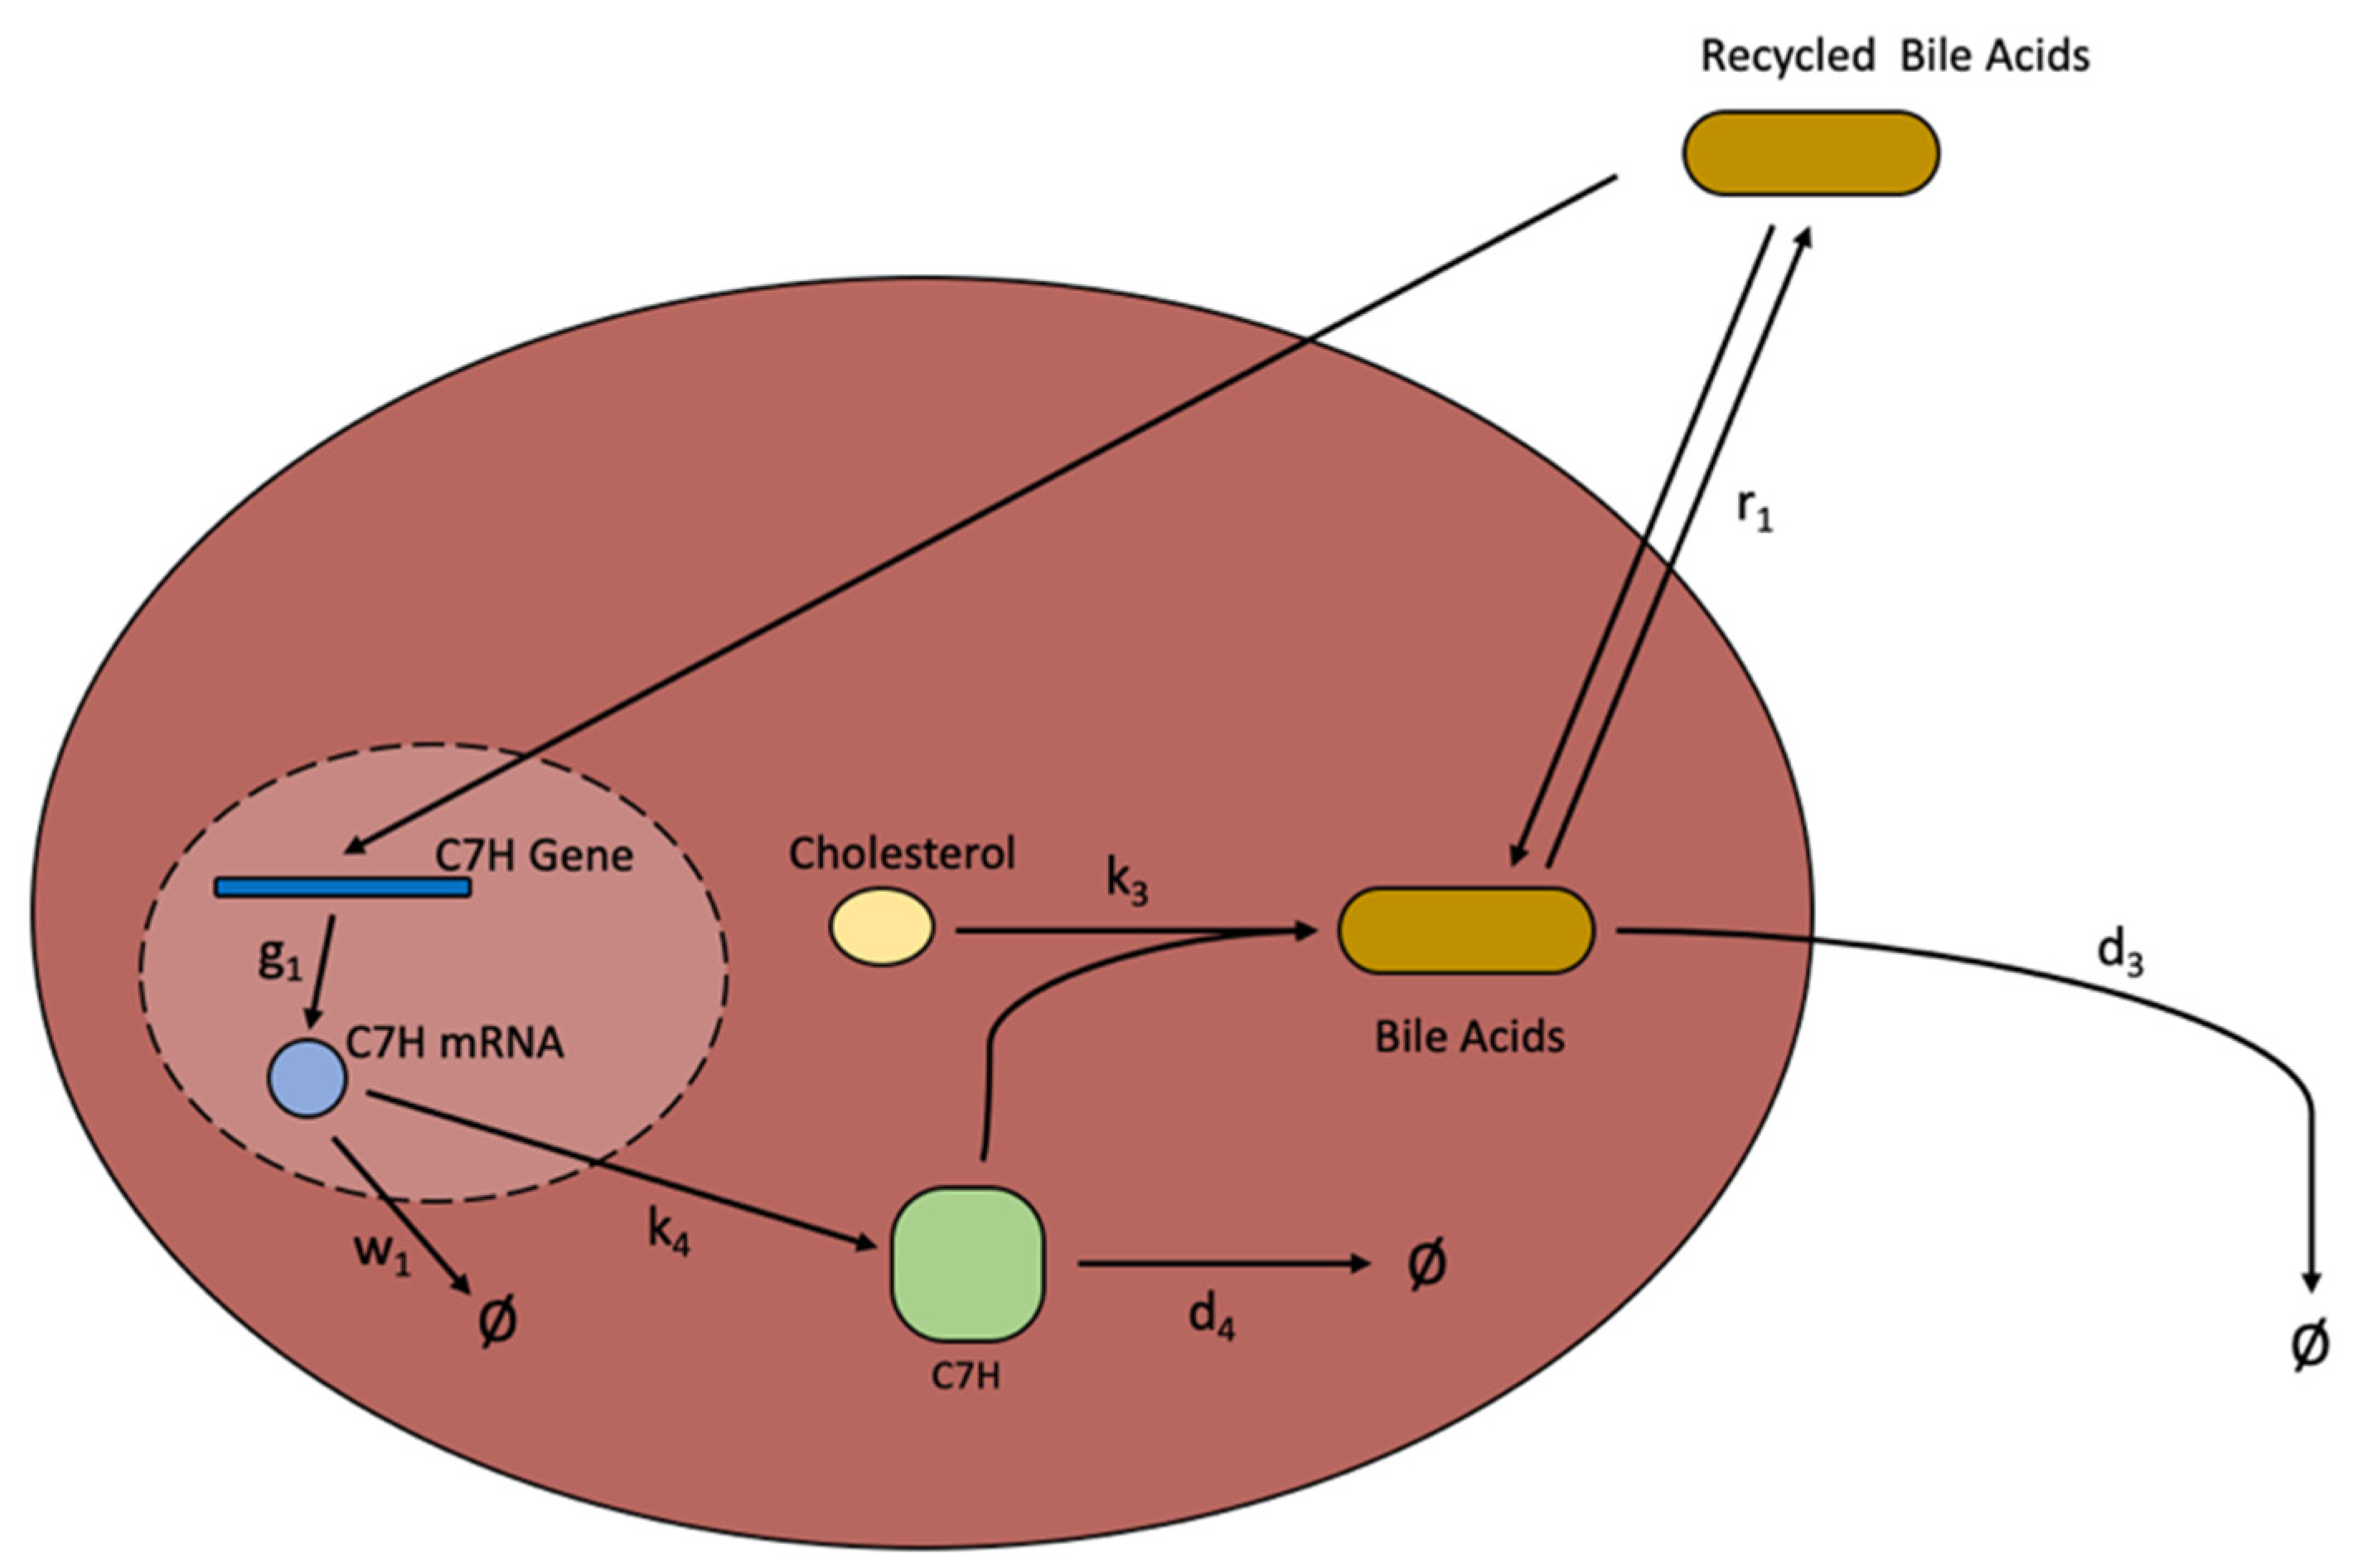
3.6. Bile Acid Biosynthesis

Cholesterol in liver cells can be the substrate of bile acid synthesis, as shown in Figure 4. The enzyme Cholesterol 7α Hydroxylase (C7H) converts cholesterol into the bile acids [71]. Once the bile acids are produced, they leave the liver and proceed to the gut and intestines [72]. Besides absorbing dietary lipids, the intestines can also reabsorb bile acids and allow them to be reused. Bile that is not reabsorbed binds to fecal matter and is excreted [73]. The bile acids that are recycled reenter liver cells and join the rest of the bile acid being produced. Recycled bile acids also regulate the production of further bile acids. The more bile acids that are being recycled, the slower the rate of bile acid biosynthesis [22].
Bile acid biosynthesis model (Model 6 in Table 1) quantifies the change in intracellular cholesterol, bile acids, C7H, recycled bile acids over time. The change in intracellular cholesterol over time follows basic Michaelis–Menten kinetics. The change in bile acids over time must account for both the bile acid synthesized from intracellular cholesterol as well as the bile acids that are recycled by the intestines. The return of bile acids to the liver has been greatly simplified since it is still unknown how bile acids are returned to the liver. Since C7H is involved in the rate limiting step of bile acid synthesis, this model assumes that the C7H step is the only step in bile acid synthesis. It is also assumed that the concentration of C7H reaches equilibrium rapidly. Equations of Model 6 are shown in (A38) through (A44) in Appendix A.
Model 6 demonstrates one of the many uses of cholesterol and shows the pathways that bile acids can take. This is important because it gives insight into another piece that can be added to an intracellular cholesterol model. However, it assumes that cholesterol only degrades into bile acid. On the other hand, the intracellular cholesterol is not only converted into bile acid but also esterified to cholesteryl ester, or excreted to extracellular region [22,74]. The assumption made in Model 6 is a simplification of the system. Although this could compartmentalize the bile acid synthesis from the whole metabolism system, the bile acid synthesis predicted by the model might be higher than the real condition, since the esterification of cholesterol has been taken into consideration for it.

4. Mathematical Models of Cholesterol Transport and Metabolisms between Compartments in Human Body

While Section 3 deals with the cholesterol synthesis processes in individual cells, this section focuses on compartment-level of the transport and metabolism of cholesterol, especially between intestine, liver, blood stream, and other compartments. The dietary cholesterol enters gastrointestinal tract after consumption [75]. Cholesterol from food is taken along with other steroid alcohols into the intestines. Un-esterified cholesterol as well as plant sterols and stanols can be expelled from the intestines back into the lumen of the gut [76,77]. Free cholesterol can leave the intestines through an ATP binding cassette and combine with free high density lipoproteins (HDL) for transport [78,79]. Besides food, the intestines can also absorb cholesterol from bile [80]. The cholesterol that the intestine fails to absorb from bile gets excreted along with fecal matter (as described in the bile acid model above) [56]. The free cholesterol is distributed in intestine, liver, and the blood stream.

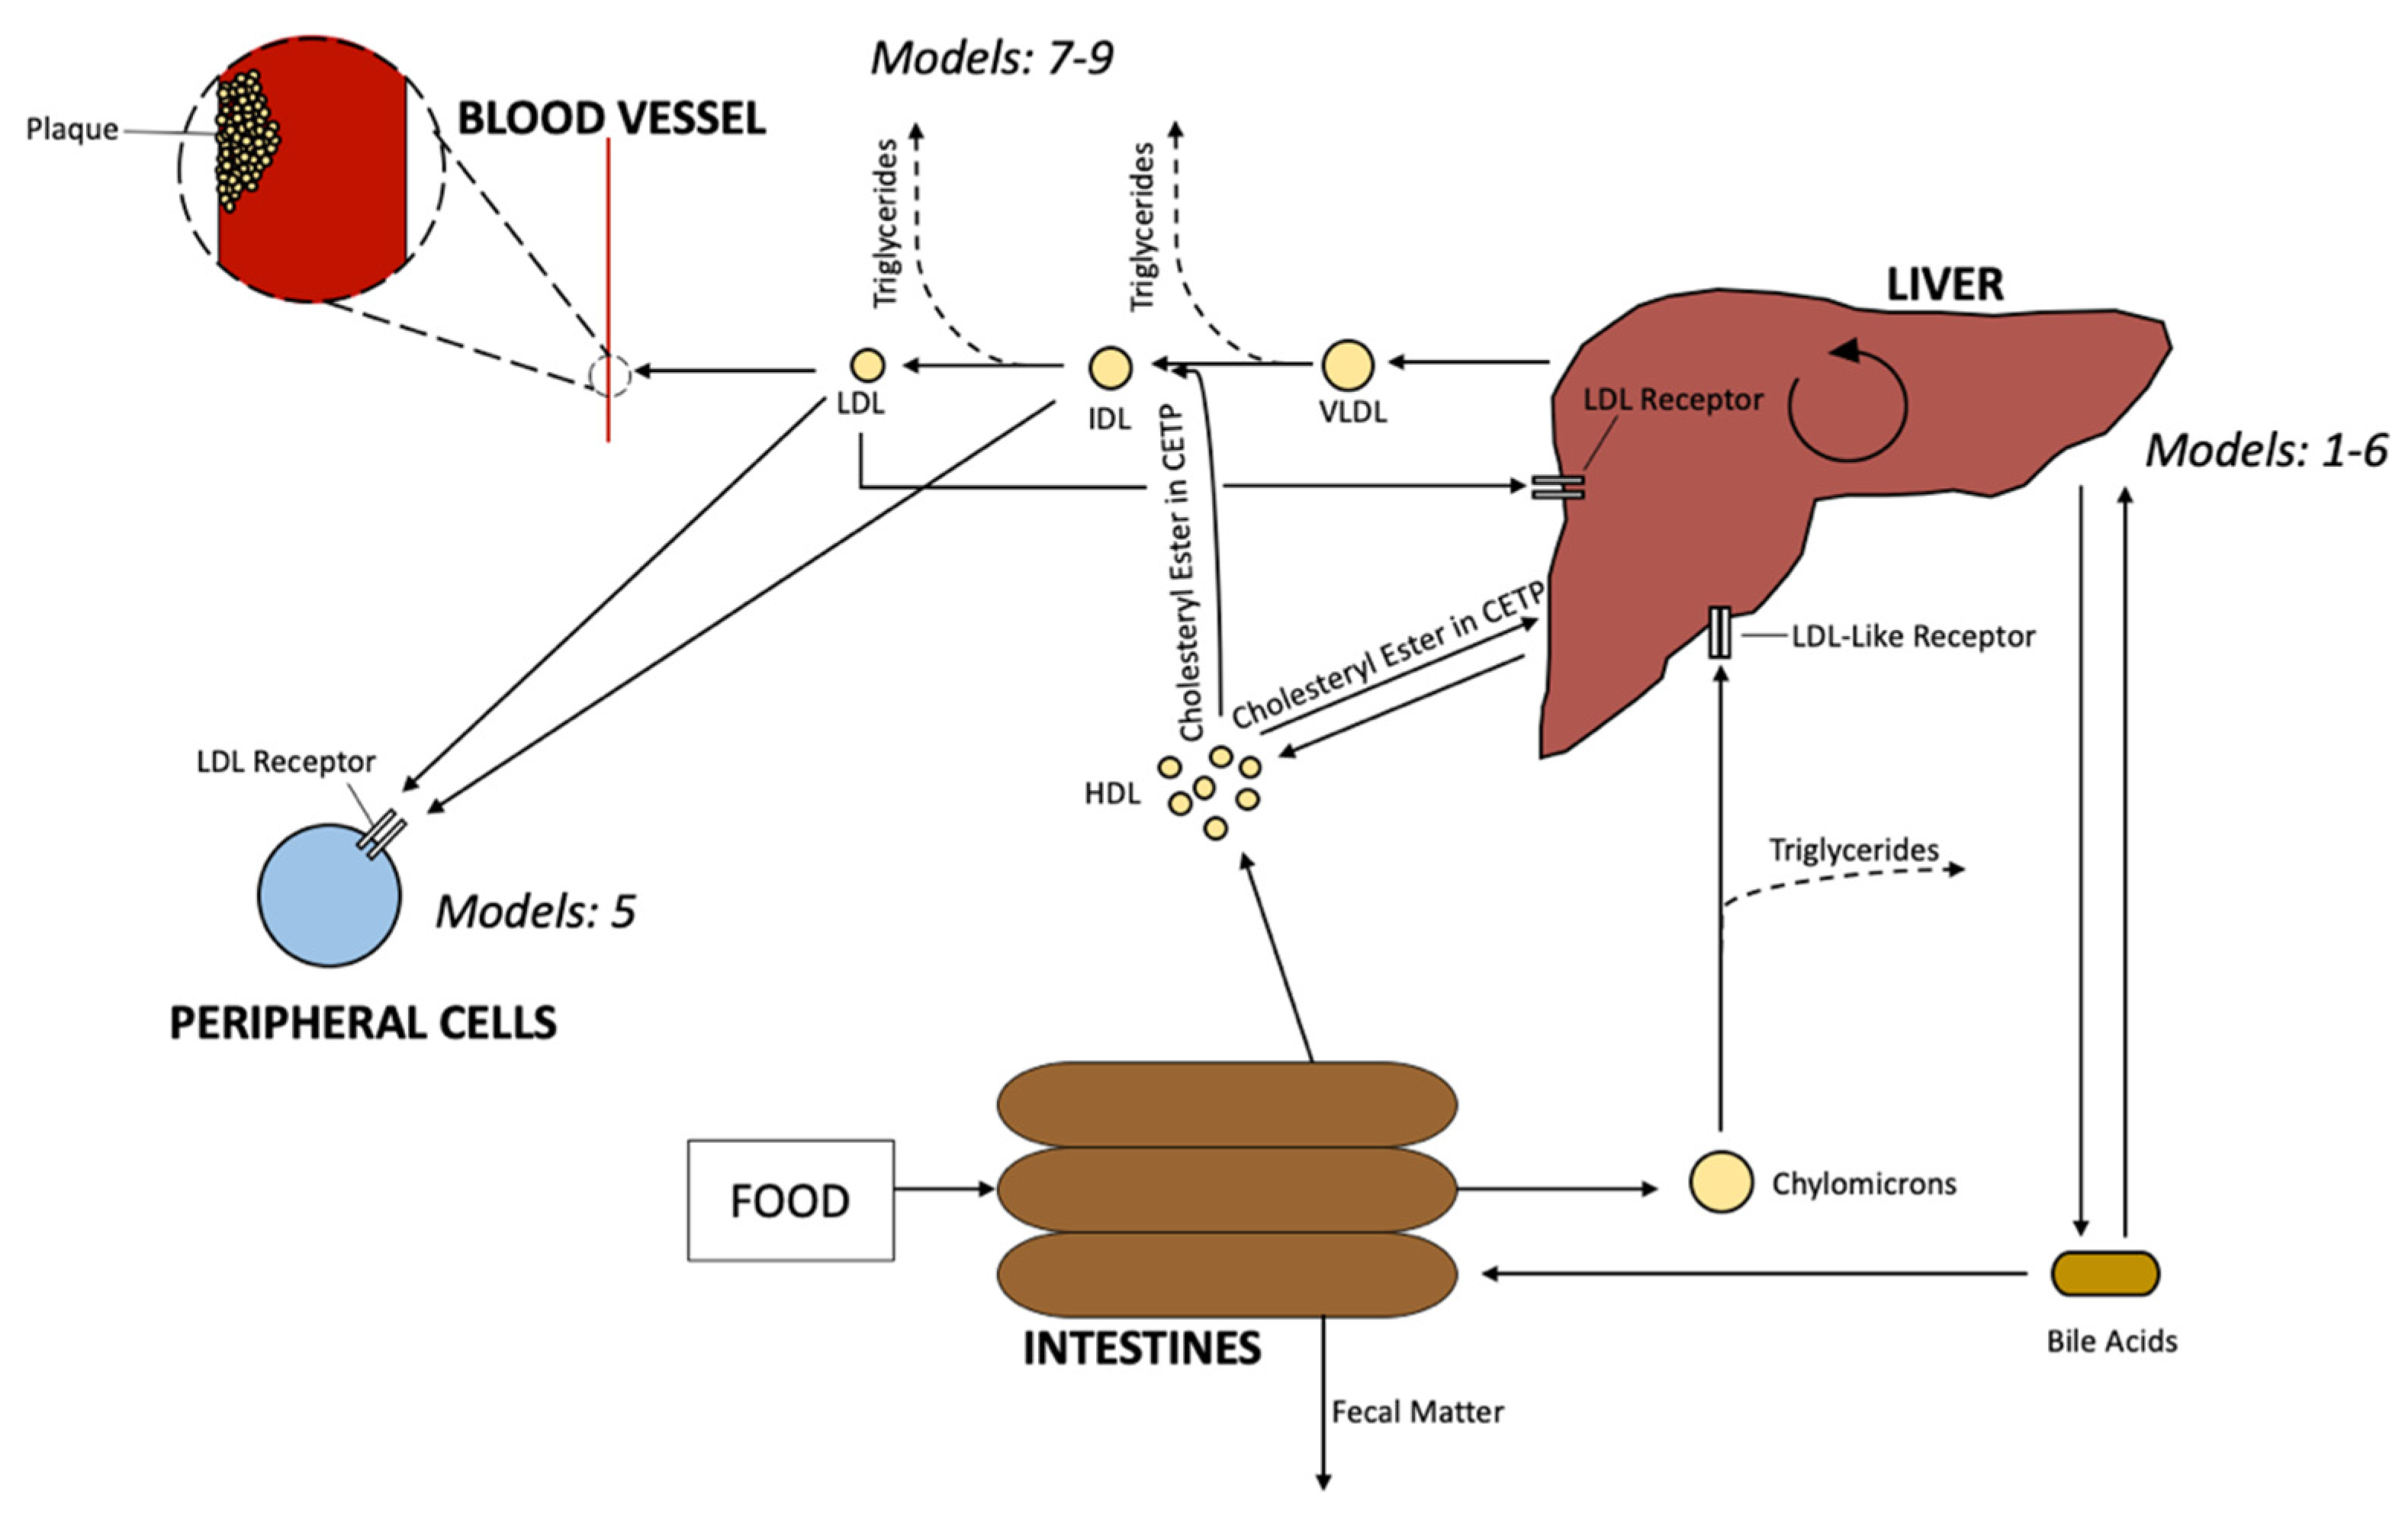
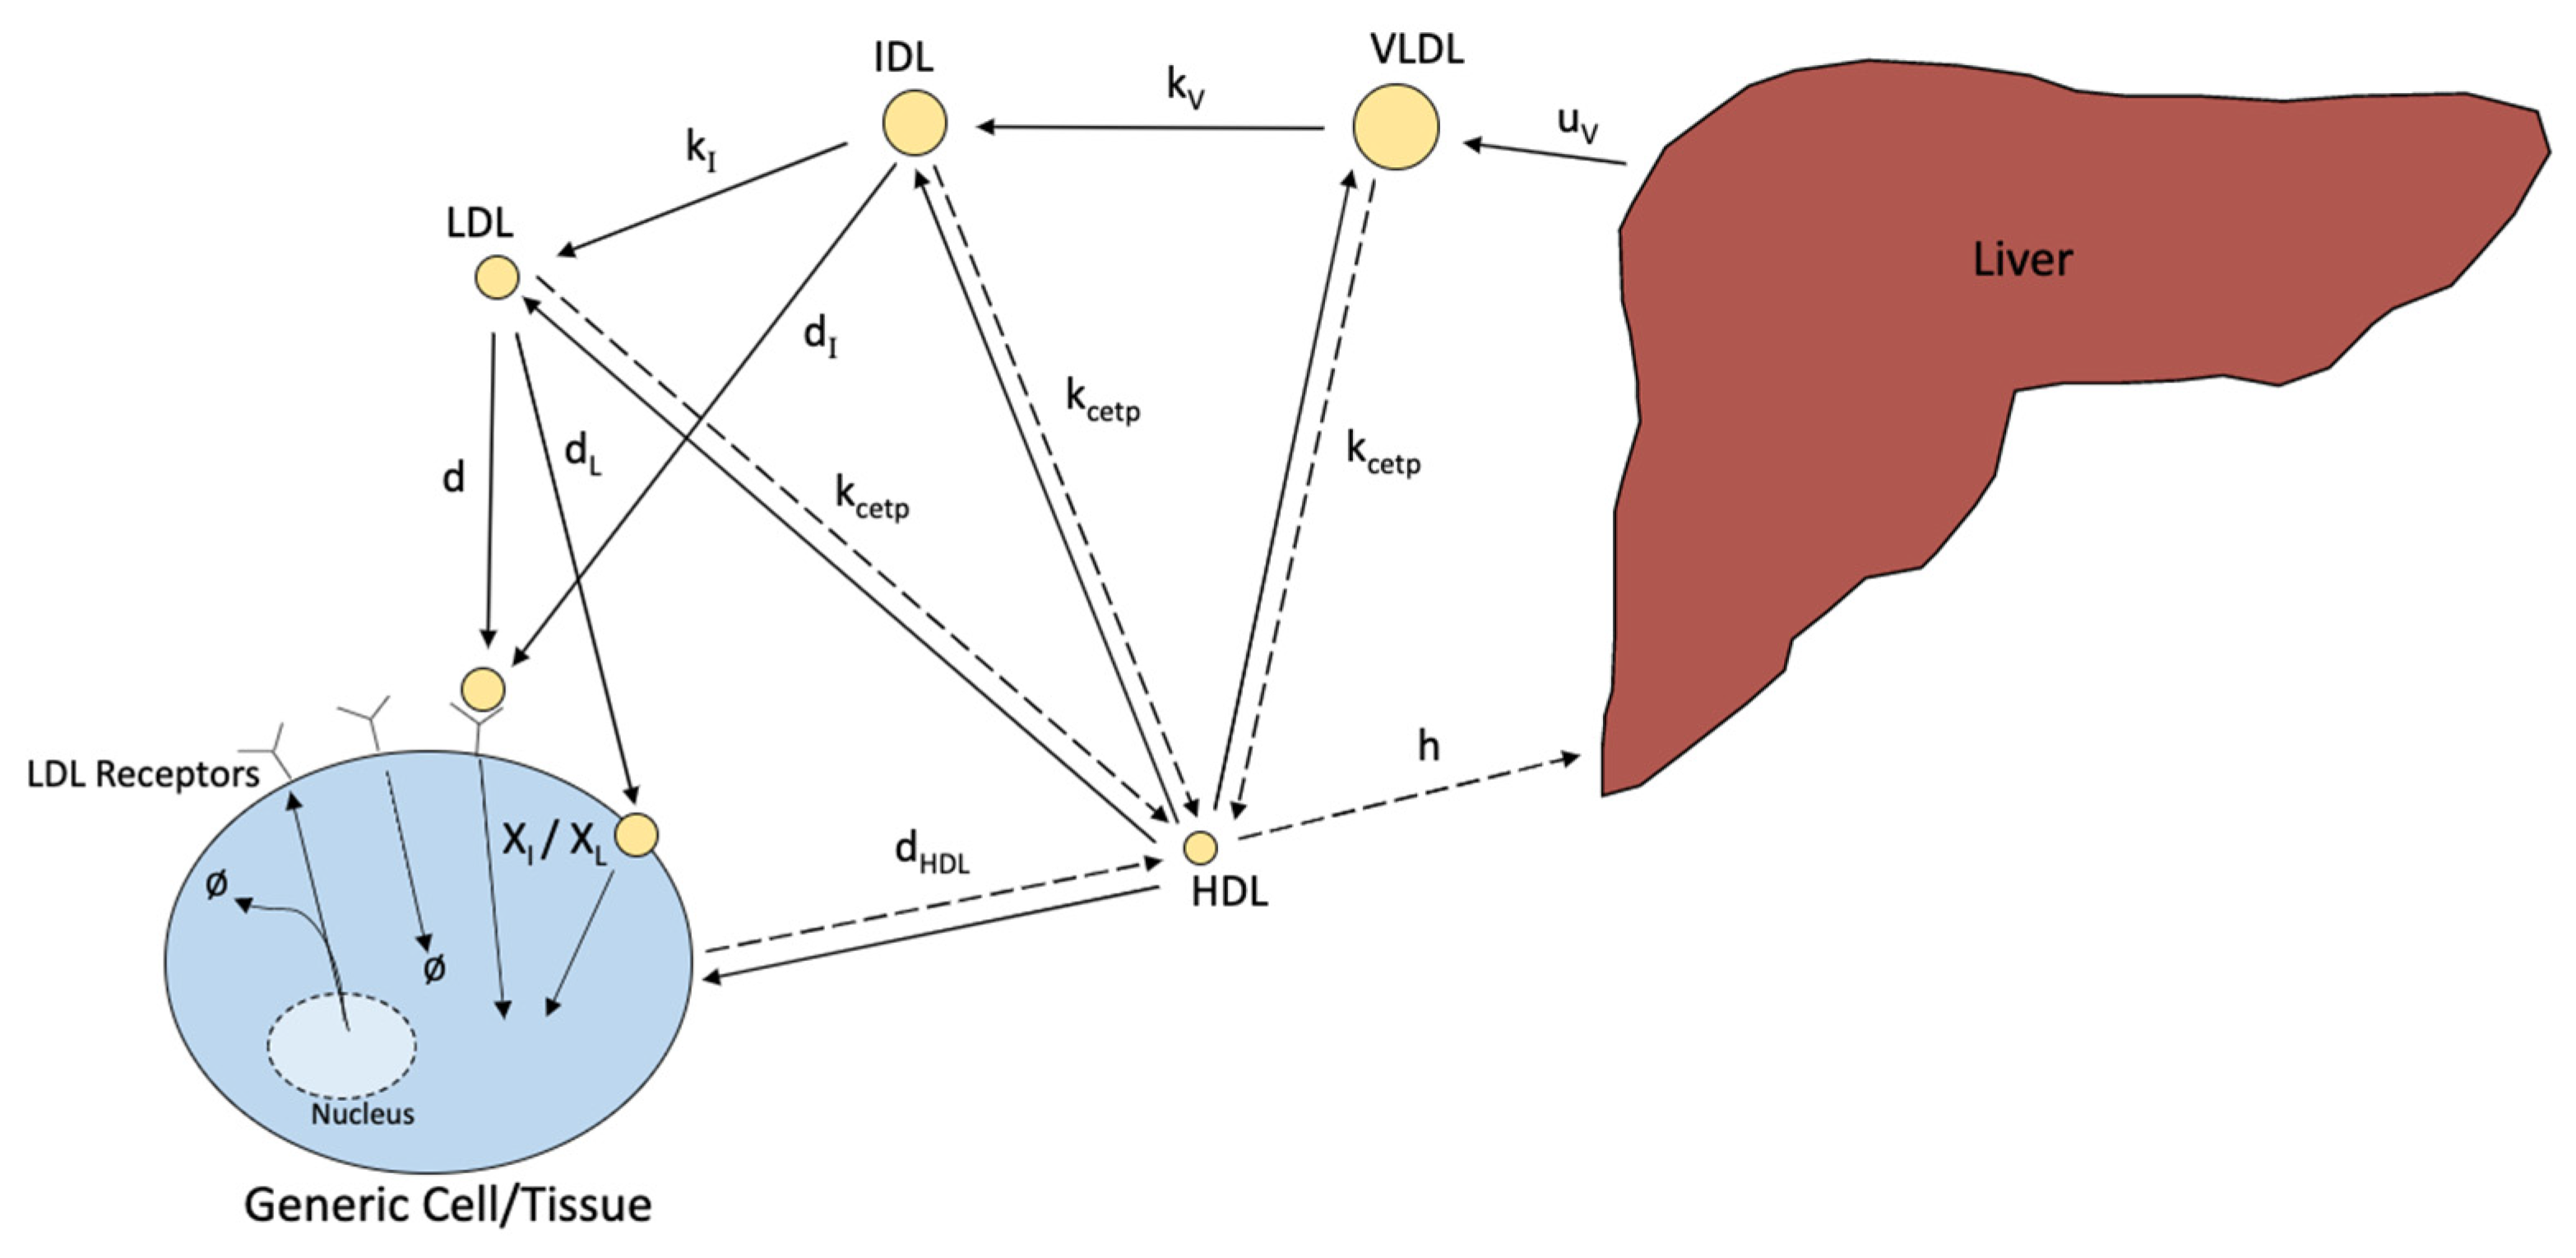
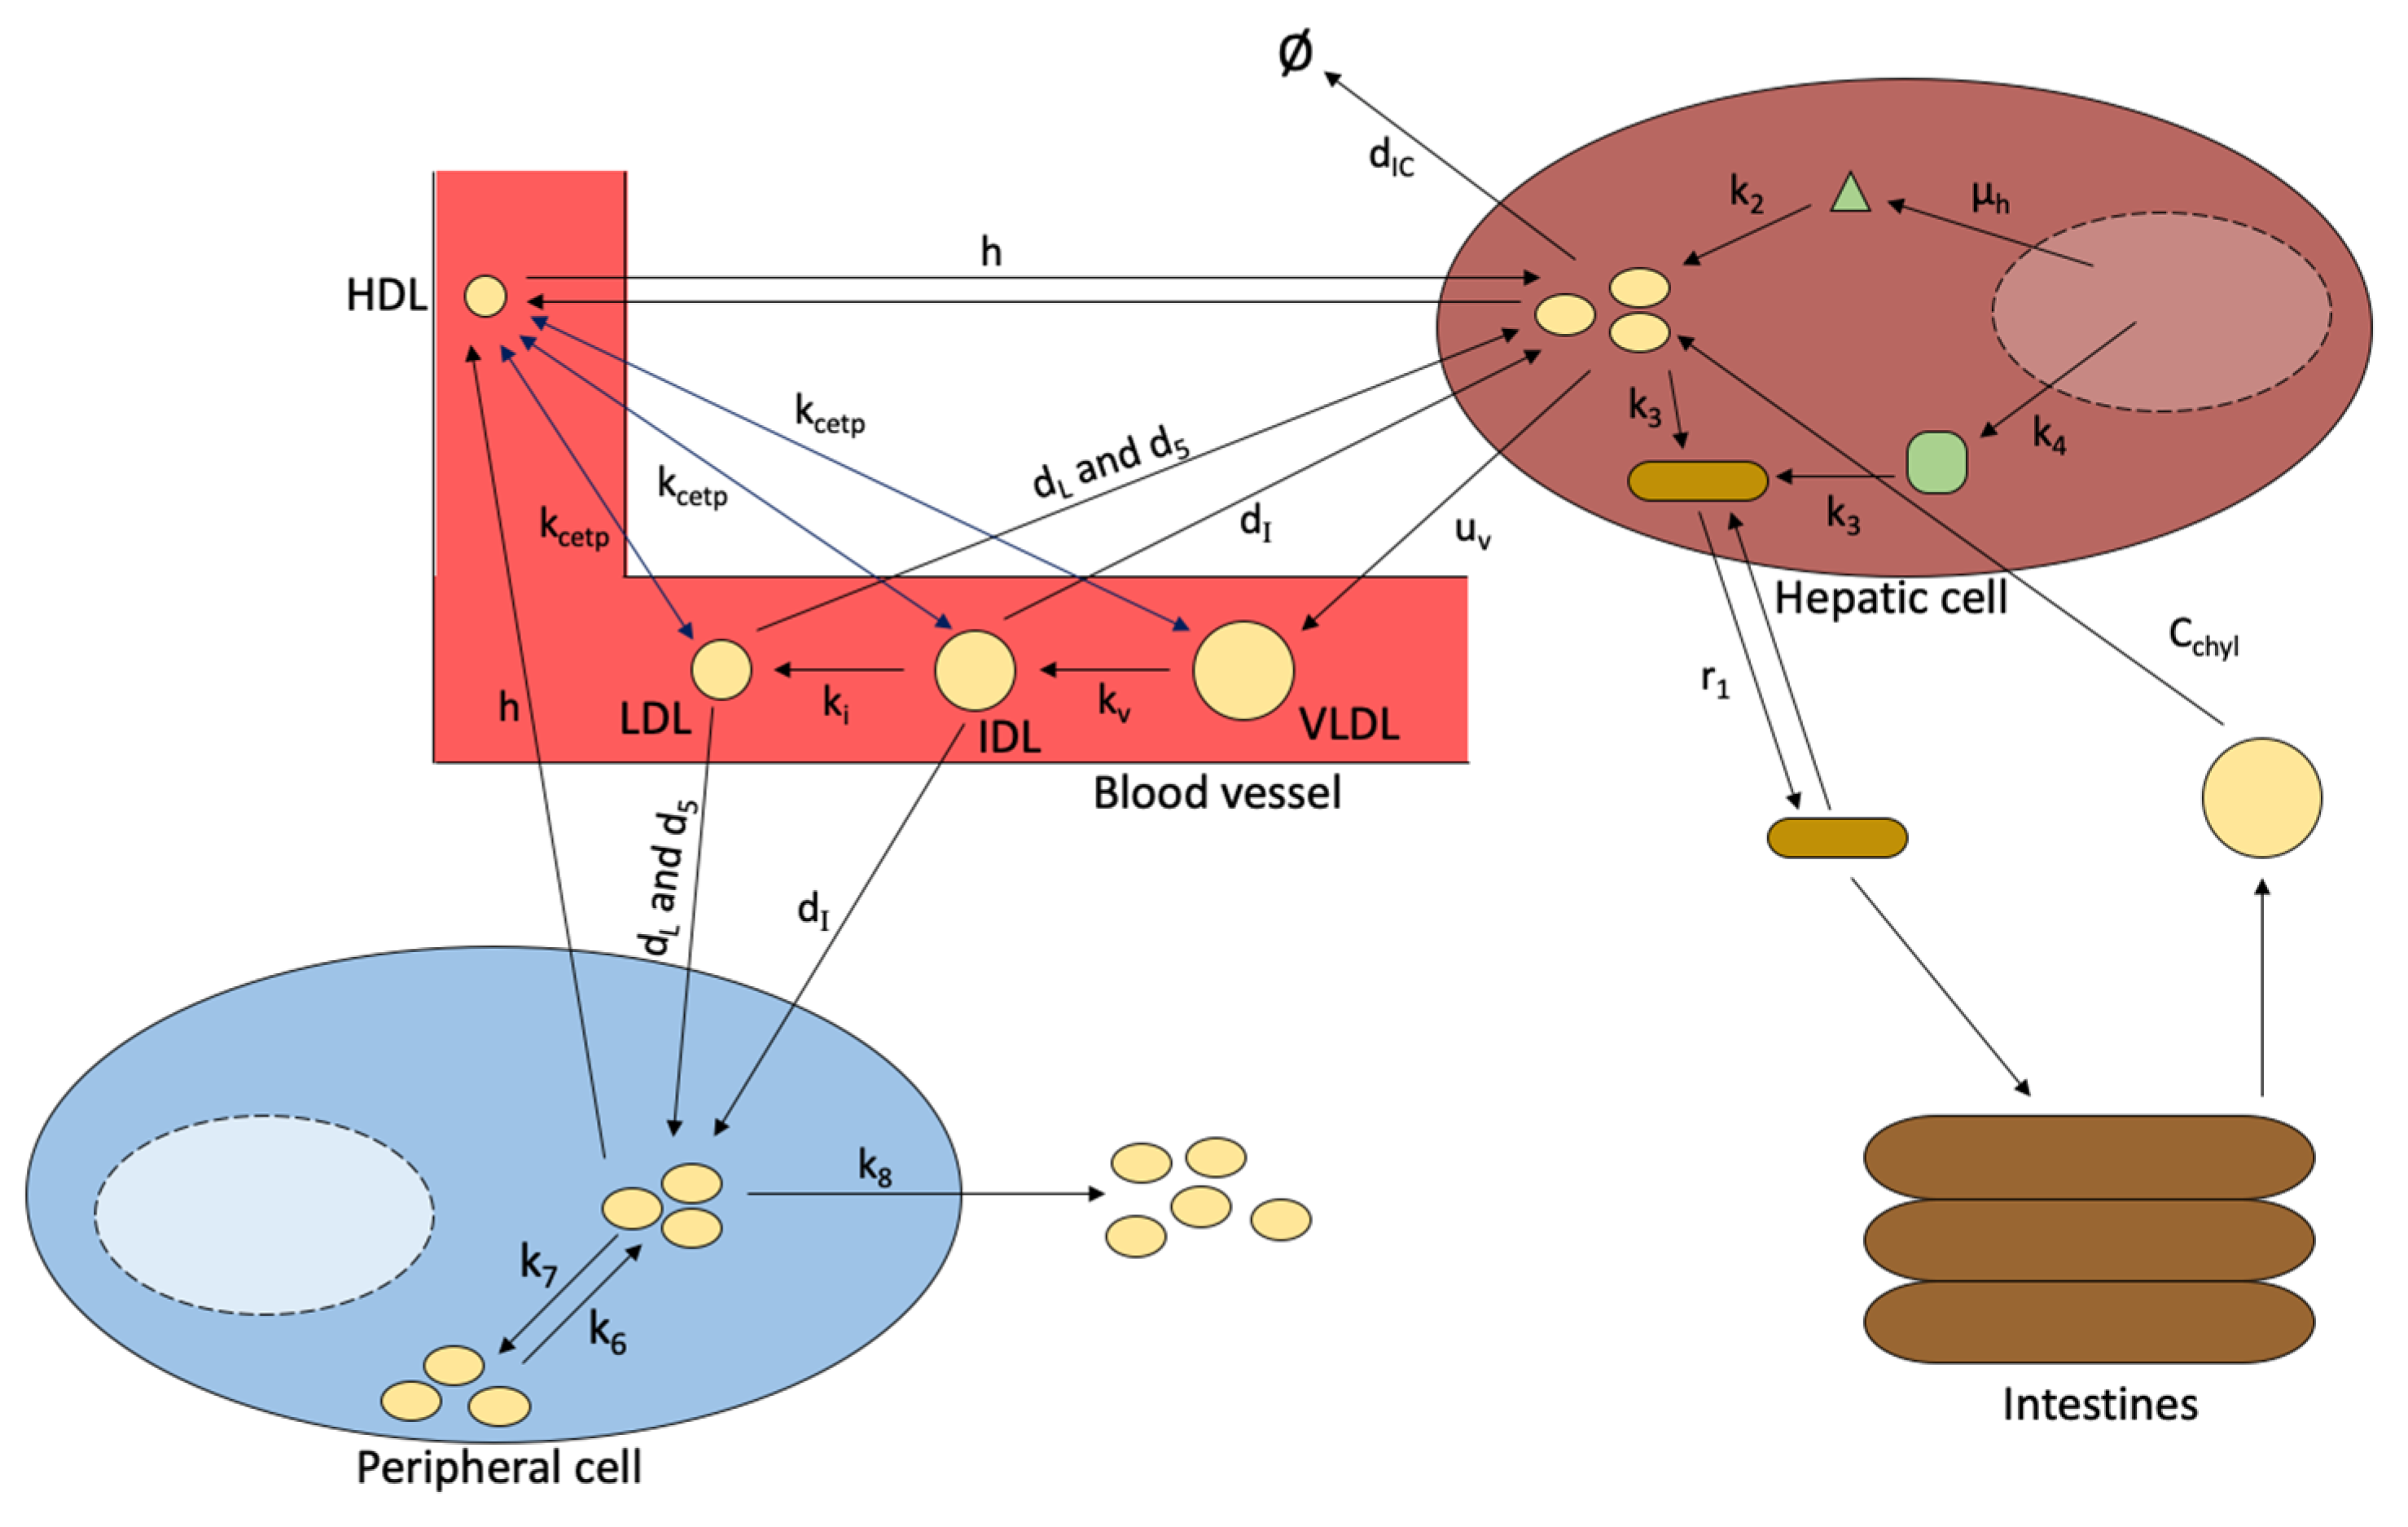
4.1. Lipoprotein Transport and Metabolism

Lipoprotein transportation model (Model 7 in Table 1), as shown in Figure 5, demonstrates how cholesterol is transported between lipoproteins as well as how it can be reversely transported. In a normal transport, cholesterol leaves the liver in the form of VLDL [45]. As VLDL travels, it loses triglycerides and turns into IDL [27,78]. The IDL further loses triglycerides on its path to becoming LDL [41,78]. Both IDL and LDL can then bind to LDL receptors on cell surfaces and be brought into cells [27]. As VLDL, IDL, and LDL move through the bloodstream, they can all receive cholesterol from HDL or lose cholesterol to HDL [44,78]. This is accomplished using CETP and occurs with a similar rate both forwards and backwards for each lipoprotein [40,78]. HDL can also engage in reverse cholesterol transport and reenter the liver [22]. Additionally, Model 7 describes how lipoproteins bind to LDL receptors and are then internalized. While lipoproteins are only internalized by receptors that have coated pits allowing them to make vesicles inside the cell, this detail (i.e., coated pits and vesicles) is not included in this simplified model. Since this model focuses on how much cholesterol is brought into the cell, it is measured in the form of cholesterol particles, instead of the concentration of cholesterol in the lipoproteins that are binding to the receptors. The production of the receptors themselves are regulated by SREBP. The lower the concentration of internal cholesterol within the cell, the more the receptors move towards the surface of the cell to receive lipoproteins [22].
Model 7 is of value to understand how cholesterol exists within and is transferred among the different lipoprotein types as well as peripheral blood cells. The model addresses the rates at which cholesterol concentrations change within lipoproteins and how cells bind to and internalize lipoproteins and cholesterol. While the equations of this model cover an extensive amount of lipoprotein metabolism, they also exclude important factors and make assumptions to simplify the model. For example, it is assumed that VLDL is released from the liver at a constant rate while in reality this is not the case. The secretion rate would be increased if the lipid content is high in the liver [81]. It is also assumed that all the intracellular cholesterol comes from internalizing lipoproteins. This is inaccurate since both liver and peripheral cells manufacture their own cholesterol as well. The last thing neglected in this model is the transfer of cholesterol to HDL from the intestinal system. While it may not be a significant amount of cholesterol, it should still be included. This model also only applies to peripheral cells due to the parameter setting [22].

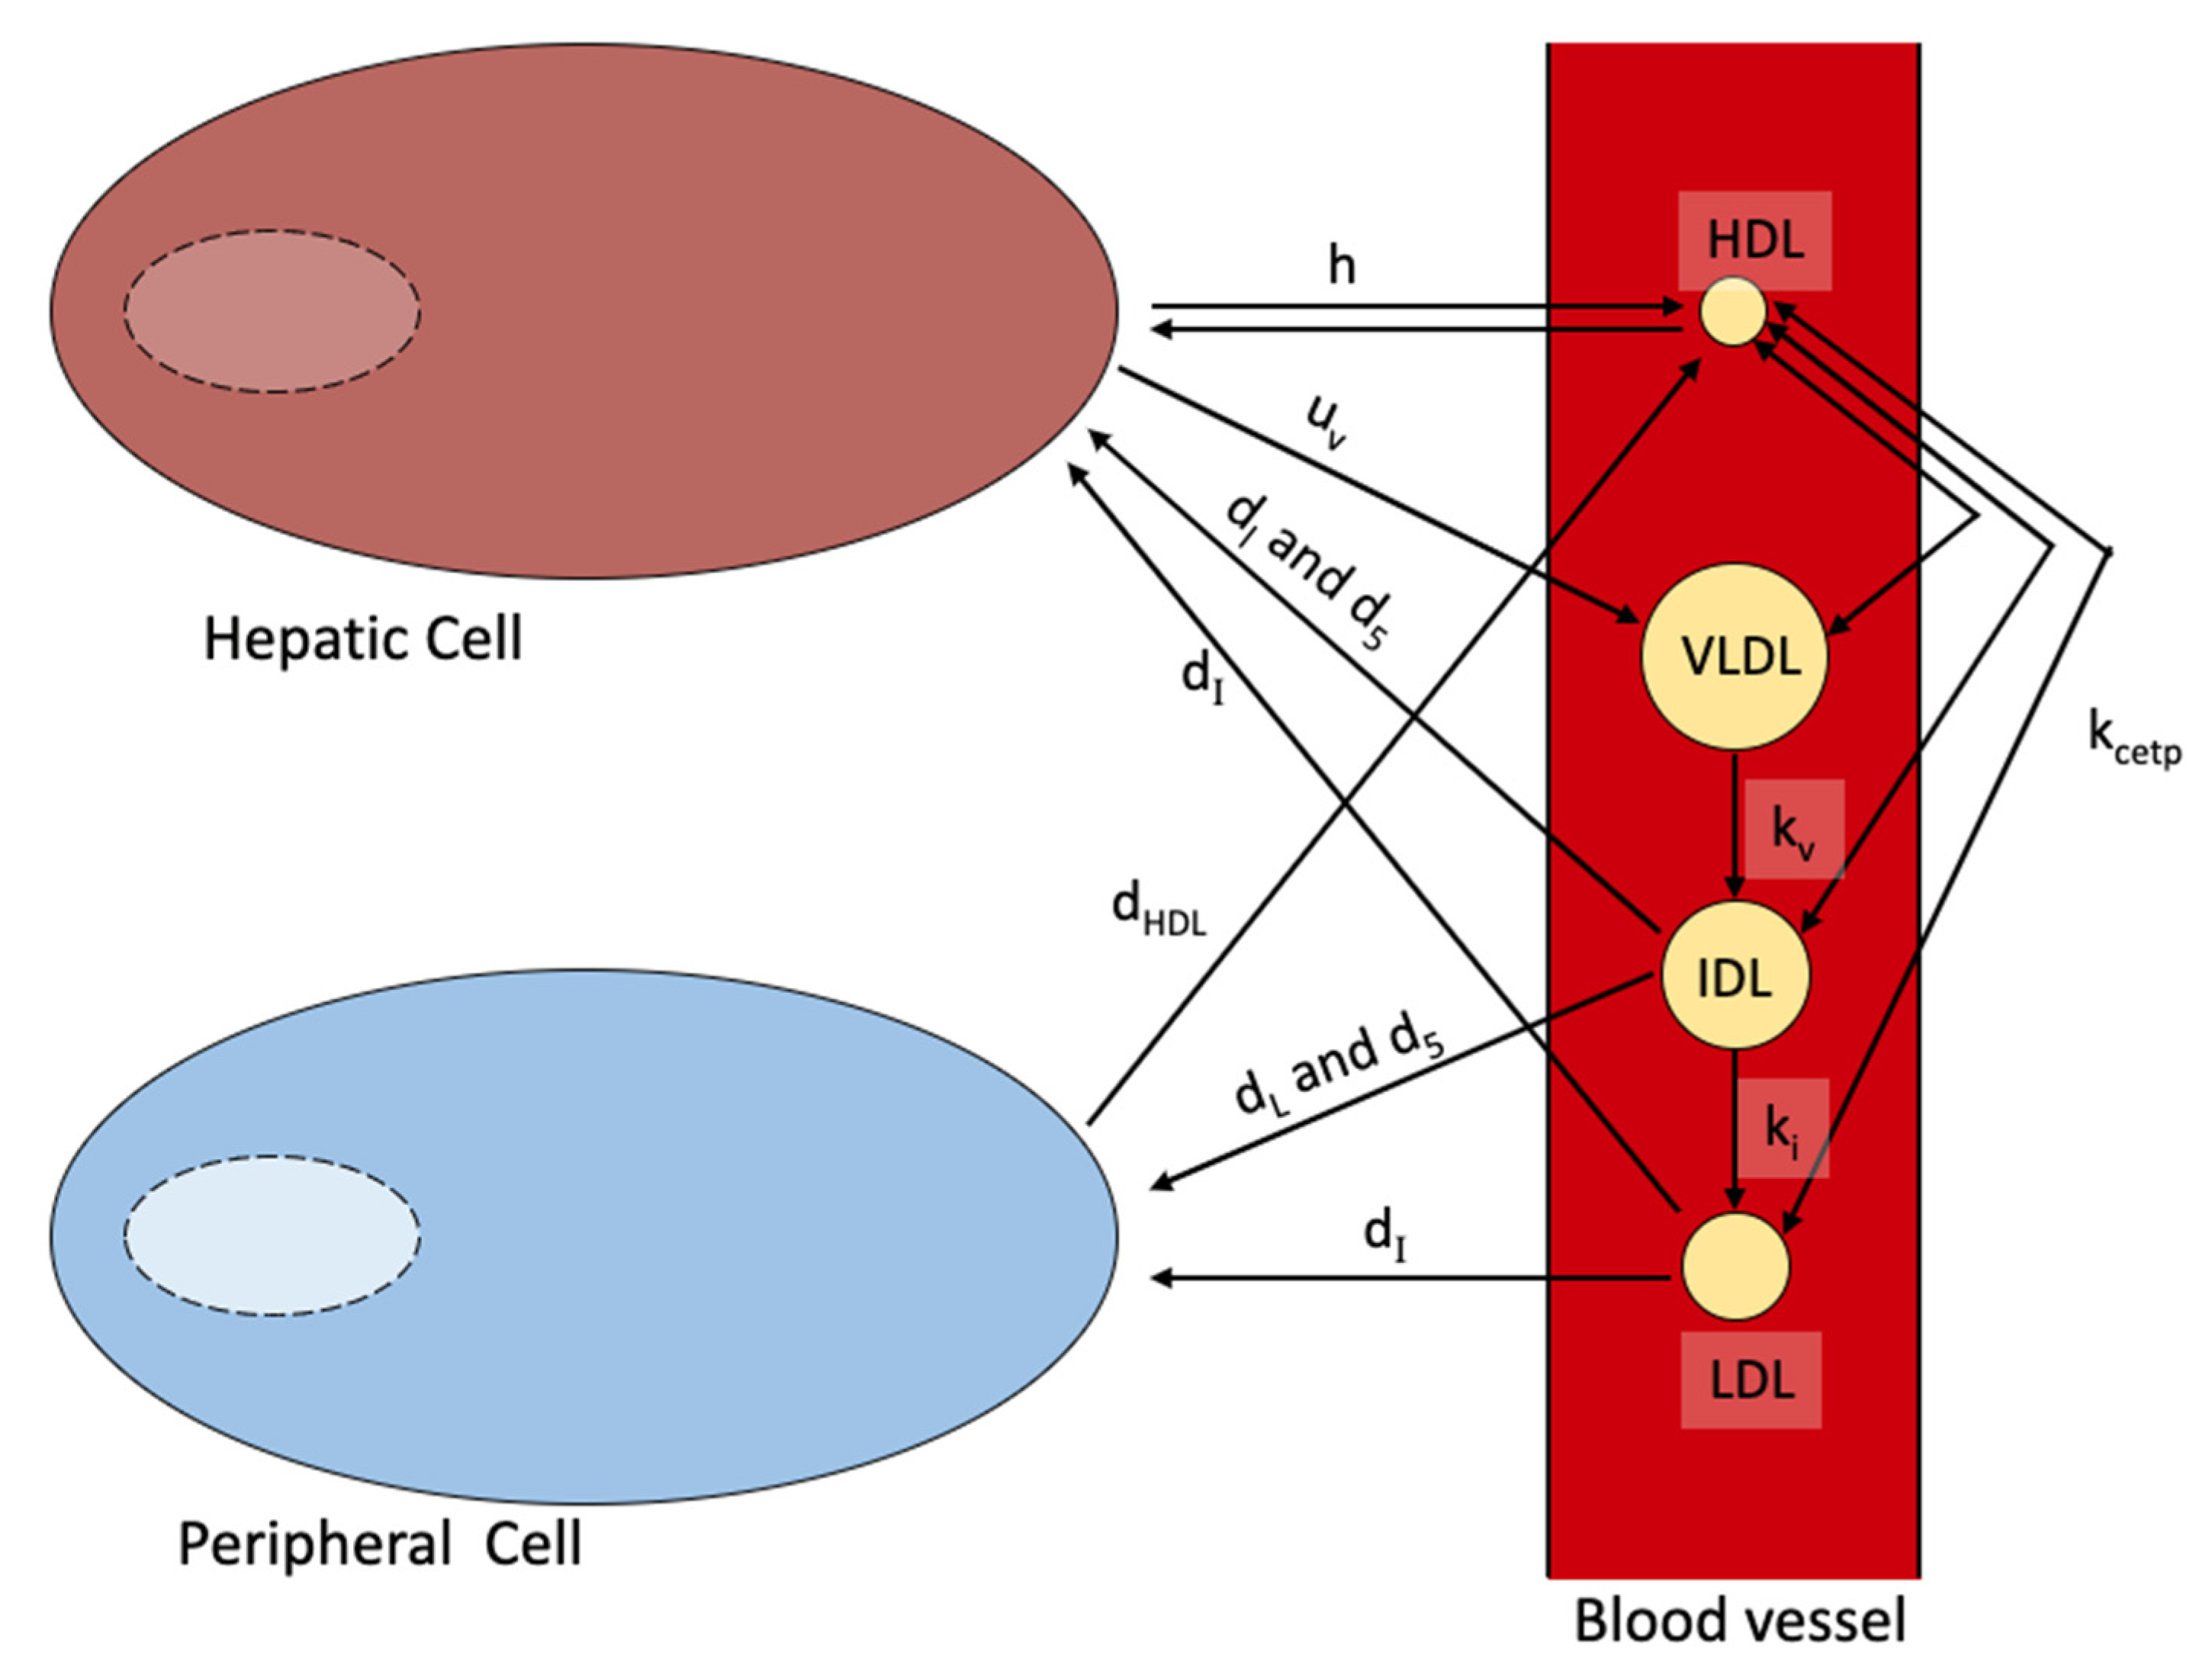
4.2. Blood Plasma Model

Blood plasma model (Model 8 in Table 1) examines the transport of cholesterol through the blood plasma in greater detail than the lipoprotein metabolism model (i.e., Model 7). The overall transport chain is shown in Figure 6 [22].
Model 8 accounts for all cholesterol exchange between lipoproteins, liver cells, and peripheral cells. The only main transfer not acknowledged in this model is the transfer of cholesterol to HDL from the intestines. While the amount of cholesterol transferred in this way is small, it may or may not be negligible. This model also makes certain assumptions that are not accurate. It is assumed that the rate in which VLDL leaves the liver is controlled only by the amount of intracellular cholesterol, which is not accurate. The release of VLDL is much more complex and is influenced by other things such as the regulation of the nervous system [82,83]. It is also assumed that all transfer using CETP occurs at the same rate which may or may not be true.

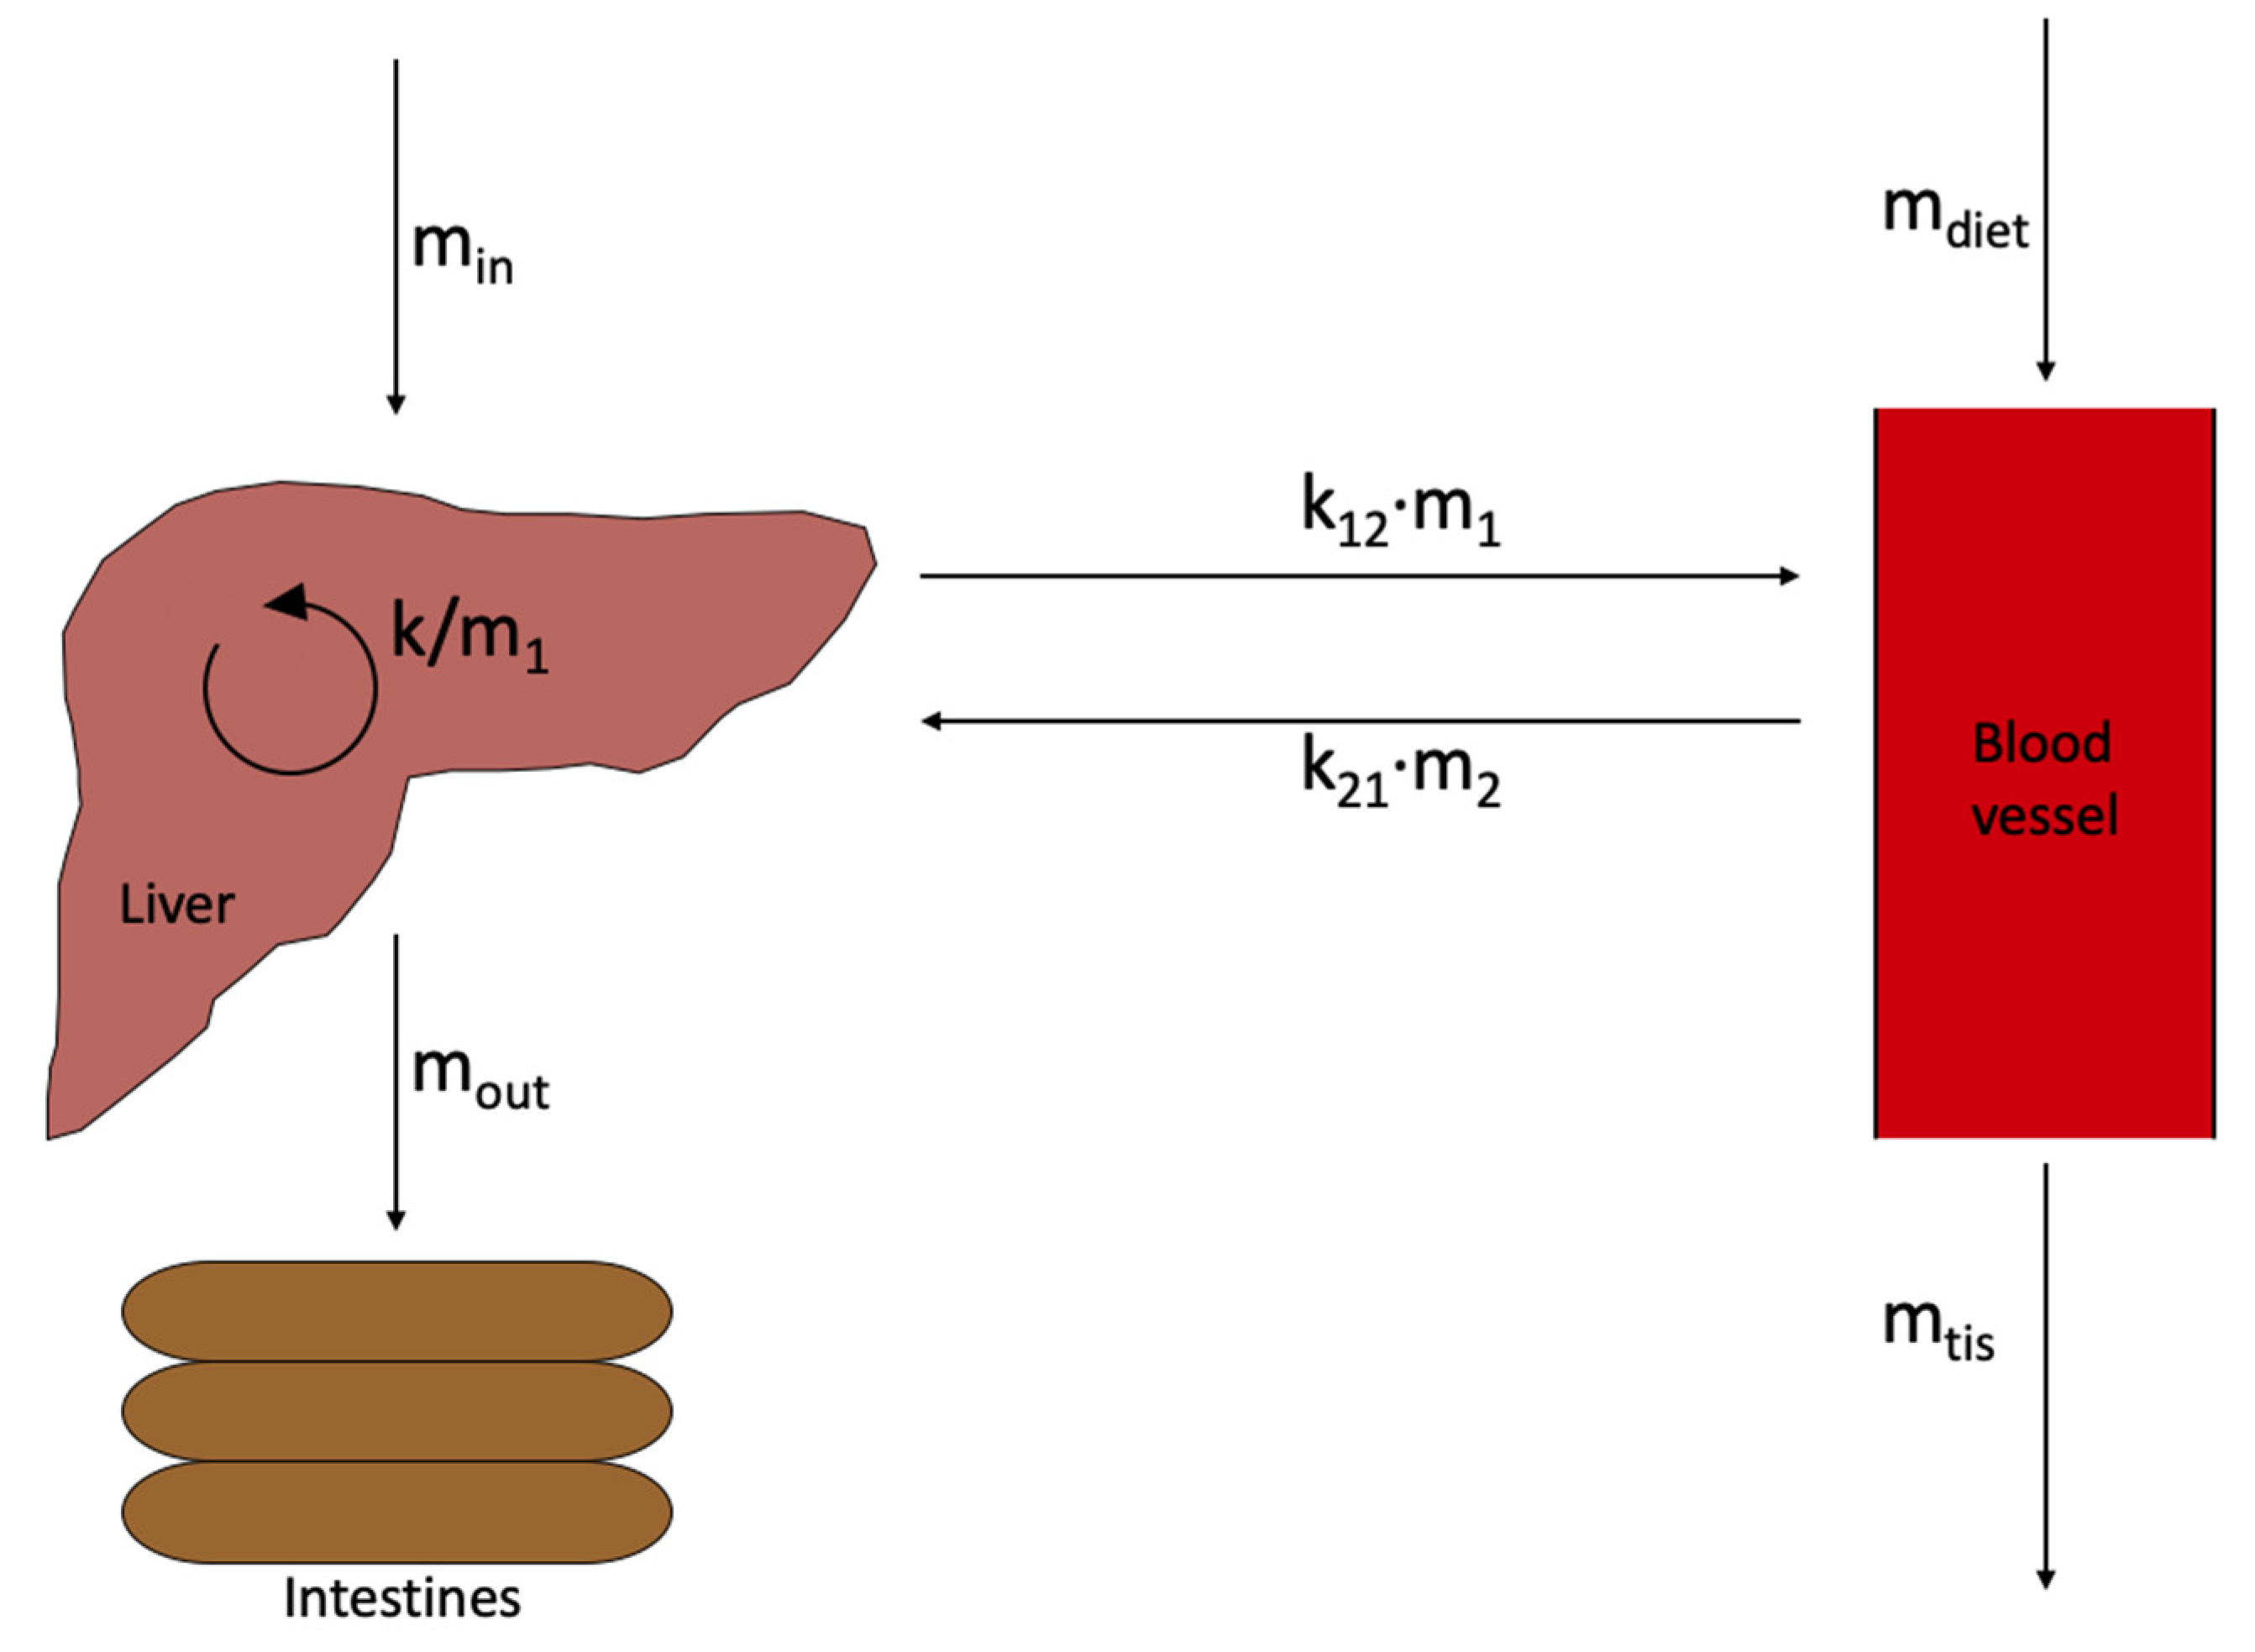
4.3. Two-Pool Model of Cholesterol Transport

The movement of cholesterol is often analyzed in a two-pool model (Model 9 in Table 1). This model separates cholesterol interactions in the liver and cholesterol interactions in the bloodstream into two different “pools” [49]. As seen in Figure 7, cholesterol is transferred to the liver from intestine and from the bloodstream. Besides this, the liver also synthesizes its own cholesterol and expels cholesterol in the form of bile acids. The bloodstream collects cholesterol from the liver, and in some cases, from dietary substances. The bloodstream also loses cholesterol to peripheral cells. This model comes with assumed values for initial volumes of blood and initial concentrations/amounts of cholesterol in each pool. These inputs can be changed. This also applies to the amount of cholesterol received from intestine and diet as well as the amount of cholesterol lost to peripheral cells and bile acids [36,49].
Model 9 is of value to show the basics of cholesterol exchange involving the two main pools where cholesterol metabolism occurs. This model is also useful for investigating cholesterol transport. If the steady state concentration of cholesterol in the liver is higher than the bloodstream, there is a need transporting cholesterol from the liver to the bloodstream, and vice versa. While this model can be useful, it also has some drawbacks. The parameters for this model assume certain volumes of blood for each pool and assume maximum cholesterol concentrations. This means some of the parameters may need to be adjusted for analysis. This model is also a very simplified view of what occurs in cholesterol transfer between these two pools. There are no detailed equations to describe how the cholesterol is transferred between the pools and their surroundings. Instead, many pathways are bundled together to make single rate constants. Having a single rate constant to describe multiple processes can lead to inaccuracies [49].

4.4. Drug Delivery Model

Modeling drug delivery is key to decide how and where to target for cholesterol therapeutic drugs. There are several kinds of ways drugs can engage in controlled release, such as diffusion, chemical release, osmosis, and degradation-controlled release [84]. The parameters of each of these mechanisms can change based on the material of the carrier or the location being targeted. Before looking at the specific control systems, it is important to understand the basics of drug diffusion. The drug diffuses through the polymer wall of the carrier into the surrounding water. Fick’s law of diffusion is used to accurately describe this process [85]. The flux is dependent on the diffusion coefficient of the drug compound as well as the concentration gradient [86]. The diffusion coefficient can either be found in literature if it is already known or can be estimated using correlations [39].
Erodible systems release the drug through degrading the polymer shell [87]. Erosion systems can still be classified as diffusion controlled instead of chemically controlled if the kinetics are determined by the diffusion of the drug and not the erosion of the polymer [39]. Erosion can further be divided into two types, surface and bulk [88]. In bulk erosion, the entire polymer erodes together at the same rate while in surface erosion, only the surface of the polymer erodes. Besides erosion, there is another kind of chemical-controlled release called pendant chain release. In this type of system, the bond between the drug compound and the carrier is degraded so the drug can diffuse through the carrier [89]. If the drug exists in a uniform concentration and it is soluble, the system can be osmotically controlled. The conditions present in this system lead to pressures that cause the carrier to burst and release the drug. Thermodynamics is used to model this type of drug release. Because of the way in which the drug is released, most releases are in a single burst and result in a zero-order model [90].
The final type of control mechanism, swelling, occurs when a water-soluble drug is contained in a carrier that swells when placed in water. The swelling of the carrier results in a relaxation of the polymer that makes it up. This allows for an easier diffusion of the drug through the carrier [91]. The swelling of the carrier can also be influenced by pH, temperature, and the strength of the ionic bonds [92]. The dimensionless Deborah number is used to describe this kind of drug release [93]. If the Deborah number is much less than one, the system is relaxation controlled. On the other hand, if it is much greater than one, it is diffusion controlled [94,95]. In addition to this, the carrier will also dissolve if it swells to the point where its polymers are no longer cross-linked [96]. The equations of Model 10 are shown in (A60) through (A68) in Appendix A.

5. Discussion

Models 1–9 illustrate how cholesterol is created, metabolized, and transported across the body. Model 10 illustrate the drug delivery process involved in the high cholesterol therapies. While some examine different processes than others and some may be simplified, they together offer a big picture to understand the basic processes of cholesterol synthesis, metabolism, and transport. However, there are remaining gaps for those models to be further improved. For example, for the bile acid synthesis model, if further models could include both the conversion of cholesterol into bile acid and the esterification of cholesterol, it would be more precise to model the system. This is much closer to what we have known from the recent studies of the system, instead of over simplification [74,81]. Since most of the models described in this work were built upon certain assumptions, they may have specific parameters that may apply in some specific scenarios. In other words, these models are not universally valid. Parameters of these models may need to be re-estimated with experimental data. Since it may be expensive or time-consuming to obtain enough experimental data, it is necessary to use techniques like sensitivity analysis to select the parameters with the most influential impact on the cholesterol metabolism and transport for re-estimation [97,98]. In addition to parameter re-estimation, the models can be improved by adding more reactions/equations to eliminate assumptions made in the models. The more we learn about the specifics of processes involving cholesterol, the more these equations can be altered to become more accurate. With the more detailed study that will be continually conducted in cholesterol metabolism, these existing models can be updated by adding the most recent found new pathways in the cholesterol metabolism.
Models 1–6 mainly focus on the intracellular cholesterol synthesis and metabolism, while Model 7–10 describe the transport processes of cholesterol between different types of cells. As shown by the hepatic and peripheral cell models combining multiple processes that occurred within each cell, models can be combined to achieve a full and multiple scale body model. They can also describe the way cholesterol is processed as a whole, both within and between cells/compartments, as shown in Figure 8. This would involve taking the general ideas from two or three compartment models and adding the specifics of things such as cholesterol biosynthesis, bile acid synthesis, transport, receptor mechanics, and other processes. In addition, the transport of cholesterol between different compartments should be added into the model. A cumulative model of cholesterol metabolism and transport would require the models presented in this paper along with more information on the intestines. There still lacks a lot of mathematical information about cholesterol processes involving the intestines. If this information was included, there could be a complete picture of cholesterol within the entire body. With a model that unifies the terms/equations/variables from the presented models to cover many specific processes, it can be better understood which processes can be targeted for a maximum effect on manipulating the cholesterol levels throughout the entire body.
Good mathematical models can be used in drug discovery and development, as they can be used to predict which proteins or signals within the cholesterol biosynthesis pathway are best to be altered to produce lower amounts of LDL cholesterol. Lowering LDL cholesterol will lower the risk of heart disease and other health problems, which enable the development of novel way to reduce the risk of those health problems. While this section discusses two important drugs (i.e., bile sequestering agents and ezetimibe) with the bile acid synthesis model (Model 6), more drugs may be discovered using the combined model as shown in Figure 8 in the future. Bile sequestering agents bind to the bile containing bile acids that are sent to the intestines from the liver. When the bile is bound, the intestines are unable to reabsorb cholesterol from them, meaning there is no recycling of bile acids. The downside to this drug is that it cannot be combined with other cholesterol lowering drugs. The other important drug that focuses on bile acids is ezetimibe. Ezetimibe also block re-absorption of cholesterol in bile acids, but do so by directly blocking the pathway in which the cholesterol is absorbed by the intestines. Unlike bile sequestering agents, ezetimibe can be combined with other drugs. The current most effective method of high cholesterol treatment is a combination of statins and ezetimibe. Once more drugs are discovered from the model-predicted targets, information on drug delivery methods can help when designing drugs for specific locations of the body. For example, one type of drug delivery system could be more effective for the intestines than the liver and should therefore be used for ezetimibe. Combining the knowledge of drug delivery and biological processes can yield more efficient options to treat high cholesterol diseases. However, there is no such mathematical model that combine the drug delivery together with cholesterol metabolism. If there existed a model that could enable the modeling of how an administered drug can affect the cholesterol metabolism and how the optimized dose of the drug could be predicted from the combined model, this would represent significant progress for the development of novel cholesterol therapeutics.

Author Contributions

Conceptualization, Z.H.; methodology, F.Z., B.M., R.S. and Z.H.; data curation, F.Z., B.M. and R.S.; writing—original draft preparation, F.Z., B.M. and R.S.; writing—review and editing, Z.H. All authors have read and agreed to the published version of the manuscript.

Funding

This research received no external funding.

Institutional Review Board Statement

Not applicable.

Informed Consent Statement

Not applicable.

Data Availability Statement

Not applicable.

Conflicts of Interest

The authors declare no conflict of interest.

Appendix A

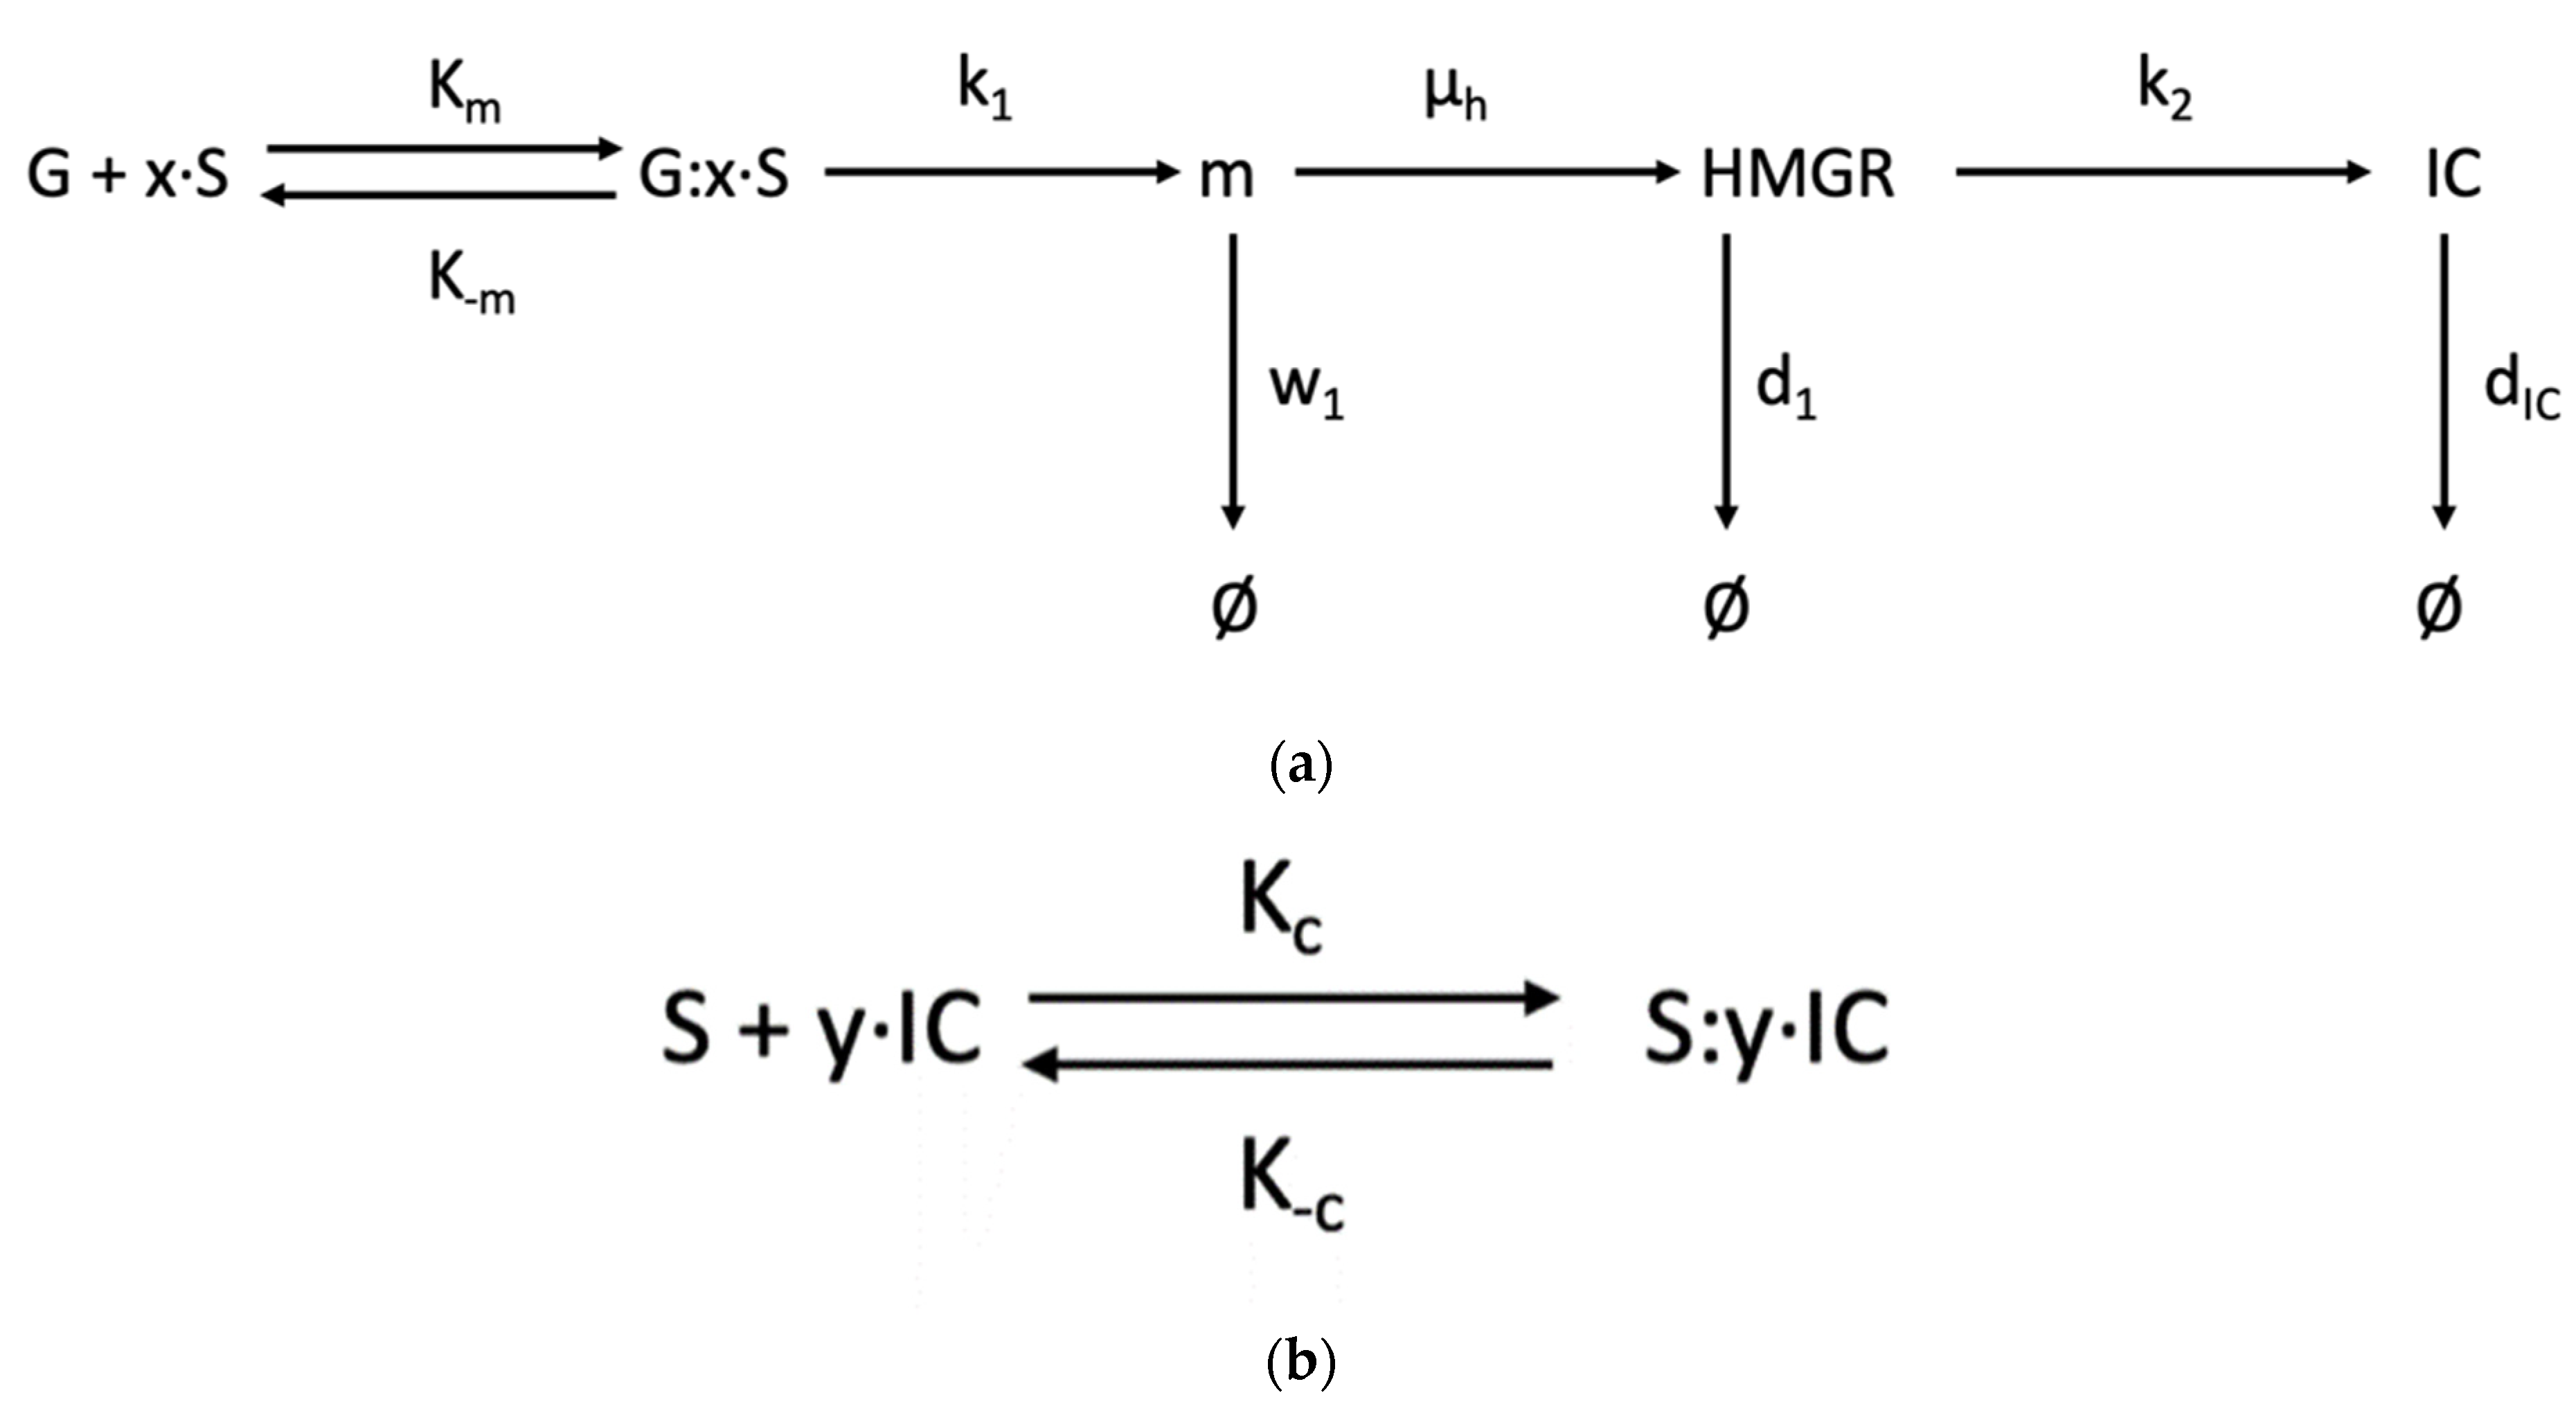
  • Model 1. SREBP Regulation [35].
d [ m ] d t = k 1 1 + ( K m ( 1 + ( [ I C ] K c ) y ) S 0 ) x w 1 [ m ]
d [ H M G R ] d t = μ h [ m ] d 1 [ H M G R ]
d C d t = k 2 [ H M G R ] d I C [ I C ]
α = w 1 d 1 d I C k 2
β = α K m x
γ = K c y
β γ x c s s y x + 1 + x β γ ( x 1 ) c s s y ( x 1 ) + 1 + x β γ c s s y + 1 + ( α + β ) c s s k 1 = 0
  • d[m]/dt = change in mRNA concentration over time
  • k1 = rate of HMG-CoA reductase gene transcription
  • Km = equilibrium rate of SREBP-gene binding
  • [IC] = concentration of intracellular cholesterol
  • KC = equilibrium rate of SREBP-cholesterol binding
  • S0 = initial concentration of SREBP
  • y = required molecules of cholesterol to bind to SREBP
  • x = required molecules of SREBP to bind to gene
  • w1 = degradation rate of HMG-CoA reductase mRNA
  • [m] = concentration of HMG-CoA reductase mRNA
  • d[HMGR]/dt = change in HMG-CoA reductase concentration over time
  • μh = rate of HMG-CoA reductase mRNA translation
  • d1 = degradation rate of HMG-CoA reductase
  • [HMGR] = concentration of HMG-CoA reductase
  • d[IC]/dt = change in intracellular cholesterol concentration over time
  • k2 = rate of HMG-CoA reductase converting to intracellular cholesterol
  • dIC = degradation rate of intracellular cholesterol
  • css = concentration of intracellular cholesterol at steady state
  • Model 2. Steady State Cholesterol Biosynthesis [38].
d [ S ] d t = Φ I Φ O A k C [ E ] [ S ] + k C R [ C ]
d [ E ] d t = Φ E I + k P [ C ] + k C R [ C ] k C [ E ] [ S ] k P R [ E ] [ P ] Φ E O
d [ I C ] d t = k C [ E ] [ S ] + k P R [ E ] [ P ] k P [ C ] k C R [ C ]
d [ P ] d t = k P [ C ] Φ O k P R [ E ] [ P ]
r = k P R N k C N = k C R N k P N
E N * = ( 1 f * ) · ( 1 r 2 ) ( 1 f ) · ( S N * r 2 P N * )
S N * = r 2 P N * + ( 1 f * ) · ( 1 r 2 ) ( 1 f ) · E N *
u ( s ) = k a c t · ( s + k e G ) s 2 + s · ( k e G + k e P ) + ( k e P · k e G k f k e x ) · e ( s )
  • d[S]/dt = change in substrate concentration over time
  • ΦI = influx of substrate
  • ΦOA = outflux of substrate
  • kC = forward binding rate of substrate to enzyme
  • [E] = concentration of enzyme
  • [S] = concentration of substrate
  • kCR = reverse binding rate of substrate to enzyme
  • [C] = concentration of substrate-enzyme complex
  • dE/dt = change in enzyme concentration over time
  • ΦEI = influx of enzyme
  • kP = forward reaction and release rate of substrate to product
  • kPR = reverse release rate of product and enzyme
  • [P] = concentration of product
  • ΦEO = outflux of enzyme
  • d[IC]/dt = change in intracellular cholesterol concentration over time
  • d[P]/dt = change in product concentration over time
  • ΦO = outflux of product
  • r = ratio of reaction rates
  • EN* = new normalized steady state concentration of enzyme
  • f* = ΦOAss*/ΦIss*
  • f = ΦOAss/ΦIss
  • SN* = new normalized steady state concentration of substrate
  • PN* = new normalized steady state concentration of product
  • u(s) = control signal as a function of signal frequency
  • kact = rate SREBP becomes active
  • s = frequency
  • keG = elimination rate of SREBP mRNA
  • keP = elimination rate of SREBP
  • kf = rate of SREBP formation from gene expression
  • kex = rate of SREBP gene expression
  • Model 3. De Novo Cholesterol Biosynthesis [22].
d [ H M G R ] d t = k 1 b 1 + [ I C ] d 1 [ H M G R ]
d [ I C ] d t = k 2 [ H M G R ] [ H M G C o A ] k m 1 + [ H M G C o A ] d I C [ I C ]
[ m ] * = g 1 g m n w 1 ( g m n + [ I C ] n )
[ H M G R ] * = k 1 d 1 ( b 1 + [ I C ] )
d [ I C ] d t = k 1 d 1 ( b 1 + [ I C ] ) k 2 [ H M G C o A ] k m 1 + [ H M G C o A ] d i c [ I C ]
  • d[HMGR]/dt = change in HMG-CoA reductase over time
  • k1 = rate of HMG-CoA reductase gene transcription
  • b1 = attenuation coefficient for cholesterol control of HMG-CoA reductase
  • [IC] = concentration intracellular cholesterol
  • d1 = rate of HMG-CoA reductase degradation
  • [HMGR] = concentration of HMG-CoA reductase
  • d[IC]/dt = change in intracellular cholesterol over time
  • k2 = rate of HMG-CoA conversion by HMG-CoA reductase
  • [HMG-CoA] = concentration of HMG-CoA
  • km1 = Michaelis–Menten constant
  • dIC = rate of cholesterol use and degradation
  • [m]* = steady state concentration of mRNA
  • g1 = rate of transcription
  • gm = rate of DNA degradation
  • w1 = rate of mRNA degradation
  • n = Hill cooperativity
  • [HMGR]* = steady state concentration of HMG-CoA reductase
  • Model 4. Cellular cholesterol biosynthesis and lipoprotein metabolism [48].
J d m h d t = μ m h 1 + ( κ m h ( 1 + ( c κ c ) x c ) ) x h δ m h m h
J d m r d t = μ m r 1 + ( κ m r ( 1 + ( c κ c ) x c ) ) x r δ m r m r
d h d t = μ h m h δ h h
W d l E d t = α L r f l E + α L l R B + W χ v ρ v υ E
d l R B d t = α L r f l E α L l R B β L l R B
d l I d t = β L l R B l I γ L
W d v E d t = α v r f v E + α v v R B W χ v υ E + W ω
d v R B d t = α v r f v E α v v R B β v v R B
d r f d t = γ r r I + m l ϑ l ( β L r f l R B 1 r f α L r f l E + α L l R B ) β 0 r f P + m v ϑ v ( β v r f v R B 1 r f α v r f v E + α v v R B )
d r I d t = γ r r I + f β 0 r f P + f m l ϑ l ( 1 + r f 1 r f ) β L l R B + f m v ϑ v ( 1 + r f 1 r f ) β v v R B + μ r m r
d v I d t = β v v R B v I γ v
d c d t = R L c h o l σ l γ L l I + R v c h o l σ v γ v v I + μ c h δ c c
  • J = scaling parameter
  • μmh = transcription rate of HMGCR
  • κmh = transcription rate of HMGCR by SREBP-2
  • c = intracellular cholesterol
  • xc = binding sites number for cholesterol to bind to SREBP-2
  • xh = the number of SREBP binding sites on the HMGCR gene
  • xr = number of binding sites on the LDLR gene SREBP-2 binds to
  • δmh = HMGCR mRNA degradation rate
  • mh = concentration of HMGCR mRNA
  • mr = concentration of LDLR mRNA
  • μmr = transcription rate of LDLR mRNA
  • κmr = transcription rate of LDLR mRNA by SREBP-2
  • δmr = receptor mRNA degradation rate
  • mr = LDLR mRNA
  • μh = synthesis rate of HMGCR
  • μr = synthesis rate of LDLR mRNA
  • μc = synthesis rate of cholesterol
  • δh = HMGCR degradation rate
  • h = intracellular HMGCR
  • κc = SREBP-2 negatively regulation rate
  • W = scaling parameter
  • xυ = VLDL dilapidation rate to LDL
  • αυ = VLDL binding rate on the cell surface
  • α-υ = VLDL unbinding rate on the cell surface
  • αL = LDL binding rate on the cell surface
  • α-L = LDL unbinding rate on the cell surface
  • βυ = VLDL occupied receptor endocytosis rate
  • βL = LDL occupied receptor endocytosis rate
  • β0 = empty receptor endocytosis rate
  • γv = rate of cholesterol extraction from VLDL
  • γL = rate of cholesterol extraction from LDL
  • ƒ = rate of cholesterol receptor recycled from endosome
  • γr = rate of cholesterol receptor recycled from intracellular space to cell surface
  • lE = LDL in the media surrounding cell
  • lRB = the LDL bound receptors
  • lI = internalized LDL particles
  • δc = the rate of esterification of LDL particles
  • υE = concentration of extracellular VLDL
  • ω = constant serum supply of VLDL
  • P = empty receptors
  • φ = degradation
  • Model 5. Boolean Modeling of Cholesterol Biosynthesis Regulation [37].
In inhibition, enzyme A produces enzyme B but is inhibited by enzyme C. This would have the Boolean equation:
B ( t + 1 ) = A ( t )   A N D   N O T   ( C ( t ) )
B ( t + 1 ) = A ( t )   A N D   C ( t )
H M G C o A ( t + 1 ) = ( A c e t o a c e t y l C o A ( t ) )   A N D   ( A c e t y l C o A ( t ) )   A N D   ( H M G C o A S y n t h a s e ( t ) )
C h o l e s t e r o l ( t + 1 ) = ( D e s m o s t e r o l ( t ) )   O R   ( 7 d e h y d r o c h o l e s t e r o l ( t ) )
H M G C o A R e d u c t a s e ( t + 1 ) = ( H M G C o A R e d u c t a s e R N A ( t ) )   A N D   N O T   ( S t a t i n ( t ) )
  • Model 6. Bile Acid Biosynthesis [22]
d [ I C ] d t = k 3 [ C 7 H ] [ I C ] k m 2 + [ I C ]
d [ B A ] d t = k 3 [ C 7 H ] [ I C ] k m 2 + [ I C ] d 3 η [ B A ] r 1 ( 1 η ) [ B A ] + k 5 [ R B A ]
d [ C 7 H ] d t = k 4 b 2 + [ R B A ] d 4 [ C 7 H ]
[ R B A ] * = r 1 k 5 ( 1 η ) [ B A ]
[ C 7 H ] * = k 4 d 4 ( b 2 + r 1 k 5 ( 1 η ) [ B A ] )
d [ B A ] d t = k 4 d 4 ( b 2 + r 1 k 5 ( 1 η ) [ B A ] ) k 3 [ I C ] k m 2 + [ I C ] d 3 η [ B A ]
d [ I C ] d t = k 4 d 4 ( b 2 + r 1 k 5 ( 1 η ) [ B A ] ) k 3 [ I C ] k m 2 + [ I C ]
  • d[IC]/dt = change in intracellular cholesterol over time
  • k3 = rate of cholesterol to bile acid conversion
  • [C7H] = concentration of C7H
  • [IC] = concentration of intracellular cholesterol
  • km2 = C7H Michaelis–Menten constant
  • d[BA]/dt = change in bile acid concentration over time
  • d3 = rate of unrecycled bile acid degradation
  • η = percent of bile acids that are not recycled
  • [BA] = concentration of bile acids
  • r1 = rate of bile acid recycling
  • k5 = rate of recycled bile acids rejoining bile acid pool
  • [RBA] = concentration of recycled bile acids
  • d[C7H]/dt = change in C7H concentration over time
  • k4 = rate of transcription
  • b2 = regulation of C7H attenuation coefficient
  • d4 = rate of C7H degradation
  • [RBA]* = steady state concentration of recycled bile acids
  • [C7H]* = steady state concentration of recycled bile acids
  • Model 7. Lipoprotein transportation and Metabolism [22].
d [ V ] d t = u v k v [ V ] + k c e t p [ H ] [ V ] ( [ H ] a v [ V ] )
d [ I ] d t = k v [ V ] k i [ I ] + k c e t p [ H ] [ I ] ( [ H ] a i [ I ] ) d I [ I ] Φ L R
d [ L ] d t = k i [ I ] d L [ L ] Φ L R d 5 [ L ] + k c e t p [ H ] [ L ] ( [ H ] a l [ L ] )
d [ Φ L R ] d t = b ( d i [ I ] χ I + d l [ L ] χ L ) Φ L R + c 1 Φ L R [ I C ]
d [ I C ] d t = ( d I [ I ] + d L [ L ] ) Φ L R + d 5 [ L ] d H D L [ H ] ( [ I C ] p [ H ] ) d I C [ I C ]
d [ H ] d t = d H D L [ H ] ( [ I C ] p [ H ] ) + k c e t p [ H ] [ V ] ( [ H ] a v [ V ] ) + k c e t p [ H ] [ I ] ( [ H ] a i [ I ] ) + k c e t p [ H ] [ L ] ( [ H ] a l [ L ] ) h [ H ]
  • d[V]/dt = change in VLDL cholesterol concentration over time
  • uv = rate of VLDL production by the liver
  • kv = conversion rate of VLDL to IDL
  • [V] = concentration of VLDL cholesterol
  • kcetp = rate of CETP transfer
  • [H] = concentration of HDL cholesterol
  • av = cholesterol gradient attenuation coefficient of HDL and VLDL equilibrium
  • d[I]/dt = change in IDL cholesterol concentration over time
  • ki = conversion rate of IDL to LDL
  • [I] = concentration of IDL cholesterol
  • ai = cholesterol gradient attenuation coefficient of HDL and IDL equilibrium
  • dI = rate of internalization of IDL into a cell by receptors
  • ΦLR = particles of cholesterol taken by receptors
  • d[L]/dt = change in LDL cholesterol concentration over time
  • dL = rate of internalization of LDL into a cell by receptors
  • [L] = concentration of LDL cholesterol
  • d5 = rate of internalization of LDL into a cell without the use of receptors
  • al = cholesterol gradient attenuation coefficient of HDL and LDL equilibrium
  • d[ΦLR]/dt = change in LDL receptors over time
  • b = combined receptor internalization rate of LDL and IDL
  • χI = fraction of cholesterol that makes up IDL
  • χL = fraction of cholesterol that makes up LDL
  • c = rate of receptor reuse
  • [IC] = concentration of intracellular cholesterol
  • d[IC]/dt = change in intracellular cholesterol concentration over time
  • dHDL = rate cholesterol is transferred to HDL
  • p = cholesterol transfer to HDL attenuation coefficient
  • dIC = rate of cholesterol uses and degradation
  • h = rate HDL is taken into the liver
  • Model 8. Blood Plasma Model [22].
d [ V ] d t = u v [ I C H ] k v [ V ] + k c e t p [ H ] [ V ] ( [ H ] a v [ V ] )
d [ I ] d t = k v [ V ] k i [ I ] + k c e t p [ H ] [ I ] ( [ H ] a i [ I ] ) d I [ I ] Φ H L R d I [ I ] Φ P L R
d [ L ] d t = k i [ I ] d 5 [ L ] d L [ L ] Φ H L R d L [ L ] Φ P L R + k c e t p [ H ] [ L ] ( [ H ] a l [ L ] )
  • d[V]/dt = change in VLDL cholesterol concentration over time
  • uv = rate VLDL is expelled by the liver
  • [IC-H] = concentration of hepatic intracellular cholesterol
  • kv = rate of conversion of VLDL to LDL
  • [V] = concentration of VLDL cholesterol
  • kcetp = rate of CETP transfer
  • [H] = concentration of HDL cholesterol
  • av = cholesterol gradient attenuation coefficient of HDL and VLDL equilibrium
  • d[I]/dt = change in IDL cholesterol concentration over time
  • ki = rate of conversion of IDL to LDL
  • [I] = concentration of IDL cholesterol
  • ai = cholesterol gradient attenuation coefficient of HDL and IDL equilibrium
  • dI = rate of IDL internalization using receptors
  • ΦHLR = particles of cholesterol taken by hepatic LDL receptors
  • ΦPLR = particles of cholesterol taken by peripheral LDL receptors
  • d[L]/dt = change in LDL cholesterol concentration over time
  • d5 = rate of LDL internalization without the use of receptors
  • [L] = concentration of LDL cholesterol
  • dL = rate of LDL internalized using LDL receptors
  • al = cholesterol gradient attenuation coefficient of HDL and LDL equilibrium
  • Model 9. Two Pool Model of Cholesterol Transport [36,49].
d m 1 d t = k m 1 + k 21 m 2 k 12 m 1 m o u t + m i n
d m 2 d t = k 21 m 2 + k 12 m 1 m t i s + m d i e t
m 1 * = k m d i e t + m i n m o u t m t i s
m 2 * = m d i e t 2 + m d i e t m i n m d i e t m o u t k k 12 2 m d i e t m t i s m i n m t i s + m o u t m t i s + m t i s 2 k 21 ( m d i e t + m i n m o u t m t i s )
m 2 * = m 1 * k k 12 + m i n m t i s m o u t m t i s m t i s 2 k k 12
C 2 * = C 1 * V 1 V 2 k k 12 + m i n m t i s m o u t m t i s m t i s 2 k k 12
  • dm1/dt = change in cholesterol amount in the liver over time
  • k = rate of cholesterol synthesis in the liver
  • k21 = rate of cholesterol moving from the bloodstream to the liver
  • m2 = amount of cholesterol in the bloodstream
  • k12 = rate of cholesterol moving from the liver to the bloodstream
  • m1 = amount of cholesterol in the liver
  • mout = amount of cholesterol used to make bile acids
  • min = amount of cholesterol received from intestines
  • dm2/dt = change in cholesterol amount in the bloodstream over time
  • mtis = amount of cholesterol used for reactions and entering peripheral muscle/tissue
  • mdiet = amount of cholesterol obtained from diet
  • m1* = steady state cholesterol amount in the liver
  • m2* = steady state cholesterol amount in the bloodstream
  • C2* = steady state concentration of cholesterol in the bloodstream
  • C1* = steady state concentration of cholesterol in the liver
  • V1 = volume of blood in the liver
  • V2 = volume of blood in the bloodstream
  • Model 10. Modeling Drug Delivery [39].
j i = D i p d c i d x
c i t = D i p 2 c i x 2
d M t d t = 4 π D i p K r e r i r e r i ( c i 2 c i 1 )
M t = A D c s ( 2 c 0 c s ) t
M t M = k t n
ε = x 2 λ π 4 D e f f ln [ x ] ln [ M ¯ n N A ( N 1 ) ρ 3 ]
d M d t = A δ L p σ c Δ π s
D e = λ θ
M d M d , = v d , e q + v d * 2 L ( 2 A t + B t )
  • ji = flux of drug
  • Dip = diffusion coefficient for drug through carrier
  • dci/dx = concentration gradient
  • ∂ci/∂t = change in concentration over time
  • dMt/dt = amount of drug released over time
  • K = partition coefficient of drug
  • re = external radius of spherical carrier
  • ri = internal radius of spherical carrier
  • ci2 = drug concentration inside carrier
  • ci2 = drug concentration outside of carrier
  • Mt = amount of drug released at any given time
  • A = surface area of carrier
  • cs = drug solubility in carrier
  • c0 = initial drug concentration in carrier
  • t = time
  • Mt/M = amount of drug released at given time over drug released at infinite time
  • k = structure/geometry constant
  • n = 1 for zero order and 0.5 for Fickian diffusion
  • ε = dimensionless parameter of erosion
  • <x> = diffusion distance of water
  • λ = rate of degradation
  • Deff = diffusivity of water
  • Mn = average molecular weight of polymer
  • NA = Avogadro’s number
  • N = degree of polymerization
  • ρ = density of polymer
  • A = cross sectional area of carrier
  • δ = thickness of carrier
  • Lp = coefficient of permeability
  • σ = coefficient of reflection
  • Δπs = pressure of water
  • De = Deborah number
  • λ = relaxation time
  • θ = diffusion time
  • vd,eq = equilibrium concentration of drug
  • vd = concentration of drug
  • L = half-thickness of carrier
  • A = constant
  • B = constant

References

  1. Jesch, E.D.; Carr, T.P. Food Ingredients That Inhibit Cholesterol Absorption. Prev. Nutr. Food Sci. 2017, 22, 67–80. [Google Scholar]
  2. Mouritsen, O.G.; Zuckermann, M.J. What’s so Special about Cholesterol? Lipids 2004, 39, 1101–1113. [Google Scholar] [CrossRef]
  3. Tabas, I. Cholesterol in Health and Disease. J. Clin. Investig. 2002, 110, 583–590. [Google Scholar] [CrossRef]
  4. Chimento, A.; Casaburi, I.; Avena, P.; Trotta, F.; De Luca, A.; Rago, V.; Pezzi, V.; Sirianni, R. Cholesterol and Its Metabolites in Tumor Growth: Therapeutic Potential of Statins in Cancer Treatment. Front. Endocrinol. 2019, 10, 807. [Google Scholar] [CrossRef] [Green Version]
  5. Schade, D.S.; Shey, L.; Eaton, R.P. Cholesterol Review: A Metabolically Important Molecule. Endocr. Pract. 2020, 26, 1514–1523. [Google Scholar] [CrossRef] [PubMed]
  6. Brown, A.J.; Sharpe, L.J. Cholesterol Synthesis. In Biochemistry of Lipids, Lipoproteins and Membranes; Elsevier: Amsterdam, The Netherlands, 2016; pp. 327–358. [Google Scholar]
  7. de Boer, J.F.; Kuipers, F.; Groen, A.K. Cholesterol Transport Revisited: A New Turbo Mechanism to Drive Cholesterol Excretion. Trends Endocrinol. Metab. 2018, 29, 123–133. [Google Scholar] [CrossRef] [PubMed]
  8. Page, I.H.; Allen, E.V.; Chamberlain, F.L.; Keys, A.; Stamler, J.; Stare, F.J. Dietary Fat and Its Relation to Heart Attacks and Strokes: Report by the Central Committee for Medical and Community Program of the American Heart Association. JAMA 1961, 175, 389–391. [Google Scholar]
  9. Virani, S.S.; Alonso, A.; Benjamin, E.J.; Bittencourt, M.S.; Callaway, C.W.; Carson, A.P.; Chamberlain, A.M.; Chang, A.R.; Cheng, S.; Delling, F.N.; et al. Heart Disease and Stroke Statistics—2020 Update: A Report From the American Heart Association. Circulation 2020, 141, E139–E596. [Google Scholar] [CrossRef] [PubMed]
  10. Centers for Disease Control and Prevention. High Cholesterol Facts. Available online: https://www.cdc.gov/cholesterol/facts.htm (accessed on 3 August 2021).
  11. Puglielli, L.; Tanzi, R.E.; Kovacs, D.M. Alzheimer’s Disease: The Cholesterol Connection. Nat. Neurosci. 2003, 6, 345–351. [Google Scholar] [CrossRef] [PubMed]
  12. Kuzu, O.F.; Noory, M.A.; Robertson, G.P. The Role of Cholesterol in Cancer. Cancer Res. 2016, 76, 2063–2070. [Google Scholar] [CrossRef] [PubMed] [Green Version]
  13. Yu, X.H.; Zhang, D.W.; Zheng, X.L.; Tang, C.K. Cholesterol Transport System: An Integrated Cholesterol Transport Model Involved in Atherosclerosis. Prog. Lipid Res. 2019, 73, 65–91. [Google Scholar] [CrossRef]
  14. Mc Auley, M.T.; Wilkinson, D.J.; Jones, J.J.L.; Kirkwood, T.B.L. A Whole-Body Mathematical Model of Cholesterol Metabolism and Its Age-Associated Dysregulation. BMC Syst. Biol. 2012, 6, 130. [Google Scholar] [CrossRef] [Green Version]
  15. Hurtado, P.J. Building New Models: Rethinking and Revising ODE Model Assumptions. In Foundations for Undergraduate Research in Mathematics; Callender Highlander, H., Capaldi, A., Diaz Eaton, C., Eds.; Springer International Publishing: Cham, Switzerland, 2020; pp. 1–86. [Google Scholar]
  16. Kuipers, B. Qualitative Reasoning: Modeling and Simulation with Incomplete Knowledge. Automatica 1989, 25, 571–585. [Google Scholar] [CrossRef]
  17. Parton, A.; McGilligan, V.; O’Kane, M.; Baldrick, F.R.; Watterson, S. Computational Modelling of Atherosclerosis. Brief. Bioinform. 2016, 17, 562–575. [Google Scholar] [CrossRef] [PubMed]
  18. Barnaba, C.; Rodríguez-Estrada, M.T.; Lercker, G.; García, H.S.; Medina-Meza, I.G. Cholesterol Photo-Oxidation: A Chemical Reaction Network for Kinetic Modeling. Steroids 2016, 116, 52–59. [Google Scholar] [CrossRef] [PubMed]
  19. Weinrich, S.; Koch, S.; Bonk, F.; Popp, D.; Benndorf, D.; Klamt, S.; Centler, F. Augmenting Biogas Process Modeling by Resolving Intracellular Metabolic Activity. Front. Microbiol. 2019, 10, 1095. [Google Scholar] [CrossRef]
  20. Wang, E.; Casciano, C.N.; Clement, R.P.; Johnson, W. HMG-CoA Reductase Inhibitors (Statins) Characterized as Direct Inhibitors of P-Glycoprotein. Pharm. Res. 2001, 18, 800–806. [Google Scholar] [CrossRef] [PubMed]
  21. Young, S.G.; Fong, L.G. Lowering Plasma Cholesterol by Raising LDL—Revisited. N. Engl. J. Med. 2012, 366, 1154. [Google Scholar] [CrossRef] [Green Version]
  22. Sy, J.; Barahona, M. A Model of Cholesterol Metabolism and Transport. Bachelor’s Thesis, Imperial College, London, UK, 2008. [Google Scholar]
  23. Cartocci, V.; Servadio, M.; Trezza, V.; Pallottini, V. Can Cholesterol Metabolism Modulation Affect Brain Function and Behavior? J. Cell. Physiol. 2017, 232, 281–286. [Google Scholar] [CrossRef]
  24. Jin, U.; Park, S.J.; Park, S.M. Cholesterol Metabolism in the Brain and Its Association with Parkinson’s Disease. Exp. Neurobiol. 2019, 28, 554. [Google Scholar] [CrossRef] [Green Version]
  25. Huang, B.; Song, B.; Xu, C. Cholesterol Metabolism in Cancer: Mechanisms and Therapeutic Opportunities. Nat. Metab. 2020, 2, 132–141. [Google Scholar] [CrossRef] [PubMed] [Green Version]
  26. Chambers, K.F.; Day, P.E.; Aboufarrag, H.T.; Kroon, P.A. Polyphenol Effects on Cholesterol Metabolism via Bile Acid Biosynthesis, CYP7A1: A Review. Nutrition 2019, 11, 2588. [Google Scholar] [CrossRef] [PubMed] [Green Version]
  27. Morgan, A.E.; Mooney, K.M.; Wilkinson, S.J.; Pickles, N.A.; Mc Auley, M.T. Cholesterol Metabolism: A Review of How Ageing Disrupts the Biological Mechanisms Responsible for Its Regulation. Ageing Res. Rev. 2016, 27, 108–124. [Google Scholar] [CrossRef]
  28. Millar, J.S.; Cuchel, M. Cholesterol Metabolism in Humans: A Review of Methods and Comparison of Results. Curr. Opin. Lipidol. 2018, 29, 1–9. [Google Scholar] [CrossRef]
  29. Avgerinos, N.A.; Neofytou, P. Mathematical Modelling and Simulation of Atherosclerosis Formation and Progress: A Review. Ann. Biomed. Eng. 2019, 47, 1764–1785. [Google Scholar] [CrossRef]
  30. Ren, L.; Yi, J.; Li, W.; Zheng, X.; Liu, J.; Wang, J.; Du, G. Apolipoproteins and Cancer. Cancer Med. 2019, 8, 7032–7043. [Google Scholar] [CrossRef] [Green Version]
  31. Morgan, A.E.; Auley, M.T.M. Cholesterol Homeostasis: An In Silico Investigation into How Aging Disrupts Its Key Hepatic Regulatory Mechanisms. Biology 2020, 9, 314. [Google Scholar] [CrossRef]
  32. Morgan, A.E.; Mooney, K.M.; Wilkinson, S.J.; Pickles, N.A.; Mc Auley, M.T. Mathematically Modelling the Dynamics of Cholesterol Metabolism and Ageing. Biosystems 2016, 145, 19–32. [Google Scholar]
  33. Sokolov, V.; Helmlinger, G.; Nilsson, C.; Zhudenkov, K.; Skrtic, S.; Hamrén, B.; Peskov, K.; Hurt-Camejo, E.; Jansson-Löfmark, R. Comparative Quantitative Systems Pharmacology Modeling of Anti-PCSK9 Therapeutic Modalities in Hypercholesterolemia. J. Lipid Res. 2019, 60, 1610–1621. [Google Scholar] [CrossRef] [PubMed] [Green Version]
  34. Toroghi, M.K.; Cluett, W.R.; Mahadevan, R. A Multi-Scale Model for Low-Density Lipoprotein Cholesterol (LDL-C) Regulation in the Human Body: Application to Quantitative Systems Pharmacology. Comput. Chem. Eng. 2019, 130, 106507. [Google Scholar] [CrossRef]
  35. Bhattacharya, B.S.; Sweby, P.K.; Minihane, A.M.; Jackson, K.G.; Tindall, M.J. A Mathematical Model of the Sterol Regulatory Element Binding Protein 2 Cholesterol Biosynthesis Pathway. J. Theor. Biol. 2014, 349, 150–162. [Google Scholar] [CrossRef]
  36. Hrydziuszko, O.; Balbus, J.; Zulpo, M.; Wrona, A.; Kubica, K. Mathematical Analyses of Two-Compartment Model of Human Cholesterol Circulatory Transport in Application to High Blood Cholesterol Prevention, Diagnosis and Treatment. Theor. Comput. Sci. 2015, 608, 98–107. [Google Scholar] [CrossRef]
  37. Kervizic, G.; Corcos, L. Dynamical Modeling of the Cholesterol Regulatory Pathway with Boolean Networks. BMC Syst. Biol. 2008, 2, 99. [Google Scholar] [CrossRef] [Green Version]
  38. Belič, A.; Ačimovič, J.; Naik, A.; Goličnik, M. Analysis of the Steady-State Relations and Control-Algorithm Characterisation in a Mathematical Model of Cholesterol Biosynthesis. Simul. Model. Pract. Theory 2013, 33, 18–27. [Google Scholar] [CrossRef]
  39. Peppas, N.A.; Narasimhan, B. Mathematical Models in Drug Delivery: How Modeling Has Shaped the Way We Design New Drug Delivery Systems. J. Control. Release 2014, 190, 75–81. [Google Scholar] [CrossRef]
  40. Wang, H.H.; Garruti, G.; Liu, M.; Portincasa, P.; Wang, D.Q.H. Cholesterol and Lipoprotein Metabolism and Atherosclerosis: Recent Advances in Reverse Cholesterol Transport. Ann. Hepatol. 2017, 16, S27–S42. [Google Scholar] [CrossRef] [PubMed]
  41. Huang, L.-H.; Elvington, A.; Randolph, G.J. The Role of the Lymphatic System in Cholesterol Transport. Front. Pharmacol. 2015, 6, 182. [Google Scholar] [CrossRef] [PubMed] [Green Version]
  42. Janapala, U.S.; Reddivari, A.K.R. Low Cholesterol Diet. Med. Comput. J. 2021, 1, 21–23. [Google Scholar]
  43. Gray, C.; Stern, C. Treatment of Blood Cholesterol to Reduce Atheroscelerotic Cardiovascular Risk in Adults. J. Contemp. Pharm. Pract. 2019, 66, 54–63. [Google Scholar] [CrossRef]
  44. Mayes, P.A.; Bender, D.A. Overview of Metabolism. In Harper’s Illustrated Biochemistry; Murray, R.K., Granner, D.K., Davis, J.C., Mayes, P.A., Rodwell, V.W., Eds.; McGraw-Hill Companies: New York, NY, USA, 2003; pp. 123–126. [Google Scholar]
  45. von Eckardstein, A. LDL Contributes to Reverse Cholesterol Transport. Circ. Res. 2020, 793–795. [Google Scholar] [CrossRef]
  46. Lent-Schochet, D.; Jialal, I. Biochemistry, Lipoprotein Metabolism. StatPearls 2021. Available online: https://www.ncbi.nlm.nih.gov/books/NBK553193/ (accessed on 5 August 2021).
  47. Holmes, M.V.; Ala-Korpela, M. What Is ‘LDL Cholesterol’? Nat. Rev. Cardiol. 2019, 16, 197–198. [Google Scholar] [CrossRef]
  48. Pool, F.; Sweby, P.K.; Tindall, M.J. An Integrated Mathematical Model of Cellular Cholesterol Biosynthesis and Lipoprotein Metabolism. Processes 2018, 6, 134. [Google Scholar] [CrossRef] [Green Version]
  49. Hrydziuszko, O.; Wrona, A.; Balbus, J.; Kubica, K. Mathematical Two-Compartment Model of Human Cholesterol Transport in Application to High Blood Cholesterol Diagnosis and Treatment. Electron. Notes Theor. Comput. Sci. 2014, 306, 19–30. [Google Scholar] [CrossRef] [Green Version]
  50. Gluchowski, N.L.; Becuwe, M.; Walther, T.C.; Farese, R.V. Lipid Droplets and Liver Disease: From Basic Biology to Clinical Implications. Nat. Rev. Gastroenterol. Hepatol. 2017, 14, 343–355. [Google Scholar] [CrossRef]
  51. Horton, J.D.; Shimomura, I.; Brown, M.S.; Hammer, R.E.; Goldstein, J.L.; Shimano, H. Activation of Cholesterol Synthesis in Preference to Fatty Acid Synthesis in Liver and Adipose Tissue of Transgenic Mice Overproducing Sterol Regulatory Element-Binding Protein-2. J. Clin. Investig. 1998, 101, 2331–2339. [Google Scholar] [CrossRef]
  52. Wu, N.; Sarna, L.K.; Hwang, S.Y.; Zhu, Q.; Wang, P.; Siow, Y.L.; Karmin, O. Activation of 3-Hydroxy-3-Methylglutaryl Coenzyme A (HMG-CoA) Reductase during High Fat Diet Feeding. Biochim. Biophys. Acta-Mol. Basis Dis. 2013, 1832, 1560–1568. [Google Scholar] [CrossRef] [Green Version]
  53. Luo, J.; Yang, H.; Song, B.-L. Mechanisms and Regulation of Cholesterol Homeostasis. Nat. Rev. Mol. Cell Biol. 2019, 21, 225–245. [Google Scholar] [CrossRef]
  54. Turley, S.D.; Dietschy, J.M. The Intestinal Absorption of Biliary and Dietary Cholesterol as a Drug Target for Lowering the Plasma Cholesterol Level. Prev. Cardiol. 2003, 6, 29–33. [Google Scholar] [CrossRef]
  55. Petroglou, D.; Kanellos, I.; Savopoulos, C.; Kaiafa, G.; Chrysochoou, A.; Skantzis, P.; Daios, S.; Hatzitolios, A.I.; Giannoglou, G. The LDL-Receptor and Its Molecular Properties: From Theory to Novel Biochemical and Pharmacological Approaches in Reducing LDL-Cholesterol. Curr. Med. Chem. 2018, 27, 317–333. [Google Scholar] [CrossRef]
  56. Jakulj, L.; van Dijk, T.H.; de Boer, J.F.; Kootte, R.S.; Schonewille, M.; Paalvast, Y.; Boer, T.; Bloks, V.W.; Boverhof, R.; Nieuwdorp, M.; et al. Transintestinal Cholesterol Transport Is Active in Mice and Humans and Controls Ezetimibe-Induced Fecal Neutral Sterol Excretion. Cell Metab. 2016, 24, 783–794. [Google Scholar] [CrossRef] [Green Version]
  57. Bhatt, A.; Rohatgi, A. HDL Cholesterol Efflux Capacity: Cardiovascular Risk Factor and Potential Therapeutic Target. Curr. Atheroscler. Rep. 2016, 18, 2. [Google Scholar] [CrossRef]
  58. Chan, D.C.; Hoang, A.; Barrett, P.H.R.; Wong, A.T.Y.; Nestel, P.J.; Sviridov, D.; Watts, G.F. Apolipoprotein B-100 and ApoA-II Kinetics as Determinants of Cellular Cholesterol Efflux. J. Clin. Endocrinol. Metab. 2012, 97, E1658–E1666. [Google Scholar] [CrossRef] [Green Version]
  59. Sozen, E.; Ozer, N.K. Impact of High Cholesterol and Endoplasmic Reticulum Stress on Metabolic Diseases: An Updated Mini-Review. Redox Biol. 2017, 12, 456–461. [Google Scholar] [CrossRef]
  60. Brown, M.S.; Radhakrishnan, A.; Goldstein, J.L. Retrospective on Cholesterol Homeostasis: The Central Role of Scap. Annu. Rev. Biochem. 2018, 87, 783–807. [Google Scholar] [CrossRef] [Green Version]
  61. Tan, J.M.E.; Cook, E.C.L.; van den Berg, M.; Scheij, S.; Zelcer, N.; Loregger, A. Differential Use of E2 Ubiquitin Conjugating Enzymes for Regulated Degradation of the Rate-Limiting Enzymes HMGCR and SQLE in Cholesterol Biosynthesis. Atherosclerosis 2019, 281, 137–142. [Google Scholar] [CrossRef] [Green Version]
  62. Lu, X.-Y.; Shi, X.-J.; Hu, A.; Wang, J.-Q.; Ding, Y.; Jiang, W.; Sun, M.; Zhao, X.; Luo, J.; Qi, W.; et al. Feeding Induces Cholesterol Biosynthesis via the MTORC1–USP20–HMGCR Axis. Nature 2020, 588, 479–484. [Google Scholar] [CrossRef]
  63. Li, Q.; Zhang, H.; Zou, J.; Feng, X.; Feng, D. Bisphenol A Induces Cholesterol Biosynthesis in HepG2 Cells via SREBP-2/HMGCR Signaling Pathway. J. Toxicol. Sci. 2019, 44, 481–491. [Google Scholar] [CrossRef] [Green Version]
  64. Huang, J.; Chen, S.; Cai, D.; Bian, D.; Wang, F. Long Noncoding RNA LncARSR Promotes Hepatic Cholesterol Biosynthesis via Modulating Akt/SREBP-2/HMGCR Pathway. Life Sci. 2018, 203, 48–53. [Google Scholar] [CrossRef]
  65. Ma, S.; Sun, W.; Gao, L.; Liu, S. Therapeutic Targets of Hypercholesterolemia: HMGCR and LDLR. Diabetes Metab. Syndr. Obes. Targets Ther. 2019, 12, 1543–1553. [Google Scholar] [CrossRef] [Green Version]
  66. Yu, Y.; Meng, M.; Feng, J.E. Observability of Boolean Networks via Matrix Equations. Automatica 2020, 111, 108621. [Google Scholar] [CrossRef]
  67. Brown, A.J.; Coates, H.W.; Sharpe, L.J. Cholesterol Synthesis. In Biochemistry of Lipids, Lipoproteins and Membranes; Ridgway, N.D., McLeod, R.S., Eds.; Elsevier: Amsterdam, The Netherlands, 2021; pp. 317–355. [Google Scholar]
  68. Eberlé, D.; Hegarty, B.; Bossard, P.; Ferré, P.; Foufelle, F. SREBP Transcription Factors: Master Regulators of Lipid Homeostasis. Biochimie 2004, 86, 839–848. [Google Scholar] [CrossRef]
  69. Bengoechea-Alonso, M.T.; Ericsson, J. SREBP in Signal Transduction: Cholesterol Metabolism and Beyond. Curr. Opin. Cell Biol. 2007, 19, 215–222. [Google Scholar] [CrossRef]
  70. Shefer, S.; Salen, G.; Batta, A.K.; Honda, A.; Tint, G.S.; Irons, M.; Elias, E.R.; Chen, T.C.; Holick, M.F. Markedly Inhibited 7-Dehydrocholesterol-Delta 7-Reductase Activity in Liver Microsomes from Smith-Lemli-Opitz Homozygotes. J. Clin. Investig. 1995, 96, 1779–1785. [Google Scholar] [CrossRef]
  71. Chiang, J.Y.L.; Li, T. Regulation of Bile Acid and Cholesterol Metabolism by PPARs. PPAR Res. 2009, 2009, 501739. [Google Scholar]
  72. Chiang, J.Y.L. Bile Acid Metabolism and Signaling in Liver Disease and Therapy. Liver Res. 2017, 1, 3–9. [Google Scholar] [CrossRef]
  73. Chiang, J.Y.L. Bile Acid Metabolism and Signaling. Compr. Physiol. 2013, 3, 1191. [Google Scholar]
  74. Xu, H.; Zhou, S.; Tang, Q.; Xia, H.; Bi, F. Cholesterol Metabolism: New Functions and Therapeutic Approaches in Cancer. Biochim. Biophys. Acta-Rev. Cancer 2020, 1874, 188394. [Google Scholar] [CrossRef]
  75. Ko, C.-W.; Qu, J.; Black, D.D.; Tso, P. Regulation of Intestinal Lipid Metabolism: Current Concepts and Relevance to Disease. Nat. Rev. Gastroenterol. Hepatol. 2020, 17, 169–183. [Google Scholar] [CrossRef]
  76. Iqbal, J.; Hussain, M.M. Intestinal Lipid Absorption. Am. J. Physiol. Endocrinol. Metab. 2009, 296, 1183–1194. [Google Scholar] [CrossRef] [Green Version]
  77. Mu, H.; Høy, C.E. The Digestion of Dietary Triacylglycerols. Prog. Lipid Res. 2004, 43, 105–133. [Google Scholar] [CrossRef]
  78. Trajkovska, K.T.; Topuzovska, S. High-Density Lipoprotein Metabolism and Reverse Cholesterol Transport: Strategies for Raising HDL Cholesterol. Anatol. J. Cardiol. 2017, 18, 149. [Google Scholar] [CrossRef]
  79. Jacobo-Albavera, L.; Domínguez-Pérez, M.; Medina-Leyte, D.J.; González-Garrido, A.; Villarreal-Molina, T. The Role of the ATP-Binding Cassette A1 (ABCA1) in Human Disease. Int. J. Mol. Sci. 2021, 22, 1593. [Google Scholar] [CrossRef]
  80. Wang, D.Q.-H.; Portincasa, P.; Tso, P. Transintestinal Cholesterol Excretion: A Secondary, Nonbiliary Pathway Contributing to Reverse Cholesterol Transport. Hepatology 2017, 66, 1337–1340. [Google Scholar] [CrossRef] [Green Version]
  81. Heeren, J.; Scheja, L. Metabolic-Associated Fatty Liver Disease and Lipoprotein Metabolism. Mol. Metab. 2021, 50, 101238. [Google Scholar] [CrossRef]
  82. Mittendorfer, B.; Patterson, B.W.; Klein, S. Effect of Sex and Obesity on Basal VLDL-Triacylglycerol Kinetics. Am. J. Clin. Nutr. 2003, 77, 573–579. [Google Scholar] [CrossRef]
  83. Bruinstroop, E.; Pei, L.; Ackermans, M.T.; Foppen, E.; Borgers, A.J.; Kwakkel, J.; Alkemade, A.; Fliers, E.; Kalsbeek, A. Hypothalamic Neuropeptide Y (NPY) Controls Hepatic VLDL-Triglyceride Secretion in Rats via the Sympathetic Nervous System. Diabetes 2012, 61, 1043–1050. [Google Scholar] [CrossRef] [Green Version]
  84. Lee, J.H.; Yeo, Y. Controlled Drug Release from Pharmaceutical Nanocarriers. Chem. Eng. Sci. 2015, 125, 75–84. [Google Scholar] [CrossRef] [Green Version]
  85. Liu, X.; Schnell, S.K.; Simon, J.-M.; Bedeaux, D.; Kjelstrup, S.; Bardow, A.; Vlugt, T.J.H. Fick Diffusion Coefficients of Liquid Mixtures Directly Obtained From Equilibrium Molecular Dynamics. J. Phys. Chem. B 2011, 115, 12921–12929. [Google Scholar] [CrossRef]
  86. Andrade, C.; Climent, M.A.; de Vera, G. Procedure for Calculating the Chloride Diffusion Coefficient and Surface Concentration from a Profile Having a Maximum beyond the Concrete Surface. Mater. Struct. 2015, 48, 863–869. [Google Scholar] [CrossRef]
  87. Maroni, A.; Zema, L.; Cerea, M.; Foppoli, A.; Palugan, L.; Gazzaniga, A. Erodible Drug Delivery Systems for Time-Controlled Release into the Gastrointestinal Tract. J. Drug Deliv. Sci. Technol. 2016, 32, 229–235. [Google Scholar] [CrossRef]
  88. Iñiguez-Franco, F.; Auras, R.; Ahmed, J.; Selke, S.; Rubino, M.; Dolan, K.; Soto-Valdez, H. Control of Hydrolytic Degradation of Poly(Lactic Acid) by Incorporation of Chain Extender: From Bulk to Surface Erosion. Polym. Test. 2018, 67, 190–196. [Google Scholar] [CrossRef]
  89. Kim, M.; Cha, C. Modulation of Functional Pendant Chains within Poly(ethylene glycol) Hydrogels for Refined Control of Protein Release. Sci. Rep. 2018, 8, 4315. [Google Scholar] [CrossRef] [Green Version]
  90. Laracuente, M.L.; Yu, M.H.; McHugh, K.J. Zero-Order Drug Delivery: State of the Art and Future Prospects. J. Control. Release 2020, 327, 834–856. [Google Scholar] [CrossRef]
  91. Carbinatto, F.M.; de Castro, A.D.; Evangelista, R.C.; Cury, B.S.F. Insights into the Swelling Process and Drug Release Mechanisms from Cross-Linked Pectin/High Amylose Starch Matrices. Asian J. Pharm. Sci. 2014, 9, 27–34. [Google Scholar] [CrossRef] [Green Version]
  92. Strachota, B.; Strachota, A.; Šlouf, M.; Brus, J.; Cimrová, V. Monolithic Intercalated PNIPAm/Starch Hydrogels with Very Fast and Extensive One-Way Volume and Swelling Responses to Temperature and PH: Prospective Actuators and Drug Release Systems. Soft Matter 2019, 15, 752–769. [Google Scholar] [CrossRef]
  93. Brazel, C.S.; Peppas, N.A. Modeling of Drug Release from Swellable Polymers. Eur. J. Pharm. Biopharm. 2000, 49, 47–58. [Google Scholar] [CrossRef]
  94. Salehi, A.; Zhao, J.; Cabelka, T.D.; Larson, R.G. A Unified Multicomponent Stress-Diffusion Model of Drug Release from Non-Biodegradable Polymeric Matrix Tablets. J. Control. Release 2016, 224, 43–58. [Google Scholar] [CrossRef]
  95. Ferrero, C.; Massuelle, D.; Doelker, E. Towards Elucidation of the Drug Release Mechanism from Compressed Hydrophilic Matrices Made of Cellulose Ethers. II. Evaluation of a Possible Swelling-Controlled Drug Release Mechanism Using Dimensionless Analysis. J. Control. Release 2010, 141, 223–233. [Google Scholar] [CrossRef]
  96. Liu, Z.; Wang, L.; Bao, C.; Li, X.; Cao, L.; Dai, K.; Zhu, L. Cross-Linked PEG via Degradable Phosphate Ester Bond: Synthesis, Water-Swelling, and Application as Drug Carrier. Biomacromolecules 2011, 12, 2389–2395. [Google Scholar] [CrossRef]
  97. Rahilly-Tierney, C.R.; Spiro, A.; Vokonas, P.; Gaziano, J.M. Relation Between High-Density Lipoprotein Cholesterol and Survival to Age 85 Years in Men (from the VA Normative Aging Study). Am. J. Cardiol. 2011, 107, 1173–1177. [Google Scholar] [CrossRef]
  98. Sahebkar, A. Effects of Resveratrol Supplementation on Plasma Lipids: A Systematic Review and Meta-Analysis of Randomized Controlled Trials. Nutr. Rev. 2013, 71, 822–835. [Google Scholar] [CrossRef]
Figure 1. Diagram of cholesterol pathways. Movement of cholesterol is indicated by solid arrows. Dashed arrows indicate movement of other substances. Diagram is labeled to indicate where each model applies. Models 1–9 are listed in Table 1.
Processes 10 00155 g001
Figure 2. SREBP regulation model (Model 1 in Table 1) of cholesterol biosynthesis. (a) The promoting factors effect on transcription and translation. (b) The binding of cholesterol to the SREBP-SCAP complex. (c) SREBP regulation. As the concentration of cholesterol increases, SREBP is locked in the ER. When cholesterol concentrations are lower, the SREBP transcription factor can enter the nucleus and increase the transcription rate. G: HMG-CoA reductase gene; S: SREBP molecule; m: HMG-CoA reductase mRNA; HMGR: HMG-CoA reductase; IC: intracellular cholesterol; x: amount of SREBP required to bind to HMG-CoA reductase gene; y: amount of cholesterol required to bind to SREBP-SCAP complex. Equations, along with parameters, for SREBP regulation model can be found in (A1) to (A7) in Appendix A [35].
Processes 10 00155 g002aProcesses 10 00155 g002b
Figure 3. Model for steady state cholesterol biosynthesis (Model 2): (a) the substrate binds to the enzyme to form a complex before the enzyme catalyzes the reaction of substrate to product; (b) simplified diagram of SREBP regulation. A lack of cholesterol makes SREBP active, allowing it to aid in transcription. The active SREBP influencing the transcription is the control signal, while the cholesterol causing the SREBP to become inactive (i.e., Pi) is the control signal error. Equations of Model 2, along with mentioned parameters, are shown (A8) through (A15) in Appendix A [38].
Processes 10 00155 g003
Figure 4. Bile acid synthesis model (Model 6). The rate limiting enzyme for the conversion of cholesterol to bile acids is C7H. The production of C7H is regulated by recycled bile acids. Bile acids can either be recycled (~95%) or expelled from the body (~5%). Equations of Model 6 are shown in (A38) through (A44) in Appendix A [22,26].
Processes 10 00155 g004
Figure 5. Lipoprotein transportation model (Model 7). Regular movement of cholesterol is denoted by a solid line while reverse cholesterol transport is shown as a dashed line. In regular transport, VLDL leaves the liver and becomes IDL which then becomes LDL. IDL and LDL can enter cells. HDL can collect and distribute cholesterol among the lipoproteins, cells, and the liver. Reverse transport of IDL or LDL back to the liver is not shown in this figure. Equations of Model 7 are shown in (A45) through (A50) in Appendix A [22].
Processes 10 00155 g005
Figure 6. Cholesterol blood plasma model (Model 8). VLDL leaves the liver and is converted to LDL and then IDL. LDL and IDL enter both liver and peripheral cells as well as exchange cholesterol with HDL using CETP. HDL takes cholesterol from peripheral cells and transfers cholesterol to liver cells. The equations of Model 8 are shown in (A51) through (A53) in Appendix A [22].
Processes 10 00155 g006
Figure 7. Two-pool model of cholesterol transport (Model 9). Cholesterol can be sent to the liver from intestine. The liver also produces its own cholesterol and sends cholesterol out in bile. The bloodstream can take dietary cholesterol and expel cholesterol to peripheral cells. The liver and bloodstream can exchange cholesterol between each other. The equations of Model 9 are shown in (A54) through (A59) in Appendix A [49].
Processes 10 00155 g007
Figure 8. Cumulative figure of all important processes with parameters. In hepatic cell, intracellular cholesterol can be synthesized or taken from chylomicrons, HDL, IDL, or LDL. Intracellular cholesterol can leave in bile acids or VLDL or can be given to HDL. In peripheral cell, intracellular cholesterol can be synthesized or taken from LDL or IDL. Intracellular cholesterol in peripheral cells can also be lost to HDL. The blood stream system is involved in the cholesterol transportation. Intestine has important role in both cholesterol uptake and bile salt excretion.
Processes 10 00155 g008
Table 1. The models of cholesterol synthesis and metabolisms in liver as well as their type of model (Model numbers are the same as shown in Figure 1).
Model NumberModelInputsOutputsKnown Parameters
1SREBP Regulation [35]Concentration of cholesterol, concentration of SREBPConcentration of HMG-CoA reductase mRNA over time, concentration of HMG-CoA reductase over time, concentration of cholesterol over time, steady state concentration of cholesterolBinding rates, rates of formation, rates of degradation, required molecules for successful binding
2Steady State Cholesterol Biosynthesis [38]Initial concentrations of enzyme and substrateChanges in substrate, enzyme, complex, and product over time, normalized steady state enzyme and substrate concentration, control signalIn and out fluxes of enzyme and substrate, reaction and binding rates, frequency
3De Novo Cholesterol Biosynthesis [22]Initial intracellular cholesterol and HMG-CoA concentrationsChange in HMG-CoA reductase and intracellular cholesterol concentrations over time, steady state mRNA and HMG-CoA reductase concentrationsRates of transcription, translation, conversion, and degradation, other constants
4Cellular cholesterol biosynthesis and lipoprotein metabolism [48]Initial cholesterol level VLDL, LDL levels, VLDL, LDL that bound to receptors, and transcription rate of cholesterol receptorsRates of transcription, translation, binding affinity, dissociation rate, rate of internalization, rate of cholesterol conversion, rate of receptor recycling
5Boolean Modeling of Cholesterol Biosynthesis Regulation [37]Acetoacetyl-CoA, acetyl-CoA, HMG-CoA synthase, desmosterol, 7-dehydrocholesterol, HMG-CoA reductase mRNAHMG-CoA, HMG-CoA reductase, CholesterolNone
6Bile Acid Biosynthesis [22]Initial C7H, intracellular cholesterol, bile acid, and returned bile acid concentrationsChange in intracellular cholesterol, C7H, and bile acids over time, steady state recycled bile acid and C7H concentrationsRates of transcription, conversion, and degradation, other constants
7Lipoprotein transportation and metabolism [22]Inputs from lipoprotein metabolism, De Novo cholesterol biosynthesis, and bile acid biosynthesis.
Initial lipoprotein cholesterol concentrations, amount of cholesterol particles taken by LDL receptors
Change in intracellular cholesterol, bile acids, and LDL receptors over time in liver cells, change in intracellular cholesterol and LDL receptors over time in peripheral cells.
Change in VLDL, IDL, LDL, HDL, receptor, and intracellular cholesterol concentrations over time
Parameters from lipoprotein metabolism, De Novo cholesterol biosynthesis, and bile acid biosynthesis.
Rates of transport, conversion, receptor reuse and internalization, attenuation coefficients, cholesterol fractions
8Blood Plasma Model [22]Initial concentrations of HDL, IDL, LDL, and VLDL cholesterol, particles of cholesterol taken by liver and peripheral cell LDL receptorsChange in VLDL, IDL, LDL, and HDL cholesterol over timeRates of cholesterol transfer, rates of cholesterol internalization, attenuation coefficients
9Two Pool Model of Cholesterol Transport [36,49]Initial cholesterol concentrations in each pool, initial cholesterol amount in each pool, volume of blood in each poolChange in cholesterol amount in each pool, steady state cholesterol amount in each pool, steady state cholesterol concentration in each poolRates of cholesterol transfer, rate of cholesterol synthesis, amounts of cholesterol in each pool, volume of blood in each pool, amount of cholesterol transferred from intestines, to bile, and to peripheral cells
10Modeling Drug Delivery [39]Dimensions of drug carrier, diffusion coefficients, initial concentrations and solubility, time Drug release rates, cumulative amount of drug released, erosion coefficientEquation coefficients and rates
Publisher’s Note: MDPI stays neutral with regard to jurisdictional claims in published maps and institutional affiliations.

