
Bitcoin as an Investment and Hedge Alternative. A DCC MGARCH Model Analysis


Abstract
:1. Introduction
2. Literature Review
2.1. Proto-Money
2.2. Bitcoin
2.3. Adoption History
2.4. Austrian Economics
2.5. Keynesian Economics
2.6. Electricity Usage and Scaling
2.7. Bitcoin and Traditional Assets as a Hedge Tool
3. COVID19 and the Future
3.1. Stores of Value
3.2. Debt, Modern Monetary Theory and Bitcoin
3.3. United States Dollar (USD), Gold and the Future
4. Data and Methodology
4.1. Data
4.2. Models Autoregressive Conditional Heteroskedasticity (ARCH) and Generalized Autoregressive Conditional Heteroskedasticity (GARCH)
4.3. Model Used: Dynamic Conditional Correlation (DCC)-GARCH and r
- n × 1 vector log returns of n assets at time t.
- = n × 1 vector of mean corrected returns of n assets at time t, i.e., E [] = 0.
- = n × 1 vector of the expected value of the conditional .
- n × n matrix of conditional variances of at time t.
- any n × n matrix at time t such that is the conditional variance matrix of
- may be obtained by a Cholesky factorization of .
- = n × n diagonal matrix of conditional standard deviations of at time t.
- = n × n conditional correlation matrix of at time t.
- = n × 1 vector of iid errors such that E [] = 0 and E [] = I.
- (1)
- has to be positive definite as it is a covariance matrix. To ensure will be a positive definite, has to be positive definite ( is positive definite since all the diagonal elements are positive).
- (2)
- All the elements in the correlation matrix have to be equal or less than 1 by definition.
5. Expectations
Returns, Volatility, Correlation
6. Results
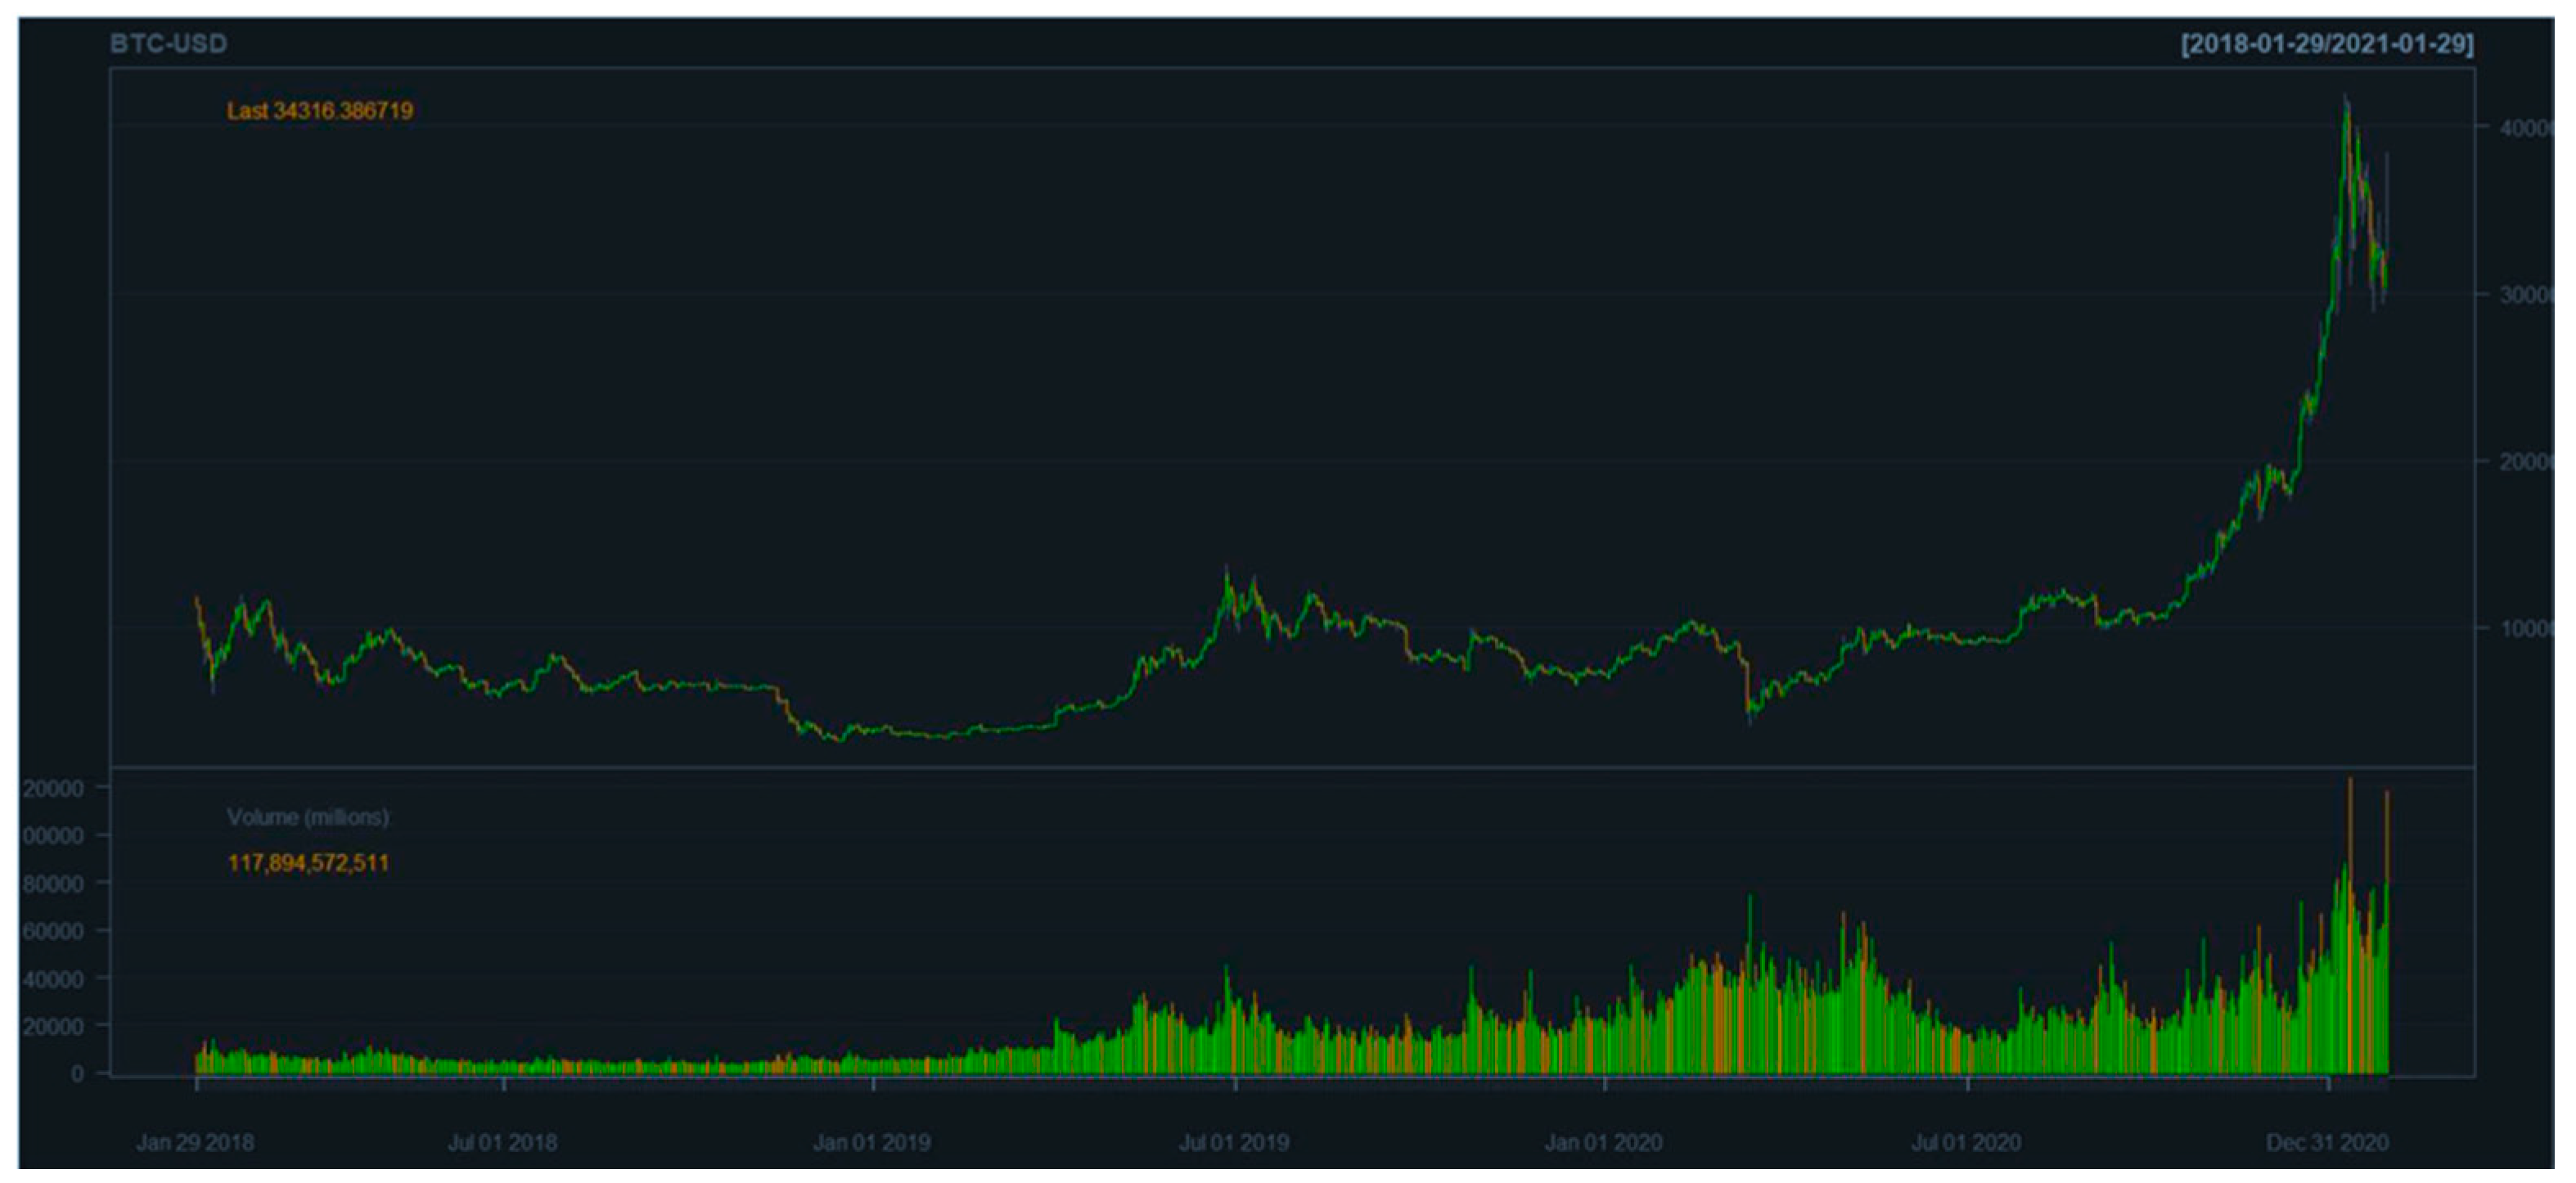
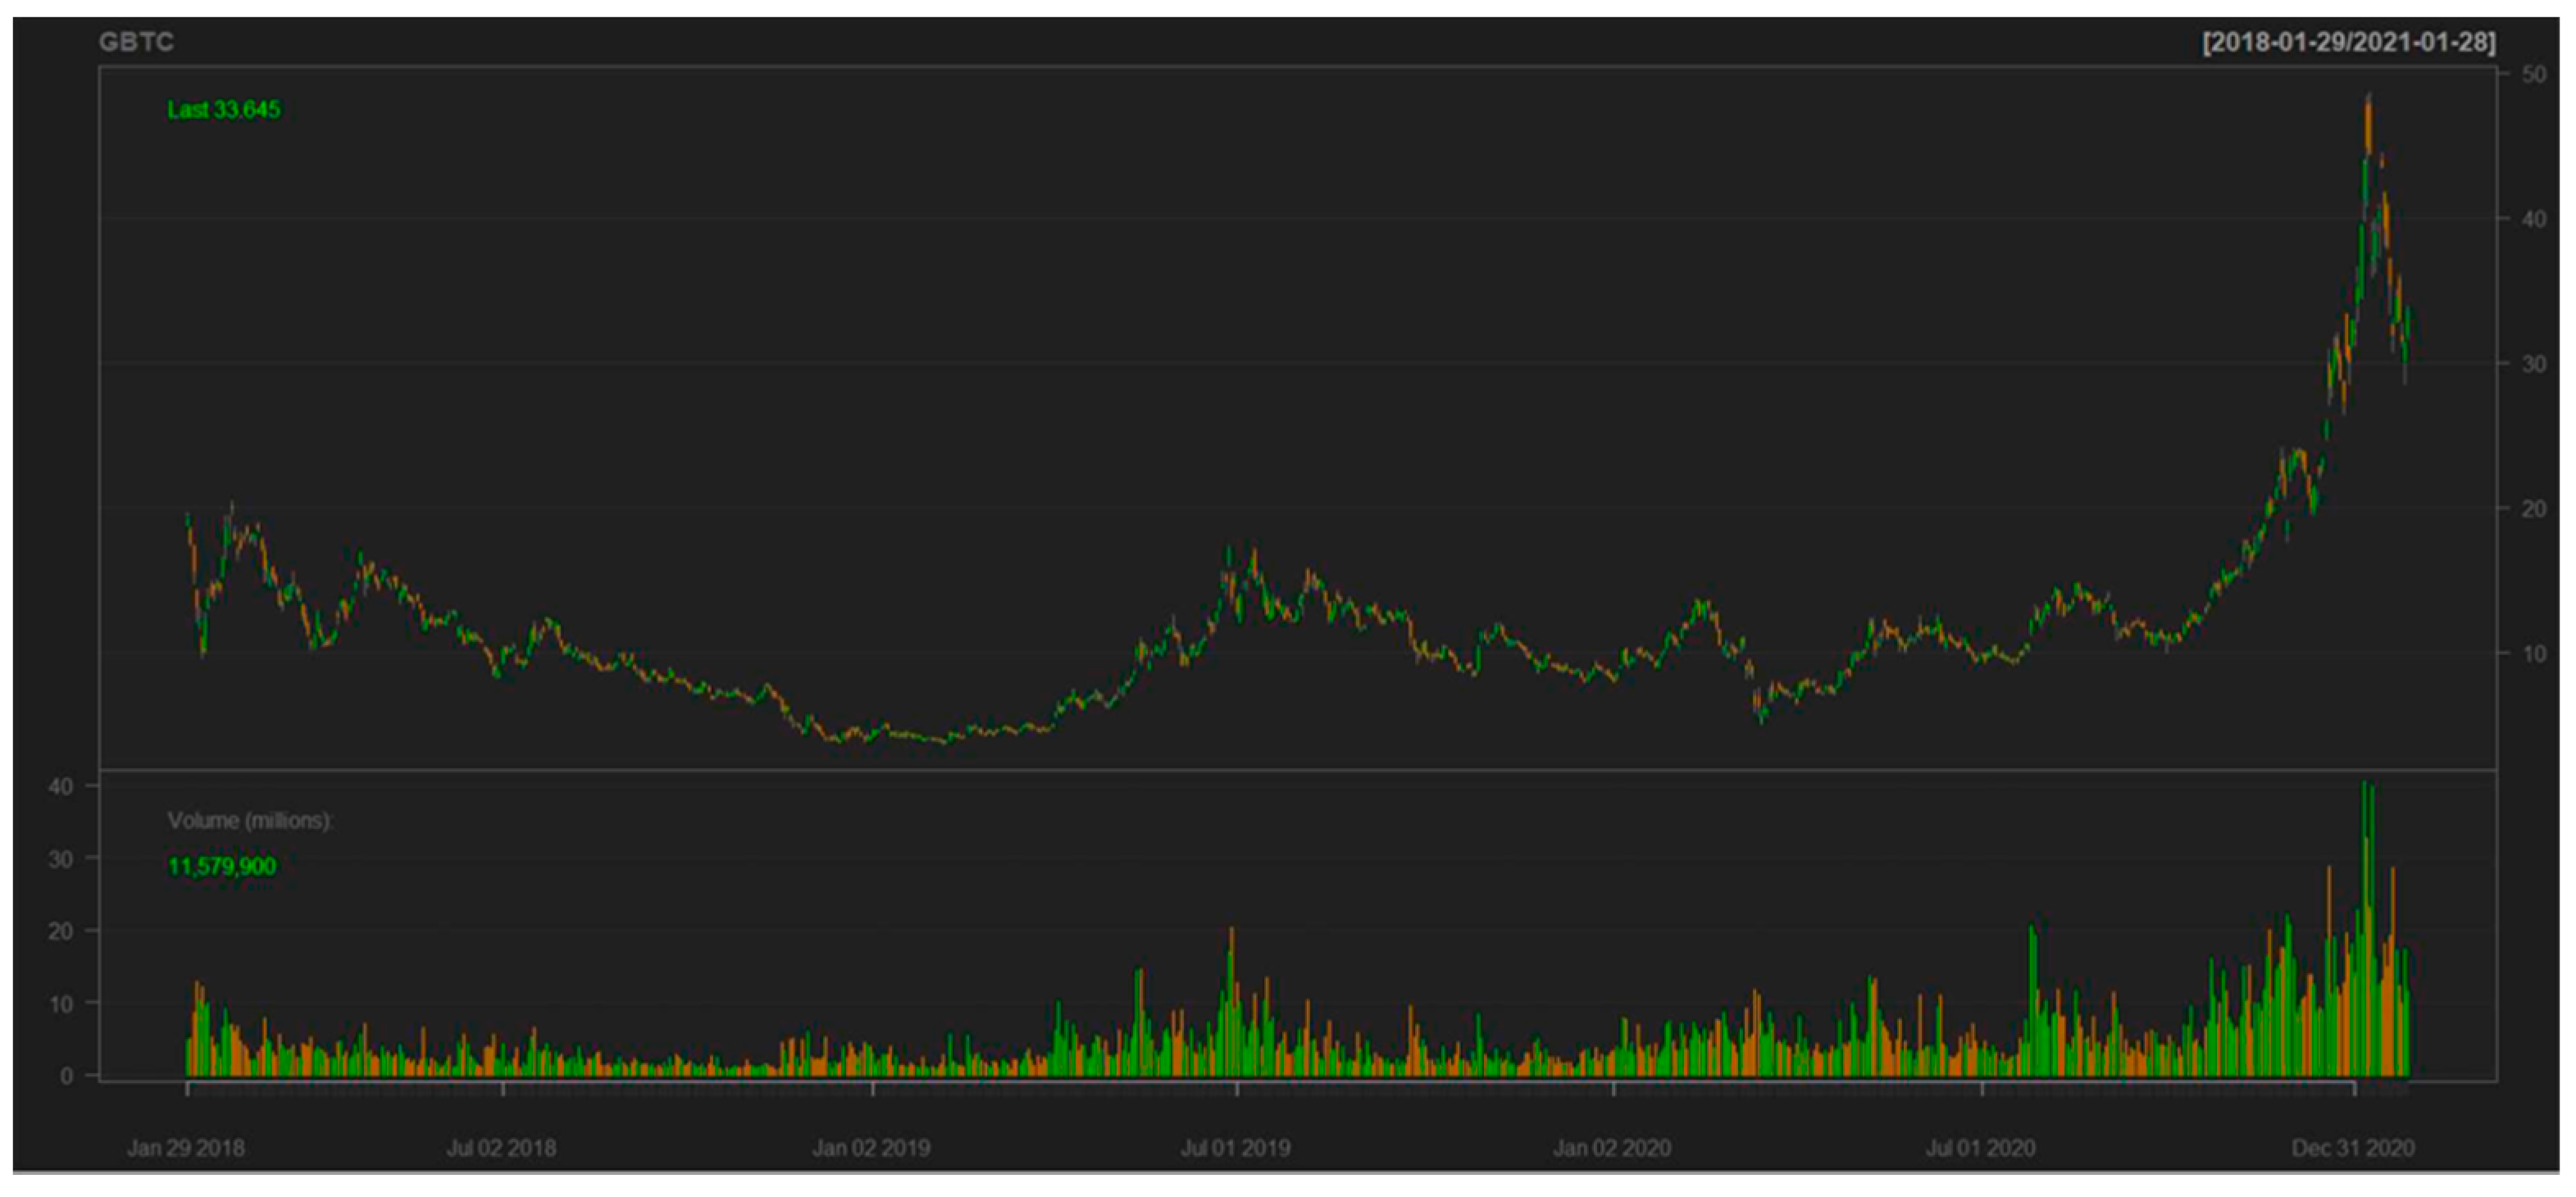
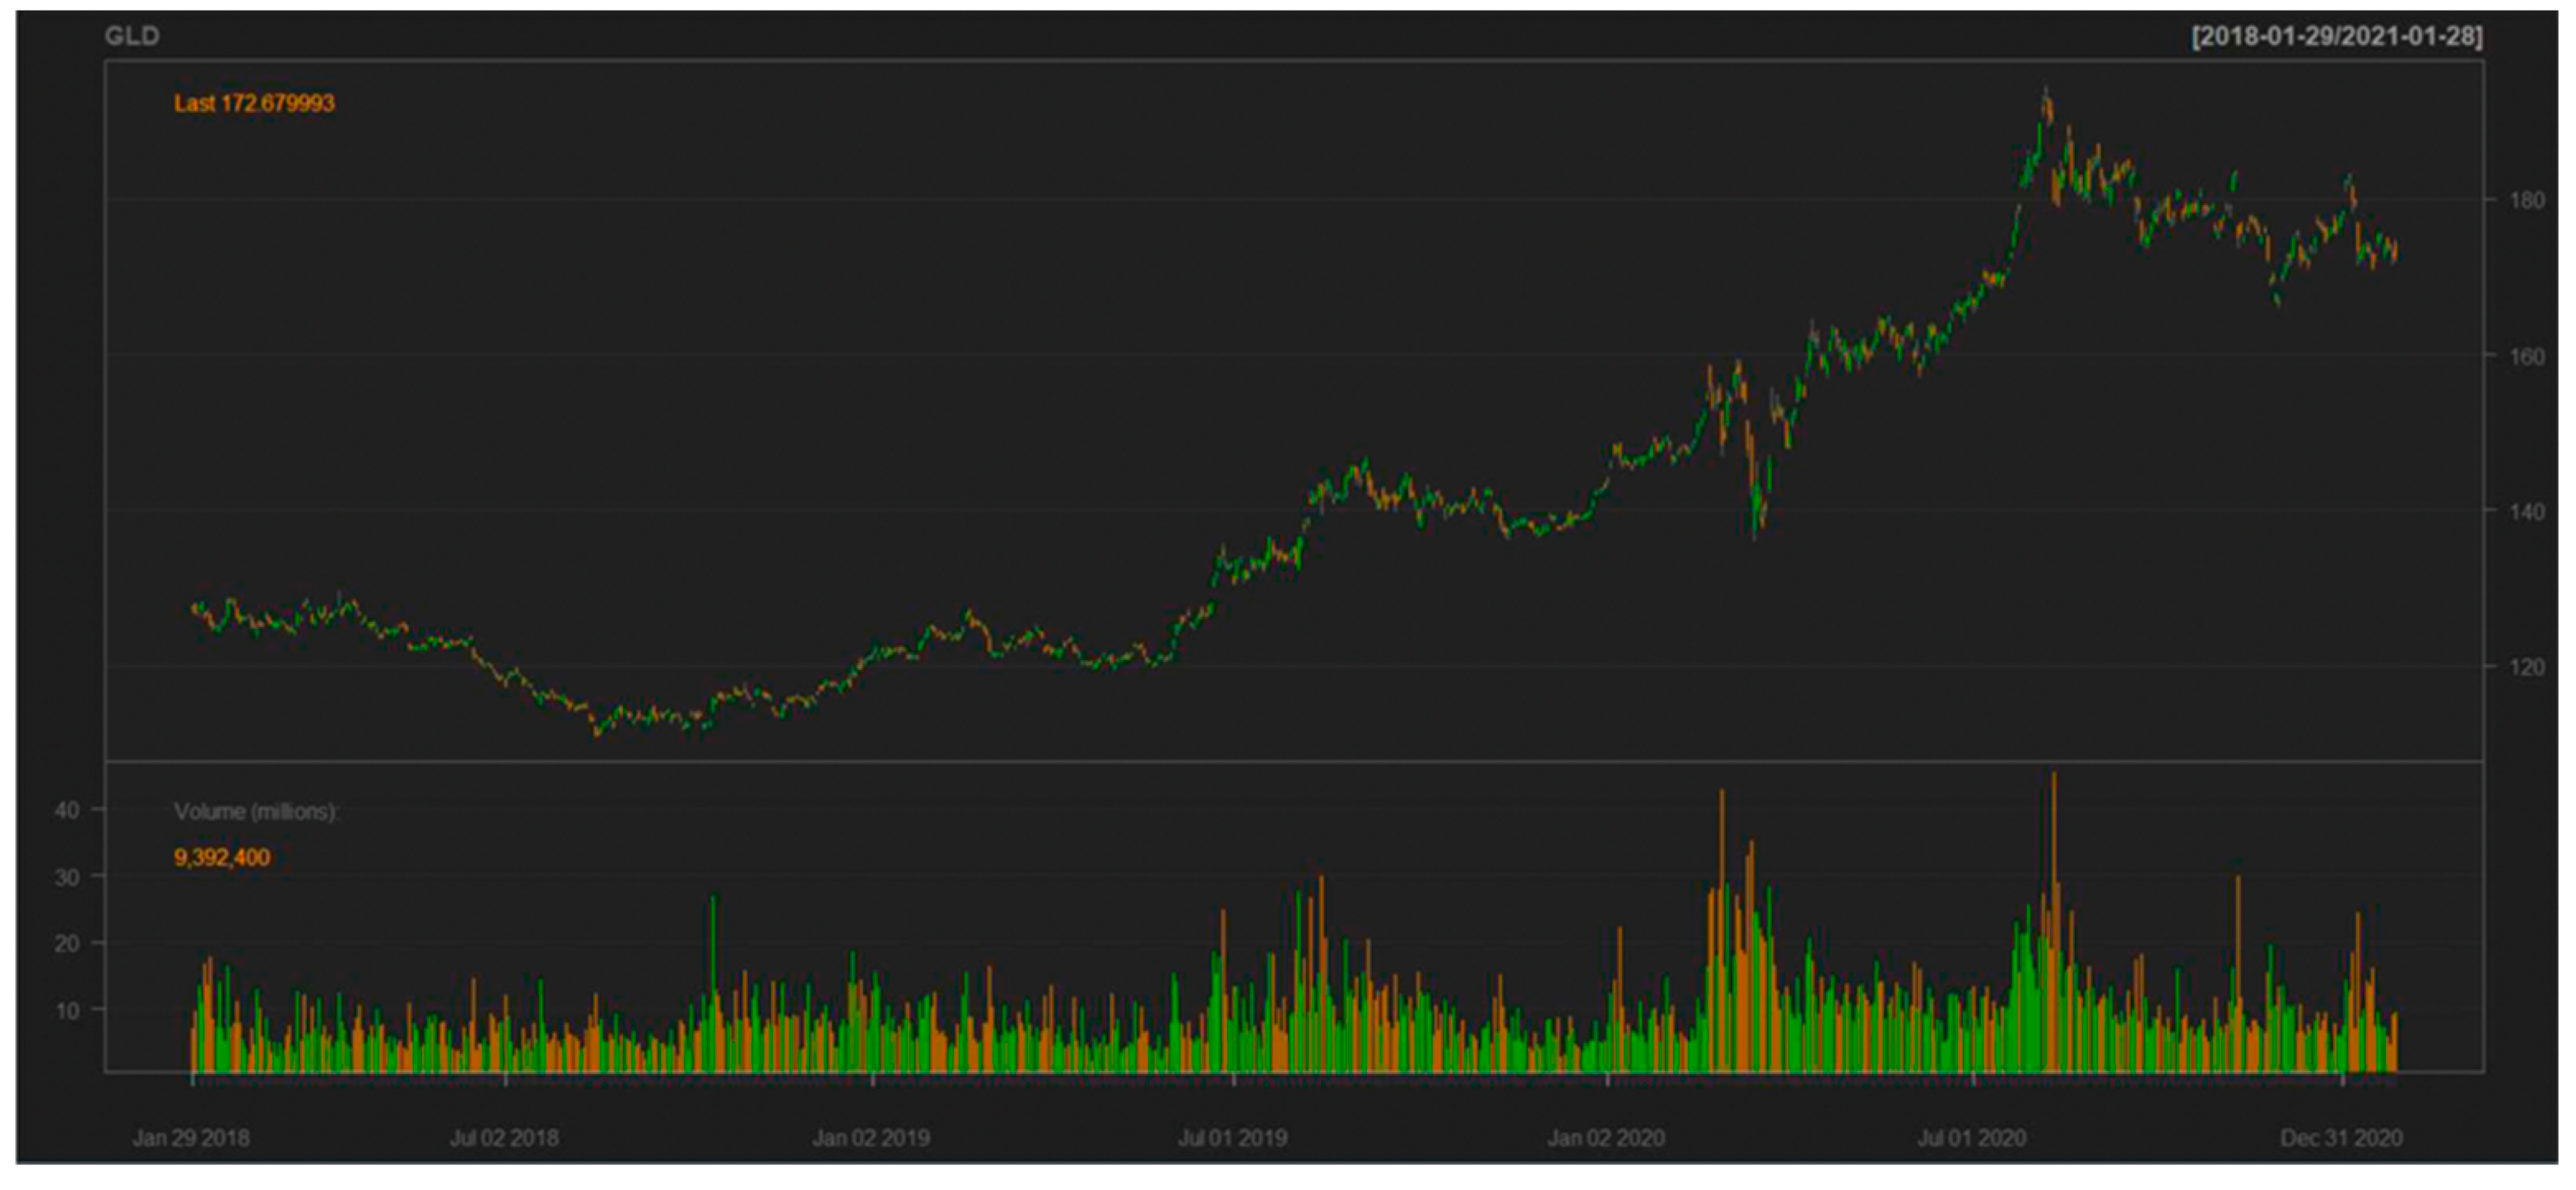
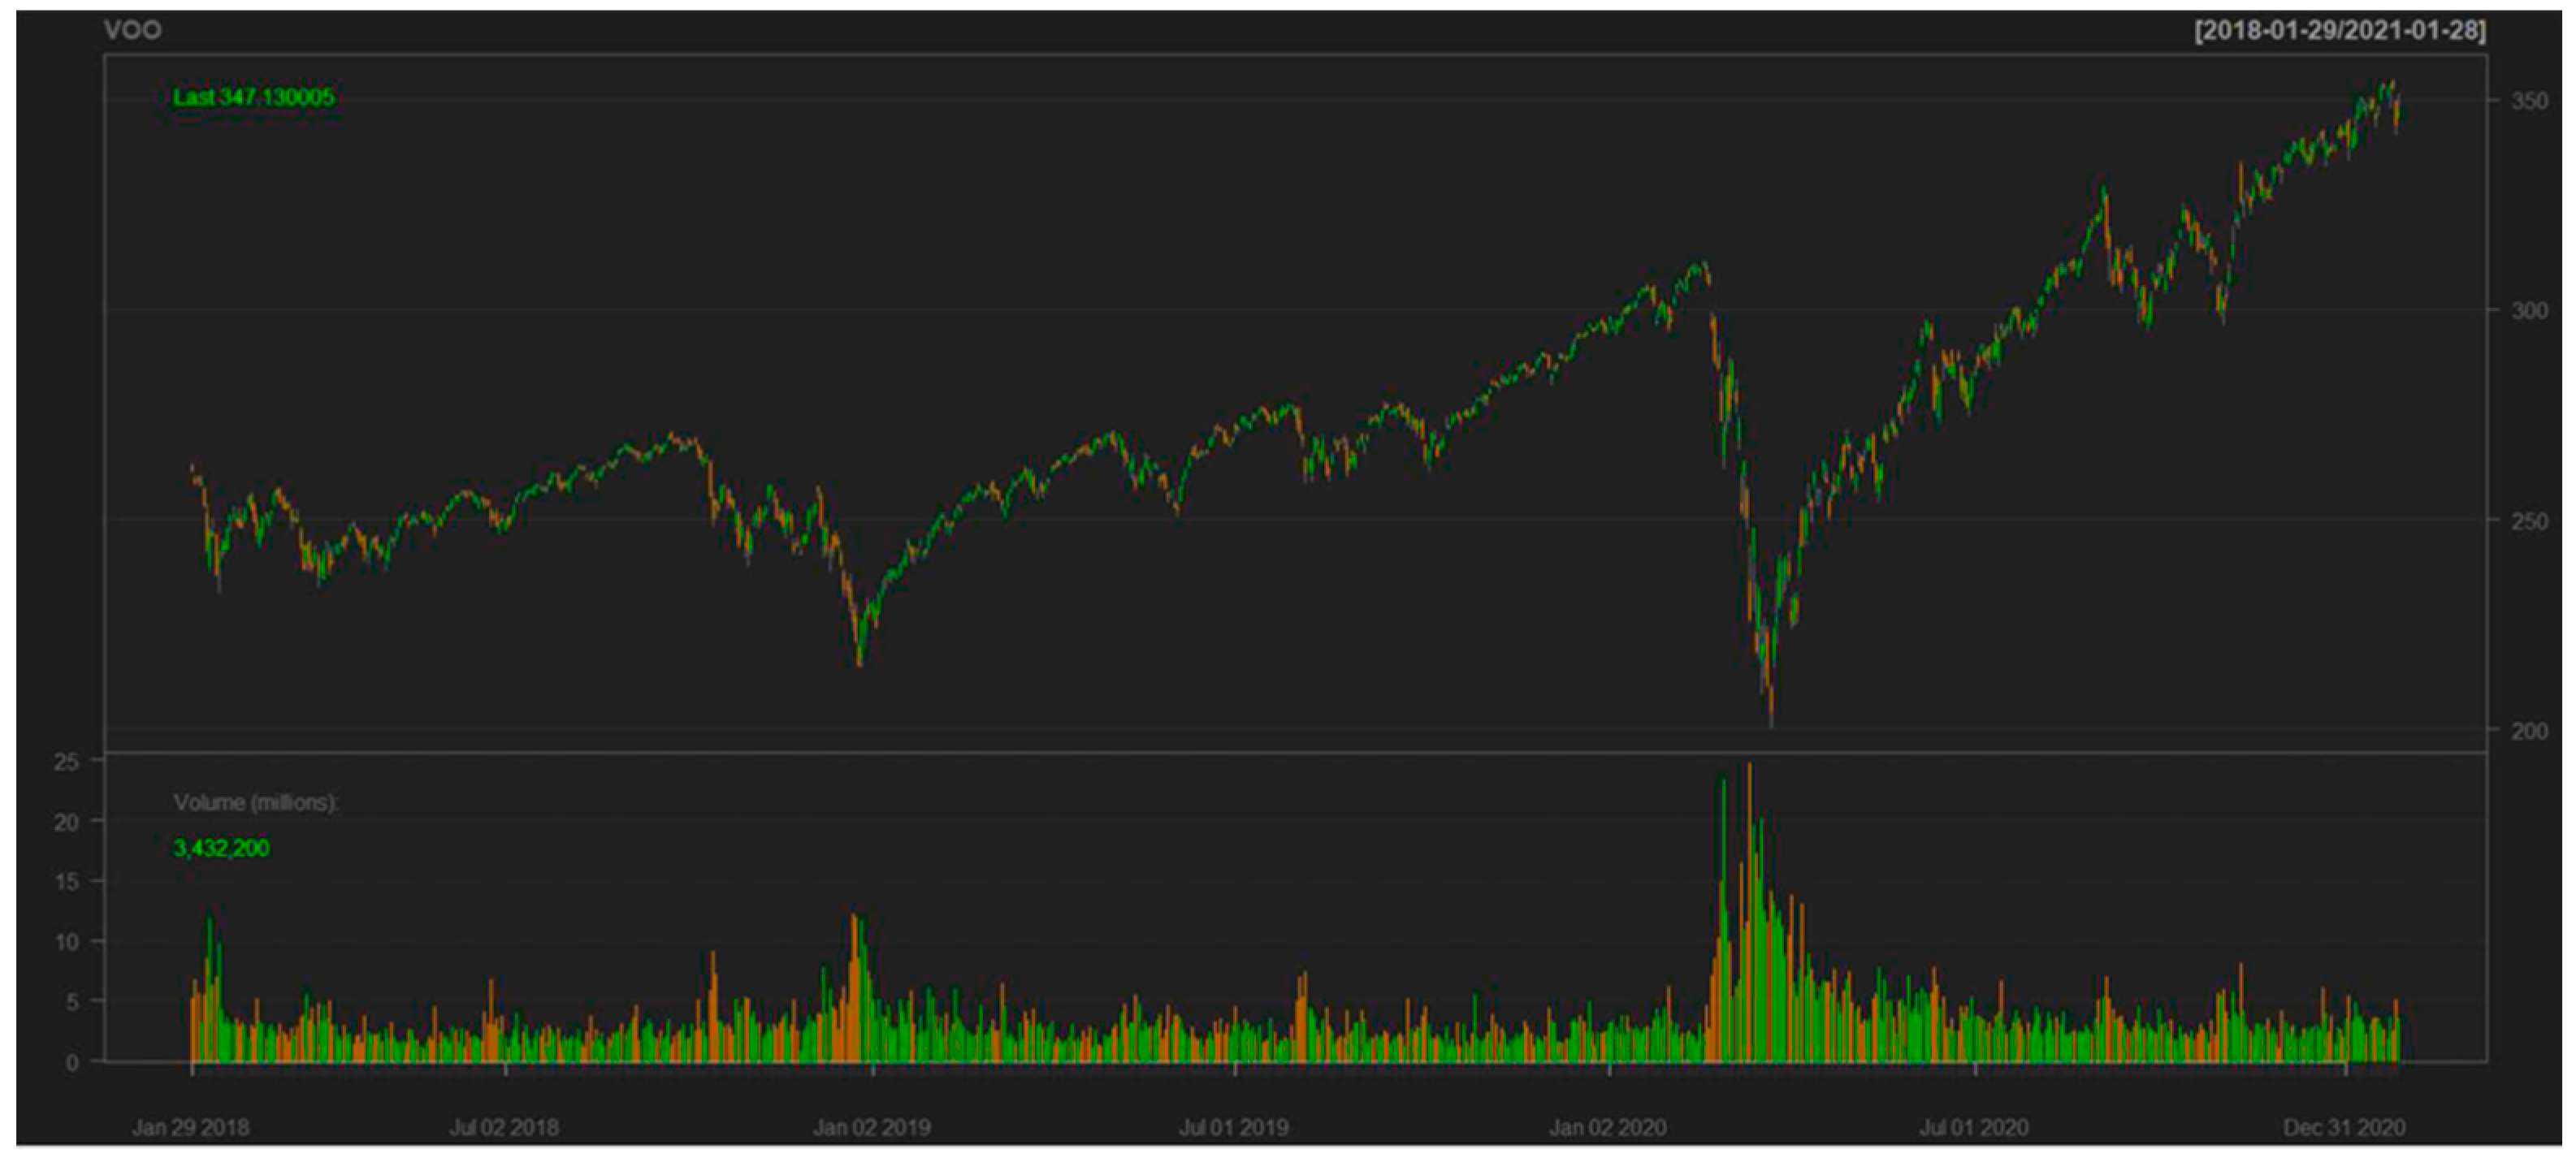
6.1. Volume Results
6.2. DCC-GARCH Model
- AR1 = coefficient of the mean model.
- alpha1 = coefficient to the squared residuals.
- beta1 = coefficient to the lagged variance.
6.3. Interpretation
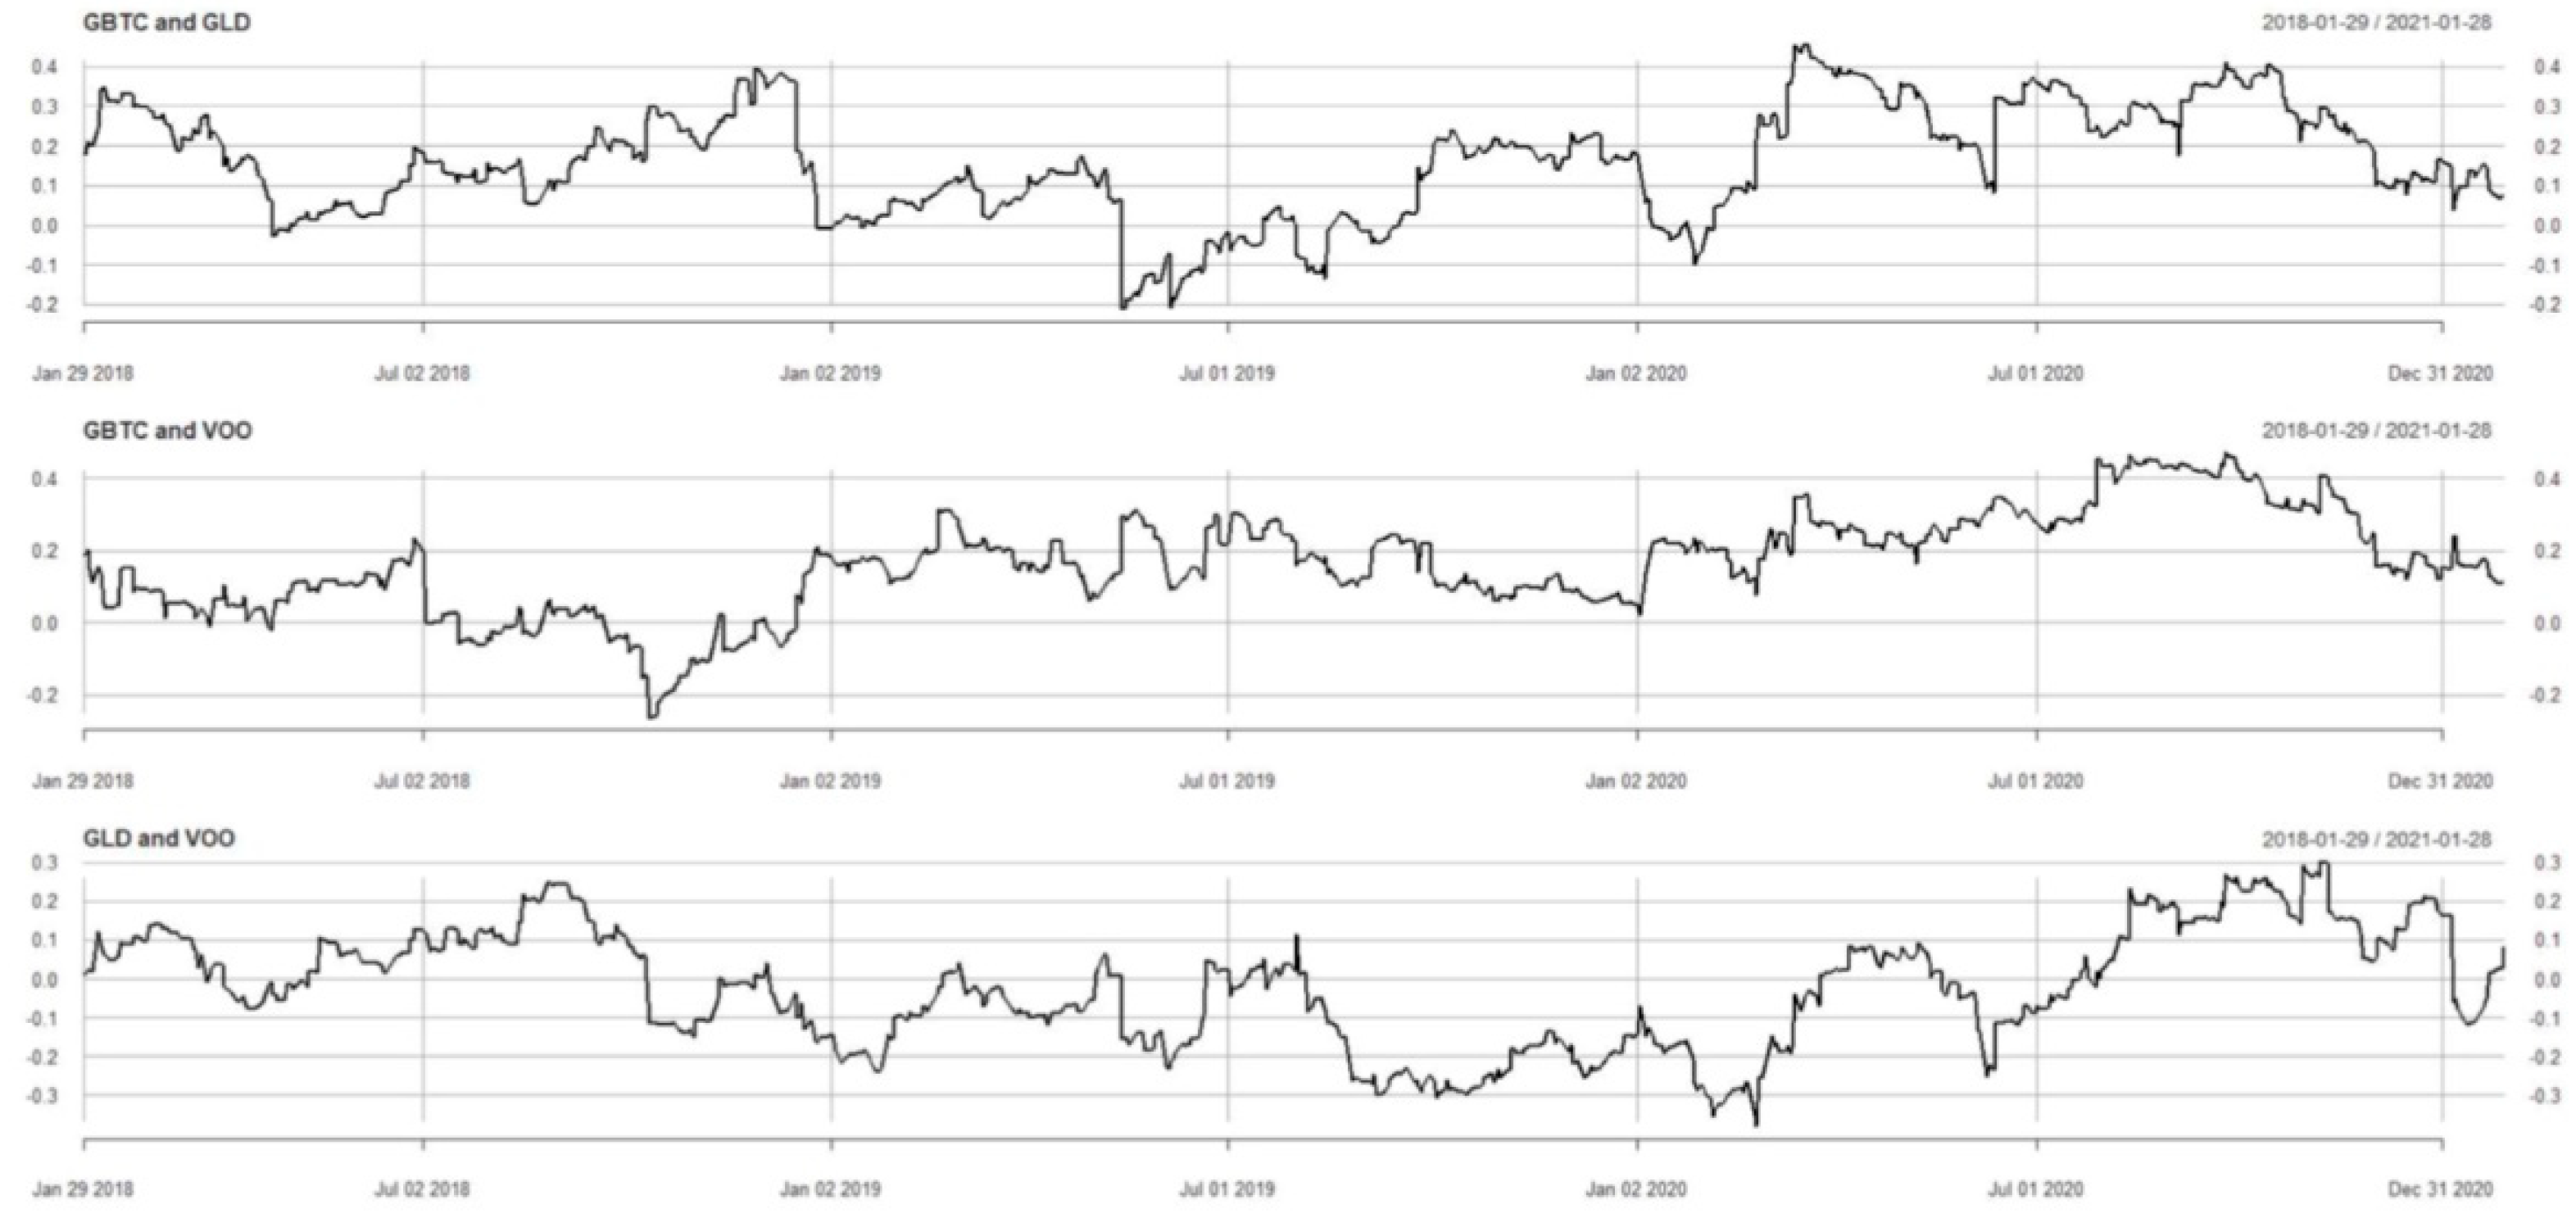
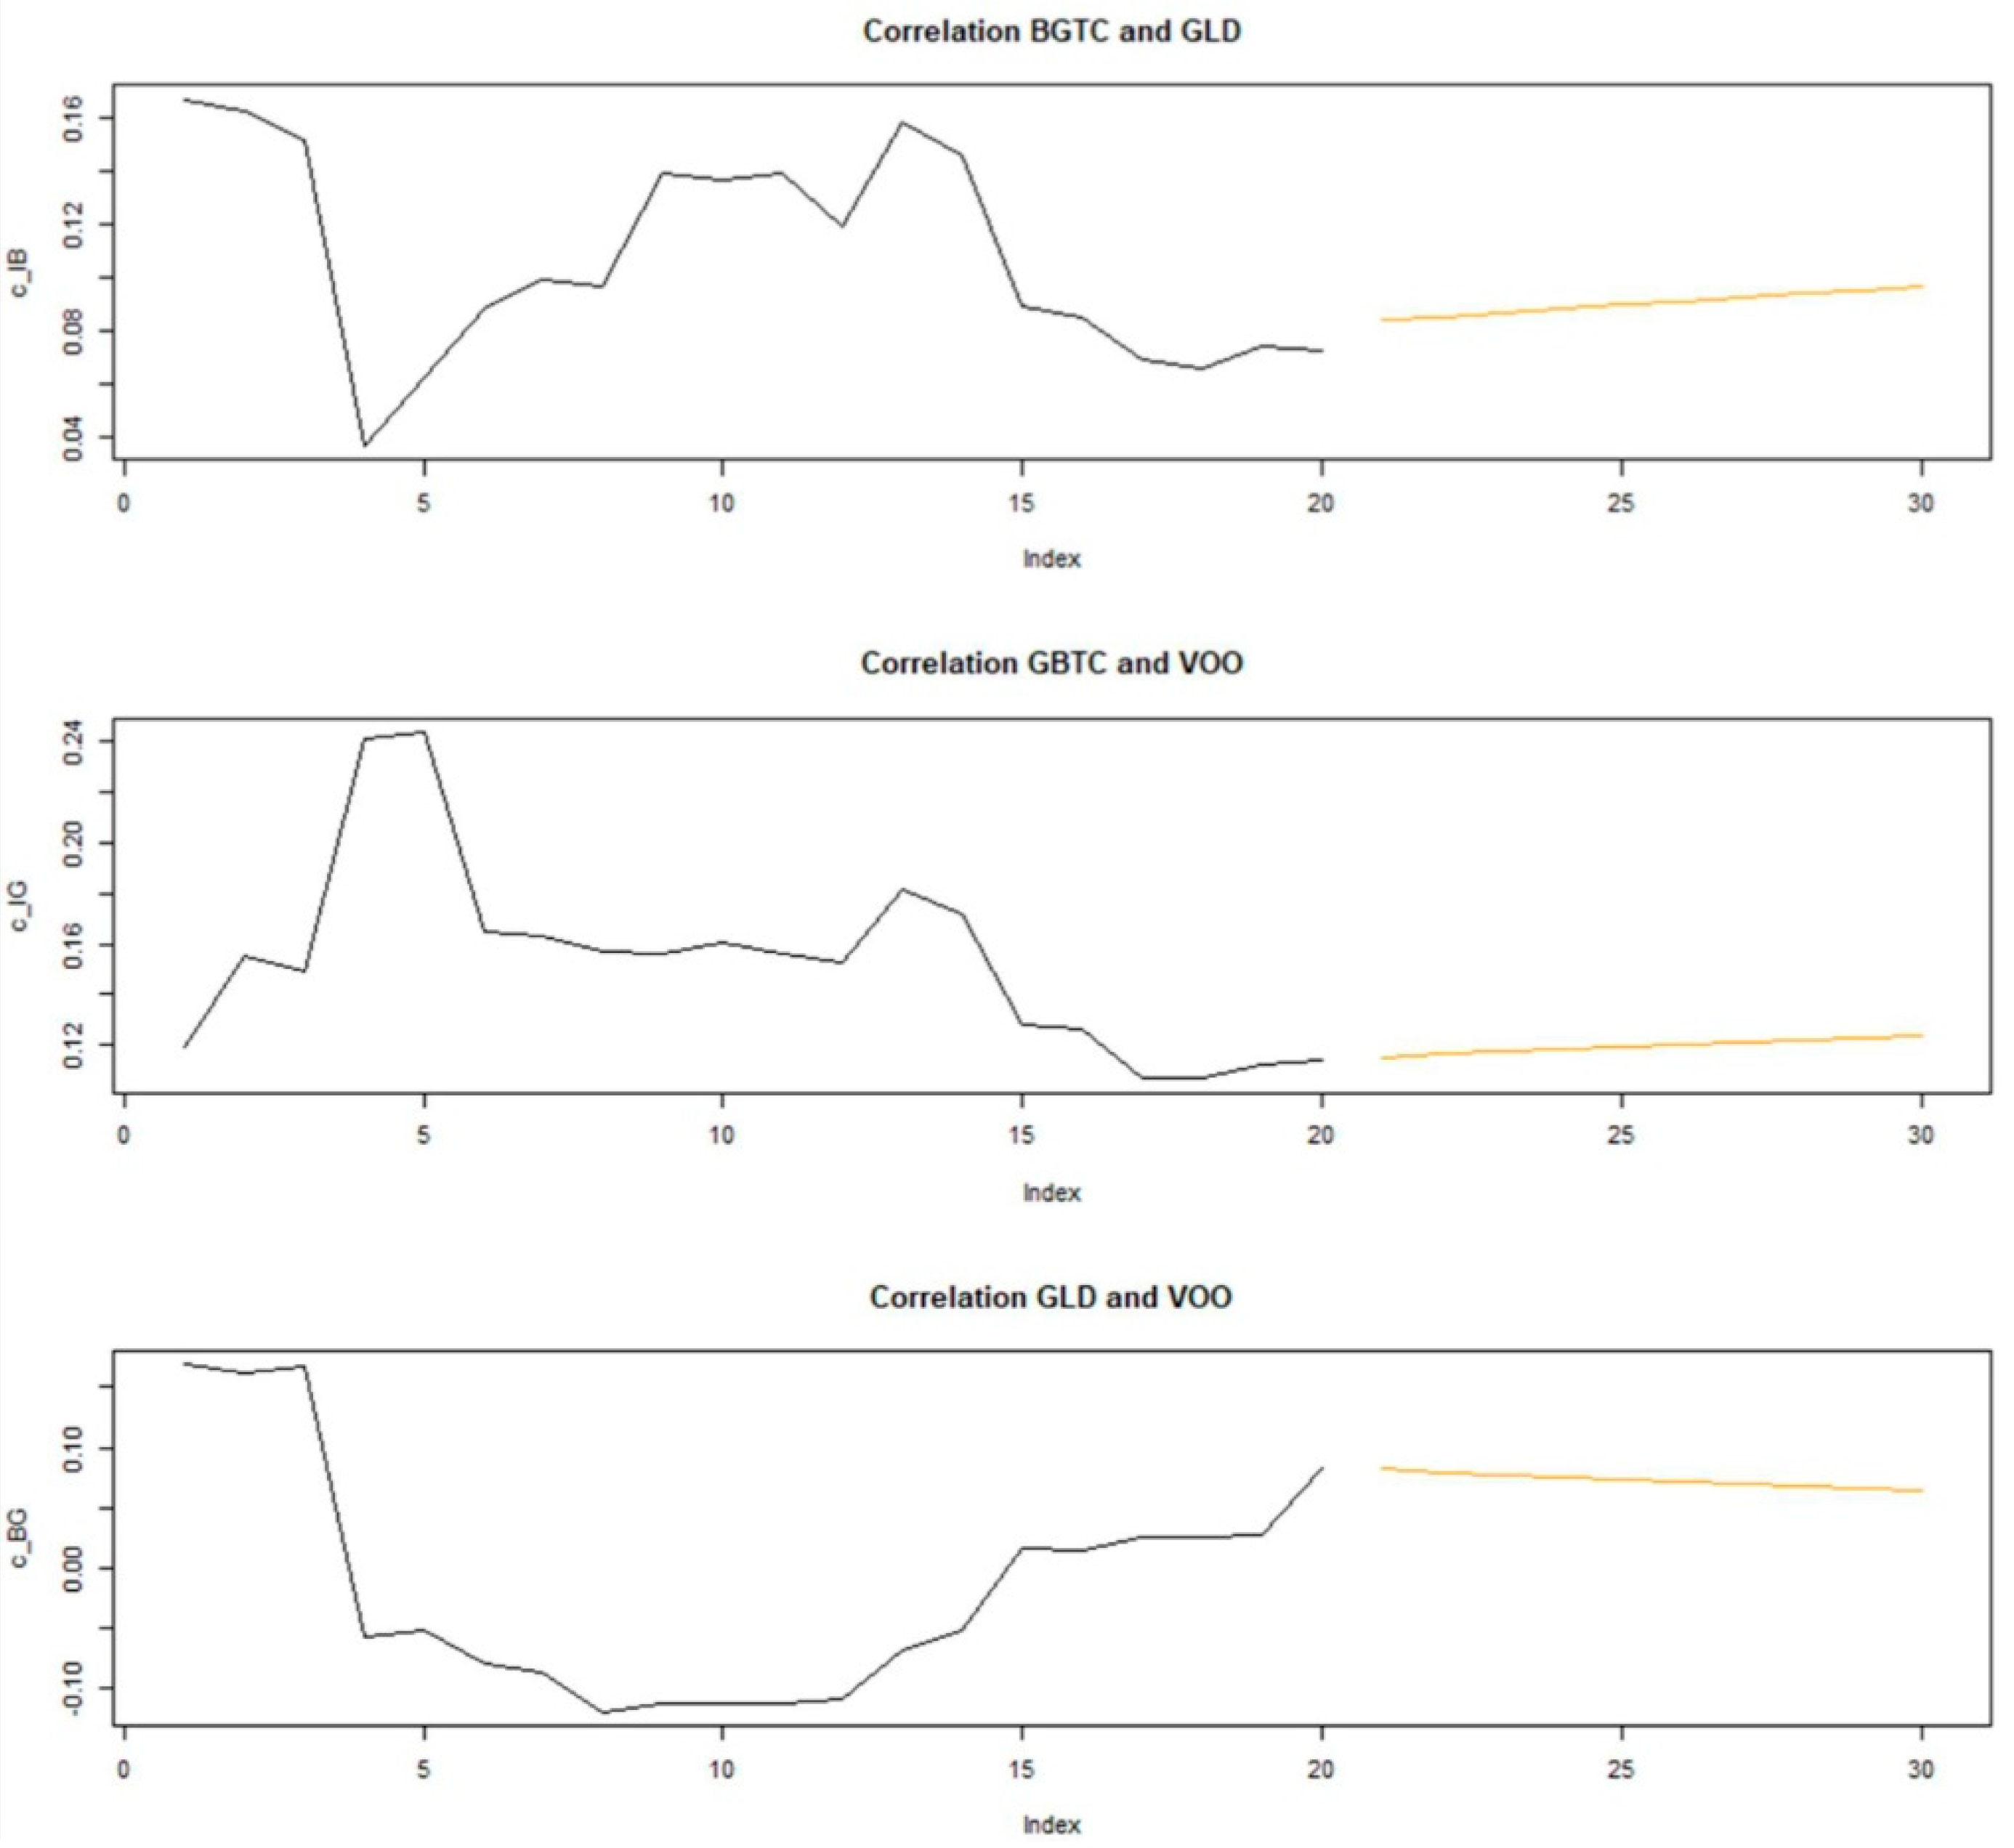
6.4. Correlation Interpretation
- Black = Last realised correlations.
- Orange = Forecasted correlation.
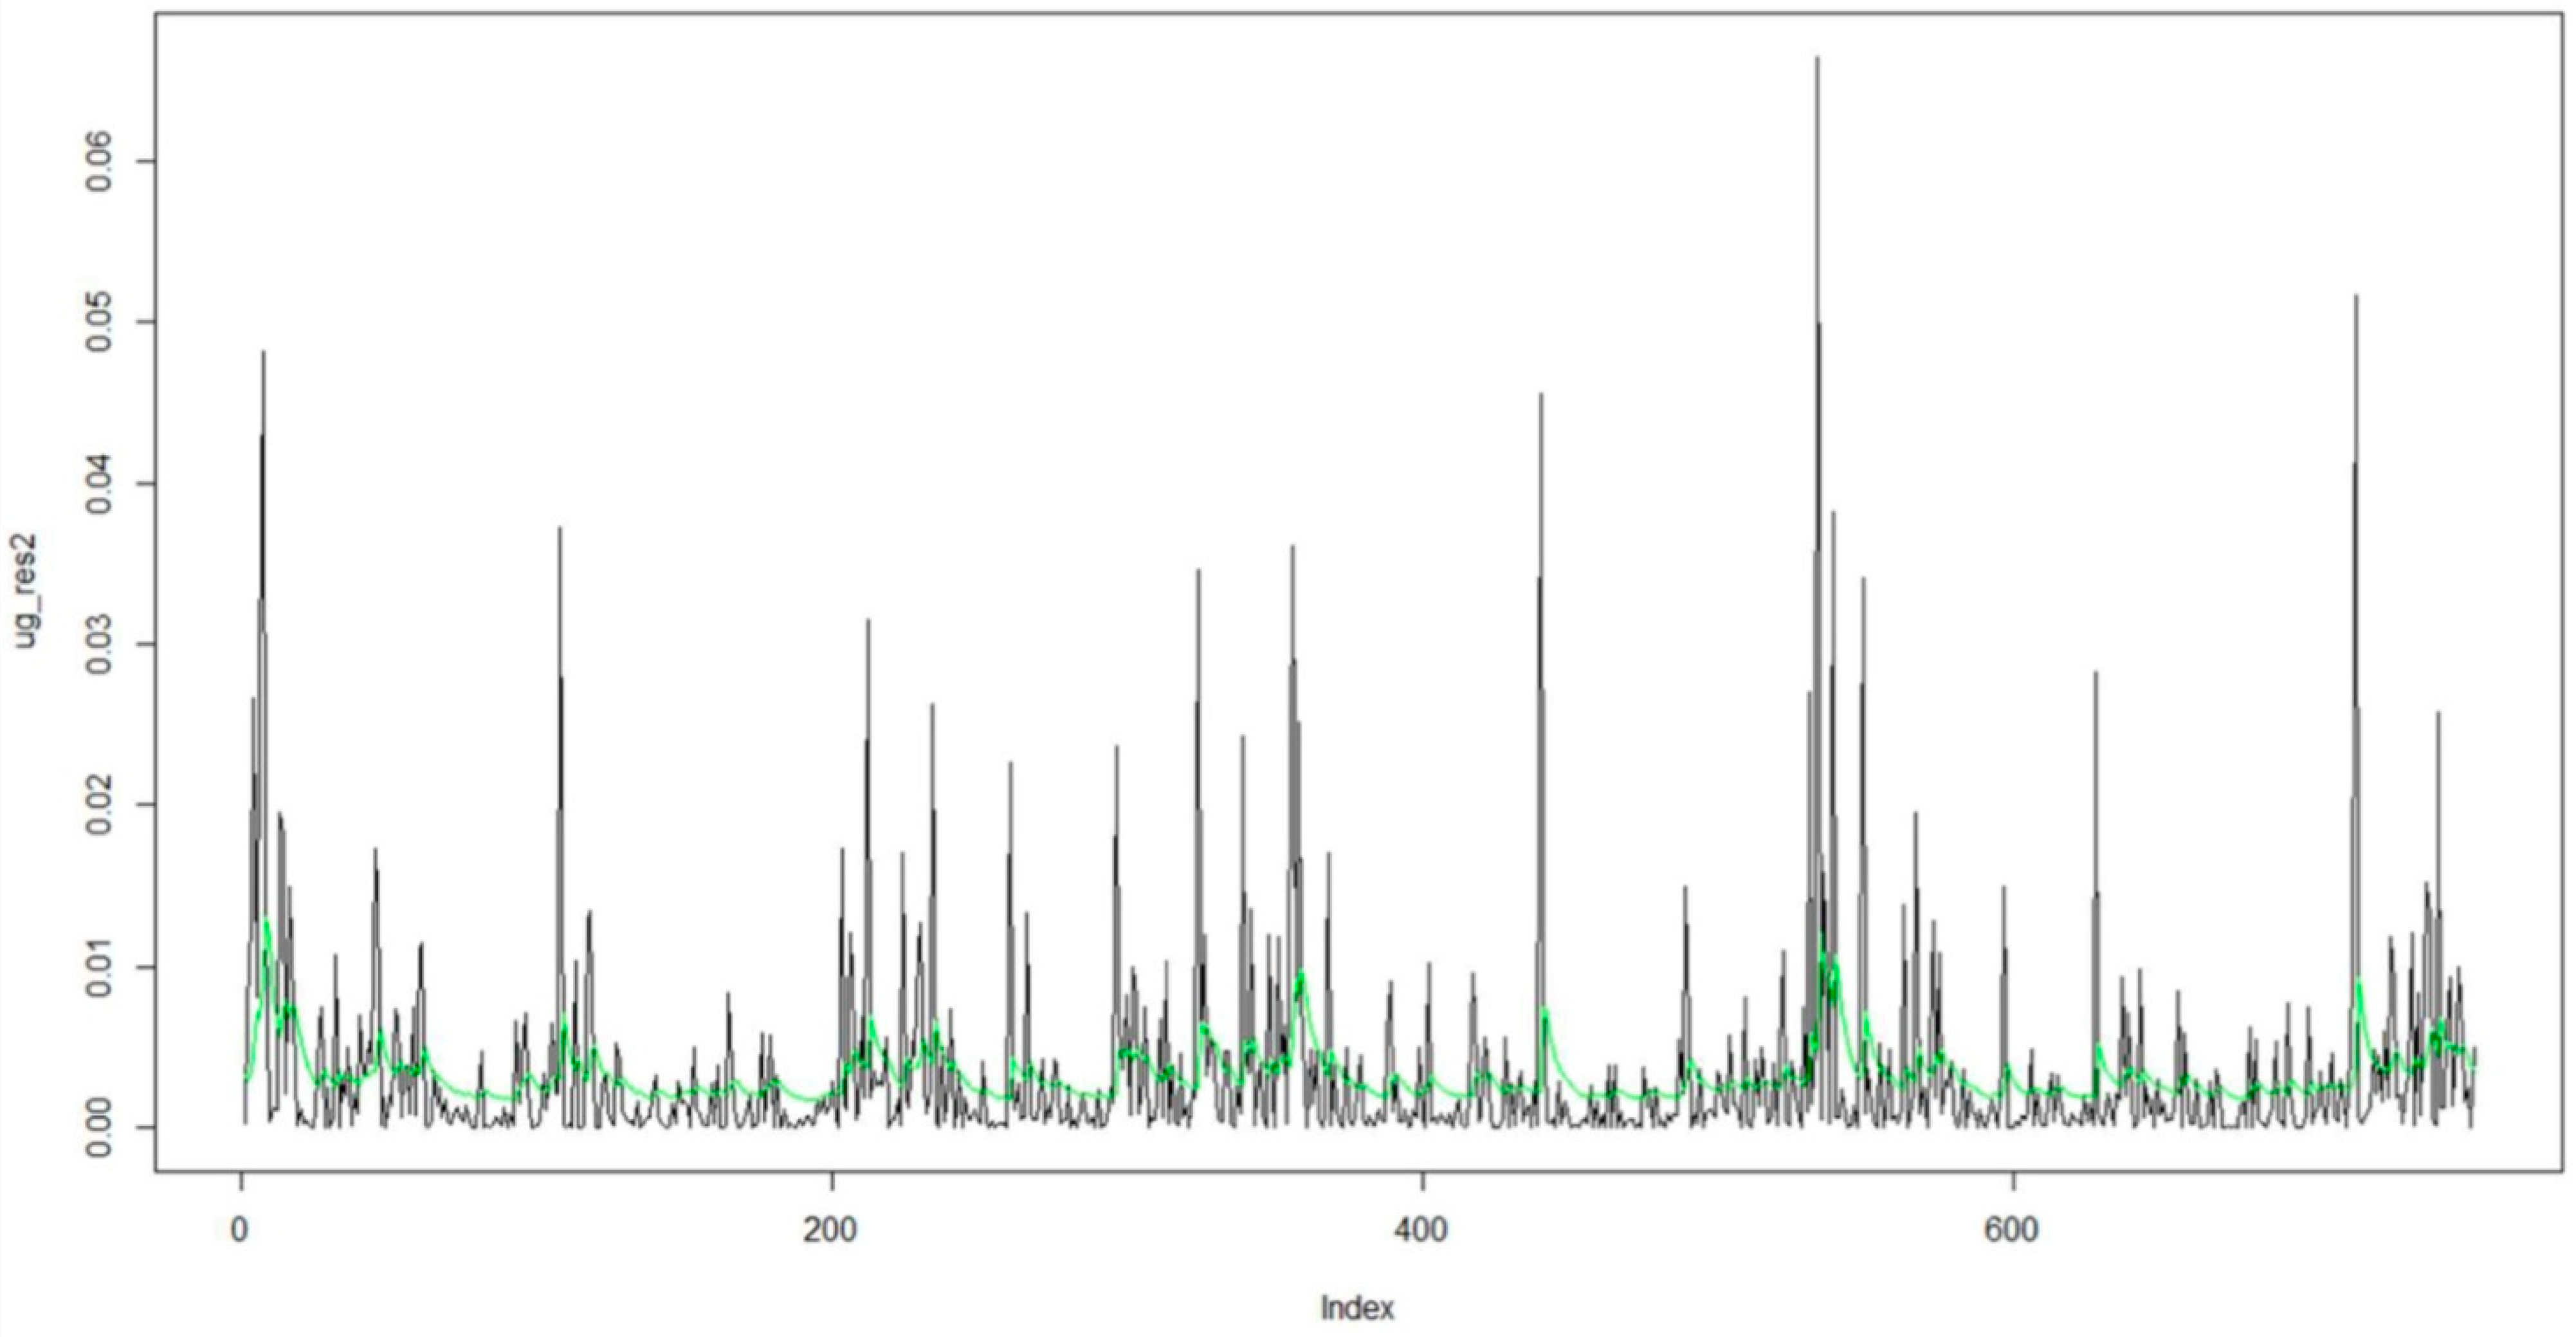
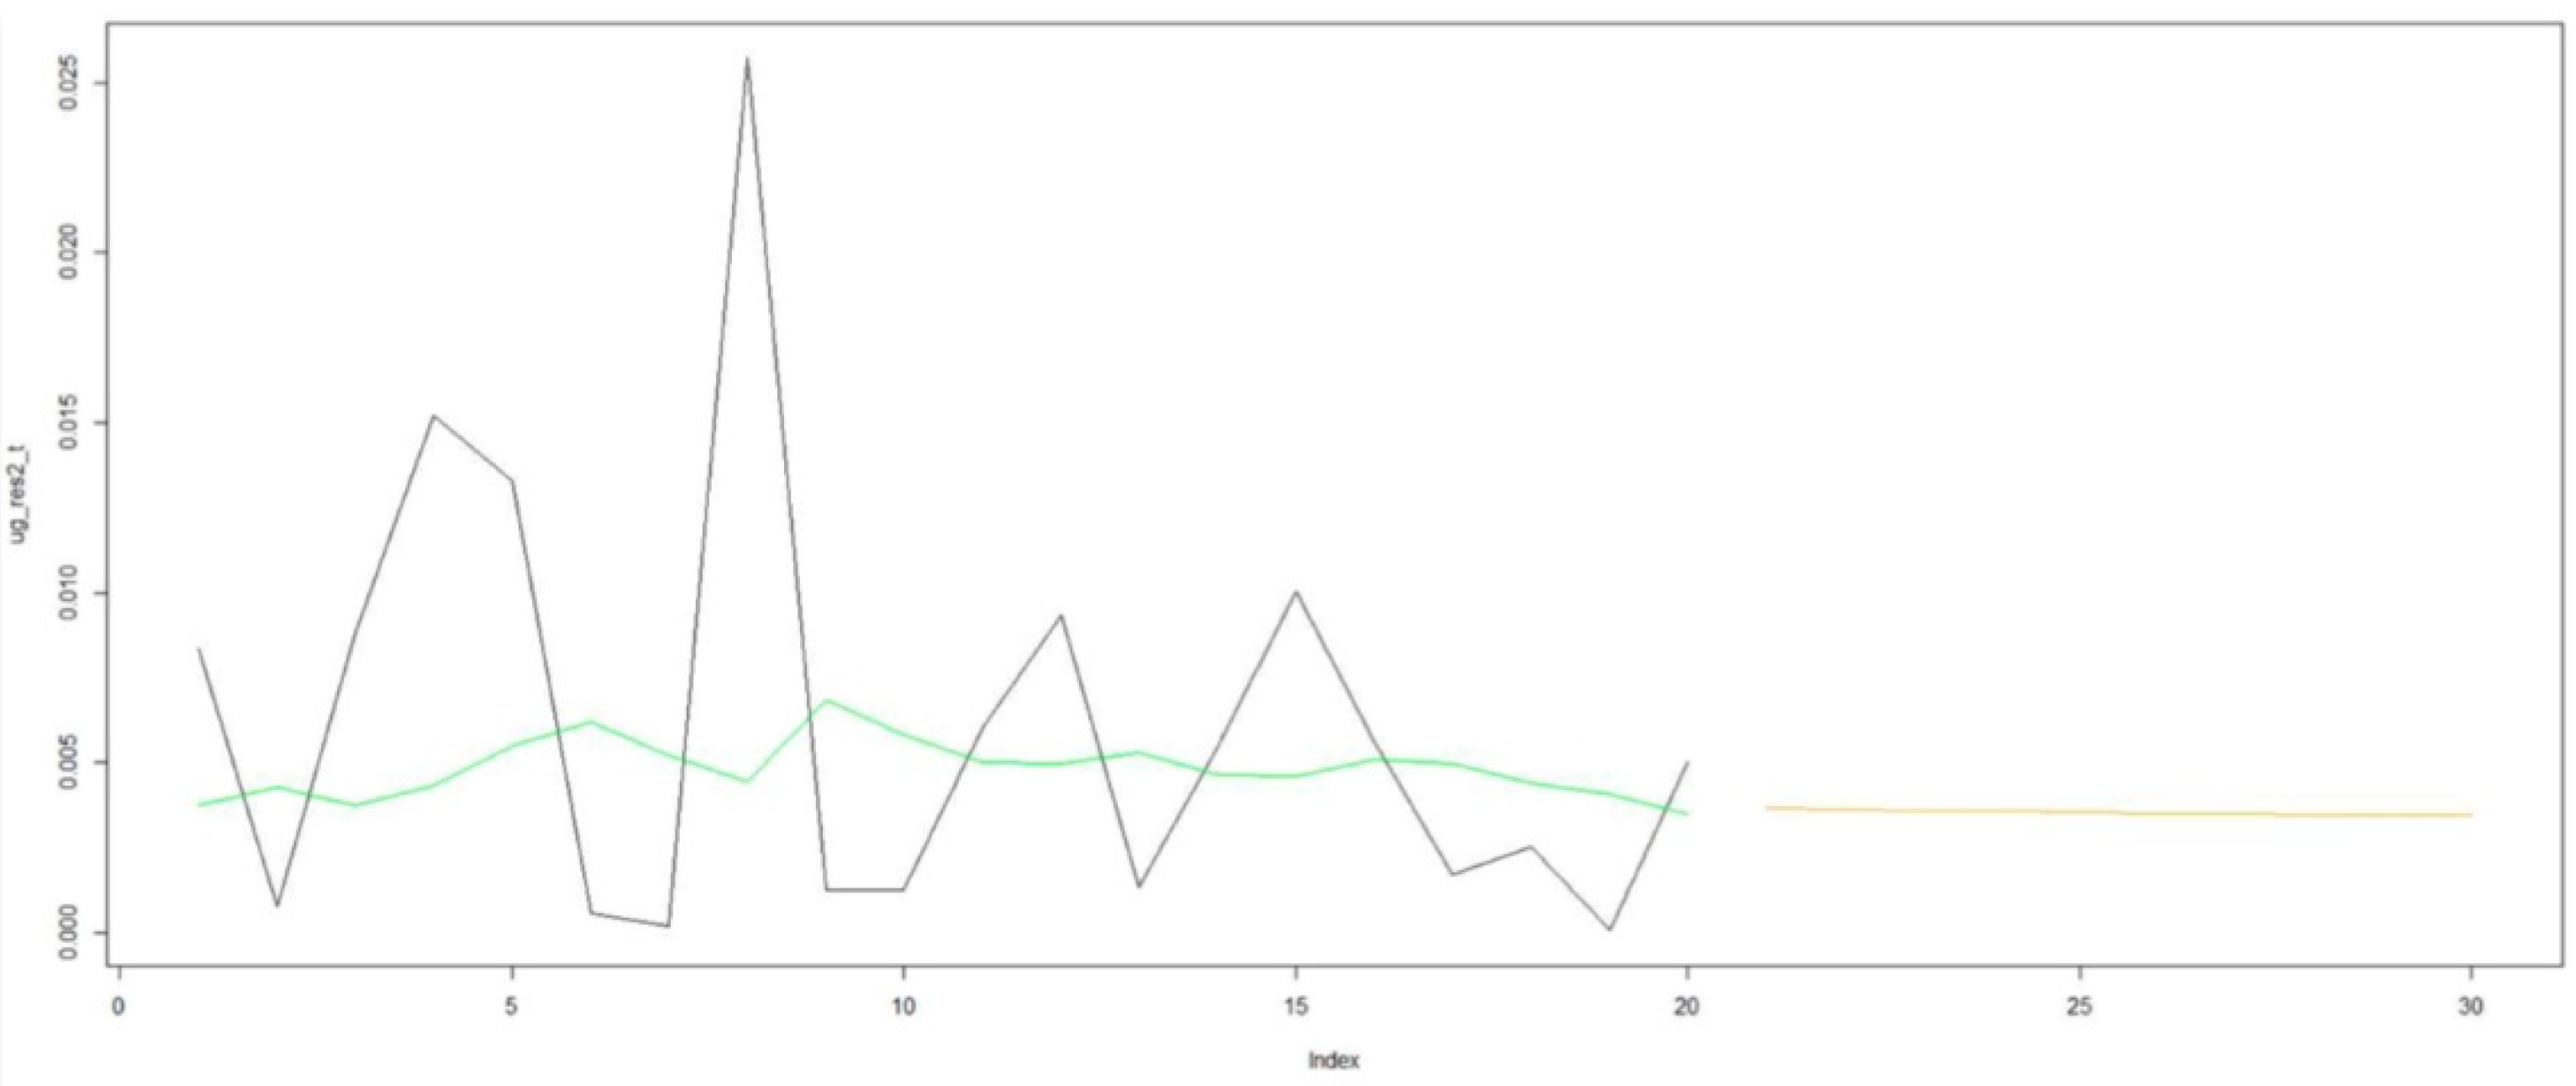
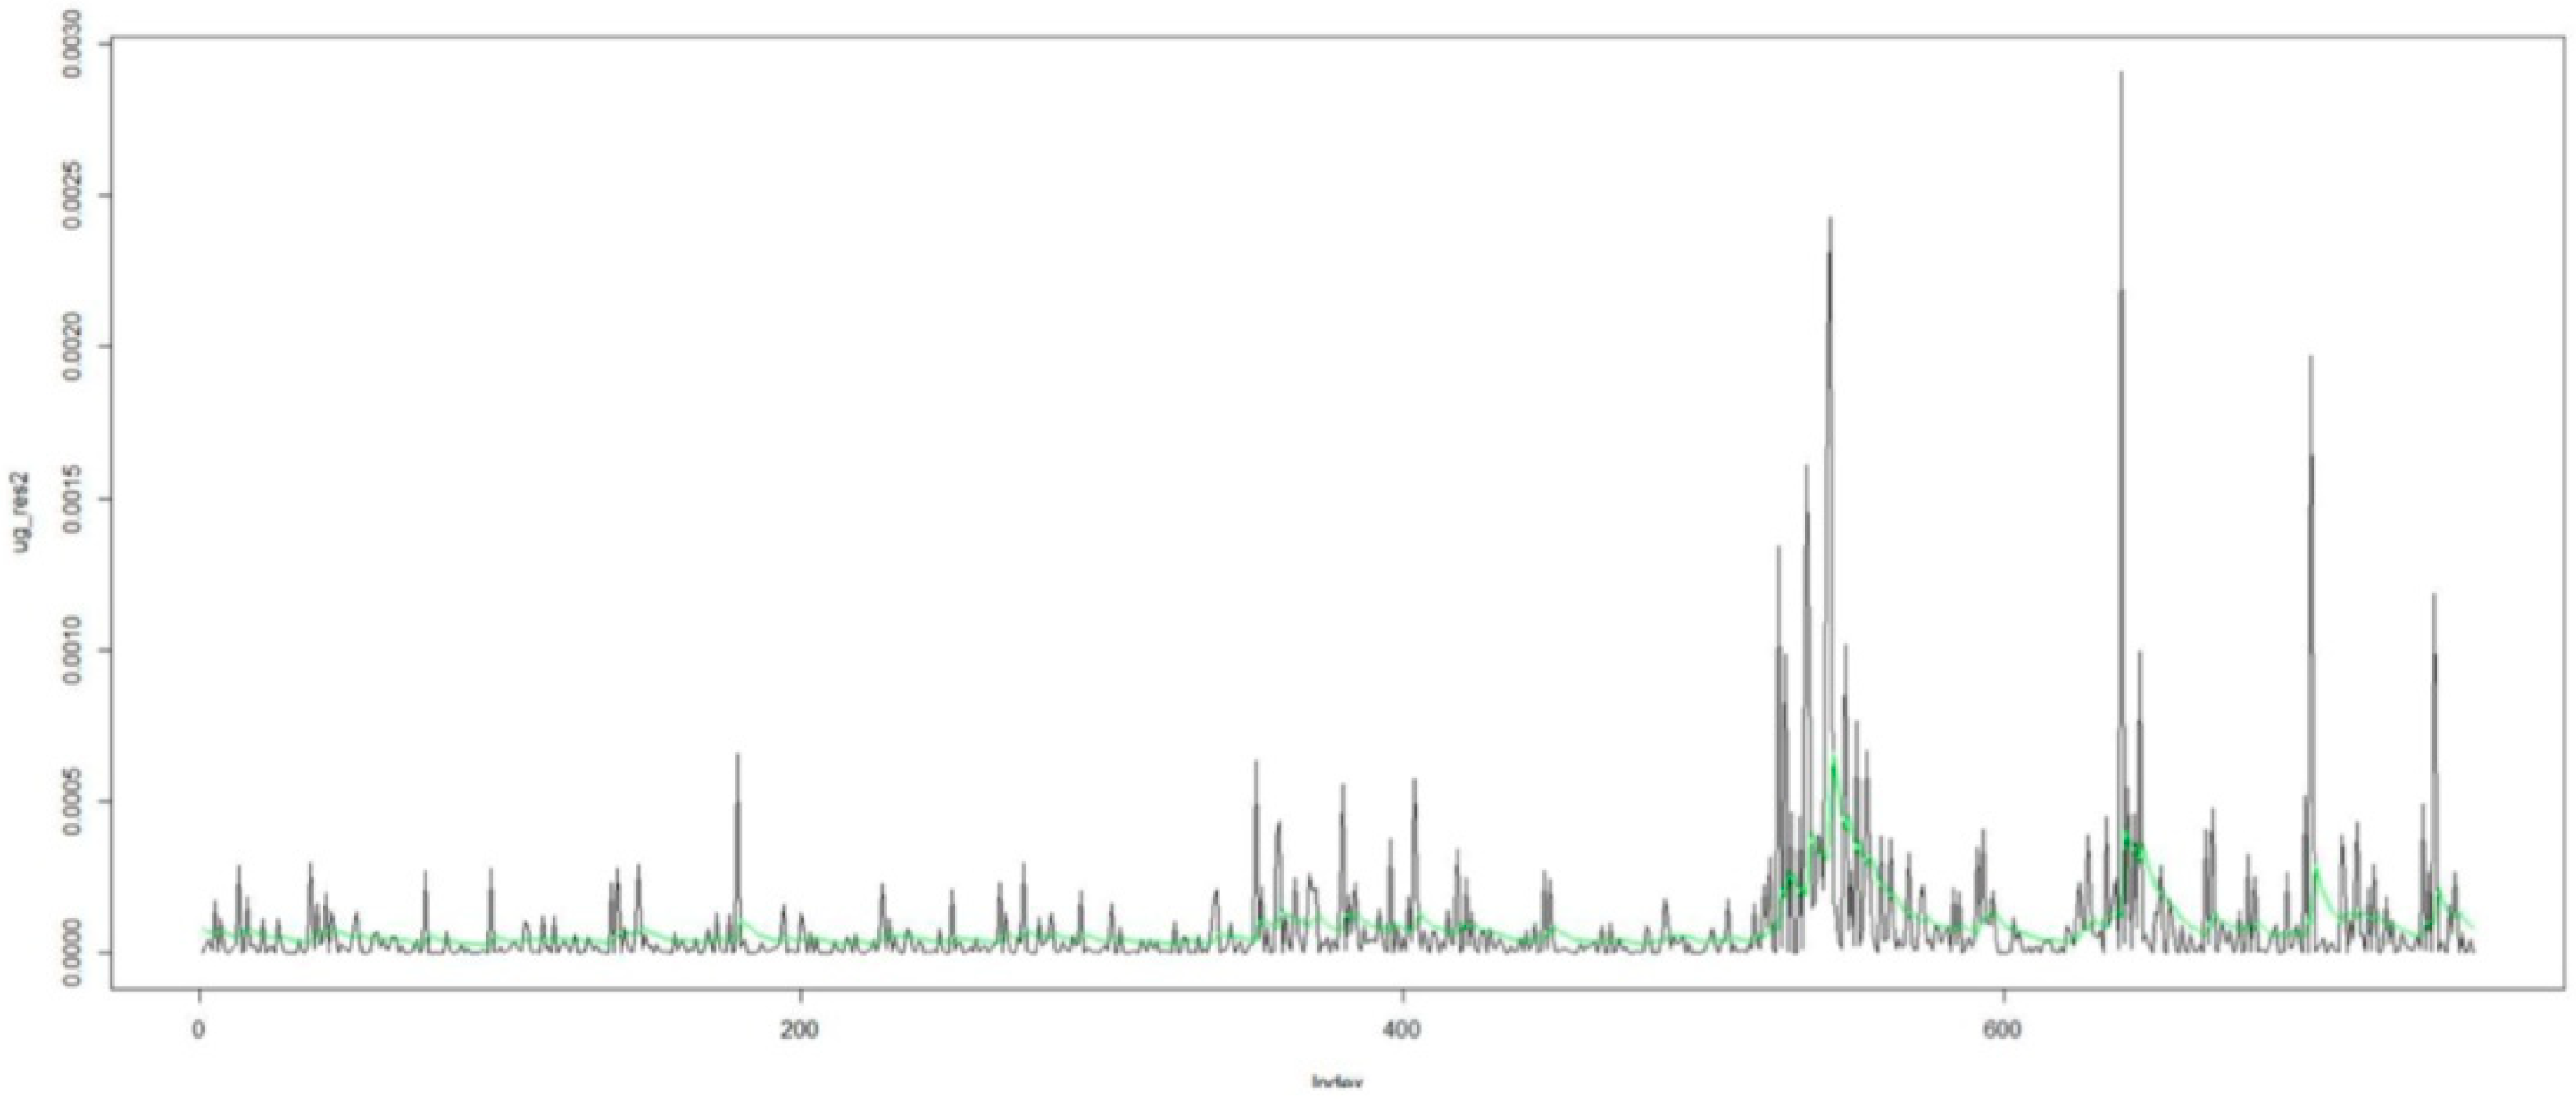
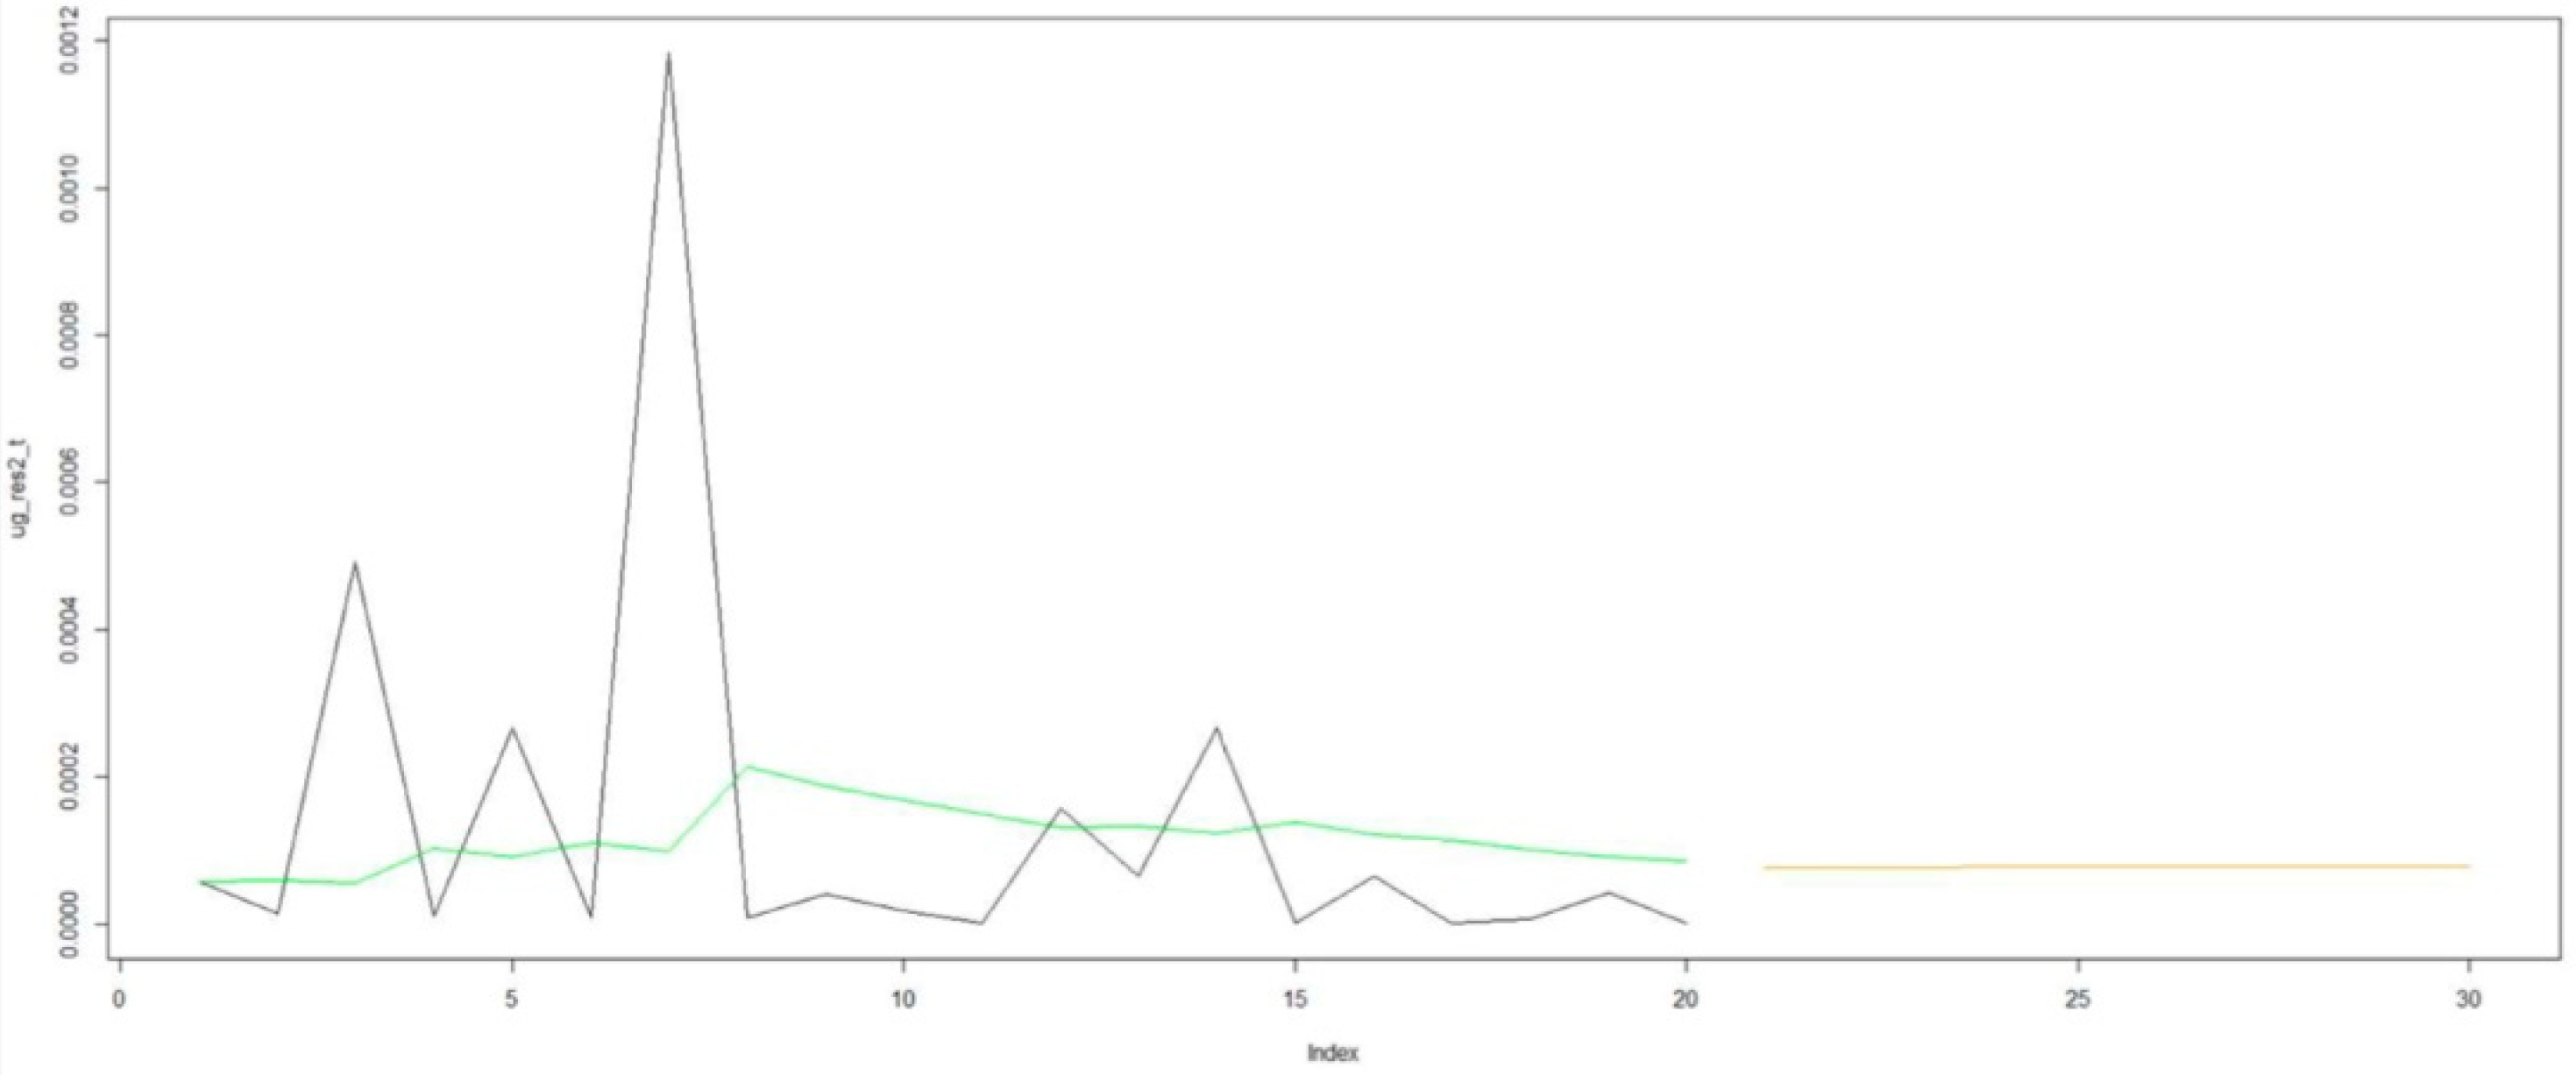
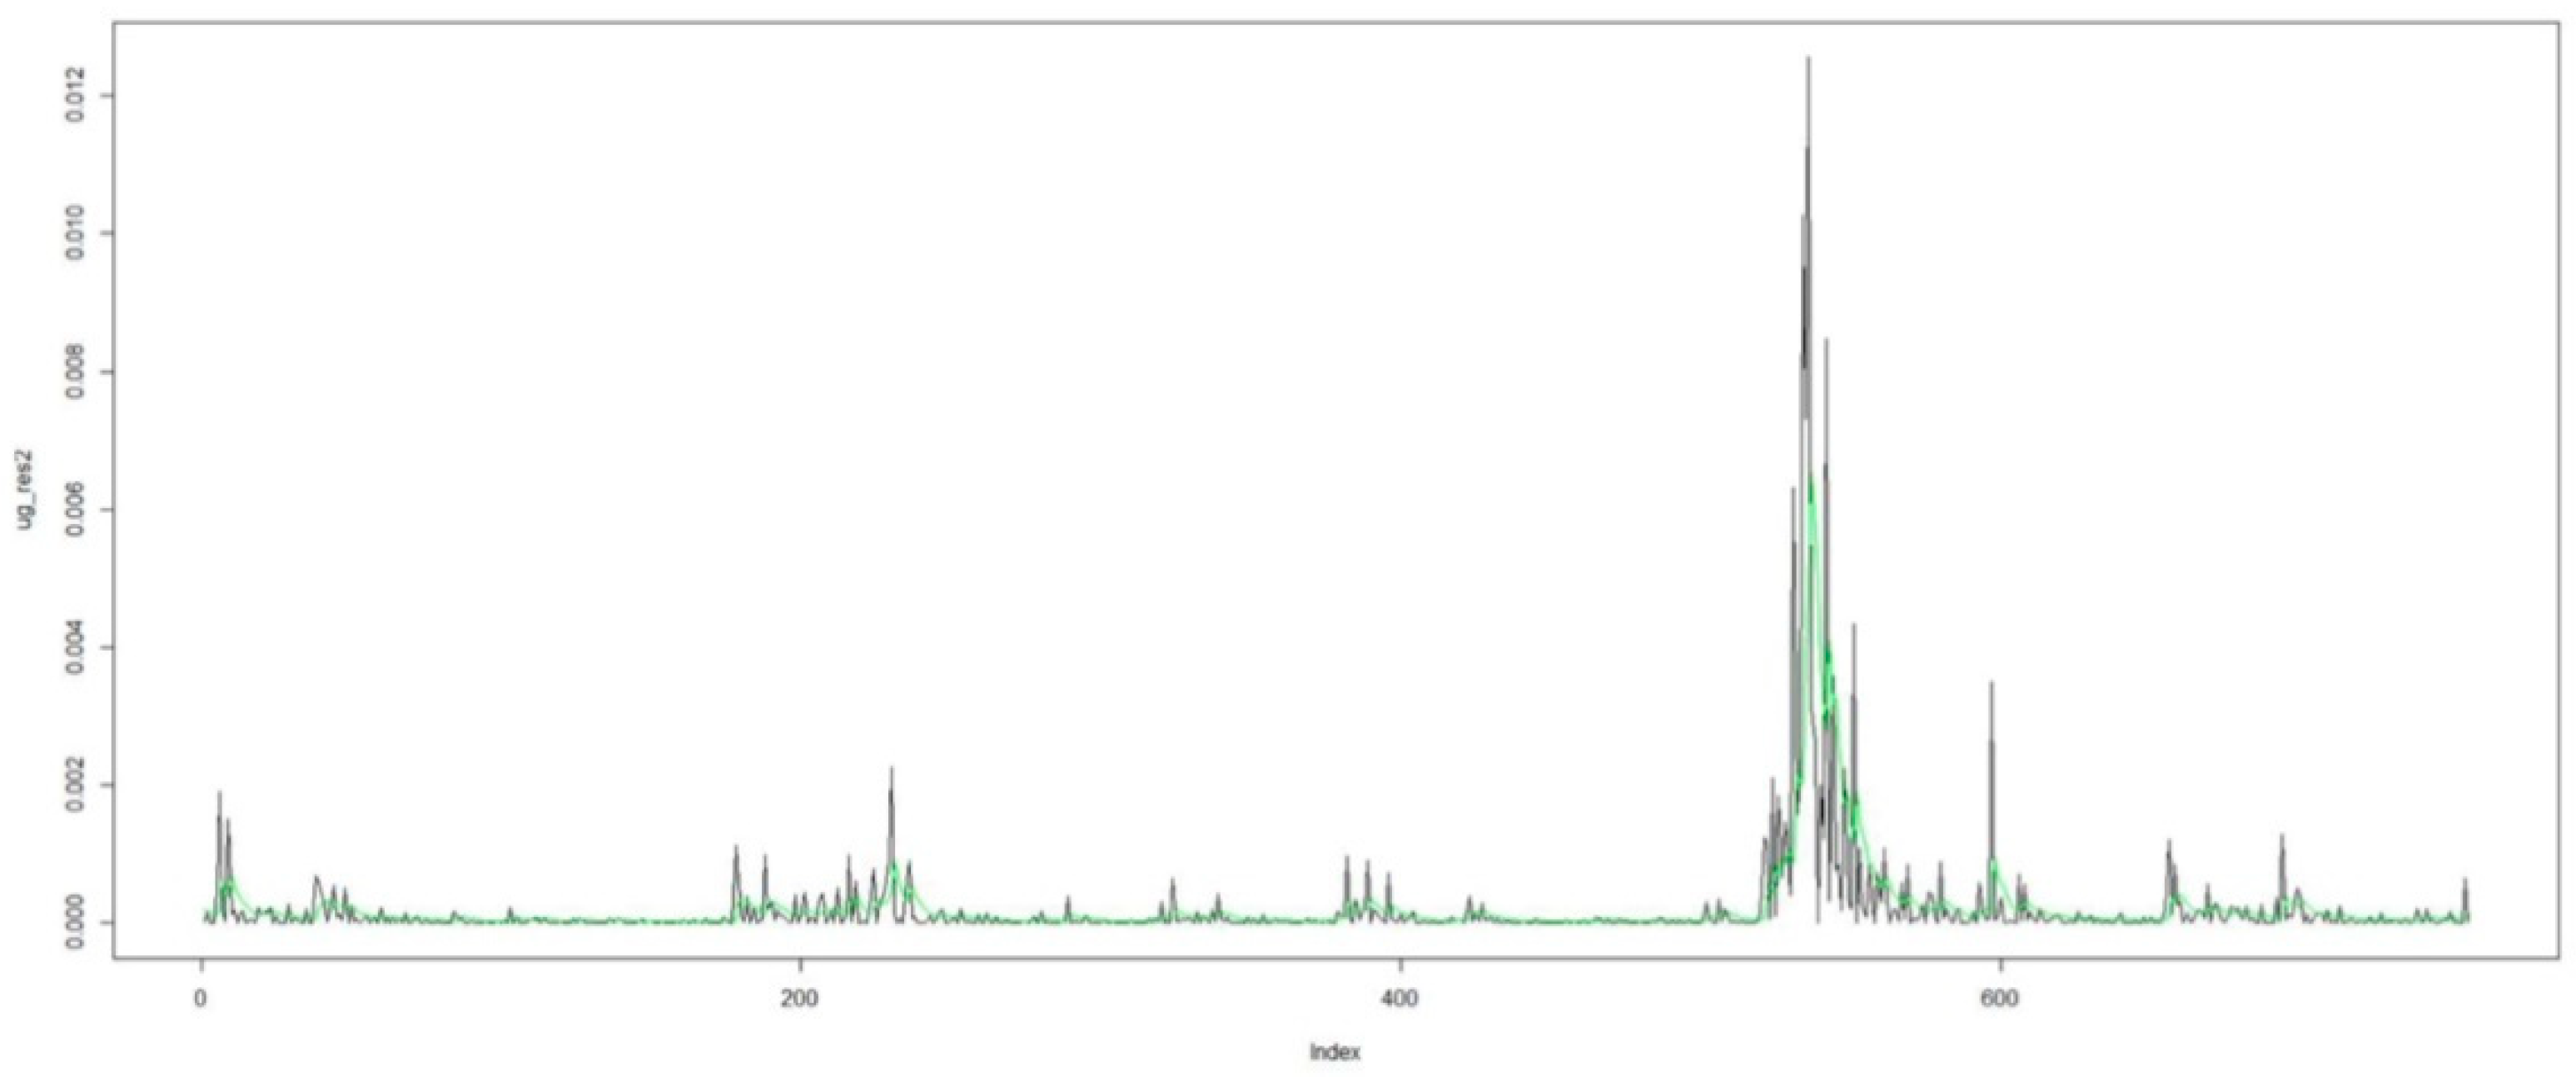
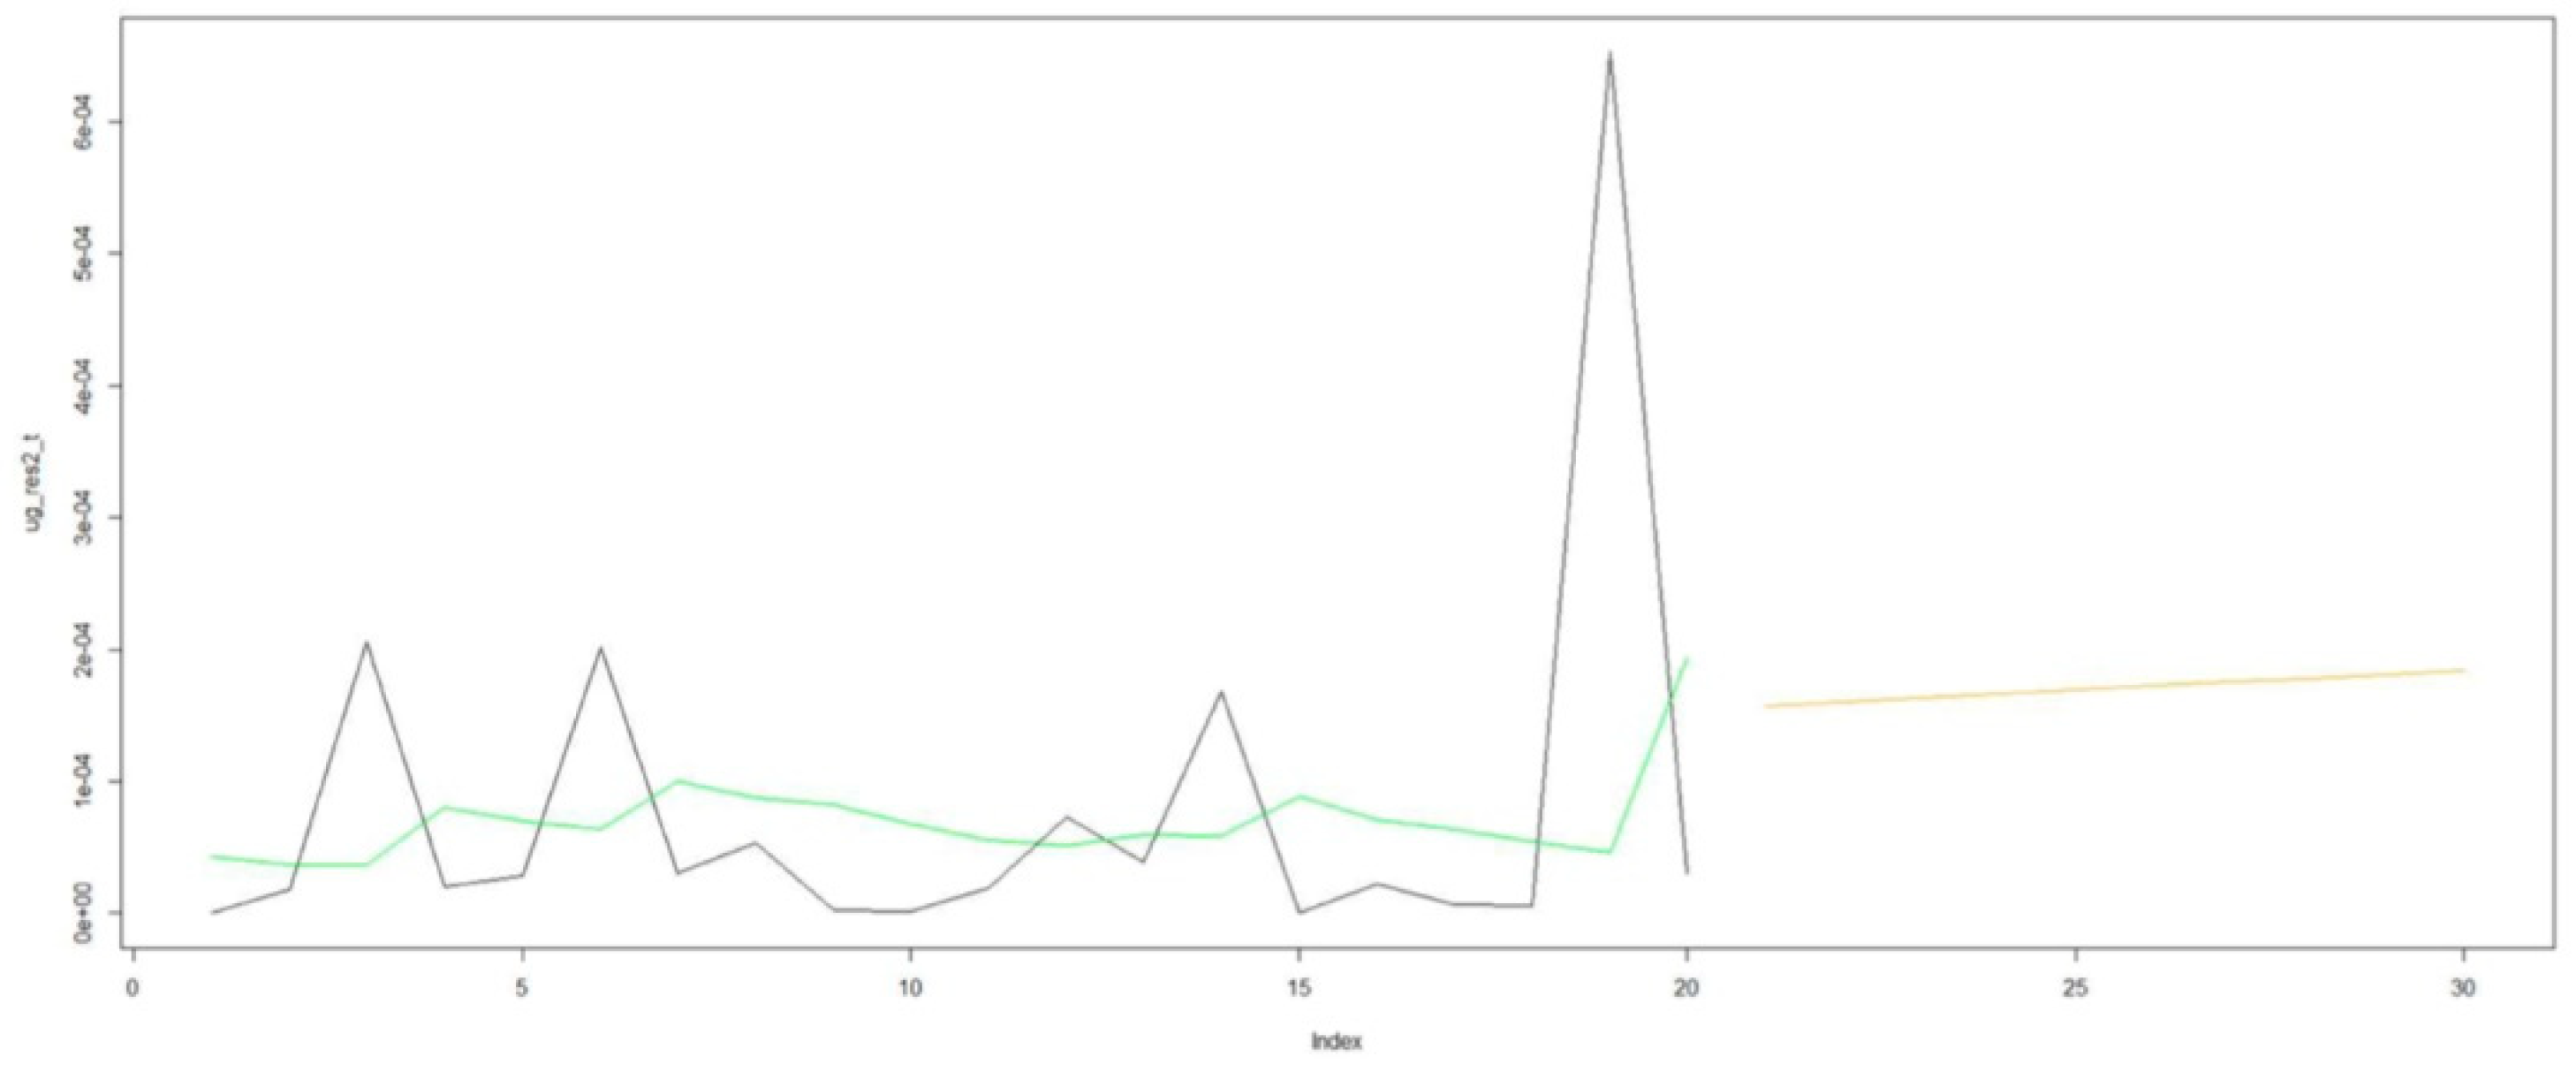
6.5. Individual Assets
- Green = Last estimated conditional variance.
- Orange = Forecast of conditional variance.
- Black = Squared residuals of the last 20 observations.
- Sigma Volatility forecasts (10 periods).
6.6. Interpretation of Individual Figures
7. Summary of Results
8. Conclusions, Limitations and Recommendations
Author Contributions
Funding
Conflicts of Interest
References
- Acharya, Sunayan, and Jessica Dunn. 2014. Overstock. com ventures into digital currencies. Journal of Business Cases and Applications 12: 1. [Google Scholar]
- Amadeo, Kimberly, and J. Michael Boyle. 2020. US national debt by year compared to GDP and major events. The Balance 1: 1. Available online: https://www.thebalance.com/national-debt-by-year-compared-to-gdp-and-major-events-3306287 (accessed on 10 August 2021).
- Andersen, Torben G., and Tim Bollerslev. 1988. Answering the skeptics: Yes, standard volatility models do provide accurate forecasts. International Economic Review 39: 885–905. [Google Scholar] [CrossRef]
- Andersson-Säll, Tim, and Johan Lindskog. 2019. A Study on the DCC Garch Model’s Forecasting Ability with value at risk applications on the Scandinavian foreign exchange market. Available online: http://urn.kb.se/resolve?urn=urn:nbn:se:uu:diva-375201 (accessed on 8 July 2021).
- Antonakakis, Nikolaos, and Julia Darby. 2013. Forecasting volatility in developing countries’ nominal exchange returns. Applied Financial Economics 23: 1675–91. [Google Scholar] [CrossRef]
- Alotaibi, Sara Jeza. 2021. Using Blockchain for Smart Contracts. In Innovative and Agile Contracting for Digital Transformation and Industry IGI Global 4: 208–221. [Google Scholar]
- Bauwens, Luc, Sébastien Laurent, and Jeroen VK Rombouts. 2006. Multivariate GARCH models: A survey. Journal of Applied Econometrics 21: 79–109. [Google Scholar] [CrossRef] [Green Version]
- Bianchi, Daniele, Luca Rossini, and Matteo Iacopini. 2020. Stablecoins and cryptocurrency returns: Evidence from large bayesian vars. SSRN. [Google Scholar] [CrossRef]
- Bohte, Rick, and Luca Rossini. 2019. Comparing the forecasting of cryptocurrencies by bayesian time-varying volatility models. Journal of Risk and Financial Management 12: 150. [Google Scholar] [CrossRef] [Green Version]
- Borradaile, Glencora. 2021. Defend Dissent. Corvallis: Oregon State University. [Google Scholar]
- Bouri, Elie, Peter Molnár, Georges Azzi, David Roubaud, and Lars Ivar Hagfors. 2017. On the hedge and safe haven properties of Bitcoin: Is it really more than a diversifier? Finance Research Letters 20: 192–98. [Google Scholar] [CrossRef]
- Bouri, Elie, Syed Jawad Hussain Shahzad, David Roubaud, Ladislav Kristoufek, and Brian Lucey. 2020. Bitcoin, gold, and commodities as safe havens for stocks: New insight through wavelet analysis. The Quarterly Review of Economics and Finance 77: 156–64. [Google Scholar] [CrossRef]
- Boyapati, Vijay. 2018. The Bullish Case for Bitcoin. Available online: https://vijayboyapati.medium.com/the-bullish-case-for-bitcoin-6ecc8bdecc1 (accessed on 3 July 2021).
- Breedlove, Robert. 2019. An Open Letter to Ray Dalio: Bitcoin. Available online: https://breedlove22.medium.com/an-open-letter-to-ray-dalio-re-bitcoin-4b07c52a1a98 (accessed on 7 July 2021).
- Brownlees, Christian T., Robert F. Engle, and Bryan T. Kelly. 2011. A practical guide to volatility forecasting through calm and storm. SSRN. [Google Scholar] [CrossRef] [Green Version]
- Catania, Leopoldo, Stefano Grassi, and Francesco Ravazzolo. 2019. Forecasting cryptocurrencies under model and parameter instability. International Journal of Forecasting 35: 485–501. [Google Scholar] [CrossRef]
- Cermak, Vavrinec. 2017. Can bitcoin become a viable alternative to fiat currencies? An empirical analysis of bitcoin’s volatility based on a GARCH model. In An Empirical Analysis of Bitcoin’s Volatility Based on a GARCH Model. New York: Skidmore College. [Google Scholar]
- Chen, Weili, Jun Wu, Zibin Zheng, Chuan Chen, and Yuren Zhou. 2019. Market manipulation of bitcoin: Evidence from mining the Mt. Gox transaction network. Paper presented at IEEE INFOCOM 2019-IEEE Conference on Computer Communications, Paris, France, April 29–May 2; pp. 964–72. [Google Scholar]
- Clegg, Alastair G. 2014. Could Bitcoin Be a Financial Solution for Developing Economies. Birmingham: University of Birmingham, vol. 1, pp. 2013–14. [Google Scholar]
- Connors, Louisa, and William Mitchell. 2017. Framing modern monetary theory. Journal of Post Keynesian Economics 40: 239–59. [Google Scholar] [CrossRef]
- Corbet, Shaen, Brian Lucey, Andrew Urquhart, and Larisa Yarovaya. 2019. Cryptocurrencies as a financial asset: A systematic analysis. International Review of Financial Analysis 62: 182–99. [Google Scholar] [CrossRef] [Green Version]
- Cuñado, Jorge Hernando, Jorge Colvin Díez, and Javier Antonio Enríquez Román. 2020. Engie: Business Model Transformation. Harvard Deusto Business Research 9: 152–67. [Google Scholar] [CrossRef]
- Datta, Anwitaman, Sonja Buchegger, Le-Hung Vu, Thorsten Strufe, and Krzysztof Rzadca. 2010. Decentralized online social networks. In Handbook of Social Network Technologies and Applications. Boston: Springer, pp. 349–78. [Google Scholar]
- Davidson, Laura, and Walter E. Block. 2015. Bitcoin, the Regression Theorem, and the emergence of a new medium of exchange. Quarterly Journal of Austrian Economics 18: 311. [Google Scholar]
- De Grauwe, Paul. 1988. Exchange rate variability and the slowdown in growth of international trade. Staff Papers 35: 63–84. [Google Scholar] [CrossRef]
- Dutta, Anupam, Debojyoti Das, R. K. Jana, and Xuan Vinh Vo. 2020. COVID-19 and oil market crash: Revisiting the safe haven property of gold and Bitcoin. Resources Policy 69: 101816. Available online: https://www.sciencedirect.com/science/article/abs/pii/S0301420720308485 (accessed on 10 August 2021). [CrossRef]
- Dyhrberg, Anne Haubo. 2016a. Bitcoin, gold and the dollar–A GARCH volatility analysis. Finance Research Letters 16: 85–92. [Google Scholar] [CrossRef] [Green Version]
- Dyhrberg, Anne Haubo. 2016b. Hedging capabilities of bitcoin. Is it the virtual gold? Finance Research Letters 16: 139–44. [Google Scholar] [CrossRef] [Green Version]
- Elliott, Colin P. 2015. The Crisis of AD 33: Past and present. Journal of Ancient History 3: 267–81. [Google Scholar] [CrossRef]
- Engel, Charles, and Kenneth D. West. 2005. Exchange rates and fundamentals. Journal of Political Economy 113: 485–517. [Google Scholar] [CrossRef] [Green Version]
- Engle, Robert F. 1982. Autoregressive conditional heteroscedasticity with estimates of the variance of United Kingdom inflation. Econometrica: Journal of the Econometric Society, 987–1007. [Google Scholar] [CrossRef]
- Engle, Robert. 2002. Dynamic conditional correlation: A simple class of multivariate generalized autoregressive conditional heteroskedasticity models. Journal of Business & Economic Statistics 20: 339–50. [Google Scholar]
- Frino, Alex, Steven Lecce, and Reuben Segara. 2011. The impact of trading halts on liquidity and price volatility: Evidence from the Australian Stock Exchange. Pacific-Basin Finance Journal 19: 298–307. [Google Scholar] [CrossRef]
- Fröhlich, Michael, Maurizio Raphael Wagenhaus, Albrecht Schmidt, and Florian Alt. 2021. Don’t Stop Me Now! Exploring Challenges of First-Time Cryptocurrency Users. Paper presented at Designing Interactive Systems Conference, Online, June 21–July 1; pp. 138–48. [Google Scholar]
- Fukami, Aya, Radina Stoykova, and Zeno Geradts. 2021. A new model for forensic data extraction from encrypted mobile devices. Forensic Science International: Digital Investigation 38: 301169. [Google Scholar]
- Garman, Mark B., and Michael J. Klass. 1980. On the estimation of security price volatilities from historical data. Journal of business 53: 67–78. [Google Scholar] [CrossRef]
- Ghalanos, Alexios. 2019. The RMGARCH Models: Background and Properties. Version 1.3–0. Available online: https://mran.microsoft.com (accessed on 19 June 2021).
- Griffin, John M., and Amin Shams. 2020. Is Bitcoin really untethered? The Journal of Finance 75: 1913–64. [Google Scholar] [CrossRef]
- Grinberg, Reuben. 2011. Bitcoin: An innovative alternative digital currency. Hastings Science & Technology Law Journal 4: 160. [Google Scholar]
- Gronwald, Marc. 2014. The Economics of Bitcoins—Market Characteristics and Price Jumps. Available online: https://ssrn.com/abstract=2548999 (accessed on 2 June 2021).
- Hansen, Peter R., and Asger Lunde. 2005. A forecast comparison of volatility models: Does anything beat a GARCH (1, 1)? Journal of Applied Econometrics 20: 873–89. [Google Scholar] [CrossRef] [Green Version]
- Hatemi-J., Abdulnasser, Mohamed A. Hajji, Elie Bouri, and Rangan Gupta. 2019. The Benefits of Diversification between Bitcoin, Bonds, Equities and the US Dollar: A Matter of Portfolio Construction. No. 201959. Pretoria: University of Pretoria. [Google Scholar]
- Hayek, Friedrich August. 1976. Choice in Currency: A Way to Stop Inflation. Auburn: Ludwig von Mises Institute. [Google Scholar]
- Hossain, Md Jamal, Mohd Tahir Ismail, Sadia Akter, and Mohammad Raquibul Hossain. 2020. Which will serve better as a hedge or diversifier Gold or Bitcoin? Paper presented at 2020 International Conference on Decision Aid Sciences and Application (DASA), Online, November 8–9; pp. 1052–55. [Google Scholar]
- Jareño, Francisco, María de la O González, Marta Tolentino, and Karen Sierra. 2020. Bitcoin and gold price returns: A quantile regression and NARDL analysis. Resources Policy 67: 101666. [Google Scholar] [CrossRef]
- Jiang, Yonghong, Jiayi Lie, Jieru Wang, and Jinqi Mu. 2021. Revisiting the roles of cryptocurrencies in stock markets: A quantile coherency perspective. Economic Modelling 95: 21–34. [Google Scholar] [CrossRef]
- Jones, Paul, and Lorenzo Giorgianni. 2020. The Great Monetary Inflation. Market Outlook—Macro Perspective. Available online: coinvertit.com (accessed on 15 May 2021).
- Kelly, Brian. 2014. The Bitcoin Big Bang: How Alternative Currencies Are about to Change the World. Hoboken: John Wiley & Sons. [Google Scholar]
- Kim, Jung. 2021. Most Traded National Currencies for Bitcoin. Coinhills. Available online: https://www.coinhills.com/market/currency/ (accessed on 13 March 2021).
- Klein, Tony, Hien Pham Thu, and Thomas Walther. 2018. Bitcoin is not the New Gold–A comparison of volatility, correlation, and portfolio performance. International Review of Financial Analysis 59: 105–16. [Google Scholar] [CrossRef]
- Kliber, Agata, Paweł Marszałek, Ida Musiałkowska, and Katarzyna Świerczyńska. 2019. Bitcoin: Safe haven, hedge or diversifier? Perception of bitcoin in the context of a country’s economic situation—A stochastic volatility approach. Physica A: Statistical Mechanics and Its Applications 524: 246–57. [Google Scholar] [CrossRef]
- Knafo, Samuel. 2006. The gold standard and the origins of the modern international monetary system. Review of International Political Economy 13: 78–102. [Google Scholar] [CrossRef]
- Küfeoglu, Sinan, and Mahmut Özkuran. 2019. Energy Consumption of Bitcoin Mining. Available online: repository.cam.ac.uk (accessed on 2 July 2021).
- Kurtz, Marcus J., and Andrew Schrank. 2007. Growth and governance: Models, measures, and mechanisms. The Journal of Politics 69: 538–54. [Google Scholar] [CrossRef]
- Lamport, Leslie, Robert Shostak, and Marshall Pease. 2019. The Byzantine generals problem. Concurrency: The Works of Leslie Lamport 1: 203–26. [Google Scholar]
- Laurent, Sébastien, Jeroen V.K. Rombouts, and Francesco Violante. 2012. On the forecasting accuracy of multivariate GARCH models. Journal of Applied Econometrics 27: 934–55. [Google Scholar] [CrossRef] [Green Version]
- Lavoie, Marc. 2014. Post-Keynesian Economics: New Foundations. Cheltenham: Edward Elgar Publishing. [Google Scholar]
- Leerssen, Joep. 2021. Culture, humanities, evolution: The complexity of meaning-making over time. Philosophical Transactions of the Royal Society B 376: 20200043. [Google Scholar] [CrossRef]
- Luther, William J., and Alexander W. Salter. 2017. Bitcoin and the bailout. The Quarterly Review of Economics and Finance 66: 50–56. [Google Scholar] [CrossRef]
- Maddox, Alexia, and Luke J. Heemsbergen. 2021. Digging in Crypto-Communities’ Future-Making: From Dark to Doge. M/C Journal 24. [Google Scholar] [CrossRef]
- Masters, Jered. 2019. Impact of the 2020 Bitcoin Halving: A Mathematical, Social, and Econometric Analysis, Bitcoin 2020 Having Impact Analysis. Bentley: Curtin University. [Google Scholar]
- Mokni, Khaled, Elie Bouri, Ahdi Noomen Ajmi, and Xuan Vinh Vo. 2021. Does Bitcoin Hedge Categorical Economic Uncertainty? A Quantile Analysis. Thousand Oaks: SAGE Open. [Google Scholar]
- Nabilou, Hossein. 2020. Testing the waters of the Rubicon: The European Central Bank and central bank digital currencies. Journal of Banking Regulation 21: 299–314. [Google Scholar] [CrossRef]
- Nakamoto, Satoshi. 2009. Bitcoin: A peer-to-peer electronic cash system Bitcoin: A Peer-to-Peer Electronic Cash System. Bitcoin. org. Available online: https://bitcoin.org/en/bitcoin-paper (accessed on 19 March 2021).
- Nugroho, Bayu Adi. 2021. Dynamic risk-based optimization on cryptocurrencies. Journal of Capital Markets Studies. [Google Scholar] [CrossRef]
- Orskaug, Elisabeth. 2009. Multivariate DCC Garch Model: With Various Error Distributions. Master’s Dissertation, Aalborg University, Aalborg, Denmark. [Google Scholar]
- Peterson, Timothy. 2018. Metcalfe’s Law as a Model for Bitcoin’s Value. Alternative Investment Analyst Review Q 7: 9–18. [Google Scholar] [CrossRef]
- Philipson, Sarah. 2020. Consumers and enterprises as actors on the market. Harvard Deusto Business Research 9: 168–80. [Google Scholar] [CrossRef]
- Ponticelli, Jacopo, and Hans Joachim Voth. 2011. Austerity and Anarchy: Budget Cuts and Social Unrest in Europe, 1919–2008. Masters dissertation, Pompeu Fabra University, Barcelona, Spain; p. 10230. [Google Scholar]
- Poon, Ser-Huang. 2005. A Practical Guide to Forecasting Financial Market Volatility. Hoboken: John Wiley & Sons. [Google Scholar]
- Putnam, Blu. 2020. The Fed’s Balance Sheet Will Continue to Grow in 2021. Chicago: CME Group. [Google Scholar]
- Regaieg, Rym, Wajdi Moussa, and Nidhal Mgadmi. 2020. Can We Reckon Bitcoin as a Hedge, a Safe Haven or a Diversifier for US Dollars? Global Business Review. [Google Scholar] [CrossRef]
- Rosales, Antulio. 2021. Unveiling the power behind cryptocurrency mining in Venezuela: A fragile energy infrastructure and precarious labor. Energy Research & Social Science 79: 102167. [Google Scholar]
- Rozas, David, Antonio Tenorio-Fornés, Silvia Díaz-Molina, and Samer Hassan. 2021. When Ostrom Meets Blockchain: Exploring the Potentials of Blockchain for Commons Governance. Thousand Oaks: SAGE Open. [Google Scholar]
- Scott, Brett, John Loonam, and Vikas Kumar. 2017. Exploring the rise of blockchain technology: Towards distributed collaborative organizations. Strategic Change 26: 423–28. [Google Scholar] [CrossRef]
- Selmi, Refk, Walid Mensi, Shawkat Hammoudeh, and Jamal Bouoiyour. 2018. Is Bitcoin a hedge, a safe haven or a diversifier for oil price movements? A comparison with gold. Energy Economics 74: 787–801. [Google Scholar] [CrossRef]
- Senge, Peter M., Bryan Smith, Nina Kruschwitz, Joe Laur, and Sara Schley. 2008. The Necessary Revolution: How Individuals and Organizations Are Working together to Create a Sustainable World. Redfern: Currency. [Google Scholar]
- Shahzad, Syed Jawad Hussain, Elie Bouri, David Roubaud, Ladislav Kristoufek, and Brian Lucey. 2019. Is Bitcoin a better safe-haven investment than gold and commodities? International Review of Financial Analysis 63: 322–30. [Google Scholar] [CrossRef]
- Smales, Lee A. 2019. Bitcoin as a safe haven: Is it even worth considering? Finance Research Letters 30: 385–93. [Google Scholar] [CrossRef]
- Stensås, Anders, Magnus Frostholm Nygaard, Khine Kyaw, and Sirimon Treepongkaruna. 2019. Can Bitcoin be a diversifier, hedge or safe haven tool? Cogent Economics & Finance 7: 1593072. [Google Scholar]
- Stevens, Amy, and James Allen-Robertson. 2021. Encrypting human rights: The intertwining of resistant voices in the UK state surveillance debate. Big Data & Society 8: 2053951720985304. [Google Scholar]
- Stross, Randall. 2012. What’s Coming Out of Silicon Valley. The New York Times, June 19. [Google Scholar]
- Szabo, Nick. 2002. Shelling Out. Satoshi Nakamoto Institute. Available online: https://nakamotoinstitute.org/shelling-out (accessed on 23 February 2021).
- Takaishi, Tetsuya. 2020. Rough volatility of Bitcoin. Finance Research Letters 32: 101379. [Google Scholar] [CrossRef]
- Takemoto, Yoshifumi, and Sophie Knight. 2014. Mt. Gox files for bankruptcy, hit with lawsuit. Reuters Accessed January 4: 2018. [Google Scholar]
- Tsertsvadze, Vano, and Lali Khurtsia. 2015. Drugs, Silk Road, Bitcoins. WASET World Academy 17: 3612–15. [Google Scholar]
- Umar, Muhammad, Chi-Wei Su, Syed Kumail Abbas Rizvi, and Xue-Feng Shao. 2021. Bitcoin: A safe haven asset and a winner amid political and economic uncertainties in the US? Technological Forecasting and Social Change 167: 120680. [Google Scholar] [CrossRef]
- Wang, Gangjin, Yanping Tang, Chi Xie, and Shou Chen. 2019. Is bitcoin a safe haven or a hedging asset? Evidence from China. Journal of Management Science and Engineering 4: 173–88. [Google Scholar] [CrossRef]
- Wang, Gang-Jin, Xin-yu Ma, and Hao-yu Wu. 2020. Are stablecoins truly diversifiers, hedges, or safe havens against traditional cryptocurrencies as their name sug-gests? Research in International Business and Finance 54: 101225. [Google Scholar] [CrossRef]
- Wray, L. Randall. 2015. Modern Money Theory: A Primer on Macroeconomics for Sovereign Monetary Systems, 2nd ed. New York: Springer. [Google Scholar]
- Yermack, David. 2015. Is Bitcoin a Real Currency? An Economic Appraisal. In Handbook of Digital Currency. Amsterdam: Academic Press, pp. 31–43. [Google Scholar]
- Zhang, Yue-Jun, Elie Bouri, Rangan Gupta, and Shu-Jiao Ma. 2021. Risk spillover between Bitcoin and conventional financial markets: An expectile-based approach. The North American Journal of Economics and Finance 55: 101296. [Google Scholar] [CrossRef]
- Zhao, Haidong, and Lini Zhang. 2021. Financial literacy or investment experience: Which is more influential in cryptocurrency investment? International Journal of Bank Marketing. [Google Scholar] [CrossRef]


| Variable | Coefficient (Standard Error) |
|---|---|
| Distribution and Model | Mvnorm (Multi Variate Normal Distribution) and DCC (Dynamic Conditional Correlation) (1.1) |
| No. of parameters | 20 |
| [VAR (Vector Auto Regression) GARCH DCC (Dynamic Conditional Correlation) UncQ] | [0 + 15 + 2 + 3] |
| No. of Series | 3 |
| No. of Observations | 756 |
| Log likelihood | 6128.491 |
| Av. Log likelihood | 8.11 |
| Information Criteria | |
| Akaike | −16.160 |
| Bayes | −16.038 |
| Shibata | −16.161 |
| Hannah Quinn | −16.113 |
| Variable | GBTC (Grayscale Bitcoin Trust Fund) | VOO (Vanguard 500 Index Fund) | GLD (Gold) |
|---|---|---|---|
| Mu (mean) | 0.002025 | 0.001096 | 0.000135 |
| AR1 (coefficient of the mean model) | −0.020731 | −0.069730 | −0.019810 |
| Omega | 0.000345 | 0.000004 | 0.000004 |
| Alpha1 (coefficient to the squared residuals) | 0.119798 | 0.235647 | 0.105659 |
| Beta1 (coefficient to the lagged variance) | 0.775774 | 0.756135 | 0.859825 |
| Dcca1 | 0.028476 | 0.028476 | 0.028476 |
| Dccb1 | 0.951253 | 0.951253 | 0.951253 |
| Tickers | GBTC | VOO | GLD |
|---|---|---|---|
| GBTC | 1.00000000 | 0.07248292 | 0.11428288 |
| VOO | 0.07248292 | 1.00000000 | 0.08309941 |
| GLD | 0.11428288 | 0.08309941 | 1.00000000 |
Publisher’s Note: MDPI stays neutral with regard to jurisdictional claims in published maps and institutional affiliations. |
© 2021 by the authors. Licensee MDPI, Basel, Switzerland. This article is an open access article distributed under the terms and conditions of the Creative Commons Attribution (CC BY) license (https://creativecommons.org/licenses/by/4.0/).
Share and Cite
Rudolf, K.O.; Ajour El Zein, S.; Lansdowne, N.J. Bitcoin as an Investment and Hedge Alternative. A DCC MGARCH Model Analysis. Risks 2021, 9, 154. https://doi.org/10.3390/risks9090154
Rudolf KO, Ajour El Zein S, Lansdowne NJ. Bitcoin as an Investment and Hedge Alternative. A DCC MGARCH Model Analysis. Risks. 2021; 9(9):154. https://doi.org/10.3390/risks9090154
Chicago/Turabian StyleRudolf, Karl Oton, Samer Ajour El Zein, and Nicola Jackman Lansdowne. 2021. "Bitcoin as an Investment and Hedge Alternative. A DCC MGARCH Model Analysis" Risks 9, no. 9: 154. https://doi.org/10.3390/risks9090154