Article

Value-Based Financial Risk Prediction Model

by
Jiří Pospíšil
,
Nataša Matulayová
,
Pavla Macháčková
,
Pavlína Jurníčková
,
Ivana Olecká
* and
Helena Pospíšilová
Department of Christian Social Work, Sts Cyril and Methodius Faculty of Theology, Palacký University Olomouc, Na Hradě 5, 779 00 Olomouc, Czech Republic
*
Author to whom correspondence should be addressed.
Risks 2021, 9(11), 205; https://doi.org/10.3390/risks9110205
Submission received: 15 September 2021 / Revised: 29 October 2021 / Accepted: 9 November 2021 / Published: 11 November 2021

Abstract

:
The model of financial risk prediction we developed and present in our paper is based on the theoretical assumption that there exists a significant relationship between actual economic situation and values. This assumption confirmed by the research influences the potential risk in financial behaviour and it becomes actual especially in the case of changing life conditions. The concept of the model is based on data received from 3768 respondents questioned across the Czech Republic. Measured variables were indexed, and the cluster and factor analyses were used for multivariate analysis. The model is unique in the combination of personal values projected into six generalized value types and developed economic indexes clustered in four types of economic situations. The primary purpose of the model is to identify the anticipated personal financial risk of clients. The model has fundamental applications as a diagnostic or auto-diagnostic tool in social work, counselling, psychotherapy, and other helping professions, or as a research instrument leading to various hypotheses and to the enhancement of theories concerning economic behaviour.

Graphical Abstract

1. Introduction

The value-based financial risk prediction model presented in this paper is based on a theoretical assumption that, out of all factors influencing human financial decisions, the most important are values and economic situations. This led us to design the four components—financial responsibility (van Raaij 2016; Xiao et al. 2014), financial well-being (Sirgy 2018; Strömbäck et al. 2017), financial knowledge (Hung et al. 2009; Nejad and Javid 2018) and value types (Spranger 1921; Rokeach 1973; Schwartz and Bilsky 1990). The first three components describe three key aspects of the actual economic situation of an individual.

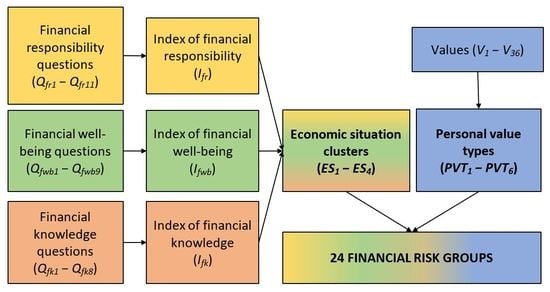
The Idea of a Financial Risk Prediction Model

The power of the financial risk prediction model is in the combination of two key factors—values and economic situation, recognized in the introduction as two of the most important factors influencing financial decision-making.
This model will enable helping professionals to:
  • distinguish an individual’s economic situation and value type and predict his/her financial risk,
  • to follow with either preventive measures or appropriate intervention.
The presented model is not only profiling (as it allows professionals to identify the type of client based on their economic situation and value type), but it also gives helping professionals the possibility to predict the risk of poor financial decision making, leading to a worsening of the living situation of a client.
The motivation behind this paper was our theoretical assumption that values and economic behaviour influence each other, and this influence is statistically significant. Our first research aim was to confirm this influence. Further, we understood that this relationship between values and economic behaviour could be implemented in form of a model, usable as a diagnostic tool in the practice of social work, counselling, social pedagogy, psychology, and other helping professions. Part of our motivation was our endeavour to translate our logical model building knowledge in the practice and our aspiration to fill the gap between theory and practice in the field of diagnosis in helping professions. While doing a literature review for this paper, we realized how big the lack of logical model building in social sciences is and how slowly modelling habits in social sciences are changing (Taagepera 2008). Helping professions could benefit significantly from statistical modelling—exploring the possible relationships between variables through simple and partial correlations, transformed into a useful specific mathematically oriented equation-based model. The expansion of different modelling approaches in helping professions is one of the challenges researchers and practitioners need to deal with.
Our model can be transformed into a practical, user-friendly application for helping professionals and it can serve as a diagnostic tool in case they need to predict their client’s financial risk. Precise diagnosis serves as a guiding tool for helping professionals to choose the most effective intervention. Choosing the interventions from which an individual can benefit the most and in possibly the shortest period of time, translates into cost-effectiveness in all helping professions (Dew et al. 2020).

2. Literature Review

Financial responsibility is not defined strictly; most definitions come from the fields of business finance and business ethics. In general, people, able to consider their income and determine how much of that income would be appropriate to allocate to expenses, are considered financially responsible (van Raaij 2016).
We assume that financially responsible people know where their money is going; they have a financial budget, so they know exactly what they can afford to buy and what they should not buy, what they need, or what they do not need. Being financially responsible means creating a financial reserve, spending less money than an individual can earn (van Raaij 2016) and in case of debt to fulfill financial obligations. Financially responsible individuals are not afraid to seek help and advice when they need it. According to Fan (2021) financial advice-seeking behaviour is closely related to age and short- and long-term financial behaviour. It is not rare that financially responsible individuals also let their wealth grow, so they use any wealth-building strategy to become financially independent.
A critical component, which determines personal and household financial decisions, including investment in risky assets, is also risk tolerance (Xiao et al. 2001). Risk tolerance is a person’s attitude towards accepting risk (Hallahan et al. 2004). It can be described as the level of a person’s loss he/she is prepared to handle. Factors such as gender, age, marital status, occupation, income may influence a person’s level of risk-taking (Fisher 2009; Yao et al. 2011; Jacobs-Lawson and Hershey 2005; Grable 2000). Financial risk tolerance is also a significant predictor of investment and saving strategies (Jacobs-Lawson and Hershey 2005). Wealthy individuals can easily afford the losses resulting from a risky investment and their accumulated wealth can reflect their preferred level of risk. However, wealthy people may be more conservative with their money than people with low levels of personal wealth who may view risky investments as a form of a lottery ticket (Hallahan et al. 2004).
For the purpose of our paper, we understand financial responsibility as one of the components of financial behaviour. According to our opinion, financial behaviour is related to financial decisions, which people make and are strongly connected with their needs. Good financial decisions go hand in hand with responsible behaviour. Financial behaviour is closely connected with financial capability (Xiao et al. 2014). Taylor (2011) defines financial capability as people’s ability to manage their money and to take control of their finances. We see connections between financial responsibility and financial capability in the sense that financially responsible individuals are usually also financially capable individuals. Last but not least, responsible financial behaviour improves personal financial well-being (van Raaij 2016). Money attitudes play a key role in financial risk tolerance, thus in financial well-being (Castro-González et al. 2020).
Understanding how to borrow, spend and save is one of the keys to individual, family and community well-being (Williams and Satchell 2011). To sustain life quality, perceived by an individual as optimal, financial decision-making should be responsible, in order to avoid financial risks, leading to the worsening of an individual’s living situation. There is an expanding offer of complex financial services and products people are challenged to understand and use every day (Lind et al. 2020).
Well-being is a complex phenomenon which can be understood and measured through its three pillars—material living conditions (or economic well-being), quality of life and the sustainability of the socio-economic and natural systems (OECD 2013). Academics agree on the importance of material or financial well-being to overall human well-being. There are three components always present in considering material or financial well-being—income, consumption and wealth (Sirgy 2018). Well-being of an individual can be changed in case of any life crises, expected or unexpected. To sustain desired well-being, an individual’s financial decision-making will be mostly influenced by value preferences.
Financial well-being can be described as peoples’ own perspectives on their financial situation (Strömbäck et al. 2017). It relates to health (Kim et al. 2003; Arber et al. 2014) and psychological well-being (Netemeyer et al. 2018). Some authors (Lind et al. 2020; Netemeyer et al. 2018) divide financial well-being into two parts: 1. financial anxiety, which corresponds to the present financial situation and 2. financial security, which corresponds to the future financial situation.
We assume that financial well-being is closely linked to financial responsibility (van Raaij 2016) and financial knowledge (Taft et al. 2013). With sufficient financial knowledge and financial responsibility, there is a bigger chance for individuals to be financially independent, happier and satisfied. Lack of financial knowledge and financial responsibility can lead to risky behaviour and can have negative effects on an individual’s wealth.
Fundamental financial knowledge is defined as a central component of financial literacy (Hung et al. 2009; Nejad and Javid 2018). The interest of researchers in financial literacy has recently grown—the concept crosses many diverse fields of the social sciences (Williams and Satchell 2011). Many studies try to explicate the concept of financial literacy and how it can be measured and as a result, financial literacy is defined in many different ways (Hung et al. 2009; Mudzingiri et al. 2018; Ouachani et al. 2021; Remund 2010; Vural and Beichar 2020).
The conceptual definitions of financial literacy and its components vary from:
  • the most basic understanding of “a person’s competency for managing money”, “financial knowledge, perceived knowledge, financial behaviour and financial skills” and “understanding market principles, instruments, organizations and regulations”;
  • through “familiarity with basic economic principles, knowledge of national economy and understanding of key economic terms”;
  • to “familiarity with the most basic economic concepts needed to make sensible saving and investment decisions” (Hung et al. 2009; Remund 2010).
Whatever definition is chosen, there are three essential factors interrelated—knowledge, experience and attitude in each of them (Hogarth and Hilgert 2002).
Individuals, trying to improve their welfare need to be financially literate, thus be able to use their financial knowledge (Mudzingiri et al. 2018). Based on our knowledge we are able to make informed decisions. With lower levels of knowledge, one may consider it difficult to make the right choice due to the potential for a mistake or simply confusion (Ellen 1994). On the other hand, having financial knowledge and being able to apply it are very different things (Blue and Grootenboer 2019).
With reference to our financial risk prediction model, we were working with the concept of objective financial knowledge, which is being described as a competence, and can be assessed by using knowledge-based questions—standard financial literacy test questions (Lind et al. 2020; Lusardi 2012).
There are many studies on measuring objective knowledge; the knowledge scales were developed to assess either very broad levels of knowledge or a more specific knowledge. Published research and studies show a positive correlation between financial knowledge and proactive approaches around financial decisions—borrowing and paying behaviours (Lind et al. 2020; Lusardi 2012).
We suppose that values play an important role in the financial decisions of individuals, which have a resulting impact on their financial behaviour. Values can help us understand and predict the behaviour of people. That is also why we included values in our research.
The concept of ‘value’ has been discussed in philosophy, theology and social sciences for over one hundred years. We consider the thesis, formulated for the first time by philosopher Lotze (1856), that values in a human’s life are the key to solving ethical decisions, as well as to building and understanding culture, which is still valid. During the 20th century there came into existence many tools for values research, and there were many authors devoted to the research of values (Allport et al. 1960; Rokeach 1968, 1973; Schwartz and Bilsky 1987, 1990; Schwartz 1992; Inglehart 2021; ESS 2021).
In literature, financial behaviour is usually connected with material values, which can be defined as personal beliefs about the importance of material goods and possessions (Richins 1999). According to Richins and Dawson (1992) possessions are a means to happiness and an indicator of one’s own and others’ success. For measuring material values, we can use the material value scale (Richins 2004). Material values are linked with the concept of materialism and relate to financial security, but they are not necessarily connected with actual savings behaviour (Hjalmarson 2005), which in most cases is a prerequisite for financial security.
Material values are different from personal values, yet there is a connection between them. The possessions people perceive as important in their lives often reflect their personal values (Richins 1994). We assume the influence of the values on risky behaviour is much more complex and reaches farther than only the material world. The influence of values is strong in the whole complexity of decision making in everyday situations and it is not only connected primarily to material things. That is why we looked for a much wider instrument to measure the values, which allowed us to cover most situations in everyday life. For this purpose, the most suitable was to use a well-known value itinerary. In our case, we decided to use a slightly adjusted Rokeach’s itineraries of terminal and instrumental values (Rokeach 1973).
The original Rokeach’s Value Survey (RVS) contains 18 terminal values and 18 instrumental values (Rokeach 1973, 1968; Johnston 1995). The basic usage of the itinerary of values lies in the arrangement of the individual values according to the participants’ personal preferences. Rokeach’s value study, due to its simple application, was often used in surveys of value in various fields from social psychology (Hogan 1980; Hogan and Mookherjee 1981), through management (Chusmir et al. 1989), senior education (Sauve 1999), nursing (Blazeviciene and Jakusovaite 2007; Minton et al. 1997), and pedagogy (Lau 1988; Musil et al. 2009).

3. Research Methods

The theoretical concepts discussed above were used in the process of logical model building and resulted in designing an innovative value-based financial risk prediction model. The model introduced in this paper consists of specific numerical constructions based on fundamental variables measured using the ordinal scales (measuring specific economic indicators) or continuous scales (measuring of values‘ preferences).

3.1. Data Measurements and Collection

The data used for the construction and validation of the model was collected in 2018 and 2019 from 3768 respondents across the Czech Republic. The data were not affected by the COVID-19 crisis and describe the pre-pandemic situation. The research is designed as cross-sectional ex-post-facto. The constructed model is not locally dependent as elements of the nationality/regional aspects are not included in the indexes, employed in the model.
The sample consists of 1624 men (43.10%) and 2136 women (56.69%) aged over 24. Only 8 people categorized themselves as the other gender. The data was collected using an online questionnaire as a part of research of values, fundamental worldview, leisure, economic situation, and proficiency in ICT. In specific situations (older people or people with disabilities) paper form of questionnaire was used. According to age, the sample was clustered into 10-year age brackets. In the sample, there are 1140 people aged 25–34 (30.25%), 968 people aged 35–44 (25.69%), 819 people aged 45–54 (21.74%), 446 people aged 55–64 (11.84%) and 395 people aged 65 or more. While measuring we also recognized the population of the village/town/city in which the respondent lives. Aside from age and gender, this was the third stratification criterion supporting the sample to be representative. In our sample there are respondents from small villages (<2000 habitants, 802, 21.28%), bigger villages (2001–5000 habitants, 492, 13.06%), small towns (5001–15,000 habitants, 615, 16.32%), towns (15,000–60,000 habitants, 877, 23.22%), cities (60,001–150,000 habitants, 486, 12.90%) and big cities (>150,000 habitants, 496, 13.16%). The age and village/town/city distribution in the sample is close to the distribution in the population of the Czech Republic and the research sample can be considered representative according to gender, age, and village/town/city population.

3.2. Measurement Methods Statistical Procedures

The first factor entering the model—the economic situation—is based on the measurement of 28 ordinal variables which produce key indexes characterizing the respondent (or respondent’s family) situation: index of financial responsibility (Ifr), index of financial well-being (Ifwb) and index of financial knowledge (Ifk). Each of the 28 variables is measured on a scale from 0 to 2, where 0 means not answered and the value is no longer employed in the index calculation. Valid answers are between limits 1 and 2 and in the index calculation are decreased by 1. Finally, the calculated value is doubled and decreased by 1. Therefore, calculated indexes are adjusted to limits −1 (minimum) and 1 (maximum). The indexes mentioned above are used to determine economic situation clusters and subsequently for calculation of risk level for each of clusters. As a complex variable used for the calculation of risk level in the second factor of the developed model, the index of the economic situation (Iec) is calculated. The complex index of the economic situation (Iec) is categorized using mean (μ) and standard deviation of the index (σ) into four categories. Therefore, the categorized variable Ieccat is set.
The second factor entering the model—the value types—is based on population preferences of the 36 values mostly drawn from Rokeach’s value itineraries of terminal and instrumental values. All the value’s preferences were measured on continuous scales from 1 to 10 (0 means the value preference was not measured properly or was not answered). These continuous scales were used as the base for factor analysis. From this analysis, 6 value types (VT) were determined and used in the model.
Finally, we would like to prove the irregular distribution of economic situations and value types among the population and the dependence among determined value types and categorized economic situation index (Ieccat). To test these hypotheses we used the χ2 test of independence (Sheskin 2011) and for all cells of R × C tables, we calculated the standardized (adjusted) residuals (z-score) (Agresti 2007; Azen and Walker 2011). The statistical procedures also reveal specific groups in the population, which are highly risky because of their level of risk.
For the data collection and statistical analysis, we used The Social Survey Project (SSP) software (Social Survey Project 2018). For the analysis of dependence (χ2 test of in-dependence for R × C contingency tables, adjusted residuals), we used the internal statistical analytic engine of SSP.

3.3. The Index of Financial Responsibility

The index of financial responsibility (Ifr) is based on 11 questions concerning financial behaviour and calculated for every respondent using Equation (1).
I f r = 2 j = 1 Q f r j > 0 11 ( Q f r j 1 ) j = 1 Q f r j > 0 11 1 1
If Q f r j = 0 the question j was not answered properly by the respondent and is not added in the respondents’ index. The questions employed in index calculation are:
  • Qfr1—Do you have an overview of your monthly income (salary, trade income, pension, social benefits)?
  • Qfr2—Do you have an overview of the monthly income (payment, income from trade, pension, social benefits) of other household members?
  • Qfr3—Do you create a budget and financial plan for your household for a longer period in the future?
  • Qfr4—Does your household adhere to the created budget and financial plan for a longer period in the future?
  • Qfr5—Do you save any amount per month in the household in case of extraordinary expenses?
  • Qfr6—How will you behave in the case of lack of funds?
  • Qfr7—If you are saving, please indicate how? (the most progressive ways are valuated as 2, less progressive as 1.5 and no saving as 1)
  • Qfr8—Do you have life insurance?
  • Qfr9—What would you do if you lose your credit card? (the most secure solutions are valuated as 2, less secure as 1.5 and dangerous as 1)
  • Qfr10—How do you store the PIN for the card? (the most secure solutions are valuated as 2, less secure as 1.5 and dangerous as 1)
  • Qfr11—Do you read contracts carefully? Do you understand everything before you sign them?

3.4. The Index of Financial Well-Being

The index of financial well-being (Ifwb) is based on 9 + 1 questions concerning the financial (economic) situation and well-being of the respondent and his/her household and is calculated for every respondent using Equation (2). Plus 1 means Qfr9 is doubled in the index to emphasize the importance of it.
I f w b = 2 j = 1 Q f w b j > 0 10 ( Q f w b j 1 ) j = 1 Q f w b j > 0 10 1 1
If Q f w b j = 0 the question j was not answered properly by the respondent and is not added in the respondent’s index. The questions employed in index calculation are:
  • Qfwb1—Do you draw social benefits? (the most valuable answer is ‘no, we are not entitled to them’)
  • Qfwb2—Would it be a problem for you if an important appliance (e.g., refrigerator, washing machine) unexpectedly broke down?
  • Qfwb3—Do you have a mortgage? To what extent does it burden your household’s budget?
  • Qfwb4—Do you have another loan? To what extent does it burden your household’s budget?
  • Qfwb5—How often can you go on a family holiday of at least a week in conditions acceptable to you?
  • Qfwb6—To what extent will a visit to a cinema or theater of your whole family affect your family budget?
  • Qfwb7—How long could your household cover the cost of living if it lost half of its income?
  • Qfwb8—How long would your household be able to cover the cost of living with the loss of all income?
  • Qfwb9—How do you assess the overall economic situation of your household?
  • Qfwb10—Doubled Qfwb9
The question Qfwb9 is measured specifically as the household surplus and the ability to create sufficient reserves. The most valued are those responses which state that the household can fully satisfy all needs of its members (including those which could be labelled as ‘extraordinary’) and simultaneously can save a significant amount of money in reserves.

3.5. The Index of Financial Knowledge

The index of financial knowledge (Ifk) is based on 8 questions concerning the fundamental financial knowledge of the respondent and is calculated for every respondent using Equation (3).
I f k n c = j = 1 Q f k j > 0 8 ( Q f k j 1 ) j = 1 Q f k j > 0 8 1 1
If Q f w b j = 0 the question j was not answered properly by the respondent and is not added in the respondent’s index. The questions employed in index calculation are:
  • Qfk1—A new washing machine costs CZK 10,000. The seller offers a 10% discount. How much is the discount?
  • Qfk2—What does the term available balance mean?
  • Qfk3—What is the difference between credit and debit card?
  • Qfk4—What is the difference between interest and credit?
  • Qfk5—What does inflation mean? (only a very basic understanding was required)
  • Qfk6—What does an overdraft mean?
  • Qfk7—When do you use an overdraft? (only very basic understanding is required)
  • Qfk8—What does the abbreviation APR mean?
In the case of the index of financial knowledge, we detected high negative skewness (Sheskin 2011) so we calculated the original index on scale from 0 to 1. Then we used special corrections to achieve the properly distributed index from −1 to 1. That is why the original index is marked as nc (not corrected or uncorrected). For the correction we used the received median value (0.9125) as the new zero and employed the following balancing transformation (Equation (4)):
I f k = { I f k n c > 0.9125   :   I f k n c 0.9125 0.0875 I f k n c < 0.9125   :   I f k n c 0.9125 0.9125
The transformation in Equation (4) puts all values of the uncorrected index on the scale from −1 to 1 and makes the distribution in the intervals −1 to 0 and 0 to 1 continuous.

3.6. Coherent Index of Economic Situation

Three indexes defined above describe three key aspects of the actual economic situation of the respondent and allow us to offer a three-dimensional view. For the case of calculating the risk level of personal value types, we need to define a unified (average) index of the economic situation (Iec) and categorize it for further analyses (Ieccat). The index represents the coherent expression of the economic situation and is simply calculated as the average of three specific indexes (Ifr, Ifwb, Ifk).
I e c i = I f k i + I f w b i + I f k i 3
where i is the ith respondent.
For the calculation of risk levels, the index of coherent economic situation Iec is categorized to Ieccat. The categorization of Iec is calculated using index mean (μ) and index standard deviation (σ). The four categories of economic situation including the numbers in population are in Section 4.1.

3.7. The Economic Situation Clusters—First Factor of the Model

For expression of the characteristic economic situation, the cluster analysis was used. Cluster analysis (Hennig et al. 2015), as a method to capture the natural structure of data, enables us to organize data and better understand the differences and commonalities between cases. Clustering is useful in simplifying data, developing new taxonomies, and identifying relationships, it gives researchers the possibility to determine group membership based on analysed data and characteristics.
The cluster analysis is common in both science (Anderberg 2014) and social sciences (Arabie et al. 2005; Fonseca 2013) and in our model we are trying to use it in application of social research in helping professions’ practices. As a method, designed to reveal relationships that might not have been revealed with individual observation, it has practical uses at different levels of helping professions research and practice, e.g., in finding and describing commonalities among a population (Hair et al. 2010; Rapkin and Luke 1993). The ability to quickly group clients on the base of their common characteristics and devise strategies/interventions for each group at a larger scale can bring more cost-effectiveness into the helping professions with already tight budgets.
Three indexes defined and described above were counted for each of the 3768 respondents and received values were employed in cluster analysis using k-means. The analysis produced four clusters, which allowed us to describe four different average types of economic situations. Clusters are described in Section 4.2. The risk level of each cluster was calculated using Equation (6) and is based on the difference of levels of financial indexes (responsibility Ifr, well-being Ifwb and knowledge Ifk). Because indexes are designed to measure the positivity of each aspect of the financial situation and if transformed to scale 0–1 could be taken as the percentage of financial assurance, the risk level is therefore computed as the difference between 1 (which represents full assurance) and measured assurance. Hence, the risk level ESr could be interpreted as the percentage of risk the person will have financial problems if the life and/or social conditions unexpectedly change.
E S r k = 1 ( I f r k + 1 2 I f w b k + 1 2 + I f k k + 1 2 )
where k is the kth cluster.
The clusters derived by cluster analysis from three indexes represent average economic types and in the following step, each respondent is assigned to the closest cluster. A new variable ESr is defined for this purpose and could be used for forthcoming analyses.
The assignment (list) and the respondents to clusters is made using the Euclidean distance between respondent’s values of indexes (Ifr, Ifwb, Ifk) and means of each cluster. The respondent is assigned to a cluster with the shortest distance as is shown in Equation (7).
E S c a t = o r d { min c = 1 4 [ ( I f r E S c f r ) 2 + ( I f w b E S c f w b ) 2 + ( I f k E S c f k ) 2 ] }
where Ifxxx represents values of indexes measured for each respondent, ESc represents indexes’ values in cth cluster.
The distribution of clusters among the population sample is in Section 4.2.5.

3.8. Measuring the Values’ Preferences and Factoring the Value Types—Second Factor of the Model

The most commonly used method to measure personal value orientation is a questionnaire composed by Schwartz: Personal Value Questionnaire (Schwartz and Bilsky 1990; Schwartz 2005). Although we fully respect the contribution of this tool, for confirming values, we selected Rokeach’s Scale of Terminal and Instrumental Values as a base for the measurement values in the context of our model. Rokeach (1973, 1968) focused on the relationships between values, attitudes and beliefs in his research. He defined the characteristic features of values and their functions. One of them is a crucial feature for us, that values influence behaviour and the terminal state of things. Based on this feature of values, Rokeach (1973) distinguishes two main types of values: terminal values and instrumental values. Terminal values offer transcendent qualities exceeding the specific and topical form of one’s existence. They are further divided into intrapersonal and interpersonal values. Instrumental values represent idealized forms of behaviour; they cause the effort to be fulfilled and can be identified as moral values (focused on the way of acting) and competent values (focused on the skills and actions which lead to self-fulfilment). We suppose both types of values strongly influence the level of risk in the financial decision-making and therefore, we used Rokeach’s values itineraries only slightly adjusted for usage in our research.
Values’ preferences were measured for all the 36 offered values (V1 … V36) using a continuous scale of 1 to 10. The results of factor analysis (Sheskin 2011) and significant factor loads are shown in Section 4.3. Although it is usual to recognize variables in factors as significant when the factor loads are 0.7 or more, in our case, it would not be a proper way. The values in Rokeach’s itinerary were previously selected among many others as independent and we did not expect we could find any too strong factor loadings. The intention of factor analysis used in our case was quite different. We only wanted to reduce the number of values, show those that are relatively close together and especially determine the individual’s value types in the population. That is why we used quite a low factor load (0.48) as a limit for assigning the value with factors. The recognized limit was used because it is the lowest factor load, which guarantees only one assignment of each value to a specific value type. Consequently, the limit we used led to the exclusion of some values from the itinerary for the following analysis. Therefore, only 32 of the 36 values we measured are employed to model and influence the determination of the respondent’s value type.

3.9. Assigning the Value Types to Each Individual Respondent

Thanks to the measured values’ preferences received from each respondent, we can assign him or her the adequate (closest) value type. The process of assignment is based on personal preferences of values important for each value type normalized to the scale 0–1 weighted by factor loads of these values (see Section 4.3) and divided by the number of value preferences employed in each factor. For the comparison with other type weights, the result is normalized to the scale of 0–1 using division by the maximum potential weight. Using these calculations (Equation (8)), we determine his or her personal weight of each of the six recognized value types (PV1–6). Finally, to the respondent, the value type with the highest weight is assigned (Equation (9)) as a personal value type (PVT).
It should be noted the weights represent the respondent’s inclinations to each value type and it should not be forgotten that all types are partly contained in his or her personality and could affect their decision-making. In our model, we assume the most weighted values with the most loads are those, which influence the decision-making in the strongest way.
P V k i = j = 1 F L k j > 0.48 36 V P j i 1 9 F L k j j = 1 F L k j > 0.48 36 F L k j
where k is the kth value type, i is ith respondent, VPj is value preference and FLkj is the factor load of the value in kth type.
P V T i = o r d { max k = 1 6 [ P V k i max p o p ( P V k ) ] }
Personal value type (PVT) is the final categorical variable containing value type 1 to 6 (order of maximum weight of value type) as described above. In Section 4.3 is shown the distribution of value types among the population aged 25+ in the Czech Republic.

3.10. Hypotheses Testing and Value Types Risk Level

When we constructed the model, we assumed there would not be a regular distribution of ES/PVT among the population as well as the distribution of financial risks in the population is not regular. This could be also understood as the first hypothesis (H1) of our research, and now we can use the model to show and prove it. As a null hypothesis, we can consider the situation when all value types have expected numbers of people in all recognized economic situations.
The second hypothesis (H2) we discussed when the model was theoreticised assumes there exists a significant relationship among the personal value types (PVT) and the categorized complex index of the economic situation (Ieccat). This relationship is slightly different from the ES/PVT. The main difference is the Iescat is calculated as a coherent, inclusive index and it does not highlight the balance between financial indexes employed in it. Therefore, it expresses the cumulative situation of the respondent, and we believe this is a much more representative way for derivation of value type influence.
For the calculation of value type risk level, we started from the theoretical assumption the risk level depends on the relationship among the value types and economic situation. The second tested hypothesis (H2) confirms that each group of values, distinguished by using factor analysis (see Section 4.3), has specific economic characteristics, which could be expressed using the weights of z-score in each category of the economic situation (Iescat 1–4). For the weights of z-score in the cell on ith personal value type and jth category of the economic situation (Iescat) in the following analyses, we use Wij. These weights (z-scores) have to be interpreted positively in the case of categories 3 and 4 of Iescat and negatively in the case of categories 1 and 2 of Iescat. So, in the case of categories 1 and 2, the values of z-score must be inverted by −1 for correct calculation and interpretation. Hence, if the z-score is negative in the first two categories, the meaning of it is positive. The negative value of z-score signals there is less than expected number of people who state this position which in the case of categories 1 and 2 this could be considered as a positive fact. Because we used the z score only as a weight, and we were not evaluating the statistical significance we normalized the z scores to the scale −1 to 1 by the highest z-score achieved. This normalization was employed because the result we needed had to be scaled from 0 to 2 and interpreted as the level of positive or negative relationship of a specific personal value type with the economic situation (1 = no influence). The consequence of using this kind of influence level is that the positive relationship decreases, and the negative relationship increases the risk level of each clustered economic situation (ES1–4). For the calculation of influence level for each value type, Equations (10) and (11) were employed.
W m a x = max i = 1 6   j = 1 4 ( | W i j | ) ,
where Wij is weight of z-score in the cell on ith personal value type and jth category of economic situation (Iescat).
P V T i i n f l = j = 1 4 4 ( j 2.5 ) W i j | j 2.5 | W m a x 4

3.11. Risk Level Calculation for Financial Risk Groups

The final model is based on the multiplication of two risks: the first coming from factors of the economic situation (determined by the risk level of each cluster) and the second coming from the factor of values (determined by the risk level of each value type). As the model depends more on the risk weights of clusters and value types, we can consider it independent of the population itself however it was calculated on population data. Surely, every population has its own distribution of numbers within the clusters and value types but, the model itself is not directly dependent on it. Therefore, the model, as it was constructed without involving any regional characteristics, can be used internationally; its use is not limited to only the Czech Republic.

4. Research Results and Construction of the Model

In the following text, we present the results of cluster and factor analysis, on the basis of which the model was built.

4.1. Categorized Index of Coherent Economic Situation (Ieccat)

Table 1 is descriptive and states categorization of the coherent index of the economic situation (Iec) and numbers in the population. The fewest respondents fall into the category of the poorest (Ieccat1, n = 515). Of course, most respondents move in terms of the economic situation in the middle (Ieccat2+eccat3, n = 2477). Calculation of the coherent index of economic situation is an important value for further model calculation because of at least two reasons. First, it is one of the variables necessary for H2 testing. Second, the z-scores calculated within the H2 are necessary input for the calculation of risk levels of value types.

4.2. Cluster Analysis Results

Four clusters have been identified within the analysis to define four possible economic situations. Their potential risk or problem (e.g., indebtedness, over-indebtedness, risk investments, loss of properties or property value, insufficient reserve) is associated with the objective financial knowledge of the individual. The risk level is calculated using Formula (6) and it is one of two crucial parts of the whole model calculation. This risk level multiplicated with the risk level of value type groups created the matrix of overall risk levels significant for the model.
For better understanding, we added graph of cluster (Chart 1) where each line represents the characteristics of each determined cluster.
Each cluster we obtained from cluster analysis represents a very specific economic situation. Despite interesting numbers of respondents belonging to each cluster, means in Table 2 as well as lines drawn as their representation in Chart 1 are crucial for our model the lines in chart and (characteristics) are important. That is also the root of our belief the model is population independent. Clusters show no more and no less than generalized mathematical descriptions of economic situations. In the following subsections, each economic cluster—type is described.

4.2.1. Neutral Economic Situation with Higher Level of Risk

This type of situation is rather stable. The financial knowledge of respondents living in this situation is quite bad. They are not used to spending much so the risk of dramatic worsening of their economic situation is quite low. They are not at actual risk of financial instability if everything goes well. The real risk comes with a sudden and/or unexpected crisis (e.g., divorce, illness, disaster). The calculated risk level of this situation is 59.7%.

4.2.2. Positive Economic Situation with High Level of Risk

This type of situation is seemingly stable and in many cases it really is. Respondents in this situation are used to spending a lot and they are possibly financially dependent. Nevertheless, the financial risk to this person is high because of the lack of financial knowledge. In the case of significant negative changes (the dependence is broken—e.g., the divorce, death of a related person, loss of investment or fund) within the household, they are usually not able to manage the crisis successfully—it is hard for them to give up their usual consumption and living standard. The calculated risk level of this situation is 65.71%.

4.2.3. Negative Economic Situation with Higher Level of Risk

This type of situation is highly unstable. The level of risk is very high. There is the highest number of concurrent risks. Respondents living in this situation are usually dependent on social services and support. They belong to the potentially most vulnerable group because they have neither the resources nor the financial knowledge needed to deal effectively with the situation. The calculated risk level of this situation is 58.82%.

4.2.4. Positive Economic Situation with Low Level of Risk

This type of situation is very stable and even the sudden and/or unexpected crisis should not lead to serious worsening. Respondents have both the necessary resources and financial knowledge to deal effectively with almost any change without significantly worsening their living standard. The calculated risk level of this situation is 5.66%.

4.2.5. Distribution of Clusters in Population

Although we mentioned above the numbers of persons belonging to each cluster are not needed for the model construction, they are interesting for better understanding and ana-lyse of the economic situation in the Czech Republic. Therefore Table 3 shows absolute and cumulative numbers of persons belonging to each cluster and frequencies, as well.

4.3. Factor Analysis of Values’ Preferences Results

The second factor forming the model is the value type of the individual. In our paper, six value types were identified using factor analysis. It was inspiring for us to compare our value typology with the one created by Eduard Spranger (1921) who described six types of men: economic, theoretical, aesthetic, social, political, and religious. In the types we identified, there are close similarities in the social type (prosocial), religious type (religious) and political type (power). The other three types mentioned by Spranger, the economic, theoretical and aesthetic type, only partially meet our value types (conservative, liberal and venture-oriented). This could be explained by changes of value preferences in society (Inglehart 2015) also different methods of values types identification. Whereas Spranger derived his types as a construct coming with his philosophy, our typology is strictly derived from the measurement of value preferences in population and is limited only by the value selections within the itineraries.
The factor analysis we provided over the measured 36 values’ preferences showed 6 factors (value types). Results of the analysis are shown in Table 4. The recognized factors are close and similar to previously personal value types presented by Spranger (1921), with respect to shifts and change in values’ preferences in over a hundred years. Consequently, the wider description of the types follows and shows the differences in possible impacts of each value type on financial decision-making and risky behaviour.
When we obtained factor loads, we could use them in Formulas (8) and (9) and assign the closest value type to each respondent. This assignment had two consequences. The first and the most important is that we derived the second variable (second factor) needed for the model calculation as we declared before. The second consequence is we can recognize the frequencies of value types in the population of the Czech Republic. These frequencies are shown in Table 5 and the key message it brings us is there exists quite a big disbalance among the numbers assigned to value types. We can highlight that there are two types that represent over 80% of population: conservative and prosocial. Other types have got much lower frequencies while the lowest one is the power type (less than 1% of the population).

4.4. Hypotheses Testing and Value Types Risk Level

In Table 6, the ES/PVT relationship in the population is shown. The result of statistical testing using C × R χ2 test of independence (Sheskin 2011) showed the null hypothesis could be rejected (n = 3768, df = 15, χ2 = 77.77, p < 0.001) and there are significant differences among the numbers of individuals in different ES/PVT conditions counted using standardized (adjusted) residuals (Agresti 2007; Azen and Walker 2011). This allows us to consider the first hypothesis (H1) to be confirmed. For each specific condition, we can describe the predicted financial decision-making and calculate the financial risk level based on values, as well. Particularly noteworthy is the prosocial type in a negative economic situation with a higher level of risk, where the z-score reaches −6.2036***. It is evident from the result that people in this group are burdened with the lowest probability of arising problems compared to others, even in case of a sudden deterioration of the situation, and even when their initial situation is not good. In contrast, the group of people classified as venturesome appears to be particularly problematic in a positive economic situation with a high level of risk (z: 3.5208***). In the same situation are also people in the group of religious in a negative economic situation with a higher level of risk (z: 3.8921***). In terms of assessment in the helping professions and intervention planning, these two groups should be given increased attention.
As well as in the case of the previous hypothesis, the relationship between personal value types and categorized coherent index of economic situation can be considered as statistically significant (n = 3768, df = 15, χ2 = 70.29, p < 0.001) Therefore the second hypothesis (H2) we stated could be confirmed. As can be seen from Table 7, the distribution of numbers is different from the distribution of numbers in the case of the relationship between value types and economic clusters which confirms the complex index of financial situation Ies (Equation (5)). This difference confirms the economic situation is not the same as the financial assurance, respectively the level of financial risk brought by the economic situation clusters (ES1–4). However, the purpose of the complex economic situation index (Ies) is different, and it is used only to express the cumulative indicator for further statistical analyses.
However, Table 7 shows us more and for the following computation of the risk level of each value type the z-scores which express the standardized residuals for each cell and allow us to analyse how each of the value types influences the economic situation categories (Ieccat) and use these influences for calculation of each value type risk level. The highest risk is among the poorest in the religious group (z: 3.4454***). Conversely, in this same unfavourable economic situation, those in the prosocial group are at the lowest risk. Their risk increases proportionally as the economic situation improves.
The most important result, besides the confirmation of hypothesis H2, which brings us the contingency table (Table 7), is the matrix of z-scores for each type of PVT/Iescat relationship. These scores employed in Formulas (10) and (11) allow us to determine the influence of each value type on the economic situation.
Conservatively oriented people (VT1, influence on financial risks: 1.2600) are strongly connected with family and society traditions. They are rooted in their environment, and they are not able to manage changes easily. Every loss of this rooting leads to instability and increases the level of risk in every aspect of their lives. The conservative attitude is the source of their power and security, but it also could be a source of rigidity. In financial decision-making, they prefer certainty and safety. Their inability to make risky financial decisions can protect them but it can lead to a decrease in their profits and loss of opportunities for development.
Venturesome people (VT2, influence on financial risks: 1.4119) look for excitement and pleasure. They live to enjoy. From the economic point of view, this value type is the most risky one. Their highest risk is they often use their resources limitlessly and often do not make adequate reserves. Any sudden or unexpected situation leads to financial crisis. In the worst-case scenario, they are even willing to break the law in order to get their excitement.
For religious people (VT3, influence on financial risks: 1.0726) one of the highest risks is their passive attitude to living situations. They often tend to transfer responsibility to someone/something (mostly God). This value orientation can thus lead to blind faith and loss of critical thinking. Their faith could make them too trusting, and they are able to believe even in bad or evil advice. They are threatened by manipulative behaviour. Because of their faith, they often have a specific attitude to wealth and poverty, and they tend to avoid the opportunities to build their wealth. It must be mentioned this attitude is not generally applicable to all religions and confessions.
Liberally oriented people (VT4, influence on financial risks: 0.9142) value their freedom most and will fight against any restrictions. This attitude influences all aspects of their lives, even their financial decisions. Their social network is not so stable and flexible just because of their unwillingness to respect others’ advice and support. Paradoxically their inability to bond themselves with the financial institutions or instruments can bring them to quite similar situations as the conservatives: decreases their profits and loss of opportunities for development. On the other hand, when they try to invest, they are often seduced by high liquidity in the connection with high potential risk. Their financial decisions could be often reckless, even hazardous.
Power oriented people (VT5, influence on financial risks: 1.0028) are focused on building their image and social status. One of the most important things for them is social recognition. Their financial decisions are strongly influenced by their need to keep their social status. They follow the belief that leaders cannot be weak. Because of this belief, they are willing to spend more than they can afford to preserve and strengthen this status. This could lead to highly risky investments and debts. Because the leaders—even potential or desired—are always alone. That is why their social network cannot save or support them.
Prosocially oriented people (VT6, influence on financial risks: 0.5574) tend to feel responsible for others, especially their household members. Their social network is wide and strong, and they are supportive as well as they expect to be supported in the case of an emergency. However, the failure or disintegration of their relationships can be a big risk for them. In the case of financial decision-making is influenced by their tendency to support others. This could be an advantage when the network works well. Unfortunately, this could be changed to a risk when the others are taking advantage of this person and the trust in other people is exploited.

4.5. Crossing Factors and Risk Level Prediction

The value-based financial risk prediction model shows 24 possible financial risk groups for helping professions’ potential clients combining the economic types ES1–4 with value types PVT1–6 (Chart 2).
Six value types and four economic clusters are leading to 24 anticipated personal financial risk groups as demonstrated in Table 8. The risk level for each risk group is calculated as a product of cluster risk level (ESr) and the personal value type influence level (PVTinfl). In Table 8 and Chart 3, you can see a value-based financial risk prediction model. This model is based on a combination of two factors that anticipate personal financial risk. The first factor is the economic situation of an individual, which together with the value orientation determines the potential risk in the financial situation of a particular person, as well as their whole household.

5. Discussion of Model Application

Professionals have to deal with a growing number of people in need of interventions from psychology, counselling, social work, social pedagogy, public health and other helping professions. They need every tool available to be able to address precisely the challenging situations in which their clients are today. For this reason, the issue of client diagnostics (especially in the helping professions) is an important topic, as the increasing number of clients with problems primarily in the financial area makes it necessary to increase the effectiveness of work with them (Frey et al. 2015).
As stated by Mises: “Economics, it is said, in its rationalistic prepossessions assumes that men aim only or first of all at material well-being. However, in reality, men prefer irrational objectives to rational ones. They are guided more by the urge to realize myths and ideals than by the urge to enjoy a higher standard of living.” By rational objectives, an individual’s desire for material well-being and simply a higher standard of living are understood (von Mises 1998).
In the field of helping professions, client assessment is considered one of the basic tools, with a large number of suggestions to be found especially in the management literature (Zatloukal et al. 2011; Royse et al. 2009). In social work, there are several different ways to grasp this topic. An interesting contribution, which is fully in line with our approach as it takes into account the economic situation, is the construction of an instrument named The Socio-Economic Empowerment Assessment (Hawkins and Kim 2012). This tool was constructed for use in clinical settings, including agencies primarily serving low-income populations. It also has applicability to financial literacy or management sessions that social work agencies may offer. To better understand the links between an individual’s psychological processing, life experiences, and culture in relation to their financial security, this tool uses a bio-psychosocial assessment approach and an ecological multisystem perspective. It examines financial learning developed across the lifespan and explores the many external and internal issues that influence financial behaviour, including personal achievement, family and social dynamics, physical health, and psychological well-being. Hawkins and Kim’s (2012) concept is an approach based on the examination of the relationship between retrospective indicators and their influence on the current situation. In contrast, our model is aimed at predicting and identifying potential risk in the future. The model is based on a more objective assessment through statistically analysed indicators. The results of the assessment are thus completely independent of the assessor, thus offering a more accurate, easier, and thus broader application. In this respect, the model we have presented is quite unique. Searches conducted in the EBSCO, SCOPUS and Web of Science databases suggest that similar approaches are emerging especially in the fields of computer science or engineering (Song and Peng 2019), economics (Zhao 2020; Yeh et al. 2020) and management (Wang 2020). Specific tools include for example The Financial Management Behavior Scale (FMBS) (Dew and Xiao 2011), Money Attitude Scale (MAS) (Yamauchi and Templer 1982), the Money Beliefs and Behavior Scale (MBBS) (Furnham 1984), the Money Ethic Behavior Scale (MES) (Tang 1992) or the Financial Threat Scale (FTS) (Marjanovic et al. 2013).
The presented model serves to financial profiling of individuals based on which we are able to assign any individual to one of four predefined clusters (through their individual profiles) and on dominant value type (out of six) and understand how to address one’s issues through any helping profession interventions in the most effective way. The model is unique in the combination of personal values projected into six generalized value types and developed economic indexes, clustered in four types of economic situations. For each clustered economic situation, the base risk of worsening of an individual financial situation was calculated. The riskiness of each value type increases or decreases the riskiness of each economic situation. It is important to note the level of a base risk does not express the degree of probability with which the financial situation will necessarily get worse. Rather, it expresses the risk level of worsening of the financial situation if any sudden negative change in living conditions happens. With this logic, 24 financial risk groups were constructed and presented in Table 8 and Chart 3.
The lowest level of risk (very low level of risk) is shown in green in the Chart 3. Lower level of risk is shown in yellow, high level of risk in orange and very high level of risk in red. Based on the level of riskiness of the value type (see Table 8), the risk of the default financial situation is increased or decreased. The level of risk in all aspects of life increases with each loss of rootedness (Schomerus and Angermeyer 2021).
Liberal and prosocial value types reduce the riskiness of the situation, religious, conservative and venturesome increase the riskiness, power value type does not affect the calculated risk upwards or downwards. Because of their faith, religious people often have a specific attitude to finances (Marks et al. 2010), wealth and poverty and they tend to avoid the opportunities to build their wealth (Tahiri Jouti 2018). Conservatively oriented people are strongly connected with family and social traditions (Florescu 2020), which can also affect their flexibility in case of unexpected situations.
As presented, the venturesome value type is the most problematic one—in combination with any economic situation it will be always problematic. The most problematic situation happens in the case of combining this value type with a positive financial situation with a high level of risk. Venturesome people live to enjoy and have a characteristic way of shopping (Park et al. 2010) or travelling (Gretzel et al. 2012). Contrary to the venturesome value type, there is a prosocial type with the lowest level of risk. Combination with a positive financial situation with a very low level of risk is the least risky. Their least risky situation is related to a strong social network that supports them in case of trouble (Vaculík et al. 2007).

6. Limits of Study

The research and the model have several limits. The data used for model building and modelling were only collected in the Czech Republic and could be slightly different for other countries. We do not suppose these differences will have a strong influence on the model application. The methods used for the clustering and factoring led to recognizing generalized types where no individual could be assigned to more than one type, although the other types could be very close to his/her personality. Some may eschew cluster analysis because there is a degree of subjectivity not found in other statistical analyses and the results are non-inferential.

7. Conclusions

The model has three fundamental applications:
  • as a source for development of a diagnostic tool in helping professions
  • as a source for development of an auto diagnostic tool in process of self-development
  • as a research instrument leading to various hypotheses and to the enhancement of theories concerning economic behaviour.
Due to its illustrativeness, the surface projection of anticipated personal risk levels for the financial risk group in Chart 3 allows easy interpretation of a specific client’s situation and makes the model user friendly for helping professionals and their clients. The logic of the model implies that none of the clients can be profiled into a pure value type only, and the limits of the riskiness of a given client depend on their situation as well.
The authors consider it crucial to validate the model for use in all three recognised applications. In addition to the validation process, it would be beneficial to analyse specific economic situations in relation to specific value types, focusing on each of the 24 financial risk groups, to provide a platform for the use of the model and the interpretation of the results by practitioners and individuals.

Author Contributions

Conceptualization, J.P.; Data curation, J.P., N.M., P.M., P.J., I.O. and H.P.; Formal analysis, J.P.; Investigation, J.P., N.M., P.M. and P.J.; Methodology, J.P.; Project administration, I.O. and H.P.; Supervision, J.P.; Validation, P.M., P.J., I.O. and H.P.; Writing—original draft, J.P., N.M., P.M. and P.J.; Writing—review and editing, I.O. and H.P. All authors have read and agreed to the published version of the manuscript.

Funding

This research was funded by IGA_CMTF_2021_007 Values context of social functioning I.

Institutional Review Board Statement

Ethical review and approval were waived for this study, due to informed consent obtained from all subjects involved in the study.

Informed Consent Statement

Informed consent was obtained from all subjects involved in the study.

Data Availability Statement

Research data are available from the authors upon request.

Conflicts of Interest

The authors declare no conflict of interest.

References

  1. Agresti, Alan. 2007. An Introduction to Categorical Data Analysis, 2nd ed. Wiley Series in Probability and Mathematical Statistics; Hoboken and Chichester: Wiley. [Google Scholar]
  2. Allport, Gordon W., Philip Ewart Vernon, and Gardner Lindzey. 1960. Study of Values, 3rd ed. Boston: Houghton Mifflin. [Google Scholar]
  3. Anderberg, Michael R. 2014. Cluster Analysis for Applications. Burlington: Academic Press/Elsevier Science, Available online: https://search.ebscohost.com/login.aspx?direct=true&scope=site&db=nlebk&db=nlabk&AN=931378 (accessed on 16 May 2021).
  4. Arabie, Phipps, Lawrence J. Hubert, and J. Douglas Carroll. 2005. Clustering. In Encyclopedia of Social Measurement. Edited by Kimberly Kempf-Leonard. Oxford: Elsevier Academic Press, vol. 1, pp. 317–20. [Google Scholar]
  5. Arber, Sara, Kirsty Fenn, and Robert Meadows. 2014. Subjective Financial Well-Being, Income and Health Inequalities in Mid and Later Life in Britain. Social Science & Medicine 100: 12–20. [Google Scholar] [CrossRef] [Green Version]
  6. Azen, Razia, and Cindy M. Walker. 2011. Categorical Data Analysis for the Behavioral and Social Sciences. New York: Routledge. [Google Scholar]
  7. Blazeviciene, Aurelija, and Irayda Jakusovaite. 2007. Value Priorities and Their Relations with Quality of Life in the Baby Boomer Generation of Lithuanian Nurses: A Cross-Sectional Survey. BMC Nursing 6: 10. [Google Scholar] [CrossRef] [PubMed] [Green Version]
  8. Blue, Levon Ellen, and Peter Grootenboer. 2019. A Praxis Approach to Financial Literacy Education. Journal of Curriculum Studies 51: 755–70. [Google Scholar] [CrossRef]
  9. Castro-González, Sandra, Sara Fernández-López, Lucía Rey-Ares, and David Rodeiro-Pazos. 2020. The Influence of Attitude to Money on Individuals’ Financial Well-Being. Social Indicators Research 148: 747–64. [Google Scholar] [CrossRef]
  10. Chusmir, Leonard H., Christine S. Koberg, and Joan Mills. 1989. Male-Female Differences in the Association of Managerial Style and Personal Values. The Journal of Social Psychology 129: 65–78. [Google Scholar] [CrossRef]
  11. Dew, Jeffrey, and Jing Xiao. 2011. The Financial Management Behavior Scale: Development and Validation. Journal of Financial Counseling and Planning 22: 43–59. [Google Scholar]
  12. Dew, Jeffrey, Luke Dean, Stephen F. Duncan, and Sonya Britt-Lutter. 2020. A Review of Effectiveness Evidence in the Financial-Helping Fields. Family Relations 69: 614–27. [Google Scholar] [CrossRef]
  13. Ellen, Pam Scholder. 1994. Do We Know What We Need to Know? Objective and Subjective Knowledge Effects on pro-Ecological Behaviors. Special Issue: Linking Theory to Policy 30: 43–52. [Google Scholar] [CrossRef]
  14. ESS. 2021. European Social Survey|European Social Survey (ESS). Available online: http://www.europeansocialsurvey.org/ (accessed on 20 May 2021).
  15. Fan, Lu. 2021. A Conceptual Framework of Financial Advice-Seeking and Short- and Long-Term Financial Behaviors: An Age Comparison. Journal of Family and Economic Issues 42: 90–112. [Google Scholar] [CrossRef]
  16. Fisher, Elizabeth A. 2009. Motivation and Leadership in Social Work Management: A Review of Theories and Related Studies. Administration in Social Work 33: 347–67. [Google Scholar] [CrossRef]
  17. Florescu, Andrei. 2020. Why Conservative Values Inherited from Previous Generations Will Continue to Shape Contemporary Identity? Journal for the Study of Religions and Ideologies 19: 46–62. [Google Scholar]
  18. Fonseca, Jaime R. S. 2013. Clustering in the Field of Social Sciences: That Is Your Choice. International Journal of Social Research Methodology 16: 403–28. [Google Scholar] [CrossRef]
  19. Frey, Jodi Jacobson, Deborah Svoboda, Rebecca L. Sander, Philip J. Osteen, Christine Callahan, and Audrey Elkinson. 2015. Evaluation of a Continuing Education Training on Client Financial Capability. Journal of Social Work Education 51: 439–56. [Google Scholar] [CrossRef]
  20. Furnham, Adrian. 1984. Many Sides of the Coin: The Psychology of Money Usage. Personality and Individual Differences 5: 501–9. [Google Scholar] [CrossRef]
  21. Grable, John E. 2000. Financial Risk Tolerance and Additional Factors That Affect Risk Taking in Everyday Money Matters. Journal of Business and Psychology 14: 625–30. [Google Scholar] [CrossRef]
  22. Gretzel, Ulrike, Yeong-Hyeon Hwang, and Daniel R. Fesenmaier. 2012. Informing Destination Recommender Systems Design and Evaluation through Quantitative Research. International Journal of Culture, Tourism and Hospitality Research 6: 297–315. [Google Scholar] [CrossRef] [Green Version]
  23. Hair, Joseph F., William C. Black, Barry J. Babin, and Rolph E. Anderson. 2010. Advanced Diagnostics for Multiple Regression: A Supplement to Multivariate Data Analysis. Boston: ScienceOpen. [Google Scholar]
  24. Hallahan, Terrence A., Robert W. Faff, and Michael D. McKenzie. 2004. An Empirical Investigation of Personal Financial Risk Tolerance. Financial Services Review 13: 57–78. [Google Scholar]
  25. Hawkins, Robert L., and Eri J. Kim. 2012. The Socio-Economic Empowerment Assessment: Addressing Poverty and Economic Distress in Clients. Clinical Social Work Journal 40: 194–202. [Google Scholar] [CrossRef]
  26. Hennig, Christian, Marina Meila, Fionn Murtagh, and Roberto Rocci. 2015. Handbook of Cluster Analysis. Boca Raton: CRC Press. [Google Scholar]
  27. Hjalmarson, Hanna. 2005. Material Values, Valued Possessions, and Their Use. A Study of School Children Age Nine to Fifteen. E-European Advances in Consumer 7: 333–38. [Google Scholar]
  28. Hogan, H. Wayne. 1980. German and American Authoritarianism, Self-Estimated Intelligence and Value Priorities. The Journal of Social Psychology 111: 145–46. [Google Scholar] [CrossRef]
  29. Hogan, H. Wayne, and Harsha N. Mookherjee. 1981. Values and Selected Antecedents. The Journal of Social Psychology 113: 29–35. [Google Scholar] [CrossRef]
  30. Hogarth, Jeanne M., and Marianne Hilgert. 2002. Financial Knowledge, Experience, and Learning Preferences: Preliminary Results from a New Survey on Financial Literacy. Paper presented at American Council on Consumer Interests 2002 Annual Conference; Available online: https://www.consumerinterests.org/assets/docs/CIA/CIA2002/hogarth-hilgert_financial%20knowledge.pdf (accessed on 16 May 2021).
  31. Hung, Angela, Andrew M. Parker, and Joanne Yoong. 2009. Defining and Measuring Financial Literacy, RAND Working Paper Series WR-708. Available online: https://papers.ssrn.com/sol3/papers.cfm?abstract_id=1498674 (accessed on 23 May 2021).
  32. Inglehart, Ronald. 2015. The Silent Revolution: Changing Values and Political Styles among Western Publics. Princeton: Princeton University Press. [Google Scholar] [CrossRef]
  33. Inglehart, Ronald. 2021. WVS Database. World Values Survey. Project Pages. Available online: https://www.worldvaluessurvey.org/wvs.jsp (accessed on 20 May 2021).
  34. Jacobs-Lawson, Joy M., and Douglas Hershey. 2005. Influence of Future Time Perspective, Financial Knowledge, and Financial Risk Tolerance on Retirement Saving Behaviors. Financial Services Review 14: 331. [Google Scholar]
  35. Johnston, Charles S. 1995. The Rokeach Value Survey: Underlying Structure and Multidimensional Scaling. The Journal of Psychology: Interdisciplinary and Applied 129: 583–97. [Google Scholar] [CrossRef]
  36. Kim, Jinhee, E. Thomas Garman, and Benoit Sorhaindo. 2003. Relationships among Credit Counseling Clients’ Financial Wellbeing, Financial Behaviors, Financial Stressor Events, and Health. Journal of Financial Counseling and Planning 14. [Google Scholar]
  37. Lau, Sing. 1988. The Value Orientations of Chinese University Students in Hong Kong. International Journal of Psychology 23: 583–96. [Google Scholar] [CrossRef]
  38. Lind, Thérèse, Ali Ahmed, Kenny Skagerlund, Camilla Strömbäck, Daniel Västfjäll, and Gustav Tinghög. 2020. Competence, Confidence, and Gender: The Role of Objective and Subjective Financial Knowledge in Household Finance. Journal of Family and Economic Issues 41: 626–38. [Google Scholar] [CrossRef] [Green Version]
  39. Lotze, Hermann. 1856. Mikrokosmos. Leipzig: Hirzel, Available online: https://www.zvab.com/buch-suchen/titel/mikrokosmos-3-b%E4nde/autor/lotze/ (accessed on 23 May 2021).
  40. Lusardi, Annamaria. 2012. Numeracy, Financial Literacy, and Financial Decision-Making. Available online: http://www.nber.org/papers/w17821 (accessed on 16 May 2021).
  41. Marjanovic, Zdravko, Esther R. Greenglass, Lisa Fiksenbaum, and Chris M. Bell. 2013. Psychometric Evaluation of the Financial Threat Scale (FTS) in the Context of the Great Recession. Journal of Economic Psychology 36: 1–10. [Google Scholar] [CrossRef]
  42. Marks, Loren D., David C. Dollahite, and Jennifer Baumgartner. 2010. In God We Trust: Qualitative Findings on Finances, Family, and Faith From a Diverse Sample of U.S. Families. Family Relations 59: 439–52. [Google Scholar] [CrossRef]
  43. Minton, Judith, Juanita Shell, and Ralph Steinberg. 1997. Values of Postpartum Women from the Inner City: An Exploratory Study. Journal of Child and Family Studies 6: 27–41. [Google Scholar] [CrossRef]
  44. Mudzingiri, Calvin, John W. Muteba Mwamba, and Jacobus Nicolaas Keyser. 2018. Incentivized Time Preferences, Level of Education in a Household and Financial Literacy: Laboratory Evidence. Journal of Economics and Behavioral Studies 10. [Google Scholar] [CrossRef]
  45. Musil, Bojan, Velko S. Rus, and Janek Musek. 2009. The Rokeach Value Survey in Comparative Study of Japanese and Slovenian Students: Towards the Underlying Structure. Studia Psychologica 51: 53–68. [Google Scholar]
  46. Nejad, Mohammad G., and Katayon Javid. 2018. Subjective and Objective Financial Literacy, Opinion Leadership, and the Use of Retail Banking Services. International Journal of Bank Marketing 36: 784–804. [Google Scholar] [CrossRef]
  47. Netemeyer, Richard G., Dee Warmath, Daniel Fernandes, and John G. Lynch Jr. 2018. How Am I Doing? Perceived Financial Well-Being, Its Potential Antecedents, and Its Relation to Overall Well-Being. Journal of Consumer Research 45: 68–89. [Google Scholar] [CrossRef]
  48. OECD. 2013. OECD Framework for Statistics on the Distribution of Household Income, Consumption and Wealth. Paris: OECD Publishing. [Google Scholar] [CrossRef] [Green Version]
  49. Ouachani, Sonia, Olfa Belhassine, and Aïda Kammoun. 2021. Measuring Financial Literacy: A Literature Review. Managerial Finance 47: 266–81. [Google Scholar] [CrossRef]
  50. Park, Ji Eun, Jun Yu, and Joyce Xin Zhou. 2010. Consumer Innovativeness and Shopping Styles. Journal of Consumer Marketing 27: 437–46. [Google Scholar] [CrossRef]
  51. Rapkin, Bruce D., and Douglas A. Luke. 1993. Cluster Analysis in Community Research: Epistemology and Practice. American Journal of Community Psychology 21: 247–77. [Google Scholar] [CrossRef]
  52. Remund, David L. 2010. Financial Literacy Explicated: The Case for a Clearer Definition in an Increasingly Complex Economy. Journal of Consumer Affairs 44: 276. [Google Scholar] [CrossRef]
  53. Richins, Marsha. 1994. Special Possessions and the Expression of Material Values. Journal of Consumer Research 21: 522–33. [Google Scholar] [CrossRef]
  54. Richins, Marsha. 1999. Material Values. In The Elgar Companion to Consumer Research and Economic Psychology. Northampton: Elgar, pp. 374–80. [Google Scholar]
  55. Richins, Marsha. 2004. The Material Values Scale: A Re-Inquiry into Its Measurement Properties and the Development of a Short Form. Journal of Consumer Research 31: 209–19. [Google Scholar] [CrossRef]
  56. Richins, Marsha, and Scott Dawson. 1992. A Consumer Values Orientation for Materialism and Its Measurement: Scale Development and Validation. Journal of Consumer Research 19: 303–16. [Google Scholar] [CrossRef]
  57. Rokeach, Milton. 1968. Beliefs, Attitudes, and Values: A Theory of Organization and Change. San Francisco: Jossey-Bass. [Google Scholar]
  58. Rokeach, Milton. 1973. The Nature of Human Values. New York: Free Press. [Google Scholar]
  59. Royse, David, Michele Staton-Tindall, Karen Badger, and J. Matthew Webster. 2009. Needs Assessment. New York: Oxford University Press, ISBN 9780195368789. [Google Scholar]
  60. Sauve, Andre Lemieux G. 1999. Values of Senior Citizens Enrolled in a University Curricula Versus Those Who Are Not. Educational Gerontology 25: 67–88. [Google Scholar] [CrossRef]
  61. Schomerus, Georg, and Matthias C. Angermeyer. 2021. Blind Spots in Stigma Research? Broadening Our Perspective on Mental Illness Stigma by Exploring “What Matters Most” in Modern Western Societies. Epidemiology and Psychiatric Sciences 30: 1–6. [Google Scholar] [CrossRef]
  62. Schwartz, Shalom H. 1992. Universals in the Content and Structure of Values: Theoretical Advances and Empirical Tests in 20 Countries. In Advances in Experimental Social Psychology. San Diego: Academic Press, vol. 25, pp. 1–65. [Google Scholar] [CrossRef]
  63. Schwartz, Shalom H. 2005. Robustness and Fruitfulness of a Theory of Universals in Individual Values. In Valores e Trabalho (Values and Work). Edited by A. Tamayo and J. Porto. Brasilia: Editora Universidade de Brasilia. [Google Scholar]
  64. Schwartz, Shalom H., and Wolfgang Bilsky. 1987. Toward a Universal Psychological Structure of Human Values. Journal of Personality and Social Psychology 53: 550–62. [Google Scholar] [CrossRef]
  65. Schwartz, Shalom H., and Wolfgang Bilsky. 1990. Toward a Theory of the Universal Content and Structure of Values: Extensions and Cross-Cultural Replications. Journal of Personality and Social Psychology 58: 878–91. [Google Scholar] [CrossRef]
  66. Sheskin, David. 2011. Handbook of Parametric and Nonparametric Statistical Procedures, 5th ed. Boca Raton: Chapman & Hall/CRC. [Google Scholar]
  67. Sirgy, M. Joseph. 2018. The Psychology of Material Well-Being. Applied Research in Quality of Life: The Official Journal of the International Society for Quality-of-Life Studies 13: 273. [Google Scholar] [CrossRef]
  68. Social Survey Project. 2018. Online. Olomouc: ITTS s.r.o. Available online: https://www.socialsurvey.eu/ (accessed on 16 May 2021).
  69. Song, Yongming, and Yi Peng. 2019. A MCDM-Based Evaluation Approach for Imbalanced Classification Methods in Financial Risk Prediction. IEEE Access 7: 84897–906. [Google Scholar] [CrossRef]
  70. Spranger, Eduard. 1921. Lebensformen. Geisteswissenschaftliche Psychologie und Ethik der Persönlichkeit. Halle: M. Niemeyer. [Google Scholar]
  71. Strömbäck, Camilla, Thérèse Lind, Kenny Skagerlund, Daniel Västfjäll, and Gustav Tinghög. 2017. Does Self-Control Predict Financial Behavior and Financial Well-Being? Journal of Behavioral and Experimental Finance 14: 30–38. [Google Scholar] [CrossRef]
  72. Taagepera, Rein. 2008. Making Social Sciences More Scientific: The Need for Predictive Models. Oxford: Oxford University Press. [Google Scholar] [CrossRef]
  73. Taft, Marzieh, Zare Hosein, and Seyyed Mehrizi. 2013. The Relation between Financial Literacy, Financial Wellbeing and Financial Concerns. International Journal of Business and Management 8: 63–75. [Google Scholar] [CrossRef] [Green Version]
  74. Tahiri Jouti, Ahmed. 2018. Islamic Finance: Financial Inclusion or Migration? ISRA International Journal of Islamic Finance 10: 277–88. [Google Scholar] [CrossRef] [Green Version]
  75. Tang, Thomas Li-ping. 1992. The Meaning of Money Revisited. Journal of Organizational Behavior 13: 197–202. [Google Scholar] [CrossRef]
  76. Taylor, Mark. 2011. Measuring Financial Capability and Its Determinants Using Survey Data. Social Indicators Research 102: 297–314. [Google Scholar] [CrossRef]
  77. Vaculík, Martin, Jakub Procházka, and Petr Kveton. 2007. The Relation Between Prosocial Behavior and Demanding Prosocial Behavior. Studia Psychologica 49: 157–66. [Google Scholar]
  78. van Raaij, W. Fred. 2016. Responsible Financial Behavior. In Understanding Consumer Financial Behavior: Money Management in an Age of Financial Illiteracy. Edited by W. Fred van Raaij. New York: Palgrave Macmillan US, pp. 127–41. [Google Scholar] [CrossRef]
  79. von Mises, Ludwig. 1998. Human Action: A Treatise on Economics. Alabama: The Ludwig von Mises Institute. [Google Scholar]
  80. Vural, Gamze, and Aichetou Beichar. 2020. The Relationship between Financial Literacy and Individual Financial Decisions: An Explaratory Study. Finansal Okuryazarlik ve Bireysel Finansal Kararlar Arasindaki Ilişki Üzerine Keşifsel Bir Çalişma 29: 243–58. [Google Scholar]
  81. Wang, Minfang. 2020. Financial Risk Prediction Model of International Trade Enterprises of Marine Transportation. Journal of Coastal Research 103: 173–76. [Google Scholar] [CrossRef]
  82. Williams, Oliver J., and Stephen E. Satchell. 2011. Social Welfare Issues of Financial Literacy and Their Implications for Regulation. Journal of Regulatory Economics 40: 1–40. [Google Scholar] [CrossRef]
  83. Xiao, Jing J., M. J. Alhabeeb, Gong-Soog Hong, and George W. Haynes. 2001. Attitude toward Risk and Risk-Taking Behavior of Business-Owning Families. Journal of Consumer Affairs 35: 307–25. [Google Scholar] [CrossRef] [Green Version]
  84. Xiao, Jing Jian, Cheng Chen, and Fuzhong Chen. 2014. Consumer Financial Capability and Financial Satisfaction. Social Indicators Research 118: 415–32. [Google Scholar] [CrossRef]
  85. Yamauchi, Kent T., and Donald J. Templer. 1982. The Development of a Money Attitude Scale. Journal of Personality Assessment 46: 522–28. [Google Scholar] [CrossRef] [PubMed]
  86. Yao, Rui, Deanna L. Sharpe, and Feifei Wang. 2011. Decomposing the Age Effect on Risk Tolerance. The Journal of Socio-Economics 40: 879–87. [Google Scholar] [CrossRef] [Green Version]
  87. Yeh, Hsiang-Yuan, Yu-Ching Yeh, and Da-Bai Shen. 2020. Word Vector Models Approach to Text Regression of Financial Risk Prediction. Symmetry 12: 89. [Google Scholar] [CrossRef] [Green Version]
  88. Zatloukal, Leoš, Miloš Havlík, Zdislav Doleček, and Jaroslav Šotola. 2011. Komplexní Posuzování Potřeb Klientů v Rámci Poradenského Rozhovoru z Hlediska Přístupu Zaměřeného Na Řešení. Sociální Práce: =Sociálna Práca: Odborná Revue pro Sociální Práci 11: 81–92. [Google Scholar]
  89. Zhao, Jing. 2020. Corporate Financial Risk Prediction Based on Embedded System and Deep Learning. Microprocessors and Microsystems. January. Available online: https://search.ebscohost.com/login.aspx?direct=true&db=edselp&AN=S0141933120305627&authtype=shib&lang=cs&site=eds-live&scope=site&authtype=shib&custid=s7108593 (accessed on 16 May 2021).
Chart 1. Means for each economic situation cluster.
Risks 09 00205 ch001
Chart 2. Value-based financial risk prediction model.
Risks 09 00205 ch002
Chart 3. Surface projection of anticipated personal risk levels for financial risk groups value types and economic situations.
Risks 09 00205 ch003
Table 1. Categorization of coherent index of economic situation (Iec) and numbers in population.
IeccatDefinitionnfc
1Iec < μσ5150.1367515
2μσIec < μ12400.32911755
3μIec < μ + σ12370.32832992
4μ + σIec 7760.20593768
Table 2. Means for each economic situation cluster.
Cluster 1—ES1
Neutral Economic Situation with Higher Level of Risk
Cluster 2—ES2
Positive Economic Situation with High Level of Risk
Cluster 3—ES3
Negative Economic Situation with Higher Level of Risk
Cluster 4—ES4
Positive Economic Situation with Low Level of Risk
Ifr0.2407230.476966−0.0132020.412660
Ifwb0.2660230.685856−0.2538360.525914
Ifk−0.168730−0.105332−0.4169101.000000
Risk level ESr0.5970.6570.5880.056
Table 3. Respondents belonging to economic situation types (clusters).
Respondents Clustered by the Economic Situationn%cESr
ES1 Neutral economic situation with higher level of risk109929.17%10990.597
ES2 Positive economic situation with high level of risk103127.36%21300.657
ES3 Negative economic situation with higher level of risk41110.91%25410.588
ES4 Positive economic situation with low level of risk122732.56%37680.056
Total3768100.00%
Table 4. Values factor analysis and factor loads ≥ 0.48.
Value Preferences (Mixed Terminal and Instrumental)Value Types
VT1
CONSERVA-TIVE
VT2
VENTURE-SOME
VT3
RELIGIOUS
VT4
LIBERAL
VT5
POWER
VT6
PROSOCIAL
VP1—True friendship 0.642508
VP2—Love 0.646906
VP3—Wisdom 0.558671
VP4—Helpful 0.677536
VP5—Pleasure 0.670108
VP6—Equal opportunity of all 0.634111
VP7—Self-respect 0.583479
VP8—Social recognition 0.588818
VP9—World of beauty 0.532125
VP10—Freedom 0.584544
VP11—Happiness0.504324
VP12—Eternal life 0.848416
VP13—Inner harmony 0.502199
VP14—Exciting life 0.762913
VP15—Economic prosperity
VP16—Independent 0.542398
VP17—Responsible 0.601934
VP18—Assertive 0.585795
VP19—Open minded 0.671969
VP20—Self-control 0.540978
VP21—Capable
VP22—Faith 0.838601
VP23—Polite0.541606
VP24—Intellectual 0.483877
VP25—Ambitious 0.603383
VP26—Authoritative (socially powered) 0.660592
VP27—Enjoying life 0.754728
VP28—Courageous 0.715958
VP29—Creative 0.583571
VP30—Obedient 0.543216
VP31—Clean
VP32—Respect for parents and the elderly0.590510
VP33—National security0.599107
VP34—Family security0.612122
VP35—Acceptance, belongingness
VP36—Health0.632394
Table 5. Distribution of value types among the Czech population.
Value Typenfc
CONSERVATIVE133935.54%1339
VENTURESOME1995.28%1538
RELIGIOUS3088.17%1846
LIBERAL1363.61%1982
POWER330.88%2015
PROSOCIAL175346.52%3768
Total3768100.00%
Table 6. ES/PVT and standardized residuals (z-score) for each condition.
Value TypeEconomic Situation
Neutral Economic Situation with Higher Level of RiskPositive Economic Situation with High Level of RiskNegative Economic Situation with Higher Level of RiskPositive Economic Situation with Low Level of Risk
PVT1
CONSERVATIVE
406
10.77%
z: 1.1576
357
9.47%
z: −0.7159
169
4.49%
z: 2.5055 *
407
10.80%
z: −2.1084 *
PVT2
VENTURESOME
44
1.17%
z: −2.2502 *
76
2.02%
z: 3.5208 ***
33
0.88%
z: 2.6388 **
46
1.22%
z: −2.9224 **
PVT3
RELIGIOUS
91
2.42%
z: 0.1526
70
1.86%
z: −1.9040
54
1.43%
z: 3.8921 ***
93
2.47%
z: −0.9258
PVT4
LIBERAL
34
0.90%
z: −1.0889
35
0.93%
z: −0.4334
15
0.40%
z: 0.0464
52
1.38%
z: 1.4376
PVT5
POWER
7
0.19%
z: −1.0098
5
0.13%
z: −1.5803
8
0.21%
z: 2.4681 *
13
0.35%
z: 0.8410
PVT6
PROSOCIAL
517
13.72%
z: 0.4102
488
12.95%
z: 0.6113
132
3.50%
z: −6.2036 ***
616
16.35%
z: 3.1474 **
The z-score has the following statistical significance: * p < 0.05, ** p < 0.01, *** p < 0.001.
Table 7. Ieccat/PVT contingency table and standardized residuals (z-score) for each condition.
Value Type (PVT)Categorized Coherent Index of Economic Situation (Ieccat)
1
Iecμσ
2
μσ < Iecμ
3
μ < Iecμ + σ
4
μ + σIec
PVT1
CONSERVATIVE
206
5.47%
z: 2.2779 *
456
12.10%
z: 1.1121
420
11.15%
z: −1.4193
257
6.82%
z: −1.5790
PVT2
VENTURESOME
45
1.19%
z: 3.7746 ***
76
2.02%
z: 1.6294
50
1.33%
z: −2.3778 *
28
0.74%
z: −2.3385 *
PVT3
RELIGIOUS
62
1.65%
z: 3.4454 ***
84
2.23%
z: −2.1967 *
109
2.89%
z: 0.9986
53
1.41%
z: −1.5338
PVT4
LIBERAL
19
0.50%
z: 0.1047
39
1.04%
z: −1.0699
45
1.19%
z: 0.0655
33
0.88%
z: 1.0781
PVT5
POWER
8
0.21%
z: 1.7762
7
0.19%
z: −1.4363
9
0.24%
z: −0.6827
9
0.24%
z: 0.9528
PVT6
PROSOCIAL
175
4.64%
z: −6.1418 ***
578
15.34%
z: 0.0772
604
16.03%
z: 1.9826 *
396
10.51%
z: 2.8251 **
The z-score has the following statistical significance: * p < 0.05, ** p < 0.01, *** p < 0.001.
Table 8. Anticipated personal risk levels for financial risk groups.
Personal Value Type
(PVT)
PVTinflEconomic Situation (ESr)
Neutral Economic Situation with Higher Level of Risk
59.7%
Positive Economic Situation with High Level of Risk
65.71%
Negative Economic Situation with Higher Level of Risk
58.82%
Positive Economic Situation with Low Level of Risk
5.66%
PVT1
CONSERVATIVE
1.260075.23%82.80%74.11%7.14%
PVT2
VENTURESOME
1.411984.30%92.78%83.04%8.00%
PVT3
RELIGIOUS
1.072664.04%70.48%63.08%6.07%
PVT4
LIBERAL
0.914254.58%60.07%53.77%5.18%
PVT5
POWER
1.002859.87%65.90%58.98%5.68%
PVT6
PROSOCIAL
0.557433.28%36.63%32.79%3.16%
Publisher’s Note: MDPI stays neutral with regard to jurisdictional claims in published maps and institutional affiliations.

