Article

ESG Disclosure and Firm Performance: An Asset-Pricing Approach

1
Jaipuria Institute of Management Jaipur, Jaipur 302033, India
2
Stirling Management School, University of Stirling, Stirling FK9 4LA, UK
3
Institute of Business Management, GLA University, Mathura 281406, India
4
Jaipuria Institute of Management Noida, Noida 201309, India
*
Author to whom correspondence should be addressed.
Risks 2023, 11(6), 112; https://doi.org/10.3390/risks11060112
Submission received: 18 March 2023 / Revised: 19 April 2023 / Accepted: 26 April 2023 / Published: 12 June 2023

Abstract

:
Disclosing information on environmental, social, and governance (ESG) parameters is voluntary for most firms across the world. Companies disclose their performance on ESG datapoints due to two main reasons—(i) to gain the trust of stakeholders through increased transparency and (ii) to comply with regulations imposed by governments and investment houses. Using a dataset of companies disclosing ESG parameters during 2014–2021 from the S&P BSE 500 index, this study investigates the role of ESG disclosure on firm performance. We divide the constituent securities into three factors—size, value, and disclosure to study the premiums generated by firms on each factor using single-, double-, and triple-sorting approaches. We utilize time series regressions along with GRS tests to empirically test the presence of factor premiums. We find the significant role of factors size, value, disclosure, and a dummy variable for the COVID-19 pandemic period to explain the portfolio returns. The study found a negative ESG disclosure premium stating that firms with high levels of disclosure earn less returns compared with the firms with less disclosures. The findings of this study contrast with multiple studies in the past that have found a positive disclosure premium. Our findings help reconcile the mixed evidence on the disclosure–returns relationship.

1. Introduction

The world is becoming increasingly conscious that firms conduct business activities that have an impact on society and that these consequences extend far beyond the profits reflected in an accounting income statement. Corporations conduct business activities that have an impact on the environment, people’s lives, and on notions of ethics and transparency. As a result, corporations have a responsibility to both their shareholders and society to explain their actions and to ensure they are reporting their actions accurately. These corporations are increasingly being held accountable for the ecological, societal, and ethical consequences of their operations. Investors are becoming more mindful of environmental, social, and governance (ESG) concerns when making investment decisions. There are four major reasons for doing so—(a) integrating portfolios with investors’ values and standards, (b) generating social impact by pressuring corporations to act ethically, (c) limiting exposure to different risks (climate, litigation, or legal risk), and (d) favoring sustainability by rewarding ESG adopters.
ESG issues are receiving more attention from corporate boards all over the world. Environmental criteria assess how a corporation protects the environment, such as its corporate policy addressing climate change. Social criteria focus on how the company maintains associations with its employees, suppliers, consumers, and the communities in which it operates. Governance is concerned with the leadership of a corporation, executive remuneration, independent audits, control systems, and the interests of shareholders. ESG disclosure refers to the qualitative and quantitative reporting of data by a company on its operations based on ESG standards. Though ESG disclosure is widely acknowledged as an important indicator of company sustainability, standardization of these disclosures has not yet occurred. Diverse rating agencies publish ESG performance indices that are based on diverse approaches (Huber et al. 2017), which may impede investors’ decision-making (Matos et al. 2020), and organizations are attempting to meet only the bare minimum. Currently, investors lack access to standardized data that may be used to detect ESG risks and opportunities.
This study focuses on companies in the Indian capital market, as India is among the fastest-growing emerging markets and started its ESG journey some time ago. As a result, India is most suited for a study on the effect of disclosure on security returns. As per PWC (2021), India started its sustainability journey in 2009 with National Voluntary Guidelines (NVGs) and moved ahead in 2012 and 2014 with Business Responsibility Report (BRR) and Corporate Social Responsibility as part of the new Companies Act 2013, respectively. Since then, the reporting standards have been becoming more stringent and applicable to an increasing number of firms. The evolution of ESG reporting in India is depicted in Figure 1. Most studies have analyzed the impact of ESG performance and ESG disclosure in the developed markets in Europe and the U.S. The Indian capital markets are different and much less studied by researchers on ESG implementation and its implications. Additionally, as India is in the transition stage, it will present the findings suitable for the economies planning to mandate ESG reporting.
The Securities and Exchange Board of India (SEBI) had mandated the biggest 1000 listed on Indian stock exchanges to report their ESG data following the Business Responsibility and Sustainability Reporting (BRSR) standards (SEBI 2023). Though the companies have to submit an ESG report, all ESG-related disclosures are voluntary, and the company may choose to disclose what it prefers and may conceal what it may not like. Zhang (2022), in their study, evaluate the various factors a firm may choose to disclose or not to disclose. The main aim of the current study is to evaluate whether ESG-related disclosures aid a company in its financial performance. The literature is ambiguous on the topic of whether the financial performances of firms disclosing to the fullest extent earn any premium over the ones that do not. This study is an attempt to understand the relationship between the disclosure of ESG data by companies and their financial performance relative to their peers. Do investors give preference to ESG disclosure while choosing investments? We hypothesize that the relationship between ESG disclosure and stock returns should be negative and informed through a literature survey. However, the investor voices and government regulations also make it sound that ESG performance and ESG reporting are desirable. Many funding houses and investment bankers use ESG strategies that outrightly oust the firms not disclosing ESG information. This, in turn, should reduce the demand and, thus, prices for opaque stocks, giving the benefit to ESG-disclosing companies. Another side of ESG disclosures is highlighted by Kim and Lyon (2015) whereby firms often use disclosures to greenwash themselves. Greenwash entails a company publishing confusing or misleading information to show itself as an ESG-compliant company, even when it is not. Kim and Lyon (2015) also state that companies doing well on the ESG front may choose not to disclose their activities, as some investors may consider it a waste of resources and a charge against their earnings. This phenomenon in the literature is known as brownwashing.
This study contributes to the literature in the following manner. It provides an approach to test the relationship between ESG disclosure and firm performance. Secondly, it provides fund managers and wealth advisors with a method to incorporate ESG into fund management practice and provides a practical way for corporates to plan their disclosure for maximizing security returns. This study finds a negative relationship between ESG disclosure and firm performance; it serves as an advisory to organizations that they should structure their disclosure according to their requirements and not simply disclose because it is required and everyone else is doing it.
This study is organized as follows. The next section presents the introduction and evolution of the asset-pricing models. The subsequent section gives a briefing on the Indian equity market and its organization. Section 4 discusses important studies on the detection of factor premiums and the use of ESG as a factor in asset-pricing models. Section 5 discusses the data and methodology utilized in this study. Section 6 discusses the descriptive and inferential statistics on factor premiums and their explanatory power in the models. The last section summarizes and concludes the study.

2. Asset-Pricing Models

There has been a significant advancement in the field of asset-pricing literature since the publications of the CAPM single-factor model by Sharpe (1964), Lintner (1965), and Mossin (1966). Contradicting the CAPM, the operation of capital markets is more sophisticated, and it is practically impossible to capture all the fluctuations using a single-factor model. Black (1972), Fama and MacBeth (1973), Ross (1976), Banz (1981), Basu (1983), Shanken (1985), Bhandari (1988), and Khandelwal and Chotia (2022), among others, provided critiques and challenges to the CAPM. Along with beta, using the size of the company as another important variable that helps explain expected portfolio returns was argued by Fama and French (1988, 1992, 1993) along with Gibbons et al. (1989) and Lo and MacKinlay (1990). Studies conducted by Basu (1983) and Reinganum (1981), among others, found that the P/E ratio is an important explanatory measure for security returns. Bhandari (1988) and Narayanaswamy and Phillips (1987), among others, found leverage as another important factor that explained the variations in portfolio expected return. Fama and French (1993) presented a three-factor model (FFTF) using size and value factors that were empirically more stable than the two-factor models used in earlier studies. Fama and French (1993) was also criticized and challenged by several studies (Haugen and Baker 1996; Fairfield et al. 2003; Titman et al. 2004; Novy-Marx 2013; Hou et al. 2015; etc.) on the grounds of other unidentified capital market anomalies. Carhart (1997), in his study, added a momentum factor to the existing FFTF, increasing the overall performance of the model. Recently, Fama and French (2015) introduced a five-factor model (FFFF) with additional investments and profitability factors, arguing that firms that actively invest their earning earnings command a premium, and the profitable firms earn more stock returns, as they have more earnings to distribute/reinvest. The FFFF model faced backlash due to the inadequacy of the model to reflect the risk–return fluctuations for micro stock portfolios. In a similar vein, the majority of the research (e.g., Hou et al. 2015; Clarke et al. 2016; Chiah et al. 2016) carried out across the world discovered that Fama and French’s five-factor model is unable to capture all of the risk–return variations and, thus, cannot be called a global model. Models with additional factors are continually being researched, checking the significance of more factors. Rosett (2001), Qin (2002), and Maiti and Balakrishnan (2018) explored the role of human capital in explaining stock returns and found promising results. Henriksson et al. (2019), Hübel and Scholz (2020), Lajili et al. (2020), Price (2022), and Maiti (2021) are a few of the researchers utilizing ESG as a factor in explaining the financial performance of companies. Tripathi et al. (2022) explored the economic-value-added concept and discussed its role in explaining the returns of a company. The search for additional factors is ongoing until a perfect model is reached. This study is an attempt to complete the asset-pricing puzzle using ESG disclosure premium as an additional factor for explaining security returns.

3. Indian Capital Market

The Indian equity market is a dynamic and quickly expanding market that is growing in prominence in the global economy. The market has two major exchanges, the Bombay Stock Exchange (BSE) and the National Stock Exchange (NSE), which represent more than 5000 publicly traded companies, with a combined market valuation of more than USD 2 trillion. The Indian equities market has grown significantly in recent years, owing to factors such as a growing economy, more foreign investment, and government reforms. With the rise of internet trading platforms and the availability of low-cost index funds and ETFs, the market has also become more accessible to individual investors.
Due to the SEBI’s mandate on the top 1000 listed companies on size to report data on sustainability, a study on investing in the Indian equities market is required. The disclosures will increase transparency and aid investors in comparing the investable companies and making sound investments. It would also assist investors in better understanding the risks and opportunities involved with investing in the Indian equities market, as well as in developing a smart investment strategy that matches their specific goals and risk tolerance.

4. Literature Review

One thousand chief executive officers (CEOs) from all over the world were surveyed by the United Nations Global Compact in 2013. Environmental, social, and governance (ESG)-related issues were crucial to the performance of more than 93% of the responding CEOs’ businesses (UN 2019). Pressures from diverse sectors are crucial to the growth of sustainable finance. Increasingly, stakeholders are concerned about how profitability is attained. Customers across all industries are becoming increasingly interested in the business practices of organizations and are keen to support ethical enterprises. Companies are increasingly compelled by new rules to comply with minimal ESG standards. The methodology used by credit rating firms now values ESG scores and disclosure. Several rating agencies recently pledged their commitment to include ESG elements in their credit rating process by signing the Principles of Responsible Investing (PRI) (Ferguson et al. 2019).
The European Commission has committed itself to addressing sustainability challenges in the financial industry to create a common foundation for carbon disclosure and ESG procedures. The commission has established several expert groups, with a focus on sustainable financing (Perissi and Jones 2022). Al Kurdi et al. (2023) investigated the factors that impact the ESG performance of the company in the European context and found that as the ESG-compliant firms do not experience problems (such as accidents, lawsuits, or government intrusion into management procedures) brought on by a lack of ESG practices in their everyday operations, businesses frequently regard ESG-related risks of low occurrences. Yet, businesses must control them to prevent unfavorable long-term effects (Henisz and McGlinch 2019). According to Moody’s, 33% of private-sector issuers view ESG risk as a significant credit factor (Venkataraman and Williams 2020). International engagement on ESG issues is encouraged by global initiatives, such as the Paris Agreement and the Sustainable Development Goals. Similarly, the financial sector is experiencing comparable pressures. BaFin (2020) affirmed that sustainability-related risks are a vital component of risk management. Consequently, the risk profile of a company is unquestionably influenced by its management of ESG concerns, which impacts the behavior of its stock price. The upsurge of ESG disclosures can be explained by three main ideas: the legitimacy theory, which is based on organizational legitimacy (Dowling and Pfeffer 1975); the agency theory, which is based on conflict of interests (Jensen and Meckling 1976; Khatib et al. 2022); and the signaling theory, which is based on the knowledge gaps between an organization and its stakeholders (Spence 1973). In order to create long-term value, a firm’s commitment to ESG practices is shown to its different stakeholders through ESG disclosure. The battle for new talent is another significant driver of sustainability. Eventually, the younger generation entering the workforce will be more concerned with their companies’ stance on ESG issues. As investors realize the usefulness of ESG data to comprehend business purpose, strategy, risk management capacity, and management quality, ‘ESG analysts’ are infiltrating Wall Street (Kell 2018). The consequences of not adhering to ESG requirements might be catastrophic when there are numerous stakeholders concerned with sustainability.
As the business’s stakeholders learn more about its ESG efforts, the business’s reputation grows, and its relationship with society becomes stronger (Velte and Stawinoga 2020). When a company reports how many ESG projects it has completed, it shows that it cares about society, which makes it more legitimate in the eyes of the public (Bamahros et al. 2022). The firm is rewarded with a difference in its share price, which shows that ESG disclosure has a long-term positive effect on the share price. This long-term relationship between the principal (the shareholders) and the agent (the top management) tends to eliminate the knowledge gap between industry and society (Kim et al. 2014; Sinha Ray and Goel 2022).
Branch et al. (2019) highlighted three key strategies to effective ESG-based portfolio construction. The first strategy relies on a binary yes or no for inclusion of ESG-compliant securities and exclusion for those that are non-compliant, respectively. The second strategy relies on assigning differential weights on the basis of ESG scores. The third tactic, which combines exclusion with scoring, requires extremely intricate implementations. Khan (2022), in his review, presented three research streams arising from ESG disclosure—(i) ESG performance as a result of firm characteristics, (ii) ESG performance through corporate governance theories, and (iii) financial corporality of ESG disclosure. Khan (2022), along with Kaiser and Welters (2019) and Lin and Dong (2018), affirm that though ESG performance brings financial performance, firms with high ESG disclosure were observed to generate less returns compared with their counterparts with low ESG disclosure scores. This is contradictory, as without disclosure, a firm cannot have an ESG score and, thus, no access to ESG premiums.
Ioannou et al. (2016) reported that companies report ESG (or CSR) in different ways. Most research on ESG reporting has been carried out using ratings and checklists from annual reports or company websites. (Aerts et al. 2008; Cho et al. 2010; Al Amosh and Khatib 2023). Under the voluntary disclosure theory, a company’s ESG engagement can be used to predict its ESG reporting practices. Companies with a good ESG performance would choose to report much about their ESG activities, while companies with a bad ESG performance would choose to report as little as possible. (Verrecchia 1983; Dye 1985). Cahan et al. (2015) reported that good ESG performance leads to good WOM, which helps the company receive a higher valuation (or lower cost of capital) because of the good press. Some companies use ESG disclosure to “greenwash” themselves, even if their ESG performance is not as good as they say it is (Cho et al. 2015). ESG reporting can also make a company look like it cares more about ESG than it does. Sometimes, managers might not want to talk about their ESG work because their investors might see it as a cost that lowers their returns. Because of this, a company that does well in ESG may lie about what it does in ESG (Kim and Lyon 2015). The results of empirical research on the relationship between ESG performance and financial performance have been mixed. Some studies have found no link between ESG success and the way a company talks about its business (Freedman and Wasley 1990). Others do not see a link between environmental success and disclosure. It is not clear how ESG disclosure affects value in the real world (Gillan et al. 2011). Some studies (De Villiers and Van Staden 2011; Bruno et al. 2022) find a negative link, while others (Dhaliwal et al. 2011; Lyon and Maxwell 2011; Gao et al. 2023; Climent et al. 2021) find a positive link.
Walkshäusl (2018) found incomplete data as a significant problem in ESG research. Across 22 established equities markets, he examined the impact of ESG traits on return. Over the 2002–2016 study period, the average proportion of companies with ESG ratings varied from 7% in Singapore to 35% in Ireland. In the United States, the nation with the highest average number of enterprises at 3604, 21% of firms, on average, have ESG ratings. The literature on environmental, social, and governance (ESG) issues is extensive but far from conclusive. An empirical test of the disclosure–returns relationship is performed using an asset pricing approach in the following section.

5. Research Methodology

The usual approach for measuring the impact of a variable on another is to study its causality or regression statistics. However, mapping the ESG disclosure with security returns is not feasible in this manner, as the ESG disclosure is published once a year, and we cannot model a regression equation with so few observations. Therefore, to study the impact of ESG disclosure on a company’s performance in stock markets, we utilized an asset-pricing approach per the methodologies of Fama and French (1993, 2015, 2020), Henriksson et al. (2019), and Maiti (2021).
To evaluate the impact of ESG disclosure within the asset-pricing theory, we construct a long–short portfolio, with zero initial investment and long position in one portfolio and short position in other portfolio for all factors (Fama and French 1993, 2015; Maiti 2021). Initially we used descriptive statistics to see whether there was any difference in the returns generated by the different portfolios. We then investigated the financial performance of this portfolio using regression and GRS tests. To determine the effect of ESG disclosure premium as an explanatory factor of expected returns, we employed time series regression and examined the performance of the model using t-statistic, F-statistic, and adjusted R-squared measures. The GRS test was utilized to test the joint significance of the intercepts (Gibbons et al. 1989; Agarwalla et al. 2017; Henriksson et al. 2019). The comprehensive breakdown of the procedure is explained below:

5.1. Data

The study used a dataset of 325 constituent companies of the BSE S&P 500 index for the period from January 2014 to December 2021. Of the 500 companies in aggregate, 158 were excluded from the analysis due to unavailability of ESG disclosure scores for all 8 years, and other 17 were excluded; as they were financial institutions, which would skew the results on value portfolio (Agarwalla et al. 2017). The exclusion of financial institutions from the analysis is a common practice in most asset pricing studies, as their use of financial leverage is much different from other companies’ business models. The study extracted monthly adjusted prices of the companies and BSE 500 index to compute returns. The study extracted ESG disclosure scores, market capitalization, and book-to-market ratios in annual frequencies to rebalance the portfolios as proxies of transparency, size, and value factors.
The study duration of 2014–2021 was utilized primarily due to two reasons—(a) ESG data of preceding years are sparse and lack solid methodological foundation and (b) the ESG implementation in India began in 2014 from the CSR mandate in the Companies Act 2013. Thus, it was mindful to analyze the impact of ESG disclosures in India from the time disclosure was advised to companies.

5.2. Methodology

Following the method of Fama and French (1992), Henriksson et al. (2019), and Maiti (2021) for risk-mimicking portfolio constructions, we formed portfolios on size, value, and ESG disclosure factors. Market capitalization was used as a proxy for size (Fama and French 1993), book-to-market ratios were used as a proxy for value (Maiti and Balakrishnan 2018), and ESG disclosure scores obtained from the Bloomberg’s database were used as a proxy for transparency factor (Climent et al. 2021). All risk-mimicking portfolios were constructed by the authors. Two portfolios were created on size factors such that the biggest 50% firms on market capitalization formed part of the ‘Big’ portfolio, and the remaining smallest 50% firms constituted the ‘Small’ portfolio. Similarly, the portfolios on value factor were formed such that the top 30% firms on book-to-market (B-M) ratios formed part of the ‘High’ portfolio, the middle 40% firms constituted the ‘Medium’ portfolio, and the bottom 30% firms were assigned to the ‘Low’ portfolio. On the basis of ESG disclosure score, the top 30% firms were assigned to ‘Transparent’ portfolio. The middle 40% firms were allocated to the ‘Neutral’ portfolio, and the bottom 30% firms constituted the ‘Opaque’ portfolio. The portfolios were rebalanced each year on 31 December to keep the factor effects intact (Fama and French 1993, 2015; Henriksson et al. 2019; Climent et al. 2021). The study period includes the pandemic period during which stock markets behaved unusually. To contain the effect of pandemic, a dummy variable was incorporated into the model. For time values beyond 30 January 2020, we used a dummy variable (value = 1) to examine the coronavirus pandemic separately, that is, from 31 January 2020, to 31 December 2021. The World Health Organization labelled the disease a Public Health Emergency of International Concern on 31 January 2020 (Sohrabi et al. 2020). We utilized the yield on the 91-day treasury bill issued by India as a proxy for the risk-free rate and returns on BSE S&P 500 index as a proxy for returns on the market portfolio.
We adopted the approach of Husse and Pippo (2021) to compute the factor returns of variable Small Minus Big (SMB)—size premium; High Minus Low (HML)—value premium; and Transparent Minus Opaque (TMO)—ESG disclosure premium. The factor returns on the SMB factor were computed as the net of two positions—long position in the ‘Small’ portfolio and short position in the ‘Big’ portfolio, such that SMB = Returns on ‘Small’ portfolio—Returns on ‘Big’ portfolio. In similar manners, the returns on HML and TMO factors were computed as differentials in returns of ‘High’ and ‘Low’, and ‘Transparent’ and ‘Opaque’ portfolios, respectively. The returns of Excess Returns on Market (ERM) factor were computed by subtracting the monthly risk-free rate of return from the monthly holding period returns of the market portfolio. This stage is referred to as the single sorting, where eight portfolios were created on the basis of single factors.
Similarly, the portfolios in the double-sorting approach were formed, wherein securities were allocated into multiple portfolios formed at the interaction of two of the three factors. This way, a total of 21 portfolios were formed. Similarly, 18 portfolios were formed on interaction of all 3 factors using the triple-sorting approach. The formed portfolios are illustrated in Figure 2. The returns on double- and triple-sorted portfolios were computed by averaging portfolios of a similar nature and calculating the differential returns. For instance, the TMO factor was calculated by averaging the returns on the SHO, SMO, SLO, BHO, BMO, and BLO portfolios and subtracting it from the average of the returns on the SHT, SMT, SLT, BHT, BMT, and BLT portfolios. The factor returns on SMB and HML were computed in the same way.
To test the relation of ESG disclosure on firm performance empirically, we employed the linear Fama and French three-factor (FFTF) regression model with the TMO variable to examine the influence of disclosure on equity risk premia in an environment with multi-factor models (Fama and French 2015; Asness et al. 2019). The tested portfolio used portfolios sorted on interaction of the three characteristics (size, value, ESG disclosure) as the dependent variables. The premiums ERM, SMB, HML, and TMO were used as explanatory variables. The first factor ERM was obtained from the traditional Capital Asset-Pricing Model (CAPM), which included simply the returns on market portfolio as an explanatory variable. The other two factors, SMB and HML, were obtained from the three-factor model created by Fama and French (1992), which reflects the size and value premiums earned by the smaller companies and the companies with lower book-to-market ratios. The fourth factor, TMO, was used for the first time in an asset-pricing model in an Indian context and is the uniqueness of this study. The tested model is specified below:
R i t R F t = a i + b i E R M t + s i S M B t + h i H M L t + t i T M O t + δ i D u m m y _ C o v t + e t .
where
  • Rit is the return on portfolio i at time period t.
  • RFt is the return on risk-free portfolio at time period t.
  • ERMt is the market premium for time period t. (Excess Market Return)
  • SMBt is the size premium for time period t. (Small Minus Big)
  • HMLt is the value premium for time period t. (High Minus Low)
  • TMOt is the disclosure premium for time period t. (Transparent Minus Opaque)
  • D u m m y _ C o v t is the dummy variable for time period t.
  • ai is the regression intercept, and bi, si, hi, and ti are the coefficients of market beta, size premium, value premium, and ESG disclosure premium variables, respectively. δ i denotes the coefficient measuring the effect of COVID-19 pandemic.
To test the robustness of this model, we used the Good Minus Bad (GMB) factor formed on similar breakpoints as TMO using the ESG scores from Bloomberg. The GMB factor and TMO factor cannot be used collectively in a model, as they are observed to be positively correlated with one another (Pyles 2020). Using correlated variables as independent variables causes the problem of multicollinearity in the resultant model. To test whether TMO factor is a better explanatory measure, we replaced it with GMB factor. A constraint with the use of GMB factor was the unavailability of data. The data before 2017 were unavailable for most companies. Therefore, to test the significance of the GMB factor, we utilized the same methodology to test the impact of GMB on portfolio returns. We tested the below equation as part of robustness tests.
R i t R F t = a i + b i E R M t + s i S M B t + h i H M L t + g i G M B t + δ i D u m m y _ C o v t + e t .
where
  • GMBt denotes the returns on ESG premium for time period ‘t’, and gi denotes the regression coefficient for portfolio ‘i’.
We used the monthly data from January 2017 to December 2021 for a set of 118 companies. Keeping the methodology same for the analysis, we tested which factors better explained the portfolio returns.

5.3. GRS Test

The Wald test, established by Gibbons et al. (1989), is a statistical test used in finance to test the null hypothesis that a set of asset returns can be explained by a given factor model. The null hypothesis of the GRS test is that the model being tested is correctly specified and that the residuals are homoscedastic and serially uncorrelated. The null hypothesis of the GRS test is that the residual errors of the model are random and unrelated to one another over time and that there is no systematic risk factor that influences the returns of the assets under test beyond what is accounted for by the given factor model. The alternative hypothesis is that the model is incorrectly specified and that the residuals are correlated due to a systematic risk factor or other source that the model is omitting. The GRS test is frequently combined with other tests, such as the Fama–Macbeth test, the Carhart four-factor model, or the Fama and French five-factor model, to evaluate the reliability of asset-pricing models and establish whether a particular set of factors can sufficiently explain the returns of a portfolio or asset.

6. Results and Discussion

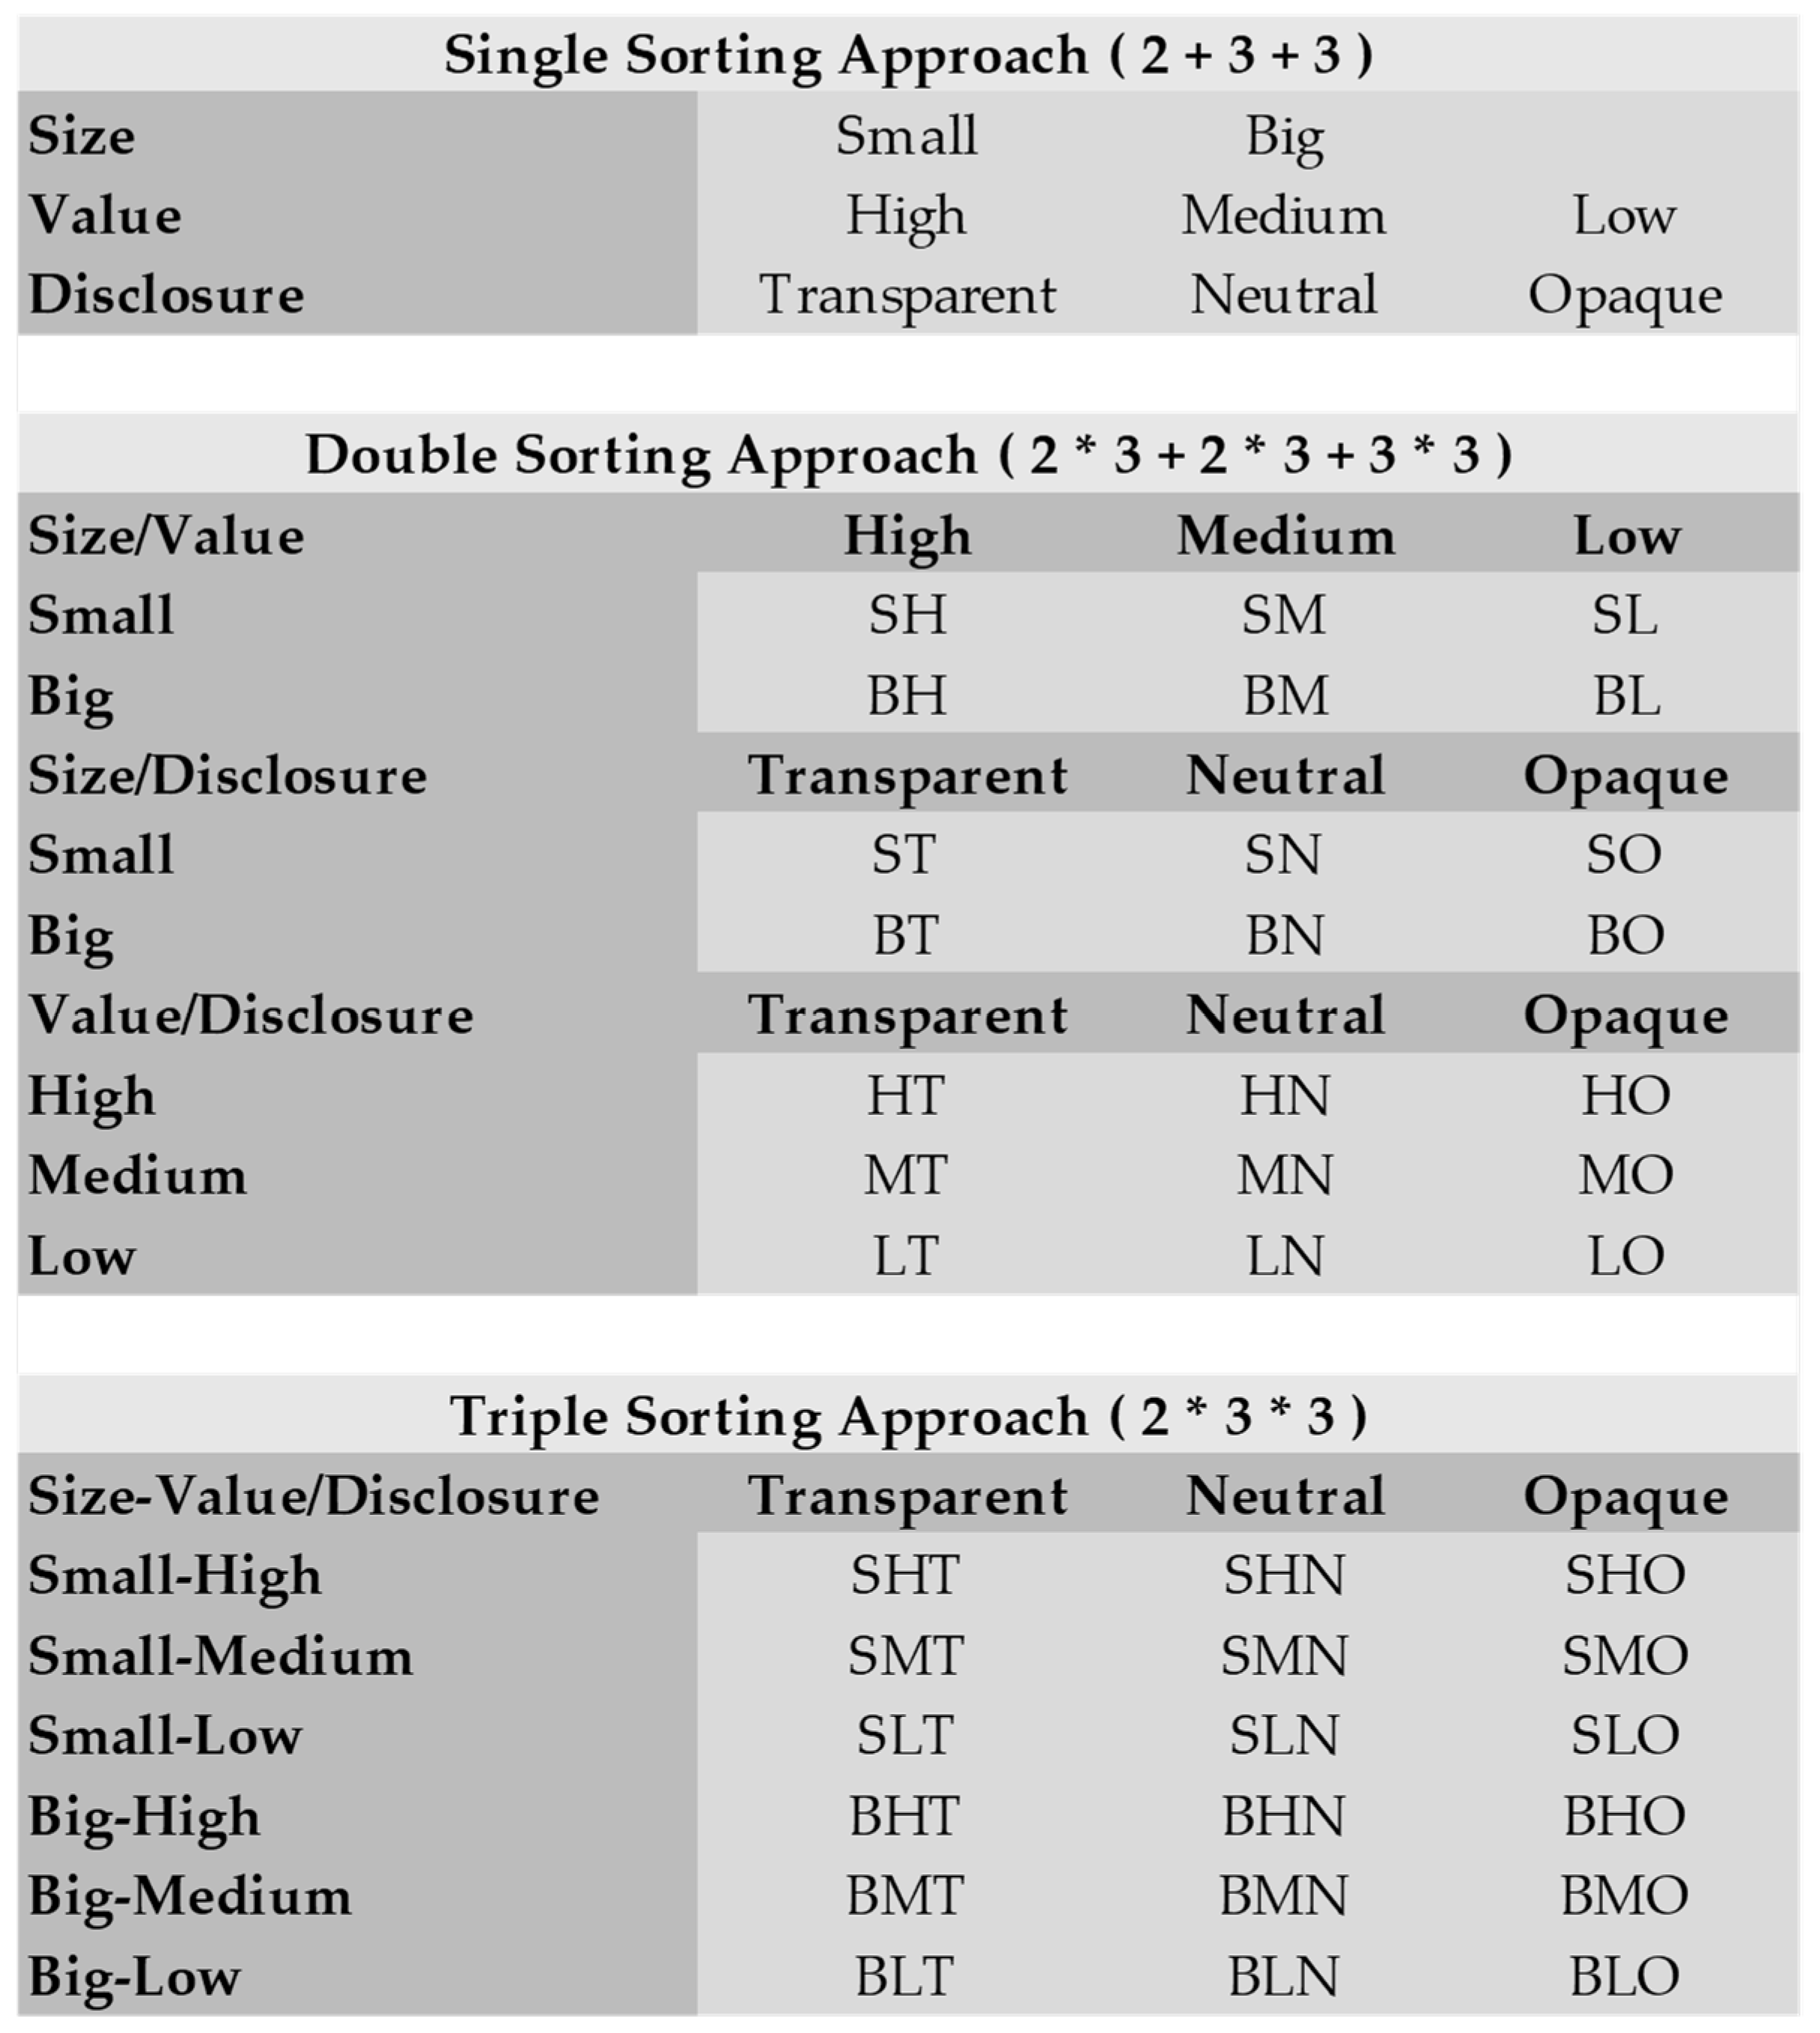
Using portfolio construction breakpoints from Fama and French (1993, 2015) and Henriksson et al. (2019), we formed two portfolios on size, three portfolios on value, and three portfolios on ESG disclosure. Table 1 summarizes the descriptive statistics of portfolio returns sorted on size (small and big), value (high, medium, and low), and ESG disclosure (transparent, neutral, and opaque). The excess mean returns for the small portfolio was comparatively higher than the big portfolio, thus affirming the presence of a size premium (0.07%). Similarly, on observing the portfolio returns on value portfolios, the portfolio with low value (lower book-to-market ratio) was observed to have higher excess mean returns in comparison with high value (higher book-to-market ratio) portfolio, affirming the presence of a value premium (0.95%) in the Indian capital market. The excess mean returns on portfolios sorted on ESG disclosure scores presented a contrasting view. The portfolio comprising transparent stocks (high ESG disclosure scores) generated less excess returns in comparison with opaque stocks (low ESG disclosure scores), signifying a negative disclosure premium (−0.54%). The difference on the portfolio returns was not only based on average returns, but the risk component also varies significantly. The standard deviations (measures of risk) on the portfolios based on size were indifferent on the riskiness. On the other hand, the portfolios formed on value and disclosure had varied riskiness due to constituent securities. The portfolios with high B/M ratios had higher standard deviation in comparison with the securities with lower B/M ratios. Similarly, transparent stocks had comparatively less risks than the opaque stocks. The presence of factor premiums was further evaluated using double-sorting and triple-sorting of portfolios on the basis of interactions among size, value, and disclosure factor.
Table 2a–c summarize the descriptive statistics of portfolio returns sorted on interactions among size and value, size, and disclosure and between value and disclosure factors. It can be observed from Table 2a that the value effect was dominant over the size effect. Size effect was observed; however, value premiums were more dominant. Another observation is the high standard deviation in the low portfolio compared with the high portfolios. Looking at the interactions between size and disclosure in Table 2b, the disclosure effect was significantly observed, and the size effect faded except in the case of opaque portfolios. The standard deviation for transparent portfolios was less than that of opaque portfolios, suggesting investment in transparent stocks as less risky. The findings for interactions between value and disclosure factors were similar. Both value premium and disclosure premiums were dominant, with opaque stocks being riskier in comparison with transparent stocks.
Table 3 summarizes the descriptive statistics of portfolio returns sorted on interactions among size, value, and ESG disclosure. The portfolio formed at the intersection of small in size, low in value, and opaque in disclosure characteristics was observed to generate the highest average returns. In contrast, the portfolio formed at the intersection of big in size, high in value, and transparent in disclosure characteristics was observed to generate the lowest returns with high risk. It is worth noting that the companies chosen for analysis were the surviving constituents of the S&P BSE 500 index, and the companies who dropped below the market cap (excessive downward movements) were not part of the analysis, thus, the positive mean returns for all companies.
Table 4 summarizes the descriptive statistics of factor premiums—ERM, SMB, HML, and TMO. The factors ERM and SMB rewarded a positive premium to the companies, which is well-established in theory. The factors HML and TMO had negative mean returns, implying that (i) firms with high B/M ratios generate less returns than companies with low B/M ratios and (ii) firms with high disclosure exercise less returns compared with firms with low disclosure. The findings on ERM, SMB, and TMO were consistent with the expectations; however, the negative mean returns of HML factor contradicted the findings of established theories. Table 5 consists of the pair-wise correlations between the independent variables. The range of correlations varies from −0.1744 to 0.0646, signifying no correlation. This suggests that there was no problem of multicollinearity in the dataset. Additionally, a variance inflation factor (VIF) test also confirmed that the variables were free from influence of each other.
The respective portfolio returns were then regressed using time-series regression, consisting of 8 single-sorted portfolios on size, value, and disclosure factors, with 5 independent variables consisting of 96 time-series datapoints each. The independent variables used in the regression were ERM (Sharpe 1964), SMB and HML (Fama and French 1992, 1993), TMO (Henriksson et al. 2019; Climent et al. 2021), and a binary variable for estimating the effect of COVID-19 pandemic on stock returns. The regression results are reported in Table 6. The coefficients of all factor premiums and intercept term are reported in the first line along with the adjusted R-squared statistic. The second line consists of the associated t-statistic values in parentheses. The coefficients are also marked with an asterisk (*) to denote levels of significance of the coefficient of factor premiums. Regression results for all single-sorted portfolios returned an insignificance of ERM factor, which captured the excessive returns from the market portfolio. The ERM factor was significant in all asset-pricing models since its first use. The explanatory power of ERM was reduced as a result of inclusion size, value, and disclosure premium. Referring to the study of Khandelwal and Chotia (2022), the ERM factor is significant in a bivariate relationship with portfolio returns. Another important observation from the regression results is the insignificance of the TMO factor for transparent portfolio. The results by regressing double-sorted portfolios are arranged in Table 7.
The findings from the single-sorting approach are evident in double-sorted portfolios as well. The ERM factor was insignificant in explaining the portfolio returns. Similarly, for portfolios having any proportion of transparent stocks, the TMO factor became insignificant in explaining portfolio returns. The SMB factor was also insignificant in one instance of the big–high portfolio. Another interesting observation is the adjusted R-squared statistic of portfolios sorted on value. The adjusted R-squared statistic denotes the variance percentage explained by the independent variables in the dependent variable. The statistic had high values for portfolio consisting of stocks with high B/M ratio compared with its counterpart. This effect can be seen in interactions with size and disclosure factors as well.
Table 8 summarizes the regression results on triple-sorted portfolio returns. The observations from previous regression results are evident with additional explorations. The ERM variable was insignificant across all portfolios since the inclusion of TMO factor. The TMO factor was significant in explaining portfolio returns in all portfolios except those portfolios with transparent stocks. Both these findings were consistent in all three sorting approaches. New signals that were observed only in triple-sorting include insignificance of the SMB factor for the big–low–transparent portfolio and big–low–opaque portfolios. Similar insignificance was also observed in the big–high portfolio group, and the same was observed in the double-sorting portfolio of size and value. The binary variable ‘Dummy_Cov’ was also seen to be insignificant at 95% confidence level in a few models (SHO, SMN, SMO, BHN, BLN, and BLO), which may be due to the presence of the COVID-19 pandemic effect on other factors’ premiums. A decomposition of variance can be performed to understand the impact of each factor in explaining portfolio returns on different portfolios. The negative value premiums post-2015 were also observed by Fama and French (2021). Fama and French (2017) found large average value premiums in the Asia–Pacific region during 1990–2015. However, a later study (Fama and French 2021) found that the returns on value portfolio during the study of the second half of the 1962–2019 period were significantly lower. This study used the data from 2014–2021 (SP1, henceforth) and found negative returns on the value portfolio in Indian capital market.
As part of robustness tests, this study further tested the performance of the TMO variable against the GMB factor, as it is established as a worthy factor in the asset-pricing puzzle (Henriksson et al. 2019; Pyles 2020; Maiti 2021). The portfolio returns were tested for the impact of factor returns for the period from 2017 to 2021 (SP2, henceforth). The regression resulting from triple-sorted portfolios created from GMB and TMO are presented in Table 9 and Table 10, respectively. The regression findings from SP2 suggest that the ERM was a significant factor in explaining security returns but was found redundant during SP1. In Table 9, the statistics for portfolios SMN, SMB, SLG, SLN, and SLB are not reported, as there were no securities in these categories. The analysis suggests that ERM, SMB, and HML factors were significant. The GMB factor was found to be significant in the portfolio of ‘Small’ stocks and ‘Good’ stocks. The dummy variable returned to being redundant, as its coefficient was statistically insignificant. This implies that the effect of pandemic was being captured by other factor(s). The significance of ERM factor also relates to the insignificance of the dummy variable. The pandemic also affected the market portfolio significantly, and thus, the dummy variable was rendered insignificant. Another interpretation for the dummy variable being insignificant can be attributed to the impact of government policing in India, such as demonetization and the introduction of the Goods and Services Tax (GST) law (Mishra et al. 2020). The findings from Table 10 have similar results. The findings of portfolios SMT, SMO, SLT, SLN, and SLO are not reported as there were no constituent securities in these portfolios. The significance of TMO factor was observed only in transparent and neutral stocks, with the coefficient being positive for transparent stocks and negative for opaque stocks. This is in line with the findings of Henriksson et al. (2019). Another observation is related to the model performance. The adjusted R-squared values were comparatively more significant for the model with the TMO factor.
Table 11 summarizes the GRS test statistics and associated p-values for joint significance of (a) the FFTF model, (b) the FFTF and GMB model, and (c) the FFTF and TMO model for both SP1 and SP2. The results for FFTF model in SP1 show that the intercept was statistically significant, suggesting that the model was incorrectly specified, as it omitted key explanatory variables. The results for the FFTF and GMB model are not reported for SP1, as the data on ESG scores were not available during the period. The results for the FFTF and TMO models suggest that the regression intercept was jointly insignificant, and the model was correctly specified. The GRS test combined with the significance of the factor coefficient validates the use of the TMO factor in the asset-pricing models. The results for SP2 suggest that all three models were statistically insignificant, implying they were correctly specified. The low F-statistic for the TMO model suggests that it had more explanatory power than the FFTF model or FFTF + GMB models during SP2.

7. Conclusions and Implications

This study analyzed the role of ESG disclosure factor in explaining financial performance of index constituents of BSE 500 stocks. Using an asset pricing approach, long short portfolios were created on the basis of size, value, and ESG disclosure factors. Initially descriptive results were compared for portfolios formed on the above factors using univariate, bivariate, and trivariate sorting approaches. The descriptive results confirmed the presence of factors premiums. To explore further, time-series regressions were utilized to check the explanatory power of factor premiums. The study found a significant positive premium for size factor and significant negative premiums for transparency and value factors. Lastly, GRS test was employed to test the joint significance of the five-factor model, including excess market returns, size premium, value premium, disclosure premium, and a dummy variable for the COVID-19 pandemic effect on portfolios.
For establishing the robustness of the factors, the suggested model was compared with the FFTF + GMB model for a smaller study period. The GRS test statistics indicated that the intercepts were jointly insignificant, suggesting that the model significantly captured the variations in asset prices. The GRS test and higher adjusted R-squared values also confirmed that the model with the TMO factor had higher explanatory power than the model with the GMB factor. Finally, we found that excessive ESG disclosures by companies led to a negative risk premium in comparison with their non-transparent peers. We also highlight that the portfolio risk for opaque portfolios was significantly higher than that of transparent portfolios, implying that firms that do not disclose ESG information suffer the most in bearish market conditions against those that disclose.
The findings of this study have important implications. Firstly, the findings on ESG disclosure are important for ESG analysts, Chief Sustainability Officers (CSOs), Chief Financial Officers (CFOs), and other finance managers, as the government has mandated the top 1000 listed companies in the Indian capital markets to disclose ESG-related information from FY 2022–2023 (Das et al. 2023). These companies need know-how on what, when, and how much to disclose to maximize their financial performance in capital markets. Secondly, the study is important for fund and asset managers, wealth advisors, and portfolio managers, as this discusses the role of ESG disclosure in the financial performance of a firm. This study faces the following limitations. Firstly, being the first study on using ESG disclosure as a factor in asset-pricing models, this study lacks solid theoretical establishment for inclusion of ESG disclosure premiums. Secondly, the concepts of sustainability and ESG are relatively new, and, thus, empirical data for most companies are not available for past years. Thirdly, the results of the regression in SP2 may also not be reliable due to the small sample size, and a portfolio allocation in triple-sorted categories may not have been justified. This study analyzed data of all the companies in the BSE 500 index with available ESG disclosure scores. The data for all companies are not yet available to date, indicating that not all companies are disclosing their data on ESG datapoints. Fourthly, the COVID-19 pandemic affected industries differently. One industry may have been more affected than another, and using a dummy variable will assume that the impact of the pandemic was of the same magnitude on all sectors. Therefore, scholars must come up with more robust methodologies to account for the seasonality or industry-wide factors. To take this study forward, scholars can utilize the ESG-related scores by other databases and compare their findings with this study. The challenges in disclosing ESG data should be explored further by the scholars. The findings of this study can be compared globally with similar countries using the asset-pricing approach, which will further help in generalizing ESG disclosure as a factor.

Author Contributions

Conceptualization, V.K. and P.S.; methodology, P.S.; software, V.K.; validation, V.C. and P.S.; formal analysis, V.K.; data curation, V.K.; writing—original draft preparation, V.K.; writing—review and editing, V.C.; visualization, V.K.; supervision, P.S.; project administration, V.C. All authors have read and agreed to the published version of the manuscript.

Funding

This research received no external funding. The APC was funded by the University of Stirling.

Data Availability Statement

The data can be made available on reasonable request to the corresponding author.

Acknowledgments

We thank the editors and anonymous referees for their support in improving the readability and quality of this research manuscript.

Conflicts of Interest

The authors declare no conflict of interest.

References

  1. Aerts, Walter, Denis Cormier, and Michel Magnan. 2008. Corporate environmental disclosure, financial markets and the media: An international perspective. Ecological Economics 64: 643–59. [Google Scholar] [CrossRef]
  2. Agarwalla, Sobhesh Kumar, Joshy Jacob, and Jayanth R. Varma. 2017. Size, value, and momentum in Indian equities. Vikalpa 42: 211–19. [Google Scholar] [CrossRef]
  3. Al Amosh, Hamzeh, and Saleh F. A. Khatib. 2023. ESG performance in the time of COVID-19 pandemic: Cross-country evidence. Environmental Science and Pollution Research 30: 39978–93. [Google Scholar] [CrossRef]
  4. Al Kurdi, Amneh, Hamzeh Al Amosh, and Saleh FA Khatib. 2023. The mediating role of carbon emissions in the relationship between the board attributes and ESG performance: European evidence. EuroMed Journal of Business, forthcoming. [Google Scholar] [CrossRef]
  5. Asness, Clifford S., Andrea Frazzini, and Lasse Heje Pedersen. 2019. Quality Minus Junk. Review of Accounting Studies 24: 34–112. [Google Scholar] [CrossRef] [Green Version]
  6. BaFin. 2020. Guidance Notice on Dealing with Sustainability Risks. Accounting Studies 24: 34–112. [Google Scholar]
  7. Bamahros, Hasan Mohamad, Abdulsalam Alquhaif, Ameen Qasem, Wan Nordin Wan-Hussin, Murad Thomran, Shaker Dahan Al-Duais, Siti Norwahida Shukeri, and Hytham MA Khojally. 2022. Corporate Governance Mechanisms and ESG Reporting: Evidence from the Saudi Stock Market. Sustainability 14: 6202. [Google Scholar] [CrossRef]
  8. Banz, Rolf W. 1981. The relationship between return and market value of common stocks. Journal of Financial Economics 9: 3–18. [Google Scholar] [CrossRef] [Green Version]
  9. Basu, Sanjoy. 1983. The relationship between earnings’ yield, market value and return for NYSE common stocks: Further evidence. Journal of Financial Economics 12: 129–56. [Google Scholar] [CrossRef]
  10. Bhandari, Laxmi Chand. 1988. Debt/equity ratio and expected common stock returns: Empirical evidence. The Journal of Finance 43: 507–28. [Google Scholar] [CrossRef]
  11. Black, Fischer. 1972. Capital market equilibrium with restricted borrowing. The Journal of Business 45: 444–55. [Google Scholar] [CrossRef] [Green Version]
  12. Branch, Michael, Lisa R. Goldberg, and Pete Hand. 2019. A guide to ESG portfolio construction. The Journal of Portfolio Management 45: 61–66. [Google Scholar] [CrossRef]
  13. Bruno, Giovanni, Mikheil Esakia, and Felix Goltz. 2022. “Honey, I Shrunk the ESG Alpha”: Risk-Adjusting ESG Portfolio Returns. The Journal of Investing 31: 45–61. [Google Scholar] [CrossRef]
  14. Cahan, Steven F., Chen Chen, Li Chen, and Nhut H. Nguyen. 2015. Corporate social responsibility and media coverage. Journal of Banking & Finance 59: 409–22. [Google Scholar]
  15. Carhart, Mark M. 1997. On persistence in mutual fund performance. The Journal of Finance 52: 57–82. [Google Scholar] [CrossRef]
  16. Chiah, Mardy, Daniel Chai, Angel Zhong, and Song Li. 2016. A Better Model? An empirical investigation of the Fama–French five-factor model in Australia. International Review of Finance 16: 595–638. [Google Scholar] [CrossRef]
  17. Cho, Charles H., Matias Laine, Robin W. Roberts, and Michelle Rodrigue. 2015. Organized hypocrisy, organizational façades, and sustainability reporting. Accounting, Organizations and Society 40: 78–94. [Google Scholar] [CrossRef]
  18. Cho, Charles H., Robin W. Roberts, and Dennis M. Patten. 2010. The language of US corporate environmental disclosure. Accounting, Organizations and Society 35: 431–43. [Google Scholar] [CrossRef]
  19. Clarke, Roger, Harindra De Silva, and Steven Thorley. 2016. Fundamentals of efficient factor investing (corrected May 2017). Financial Analysts Journal 72: 9–26. [Google Scholar] [CrossRef]
  20. Climent, Ramón Bermejo, Isabel Figuerola-Ferretti Garrigues, Ioannis Paraskevopoulos, and Alvaro Santos. 2021. ESG disclosure and portfolio performance. Risks 9: 172. [Google Scholar] [CrossRef]
  21. Das, Avinash, Arjun Goswami, and Anmol Jain. 2023. An Introduction of ESG Disclosures in Indian Regulatory Space—Part 1. Business Today. Available online: https://www.businesstoday.in/technology/news/story/an-introduction-of-esg-disclosures-in-indian-regulatory-space-part-1-371707-2023-02-28 (accessed on 8 March 2023).
  22. De Villiers, Charl, and Chris J. Van Staden. 2011. Where firms choose to disclose voluntary environmental information. Journal of Accounting and Public Policy 30: 504–25. [Google Scholar] [CrossRef]
  23. Dhaliwal, Dan S., Oliver Zhen Li, Albert Tsang, and Yong George Yang. 2011. Voluntary nonfinancial disclosure and the cost of equity capital: The initiation of corporate social responsibility reporting. The Accounting Review 86: 59–100. [Google Scholar]
  24. Dowling, John, and Jeffrey Pfeffer. 1975. Organizational Legitimacy: Social Values and Organizational Behavior. Pacific Sociological Review 18: 122–36. [Google Scholar] [CrossRef]
  25. Dye, Ronald A. 1985. Disclosure of nonproprietary information. Journal of Accounting Research 23: 123–45. [Google Scholar]
  26. Fairfield, Patricia M., J. Scott Whisenant, and Teri Lombardi Yohn. 2003. Accrued earnings and growth: Implications for future profitability and market mispricing. The Accounting Review 78: 353–71. [Google Scholar]
  27. Fama, Eugene F., and James D. MacBeth. 1973. Risk, Return, and Equilibrium: Empirical Tests. Journal of Political Economy 81: 607–36. [Google Scholar]
  28. Fama, Eugene F., and Kenneth R. French. 1988. Permanent and temporary components of stock prices. Journal of Political Economy 96: 246–73. [Google Scholar]
  29. Fama, Eugene F., and Kenneth R. French. 1992. The Cross-Section of Expected Stock Returns. The Journal of Finance 47: 427–65. [Google Scholar]
  30. Fama, Eugene F., and Kenneth R. French. 1993. Common risk factors in the returns on stocks and bonds. Journal of Financial Economics 33: 3–56. [Google Scholar]
  31. Fama, Eugene F., and Kenneth R. French. 2015. A Five-Factor Asset Pricing Model. Journal of Financial Economics 116: 1–22. [Google Scholar] [CrossRef] [Green Version]
  32. Fama, Eugene F., and Kenneth R. French. 2017. International tests of a five-factor asset pricing model. Journal of Financial Economics 123: 441–63. [Google Scholar]
  33. Fama, Eugene F., and Kenneth R. French. 2020. Comparing cross-section and time-series factor models. The Review of Financial Studies 33: 1891–926. [Google Scholar] [CrossRef]
  34. Fama, Eugene F., and Kenneth R. French. 2021. The value premium. The Review of Asset Pricing Studies 11: 105–21. [Google Scholar] [CrossRef]
  35. Ferguson, Michael, Nicole Martin, and Gregg Lemos-Stein. 2019. ESG Sections Added in Corporate Credit Ratings Reports. Available online: https://www.spglobal.com/en/research-insights/articles/sp-global-ratings-launches-esg-sections-in-corporate-credit-rating-reports (accessed on 14 March 2023).
  36. Freedman, Martin, and Charles Wasley. 1990. The association between environmental performance and environmental disclosure in annual reports and 10Ks. Advances in Public Interest Accounting 3: 183–93. [Google Scholar]
  37. Gao, Shang, Fanchen Meng, Wenshuai Wang, and Wenxin Chen. 2023. Does ESG always improve corporate performance? Evidence from firm life cycle perspective. Frontiers in Environmental Science 11: 103. [Google Scholar]
  38. Gibbons, Michael R., Stephen A. Ross, and Jay Shanken. 1989. A test of the efficiency of a given portfolio. Econometrica 57: 1121–52. [Google Scholar]
  39. Gillan, Stuart L., Andrew Koch, and Laura T. Starks. 2011. Firms and social responsibility: A review of ESG and CSR research in corporate finance. Journal of Corporate Finance 66: 101889. [Google Scholar] [CrossRef]
  40. Haugen, Robert A., and Nardin L. Baker. 1996. Commonality in the determinants of expected stock returns. Journal of Financial Economics 41: 401–39. [Google Scholar]
  41. Henisz, Witold J., and James McGlinch. 2019. ESG, material credit events, and credit risk. Journal of Applied Corporate Finance 31: 105–17. [Google Scholar] [CrossRef]
  42. Henriksson, Roy, Joshua Livnat, Patrick Pfeifer, and Margaret Stumpp. 2019. Integrating ESG in portfolio construction. The Journal of Portfolio Management 45: 67–81. [Google Scholar]
  43. Hou, Kewei, Chen Xue, and Lu Zhang. 2015. Digesting anomalies: An investment approach. The Review of Financial Studies 28: 650–705. [Google Scholar] [CrossRef] [Green Version]
  44. Huber, Betty Moy, Michael Comstock, Davis Polk, and L. L. P. Wardwell. 2017. ESG Reports and Ratings: What They Are, Why They Matter. The Harvard Law School Forum on Corporate Governance. Available online: https://corpgov.law.harvard.edu/2017/07/27/esg-reports-and-ratings-what-they-are-why-they-matter/ (accessed on 18 January 2023).
  45. Hübel, Benjamin, and Hendrik Scholz. 2020. Integrating sustainability risks in asset management: The role of ESG exposures and ESG ratings. Journal of Asset Management 21: 52–69. [Google Scholar] [CrossRef]
  46. Husse, Thomas, and Federico Pippo. 2021. Responsible Minus Irresponsible-a determinant of equity risk premia? Journal of Sustainable Finance & Investment 2021: 1961557. [Google Scholar] [CrossRef]
  47. Ioannou, Ioannis, Shelley Xin Li, and George Serafeim. 2016. The effect of target difficulty on target completion: The case of reducing carbon emissions. The Accounting Review 91: 1467–92. [Google Scholar] [CrossRef]
  48. Jensen, Michael C., and William H. Meckling. 1976. Theory of the Firm: Managerial Behavior, Agency Costs and Ownership Structure. Journal of Financial Economics 3: 305–60. [Google Scholar] [CrossRef]
  49. Kaiser, Lars, and Jan Welters. 2019. Risk-mitigating effect of ESG on momentum portfolios. Journal of Risk Finance 20: 542–55. [Google Scholar] [CrossRef]
  50. Kell, Georg. 2018. The Remarkable Rise of ESG. Forbes. Available online: https://www.forbes.com/sites/georgkell/2018/07/11/the-remarkable-rise-of-esg/ (accessed on 14 January 2023).
  51. Khan, Muhammad Arif. 2022. ESG disclosure and firm performance: A bibliometric and meta-analysis. Research in International Business and Finance 61: 101668. [Google Scholar] [CrossRef]
  52. Khandelwal, Vinay, and Varun Chotia. 2022. Is There a Beta Anomaly? Evidence from the India. Annals of Financial Economics 17: 2250020. [Google Scholar] [CrossRef]
  53. Khatib, Saleh F. A., Dewi Fariha Abdullah, Ahmed Elamer, and Saddam A. Hazaea. 2022. The development of corporate governance literature in Malaysia: A systematic literature review and research agenda. Corporate Governance: The International Journal of Business in Society 22: 1026–53. [Google Scholar]
  54. Kim, Eun-Hee, and Thomas P. Lyon. 2015. Greenwash vs. brownwash: Exaggeration and undue modesty in corporate sustainability disclosure. Organization Science 26: 705–23. [Google Scholar] [CrossRef] [Green Version]
  55. Kim, Yongtae, Haidan Li, and Siqi Li. 2014. Corporate Social Responsibility and Stock Price Crash Risk. Journal of Banking and Finance 43: 1–13. [Google Scholar] [CrossRef] [Green Version]
  56. Lajili, Kaouthar, Lauren Yu-Hsin Lin, and Anoosheh Rostamkalaei. 2020. Corporate governance, human capital resources, and firm performance: Exploring the missing links. Journal of General Management 45: 192–205. [Google Scholar] [CrossRef]
  57. Lin, K. C., and Xiaobo Dong. 2018. Corporate social responsibility engagement of financially distressed firms and their bankruptcy likelihood. Advances in Accounting 43: 32–45. [Google Scholar] [CrossRef]
  58. Lintner, John. 1965. Security prices, risk, and maximal gains from diversification. The Journal of Finance 20: 587–615. [Google Scholar]
  59. Lo, Andrew W., and A. Craig MacKinlay. 1990. When are contrarian profits due to stock market overreaction? The Review of Financial Studies 3: 175–205. [Google Scholar] [CrossRef] [Green Version]
  60. Lyon, Thomas P., and John W. Maxwell. 2011. Greenwash: Corporate environmental disclosure under threat of audit. Journal of Economics & Management Strategy 20: 3–41. [Google Scholar]
  61. Maiti, Moinak. 2021. Is ESG the succeeding risk factor? Journal of Sustainable Finance & Investment 11: 199–213. [Google Scholar]
  62. Maiti, Moinak, and A. Balakrishnan. 2018. Is human capital the sixth factor? Journal of Economic Studies 45: 710–37. [Google Scholar] [CrossRef]
  63. Matos, Pedro Verga, Victor Barros, and Joaquim Miranda Sarmento. 2020. Does ESG affect the stability of dividend policies in Europe? Sustainability 12: 8804. [Google Scholar] [CrossRef]
  64. Mishra, Alok Kumar, Badri Narayan Rath, and Aruna Kumar Dash. 2020. Does the Indian financial market nosedive because of the COVID-19 outbreak, in comparison to after demonetisation and the GST? Emerging Markets Finance and Trade 56: 2162–80. [Google Scholar] [CrossRef]
  65. Mossin, Jan. 1966. Equilibrium in a capital asset market. Econometrica: Journal of the Econometric Society 34: 768–83. [Google Scholar] [CrossRef]
  66. Narayanaswamy, C R, and Herbert E Phillips. 1987. CAPM, valuation of firms, and financial leverage. Quarterly Journal of Business and Economics, 86–93. [Google Scholar]
  67. Novy-Marx, Robert. 2013. The other side of value: The gross profitability premium. Journal of Financial Economics 108: 1–28. [Google Scholar] [CrossRef] [Green Version]
  68. Perissi, Ilaria, and Aled Jones. 2022. Investigating European Union decarbonization strategies: Evaluating the pathway to carbon neutrality by 2050. Sustainability 14: 4728. [Google Scholar] [CrossRef]
  69. Price, Gregory N. 2022. Incarceration risk, asset pricing, and black-white wealth inequality. Social Science Quarterly 103: 1306–19. [Google Scholar] [CrossRef]
  70. PWC. 2021. Mainstreaming ESG via Business Responsibility and Sustainability Reporting. PricewaterhouseCoopers Private Limited. Available online: https://www.pwc.in/assets/pdfs/consulting/esg/business-responsibility-and-sustainability-report.pdf (accessed on 28 February 2023).
  71. Pyles, Mark K. 2020. Examining portfolios created by bloomberg ESG scores: Is disclosure an alpha factor? The Journal of Impact and ESG Investing, forthcoming. [Google Scholar] [CrossRef]
  72. Qin, Jie. 2002. Human-capital-adjusted capital asset pricing model. The Japanese Economic Review 53: 182–98. [Google Scholar] [CrossRef]
  73. Reinganum, Marc R. 1981. Misspecification of capital asset pricing: Empirical anomalies based on earnings’ yields and market values. Journal of Financial Economics 9: 19–46. [Google Scholar] [CrossRef]
  74. Rosett, Joshua G. 2001. Equity risk and the labor stock: The case of union contracts. Journal of Accounting Research 39: 337–64. [Google Scholar] [CrossRef]
  75. Ross, Stephen A. 1976. Options and efficiency. The Quarterly Journal of Economics 90: 75–89. [Google Scholar] [CrossRef]
  76. SEBI. 2023. Consultation Paper on ESG Disclosures, Ratings and Investing. In SEBI. Securities and Exchange Board of India. Available online: https://www.sebi.gov.in/reports-and-statistics/reports/feb-2023/consultation-paper-on-esg-disclosures-ratings-and-investing_68193.htm (accessed on 14 March 2023).
  77. Shanken, Jay. 1985. Multivariate tests of the zero-beta CAPM. Journal of Financial Economics 14: 327–48. [Google Scholar] [CrossRef]
  78. Sharpe, William F. 1964. Capital asset prices: A theory of market equilibrium under conditions of risk. The Journal of Finance 19: 425–42. [Google Scholar]
  79. Sinha Ray, Rupamanjari, and Sandeep Goel. 2022. Impact of ESG score on financial performance of Indian firms: Static and dynamic panel regression analyses. Applied Economics 55: 1742–55. [Google Scholar] [CrossRef]
  80. Sohrabi, Catrin, Zaid Alsafi, Niamh O’neill, Mehdi Khan, Ahmed Kerwan, Ahmed Al-Jabir, Christos Iosifidis, and Riaz Agha. 2020. World Health Organization declares global emergency: A review of the 2019 novel coronavirus (COVID-19). International Journal of Surgery (London, England) 76: 71–76. [Google Scholar] [CrossRef] [PubMed]
  81. Spence, Michael. 1973. Job Market Signaling. The Quarterly Journal of Economics 87: 355. [Google Scholar] [CrossRef]
  82. Titman, Sheridan, K. C. John Wei, and Feixue Xie. 2004. Capital investments and stock returns. Journal of Financial and Quantitative Analysis 39: 677–700. [Google Scholar] [CrossRef] [Green Version]
  83. Tripathi, Prasoon Mani, Varun Chotia, Umesh Solanki, Rahul Meena, and Vinay Khandelwal. 2022. Economic Value Added Research: Mapping Thematic Structure and Research Trends. Risks 11: 9. [Google Scholar] [CrossRef]
  84. UN. 2019. The Decade to Deliver, A Call to Business—CEO Study on Sustainability 2019. UNGC Strategy Accenture 1–43. Available online: https://www.accenture.com/us-en/insights/strategy/ungcceostudy (accessed on 13 January 2023).
  85. Velte, Patrick, and Martin Stawinoga. 2020. Do Chief Sustainability Officers and CSR Committees Influence CSR-Related Outcomes? a Structured Literature Review Based on Empirical-Quantitative Research Findings. Journal of Management Control 31: 333–77. [Google Scholar] [CrossRef]
  86. Venkataraman, Senthai, and Robert Williams. 2020. ESG risks material in 33% of Moody’s 2019 private-sector issuer rating actions. Moody’s. Available online: https://www.moodys.com/research/Moodys-ESG-risks-material-in-33-of-Moodys-2019-private–PBC_1218114 (accessed on 29 December 2022).
  87. Verrecchia, Robert E. 1983. Discretionary disclosure. Journal of Accounting and Economics 5: 179–94. [Google Scholar] [CrossRef]
  88. Walkshäusl, Christian. 2018. Dissecting the performance of socially responsible firms. The Journal of Investing 27: 29–40. [Google Scholar] [CrossRef]
  89. Zhang, Dongyang. 2022. Are firms motivated to greenwash by financial constraints? Evidence from global firms’ data. Journal of International Financial Management & Accounting 33: 459–79. [Google Scholar]
Figure 1. Evolution of ESG Reporting in India. Source: PWC (2021, p. 5).
Risks 11 00112 g001
Figure 2. Portfolio Sorting on Size, Value, and ESG Disclosure. Source: Authors.
Risks 11 00112 g002
Table 1. Summary statistics for monthly returns on portfolios sorted on Size, Value, and ESG Disclosure (2 + 3 + 3).
SmallBigHighMediumLowTransparentNeutralOpaque
N9696969696969696
Mean0.02240.02170.01690.02270.02640.01900.02250.0244
Median0.02300.02550.01210.02230.02850.01570.02280.0260
IQR0.06510.05800.08940.05870.06360.05590.06530.0690
SD0.06560.06270.07940.06100.05700.05790.06480.0720
Skewness−0.9500−0.7890−0.3412−1.1653−1.0336−0.8550−0.9586−0.6186
Kurtosis7.55597.32545.93478.43336.96568.11077.19886.8468
Range0.48040.44980.54720.45280.38790.44130.45530.5305
Table 2. (a) Summary Statistics for monthly returns on portfolios sorted on interactions of Size and Value factor (2 × 3). (b) Summary Statistics for monthly returns on portfolios sorted on interactions of Size and ESG Disclosure factor (2 × 3). (c) Summary Statistics for monthly returns on portfolios sorted on interactions of Value and ESG Disclosure factor (3 × 3).
SHSMSLBHBMBL
N969696969696
Mean0.01690.02310.02670.01690.02240.0261
Median0.01780.02810.02740.00830.02690.0261
IQR0.08530.06450.06810.10150.06080.0643
SD0.07640.06190.06150.08480.06160.0547
Skewness−0.5140−1.0087−0.8570−0.1146−1.1511−1.1321
Kurtosis6.00488.27406.23775.69788.20157.2742
Range0.51770.48210.41140.58430.43550.3679
STSNSOBTBNBO
N969696969696
Mean0.01860.02160.02470.01970.02330.0233
Median0.01360.01940.02810.02050.02800.0293
IQR0.07030.07130.06850.06110.06360.0739
SD0.06090.06940.06570.06410.05880.0763
Skewness−0.6512−0.7057−0.9924−0.5404−0.8759−0.9608
Kurtosis6.66666.95157.19167.55886.26137.5707
Range0.44560.50280.46180.48010.40050.5550
HTHNHOMTMNMOLTLNLO
N969696969696969696
Mean0.01550.01650.01880.01930.02380.02470.02420.02590.0290
Median0.00770.01510.01700.01960.02760.03270.02790.03120.0292
IQR0.08800.08400.09490.06250.06690.06180.05800.06560.0673
SD0.08320.07630.08530.05660.06370.06770.05460.05850.0637
Skewness−0.2016−0.2463−0.4863−0.9477−0.8680−1.3140−0.1825−1.0620−0.8211
Kurtosis5.79135.34885.83698.75676.89198.57196.33436.98476.8040
Range0.56690.52900.59280.44700.45710.49150.41790.39570.4673
Table 3. Summary Statistics for monthly returns on portfolios sorted on interactions of Size, Value, and ESG Disclosure factor (2 × 3 × 3).
SHTSHNSHOSMTSMNSMOSLTSLNSLO
N969696969696969696
Mean0.01730.01810.01740.01980.02310.02630.02200.02410.0317
Median0.01310.01900.01540.01950.02980.03230.02190.02140.0325
IQR0.08050.09060.08920.06600.08060.06630.05960.06720.0809
SD0.07880.08330.08100.05910.06910.06750.05580.06660.0706
Skewness−0.6833−0.3027−0.5714−0.5073−0.8250−1.1287−0.7624−0.8533−0.5323
Kurtosis7.03155.30506.53886.78657.33758.14625.32226.45165.1084
Range0.56480.57310.60200.45820.52980.49520.34330.43400.4550
BHTBHNBHOBMTBMNBMOBLTBLNBLO
N969696969696969696
Mean0.01360.01410.02080.01880.02460.02380.02570.02720.0246
Median−0.00050.01820.02320.02200.02500.02590.02690.03040.0243
IQR0.09290.07670.10390.06110.06730.07190.05860.06730.0650
SD0.09360.07090.09790.05780.06110.07090.05810.05590.0626
Skewness0.22950.1599−0.1117−1.1899−0.6256−1.21260.3972−1.0558−0.7718
Kurtosis4.93895.33805.05649.99095.76467.69827.13846.39097.6136
Range0.63750.51240.69680.45220.41160.50060.46260.37580.4875
Table 4. Summary Statistics for Market Premium (ERM), Size Premium (SMB), Value Premium (HML), and ESG Disclosure Premium (TMO).
ERMSMBHMLTMO
N96969696
Mean0.0066970.000735−0.00898−0.00456
Median0.009550.00215−0.0133−0.0032
IQR0.05120.015550.05610.03775
SD0.0520950.0118340.0394910.024605
Skewness−1.61129−0.573330.243417−0.13131
Kurtosis11.222063.473092.7407612.45218
Range0.41330.06720.19940.1117
Table 5. Pair-wise correlation matrix of Market Premium (ERM), Size Premium (SMB), Value Premium (HML), and ESG Disclosure Premium (TMO).
ERMSMBHMLTMO
ERM1−0.1744−0.1452−0.1256
SMB−0.17441−0.06140.0646
HML−0.1452−0.06141−0.1582
TMO−0.12560.0646−0.15821
Table 6. Regression results on portfolios single sorted on Size, Value, and ESG Disclosure.
PortfolioERMSMBHMLTMODummy_CovInterceptAdj. R-Squared
Small0.0311.673 ***0.924 ***−0.739 ***0.029 ***0.020 ***0.496
(0.32)(4.02)(7.39)(−3.71)(2.37)(3.48)
Big0.0330.939 **0.878 ***−0.647 ***0.033 ***0.019 ***0.449
(0.34)(2.26)(7.03)(−3.25)(2.69)(3.3)
High0.0291.216 ***1.462 ***−0.677 ***0.031 **0.019 ***0.642
(0.29)(2.87)(11.48)(−3.33)(2.54)(3.31)
Medium0.0411.466 ***0.787 ***−0.683 ***0.028 **0.019 ***0.434
(0.42)(3.57)(6.39)(−3.48)(2.33)(3.47)
Low0.0241.191 ***0.465 ***−0.725 ***0.034 ***0.019 ***0.298
(0.24)(2.79)(3.63)(−3.55)(2.72)(3.27)
Transparent0.0461.402 ***0.773 ***−0.2900.028 **0.017 ***0.366
(0.47)(3.4)(6.25)(−1.47)(2.31)(3.09)
Neutral0.0191.382 ***0.866 ***−0.823 ***0.030 **0.019 ***0.476
(0.2)(3.3)(6.88)(−4.1)(2.47)(3.31)
Opaque0.0371.108 **1.080 ***−0.923 ***0.034 ***0.021 ***0.544
(0.36)(2.55)(8.28)(−4.44)(2.71)(3.64)
Note: ** denotes significance at 95% confidence interval. *** denotes significance at 99% confidence interval.
Table 7. Regression results on portfolios double sorted on Size, Value, and ESG Disclosure.
PortfolioERMSMBHMLTMODummy_CovInterceptAdj. R-Squared
SH0.041.618 ***1.357 ***−0.769 ***0.026 **0.018 ***0.64
−0.41−3.95−11.03(−3.92)−2.2−3.31
SM0.0231.720 ***0.782 ***−0.620 ***0.022 *0.021 ***0.409
−0.23−4.04−6.12(−3.04)−1.79−3.65
SL0.0281.527 ***0.587 ***−0.752 ***0.039 ***0.019 ***0.358
−0.27−3.47−4.44(−3.56)−3.02−3.15
BH0.0160.7091.596 ***−0.561 **0.038 **0.020 ***0.638
−0.15−1.56−11.66(−2.57)−2.85−3.2
BM0.0571.220 ***0.791 ***−0.745 ***0.033 **0.018 ***0.447
−0.59−2.98−6.44(−3.8)−2.79−3.18
BL0.0210.902 **0.360 ***−0.702 ***0.030 **0.019 ***0.23
−0.2−2.11−2.8(−3.42)−2.37−3.26
ST0.0071.693 ***0.860 ***−0.2020.028 **0.018 ***0.407
−0.07−4.04−6.84(−1.01)−2.32−3.17
SN0.0181.622 ***1.028 ***−0.716 ***0.026 **0.020 ***0.496
−0.17−3.69−7.79(−3.4)−2.03−3.45
SO0.0621.599 ***0.851 ***−1.048 ***0.030 **0.019 ***0.542
−0.66−4.02−7.13(−5.51)−2.61−3.6
BT0.0560.777 *1.017 ***−0.1120.037 ***0.019 ***0.436
−0.55−1.81−7.87(−0.55)−2.92−3.33
BN0.0311.186 ***0.673 ***−0.767 ***0.027 **0.019 ***0.392
−0.32−2.89−5.47(−3.91)−2.27−3.4
BO0.0120.924 **0.999 ***−1.254 ***0.038 ***0.017 ***0.534
−0.11−1.99−7.15(−5.63)−2.82−2.76
HT0.0791.088 **1.588 ***−0.0620.039 ***0.020 ***0.591
−0.7−2.29−11.12(−0.27)−2.79−3.06
HN0.0281.252 ***1.388 ***−0.733 ***0.023 *0.019 ***0.638
−0.28−3.05−11.27(−3.73)−1.93−3.5
HO−0.0181.291 ***1.426 ***−1.215 ***0.034 **0.018 ***0.66
(−0.17)−2.91−10.7(−5.71)−2.62−2.97
MT0.0221.476 ***0.724 ***−0.1570.028 **0.018 ***0.334
−0.23−3.58−5.85(−0.8)−2.29−3.2
MN0.0331.562 ***0.812 ***−0.754 ***0.025 **0.021 ***0.433
−0.32−3.65−6.32(−3.68)−2.02−3.59
MO0.0691.327 ***0.814 ***−1.113 ***0.032 **0.019 ***0.497
−0.68−3.09−6.33(−5.42)−2.54−3.2
LT−0.0020.762 *0.475 ***−0.260.035 ***0.019 ***0.185
(−0.02)−1.73−3.59(−1.23)−2.71−3.21
LN0.011.359 ***0.439 ***−0.730 ***0.032 **0.018 ***0.273
−0.1−3.05−3.28(−3.42)−2.43−3.07
LO0.0651.295 ***0.496 ***−1.087 ***0.036 ***0.019 ***0.38
−0.62−2.89−3.68(−5.06)−2.77−3.16
Note: * denotes significance at 90% confidence interval. ** denotes significance at 95% confidence interval. *** denotes significance at 99% confidence interval.
Table 8. Regression results on portfolios triple sorted on Size, Value, and ESG Disclosure.
PortfolioERMSMBHMLTMODummy_CovInterceptAdj. R-Squared
SHT0.0832.117 ***1.319 ***−0.3560.031 **0.019 ***0.53
−0.73−4.39−9.1(−1.54)−2.22−2.85
SHN0.0451.491 ***1.542 ***−0.772 ***0.030 **0.021 ***0.661
−0.43−3.44−11.84(−3.71)−2.34−3.5
SHO−0.0031.978 ***1.307 ***−1.088 ***0.023 *0.018 ***0.624
(−0.02)−4.46−9.8(−5.11)−1.74−2.97
SMT−0.0251.727 ***0.674 ***−0.1270.027 **0.018 ***0.297
(−0.24)−3.9−5.07(−0.6)−2.09−3.05
SMN0.0241.940 ***0.832 ***−0.792 ***0.0220.020 ***0.407
−0.22−4.08−5.83(−3.48)−1.6−3.19
SMO0.0681.586 ***0.847 ***−1.085 ***0.022 *0.022 ***0.503
−0.68−3.73−6.63(−5.33)−1.8−3.91
SLT0.021.725 ***0.359 **−0.0910.030 **0.017 ***0.171
−0.18−3.8−2.63(−0.42)−2.29−2.74
SLN0.0061.516 ***0.635 ***−0.694 ***0.037 **0.018 **0.298
−0.05−3.04−4.24(−2.91)−2.51−2.6
SLO0.0591.789 ***0.564 ***−1.109 ***0.055 ***0.018 **0.425
−0.52−3.74−3.93(−4.84)−3.94−2.77
BHT0.0780.1721.828 ***0.2050.045 ***0.020 ***0.606
−0.63−0.33−11.6−0.81−2.97−2.86
BHN−0.0050.8991.129 ***−0.687 ***0.0130.018 ***0.487
(−0.05)−1.98−8.28(−3.16)−0.97−2.88
BHO−0.0440.3421.606 ***−1.396 ***0.051 ***0.018 **0.661
(−0.36)−0.67−10.5(−5.72)−3.43−2.58
BMT0.0711.245 ***0.767 ***−0.1840.028 ***0.017 ***0.333
−0.71−2.95−6.06(−0.91)−2.28−3.05
BMN0.0421.129 ***0.792 ***−0.713 ***0.029 **0.021 ***0.426
−0.43−2.73−6.37(−3.59)−2.39−3.76
BMO0.0651.110 **0.784 ***−1.140 ***0.040 ***0.016 **0.456
−0.59−2.38−5.59(−5.1)−2.94−2.47
BLT−0.0130.2990.520 ***−0.3490.036 ***0.021 ***0.194
(−0.11)−0.64−3.72(−1.56)−2.65−3.29
BLN0.0131.195 ***0.291 **−0.768 ***0.0280.019 ***0.224
−0.12−2.71−2.2(−3.64)−2.15−3.24
BLO0.0690.4760.361 **−1.083 ***0.0070.020 ***0.234
−0.6−0.97−2.45(−4.62)−0.5−3.09
Note: * denotes significance at 90% confidence interval. ** denotes significance at 95% confidence interval. *** denotes significance at 99% confidence interval.
Table 9. Regression results on portfolios triple-sorted on interactions between Size, Value, and ESG Scores for 2017–2021.
PortfolioERMSMBHMLGMBDummy_CovInterceptAdj. R-Squared
SHG0.9858 ***0.25260.00450.4706 ***0.0053−0.00840.6987
(8.369)(1.619)(0.032)(3.815)(0.476)(−1.269)
SHN1.2547 ***1.9169 ***0.8851 ***1.2044 ***−0.00050.0190.8196
(4.804)(5.54)(2.823)(4.403)(−0.019)(1.29)
SHB0.5486 ***0.7910 ***0.268−2.1017 ***0.00430.00080.874
(3.008)(3.275)(1.225)(−11.007)(0.252)(0.078)
SMG0.7787 ***0.7736 ***−0.4112 ***0.6968 ***0.0213−0.00640.5342
(5.598)(4.198)(−2.462)(4.783)(1.62)(−0.817)
BHG0.7790 ***−0.4234 ***0.9842 ***0.3893 ***0.00550.00250.8349
(7.007)(−2.875)(7.375)(3.344)(0.526)(0.405)
BHN0.6935 ***−0.3817 ***0.8092 ***0.14550.0131 *0.00320.8803
(8.697)(−3.614)(8.453)(1.742)(1.743)(0.715)
BHB1.1505 ***−0.3440 ***0.6433 ***−0.07380.0063−0.00280.8916
(12.399)(−2.799)(5.776)(−0.76)(0.719)(−0.541)
BMG0.9137 ***−0.20140.2999 ***0.1708 *0.00730.00260.7913
(9.831)(−1.636)(2.688)(1.755)(0.825)(0.498)
BMN0.8869 ***−0.06060.1679 **0.07390.00260.00220.882
(14.52)(−0.749)(2.289)(1.155)(0.453)(0.633)
BMB0.8979 ***−0.0916−0.0231−0.1145 **0.0168 ***−0.00380.8827
(15.624)(−1.204)(−0.335)(−1.902)(3.096)(−1.168)
BLG0.8678 ***0.4425 ***−0.4327 ***0.17940.00620.00010.5637
(7.793)(2.999)(−3.236)(1.539)(0.589)(0.023)
BLN0.9762 ***0.1437−0.2375 ***0.02310.00180.0088 ***0.8167
(13.932)(1.548)(−2.823)(0.315)(0.273)(2.241)
BLB0.8619 ***0.3191 ***−0.5320 ***−0.1849 ***0.009−0.00180.6989
(10.066)(2.813)(−5.176)(−2.063)(1.117)(−0.38)
Note: * denotes significance at 90% confidence interval. ** denotes significance at 95% confidence interval. *** denotes significance at 99% confidence interval.
Table 10. Regression results on portfolios triple-sorted on interactions between Size, Value, and ESG Disclosure for 2017–2021.
PortfolioERMSMBHMLTMODummy_CovInterceptAdj. R-Squared
SHT1.137 ***1.032 ***0.463 ***1.075 ***−0.0050.0130.863
(7.843)(6.07)(2.54)(8.543)(−0.393)(1.615)
SHN0.877 ***0.031−0.0040.074−0.006−0.0090.414
(5.407)(0.161)(−0.022)(0.526)(−0.392)(−1.025)
SHO0.753 ***0.787 ***0.291 **−0.931 ***0.017−0.0070.896
(6.012)(5.352)(1.845)(−8.544)(1.457)(−1.038)
SMN0.676 ***0.368 **−0.295−0.1320.020−0.0100.347
(4.095)(1.9)(−1.423)(−0.918)(1.242)(−1.016)
BHT0.935 ***−0.488 ***0.834 ***0.121 ***0.011 *0.0010.925
(13.481)(−5.997)(9.571)(2.009)(1.72)(0.344)
BHN0.642 ***−0.447 ***0.740 ***−0.195 ***0.0050.0000.781
(5.824)(−3.459)(5.347)(−2.043)(0.483)(−0.04)
BHO0.575 ***−0.615 ***1.211 ***−0.600 ***0.008−0.0030.801
(3.284)(−2.995)(5.508)(−3.952)(0.485)(−0.275)
BMT0.934 ***−0.149 ***0.116 **0.135 ***0.008 **−0.0010.921
(19.809)(−2.691)(1.961)(3.303)(1.869)(−0.295)
BMN0.822 ***−0.0920.254 ***0.0540.011 *0.0010.869
(12.474)(−1.188)(3.076)(0.949)(1.752)(0.278)
BMO0.952 ***−0.0260.103−0.0640.0000.0070.794
(10.584)(−0.247)(0.914)(−0.818)(0.051)(1.363)
BLT0.842 ***0.164 ***−0.264 ***0.102 ***0.0060.0050.825
(14.725)(2.451)(−3.677)(2.058)(1.045)(1.456)
BLN0.878 ***0.340 ***−0.456 ***−0.0050.006−0.0010.649
(9.399)(3.103)(−3.884)(−0.063)(0.654)(−0.134)
BLO1.569 ***0.413−0.456−0.971 ***−0.0060.0220.694
(7.206)(1.617)(−1.669)(−5.138)(−0.285)(1.76)
Note: * denotes significance at 90% confidence interval. ** denotes significance at 95% confidence interval. *** denotes significance at 99% confidence interval.
Table 11. GRS F-test results for joint significance of regression intercept.
Models2014–20212017–2021
(a) FFTF Model
GRS F-test Statistic4.46331.2877
GRS p-value0.0006 ***0.2837
(b) FFTF + GMB Model
GRS F-test Statistic-1.4429
GRS p-value-0.1807
(c) FFTF + TMO Model
GRS F-test Statistic1.34230.8037
GRS p-value0.18790.6447
Note: *** denotes significance at 99% confidence interval.
Disclaimer/Publisher’s Note: The statements, opinions and data contained in all publications are solely those of the individual author(s) and contributor(s) and not of MDPI and/or the editor(s). MDPI and/or the editor(s) disclaim responsibility for any injury to people or property resulting from any ideas, methods, instructions or products referred to in the content.

