1. Introduction
Contrary to popular belief, ethanol is the most commonly abused drug [
1]. Despite the significant decrease in fatality rates over the past several decades due to constant focus by the NTSB (National Transportation Safety Board), ethanol still prevails in the number of fatalities and injuries each year [
2]. Numerous injuries and fatalities are investigated each year resulting from excessive blood alcohol concentration (BAC) due to consumption of a variety of beverages [
3]. This calls for an extremely reliable and robust analytical method capable of high throughput that can be replicated with precision at many forensic and toxicological laboratories [
4,
5]. Strict quality control and assurance are necessary for this high-volume analysis to achieve an appropriate conviction through the legal system. The common threshold value that is specified, 0.08 g/dL, has become a specification limit, specifically within the United States of America [
6]. In many cases, the analytical method must determine if the BAC lies below, at, or above this legal specification limit. Depending on the circumstances, the legal limit may be specified at 0.02 g/dL for underage drivers or commercial vehicle operators. Additionally, some situations (military,
etc.) may employ a “zero-tolerance” criterion, so true detection limits should be known so that analytical reports contain “less-than” values, rather than reporting a “0”, a practice used in some laboratories. At such a low limit, such as 0.02 g/dL, when compared to the common threshold value of 0.08 g/dL, the analytical method must be sensitive to accurately quantify the BAC.
Headspace gas chromatography (HS-GC) coupled with flame ionization detection (FID) has been the prevailing technique for BAC due to its simplicity in automation, overall sensitivity, selectivity and accuracy [
5,
7]. Dynamic and static headspace are the most common direct gas headspace sampling methods [
8]. Despite dynamic methods being more sensitive than the static methods, it is instrumentally more complex, and the sensitivity enhancement may not be necessary. Direct injection is another option for sample introduction into the instrumentation. This method saves money since there is no need for an expensive sampling instrument. However, continual direct injection, even of dilute blood samples, will lead to contamination issues within the injector and column and use of more materials such as inlet liners [
5]. There is also the consideration of analyte loss with this method [
9] and instrument maintenance [
4]. These complications will result in a loss of precision and accuracy, and therefore direct injection would not be ideal, largely based upon the nature of the sample matrix. Another major consideration is the impractical nature of this method for many laboratories that perform this routine analysis due to the need to analyze a substantial number of samples daily. Static headspace sampling allows for thermostatic partitioning of the volatile compounds to occur within a sealed, gas-tight vial [
10]. Partitioning occurs between the sample diluent and the gas phase. The sample is heated and pressurized to allow for inert gas-sampling from the headspace, which is then transferred via a heated transfer line to create a seamless interface with the GC [
11]. Many features such as robust nature, automation and convenience have resulted in validation of static headspace sampling methods over a wide range of applications [
12]. Static headspace sampling is the ideal method for forensic laboratories preforming BAC analyses when considering the goals of minimal training, cost savings, time savings and longevity of instrumentation and materials. This sampling method also provides the best sensitivity with the lowest operational requirements and is capable of high robustness.
Although the static-HS sampling method and GC-FID analysis are the most utilized techniques for BAC determination, suboptimal instrumental conditions can affect the reported value. Using an internal standard method for quantitative analysis helps compensate for matrix differences [
13]. Other alcohols with similar characteristics to ethanol, such as
n-propanol and
t-butanol, are typically utilized as internal standards. This allows for a “correction” since the internal standard undergoes the same matrix effects as the ethanol within the blood, due to their similar chemical properties [
14]. Calibration using the internal standard method typically results in lower percent error when compared to the external standard method.
Taking into consideration the many factors that go into this rather routine analysis, many forensic laboratories simply follow analytical procedures either provided by the industry or “historical” methods that have been passed down over the years. This lack of optimization of the instrumental parameters can lead to an increase in various errors throughout the entire analysis, resulting in higher variance than may be obtained if all parameters were optimized. Typically, variance is not reported when reporting a BAC value, and this may lead to additional questions if the data is used in a legal case. In a court of law, if the variance was known and reported, it may affect the decision in some cases. With limited money and resources, some laboratories choose to perform this analysis under conditions other than the industry-suggested parameters (ex. simultaneous dual-column analysis, among others) [
15].
The objective of this study was to develop an optimal method that is as robust, accurate and precise as possible using the most commonly used instrumentation to determine BAC. By systematically altering the original equipment manufacturer’s (OEM) instrumental headspace parameters (
Table 1), a comparison can be made to determine the optimal parameters necessary for the most accurate and precise BAC determination. Through the analysis of replicate samples at both 0.08 g/dL and 0.02 g/dL, a degree of uncertainty at the common threshold value and method detection limits resulting from the modified instrumental variables were evaluated.
2. Materials and Methods
2.1. Materials
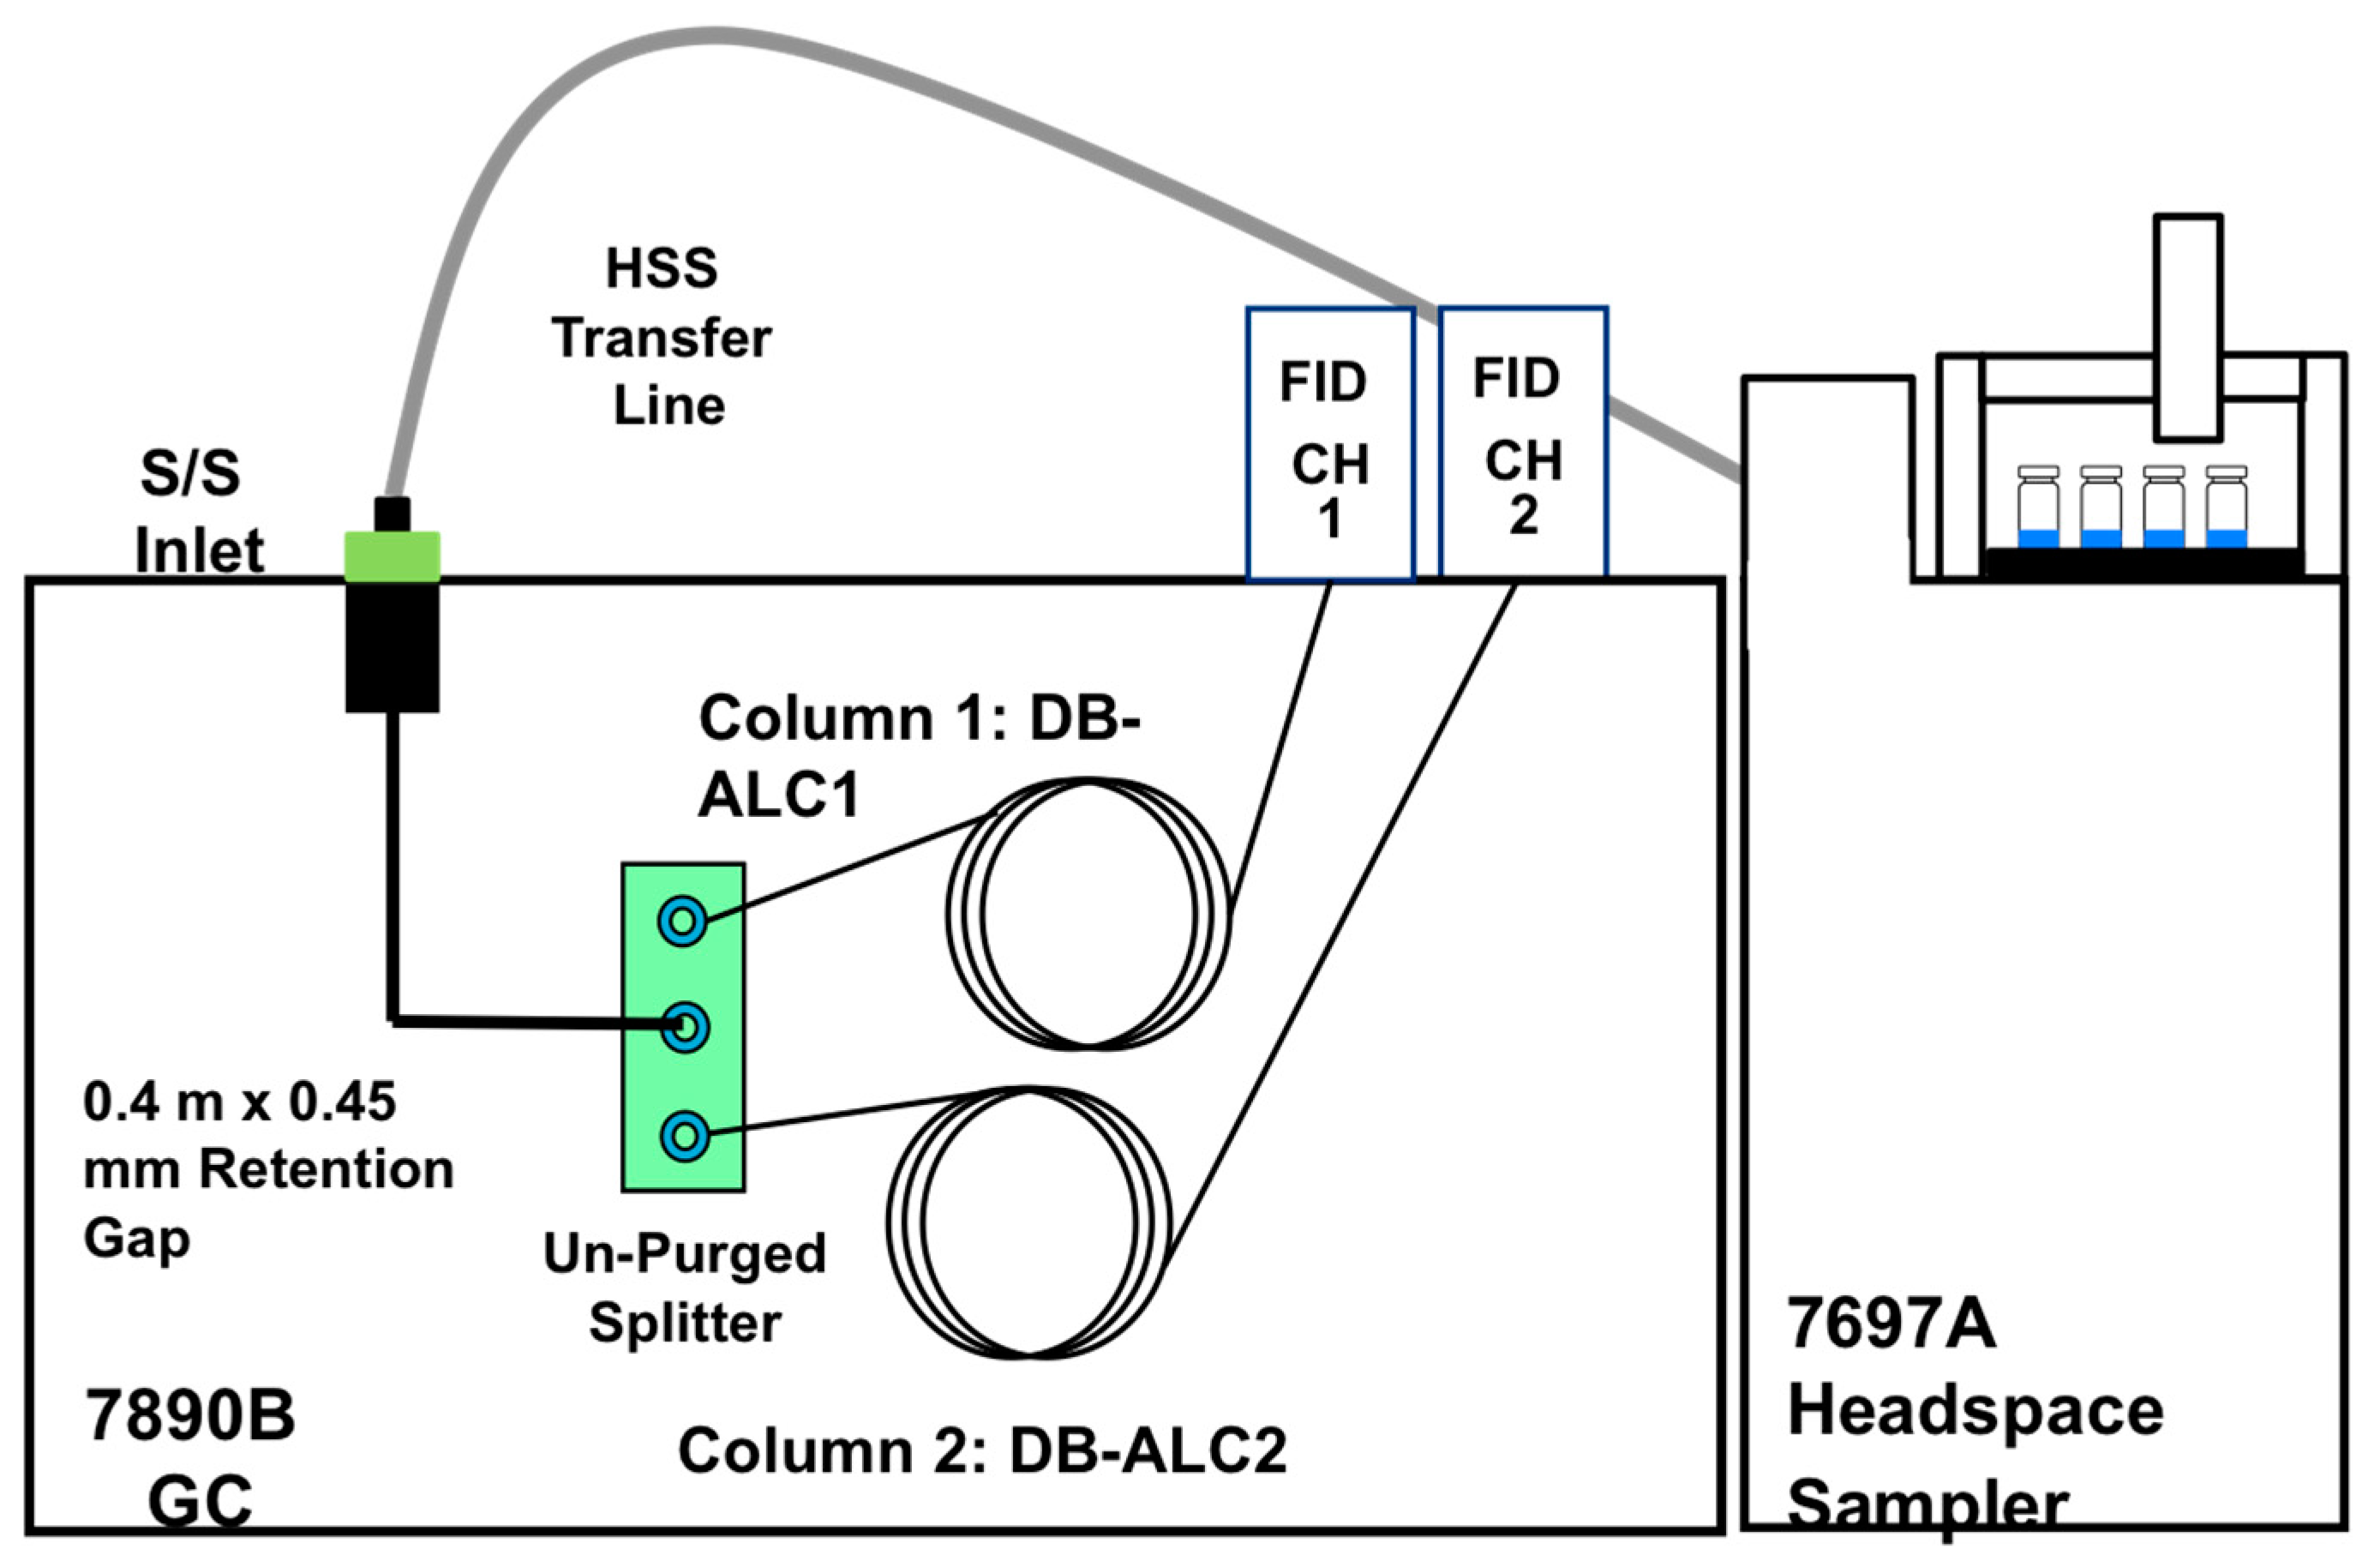
All experiments were conducted using an Agilent Technologies 7890B Series GC equipped with a split/splitless inlet and dual flame ionization detectors. Two columns, DB-ALC1 (30 m × 0.32 mm ID × 1.8 µm) and DB-ALC2 (30m × 0.32mm ID × 1.2 µm) were implemented (Agilent Technologies, Wilmington, DE; cat# 123-9134 and 123-9234, respectively). To employ the advantages of primary and secondary confirmatory analyses [
16,
17], a short section of 0.45 mm deactivated silica tubing was utilized to couple the single injection port to a capillary flow technology, 2-way unpurged splitter (Agilent Technologies, cat# G3181B). The splitter allows for the single injections made through the injection port to travel to the two analytical columns, equally. The GC-FID system was also equipped with an Agilent 7697A Headspace Auto-Sampler. A 0.53 mm ID deactivated silica tubing (Agilent Technologies, cat# 160-2535-5) was utilized within the transfer line in order to connect the automated headspace sampler oven to the GC injection port. A 0.75-mm i.d. Ultra Inert straight liner was utilized within the injection port (Agilent Technologies, cat# 5190-4048). Split injections were employed for all experiments with a split ratio of 20:1.
Figure 1 is the instrumental diagram for the overall experimental setup used.
Table 1.
Original Equipment Manufacturer’s (OEM) Static Headspace and GC analysis parameters.
Table 1.
Original Equipment Manufacturer’s (OEM) Static Headspace and GC analysis parameters.
| Instrumental GC analysis Parameters |
| Inlet | Carrier Gas | Helium |
| Mode | Split |
| Split Ratio | 20:1 |
| Pressure | 19.5 psi |
| Temperature | 250 °C |
| Split Flow | 130.69 mL/min |
| FID Detectors | Temperature | 270 °C |
| H2 Flow | 30 mL/min |
| Airflow | 400 mL/min |
| Makeup Flow | 25 mL/min |
| Oven | Isothermal | 40 °C |
| Run Time | 10.00 min |
| Instrumental Headspace Parameters |
| Static Headspace Auto sampler | Equilibration Time | 7.00 min |
| Injection | 0.50 min |
| Vial Pressurization | 15 psi |
| Oven Temperature | 100 °C |
| Loop Temperature | 110 °C |
| Transfer Line Temperature | 115 °C |
Figure 1.
Experimental setup using Agilent HS-dual column GC-dual FID for the detection of blood alcohol.
Figure 1.
Experimental setup using Agilent HS-dual column GC-dual FID for the detection of blood alcohol.
2.2. Analytical Procedure
The first phase in the procedure was to confirm the separation and elution order of a resolution control standard (Restek, CAT # 36256; Bellefonte, PA, USA) utilizing the original instrumental and headspace parameters provided by Agilent Technologies. Each compound within the resolution mixture was run individually to confirm their retention times on both DB-ALC1 and DB-ALC2. These retention times were then used for comparison against the resolution control standard to ensure there was correct compound identification. Due to the similar chemical nature of the compounds within the resolution mixture, co-elutions may occur. Once the desired separation, baseline resolution and Gaussian peak shape, was confirmed, the principles of quality by design were implemented to determine the robustness of these “ideal” conditions and conclude if minor instrument variations would impact the overall data quality. QBD is a systematic approach that involves identifying sources of variability and controlling manufacturing processes to produce consistent quality over time, and a more thorough discussion of this subject may be found elsewhere [
18].
A combined calibration curve of commercially available and in-house-made standards with ethanol concentrations ranging from 0.02 g/dL to 0.30 g/dL (Restek, CAT# 36249, 36251, 36260, 36263, 36252, 36253, 36254, and 36255; Bellefonte, PA, USA) was used. The commercially available standards were prepared by the addition of 500 μL (Hamilton, CAT# 81217; Reno, NV, USA) of each reference standard ethanol solution to 4.5 mL (VWR CAT# CA89125-306; Bridgeport, NJ, USA) distilled water (diluent) and 5 μL (SGE CAT# 002000; Austin, TX, USA) diluted internal standard, to obtain a nominal final volume of 5 mL. The in-house standards were prepared in a similar manner to the commercially available standards. However, a pre-determined volume of ethanol (200-proof pure ethanol, KOPTEC USP) and distilled water were used to make stock solutions of the necessary ethanol concentration. n-Propanol (J.T. Baker, CAT# 9086-01; Center Valley, PA, USA) and t-butanol (J.T. Baker, CAT# 9056-01; Center Valley, PA, USA) were compared as internal standards for quantification. The internal standard solution was prepared as a 1:10 (vol/vol) dilution of either n-propanol or t-butanol in distilled water, so that the final working concentration was 0.0803 g/dL and 0.07809 g/dL, respectively. Stock solutions of each internal standard were prepared by the addition of 1 mL internal standard and 9 mL of distilled water. All samples were prepared in flat bottom Polytetrafluoroethylene (PTFE)/silicone 18 mm screw cap (Agilent Technologies, p/n 5188-2759; Wilmington, DE, USA) 20 mL headspace vials (Agilent Technologies, p/n 5188-2753; Wilmington, DE, USA). For each new set of headspace parameters, fresh vials were utilized once and then disposed.
The sample matrix is extremely important when considering the intermolecular interactions that occur between the solutes and solvent. Using water, as the sample diluent may seem counterintuitive, however, it has been shown that solubility, or the partition coefficient, in water is decreased, ultimately increasing the headspace sensitivity. Hachenberg and Schmidt showed that in 100% solvent composition of water, the overall headspace sensitivity was the greatest, resulting in the greatest peak area of ethanol,
n-propanol, and
n-butanol [
13]. The solubility of the solutes within a pure water solvent may be considered an issue, but the alcohols used within this analysis are known to be miscible in water.
The second objective was to evaluate the overall precision and accuracy of the instrumental and headspace parameters used within the analysis. Ten replicates containing an ethanol concentration of 0.02 g/dL (Restek, CAT# 36249; Bellefonte, PA, USA) were prepared to determine the impact to method detection limits from the various instrumental parameters. Ten additional replicates containing an ethanol concentration of 0.08 g/dL (Restek, CAT# 36263; Bellefonte, PA, USA) were prepared to determine the degree of uncertainty at this common threshold value. Both sets of replicates were prepared in a similar manner to the calibration curve samples using both n-propanol and t-butanol as internal standards. Continuing calibration verification (CCV) standards at 0.08 g/dL were present at regular intervals within each sequence in order to evaluate the differences between external and internal standard quantification, and ensure instrument control throughout the analytical sequence. Each sequence consisted of a solvent blank (distilled water), eight levels of the calibration curve (0.02 g/dL–0.30 g/dL) with the respective internal standard (n-propanol or t-butanol), an internal standard blank (internal standard in distilled water), ten replicates of 0.02 g/dL with the respective internal standard and ten replicates of 0.08 g/dL with the respective internal standard. A CCV standard of 0.08 g/dL was placed every 10 samples within the sequence. To ensure there was no cross-contamination, each sample was prepared in a fresh vial and no vials were re-used. Overall, the sequence consisted of 33 individual analyses at one set of headspace parameters. Each altered headspace parameter set of oven temperature and vial pressurization was run twice, one for n-propanol and the other for t-butanol.
2.3. GC Parameters of Instrumentation
Table 1 summarizes the original instrumental parameters for the GC and Headspace Auto-Sampler provided by Agilent Technologies (original equipment manufacturer, or OEM).
Table 2 depicts the design of experiments (DOE), which includes the several combinations of headspace oven temperature and headspace vial pressurization that were investigated to determine the robust nature of the original provided headspace parameters. The oven temperature and vial pressurization within the headspace auto-sampler were chosen due to their direct effect on the sample. These parameters were of highest interest, as they would likely have the greatest impact on the resulting data. The overall chromatographic performance (baseline resolution, Gaussian peak shape, co-elutions and overall baseline) dictated the varying vial pressurizations that were evaluated at each headspace oven temperature.
Table 2.
Headspace parameters evaluated in this study for robustness evaluation.
Table 2.
Headspace parameters evaluated in this study for robustness evaluation.
| Headspace Oven Temperature | Headspace Vial Pressurization |
|---|
| 65 °C | 15 psi |
| 30 psi |
| 85 °C | 15 psi |
| 30 psi |
| 100 °C | 0 psi |
| 10 psi |
| 15 psi |
| 30 psi |
| 125 °C | 15 psi |
| 30 psi |
| 135 °C | 15 psi |
| 140 °C | 15 psi |
The original combination of 100 °C headspace oven temperature and 15-psi headspace vial pressurization has consistently shown acceptable accuracy and precision when applied to sterilized sheep’s blood containing various ethanol concentrations [
19]. However, few studies have evaluated modification of these two specific parameters due to the theory that the headspace temperature must be lower than that of the sample diluent in order to ensure that little to no sample diluent is vaporized [
10]. When comparing the boiling point of water (100 °C) to that of other possible organic solvents such as Dimethylsulfoxide (DMSO) (189 °C), it is apparent that water requires a lower HS-oven temperature for a successful analysis. Despite the higher boiling point, these organic solvents can degrade at higher temperatures. Water was chosen as the diluent for this analysis due to its stable and clean nature [
10]. This preparatory method is also consistent with laboratory practices for calibration and calibration verification. Evaluation of a blood matrix was not performed since the goal was to determine method performance, not a validation of an actual standard operating procedure (SOP) for a particular laboratory. Overall, acceptable data in regards to method performance was obtained without the use of blood in comparison to previous experiments [
19], which will be subsequently discussed (
Section 3).
2.4. Data Processing and Equations
Agilent OpenLab CDS ChemStation Edition for GC Systems C.01.05 software was used for instrument control and data processing. Headspace Control software ChemStation Edition B.01.04 was utilized to control the different variables of the Headspace Auto-sampler.
Both external and internal quantification methods were evaluated. Equation 1 is the general equation used to perform external standard quantification. The concentration values of the calibration curve were plotted along the x-axis, while the corresponding ethanol peak areas were plotted along the y-axis [
20]. A line of best fit was determined from the scatter points in order to determine the unknown ethanol concentration (x) of the continuing calibration verification samples. The calculated ethanol concentration was then compared to the known concentration (0.08 g/dL) and a percent error (Equation 2) was determined. Internal standard quantification was used for calculating the unknown concentration of the continuing calibration verification samples. Equation 3 was first used in order to find the Response Factor, RF, for each concentration of the calibration curve. An average of the response factors (Equation 4) was taken to give an average relative response factor, RRF, which represents the entire calibration curve. The RRF value was then utilized in Equation 5 in order to calculate the unknown concentration of the ethanol within the continuing calibration verification samples. Equation 2 was employed once again in order to compare the calculated concentration to the actual concentration (0.08 g/dL) with a percent error. The external and internal quantification methods were calculated for each set of altered headspace parameters and for each internal standard,
n-propanol and
t-butanol. The external and internal standard quantification percent errors demonstrate the overall accuracy of the analysis to determine the ethanol concentration within a sample.
To evaluate the precision of the analysis, specific calculations were performed using the data collected from the ten replicate samples at both 0.02 g/dL and 0.08 g/dL. The calculated concentration of each replicate sample was calculated by using the internal standard quantification method described above. The same RRF values were used for both 0.02g/dL and 0.08 g/dL since the value represents the entire calibration curve as a whole. Equation 6 was used to calculate the percent relative standard deviation that was used in order to determine the precision and repeatability of the blood alcohol concentration analysis at the common threshold value, 0.08 g/dL, and 0.02 g/dL [
20]. The standard deviation and mean were calculated using the function tool within the Excel (Microsoft Corp). Method detection limits (MDL’s) are essential when determining blood alcohol concentration. This specific measurement determines the minimum concentration that the analytical method can detect and report with a 99% confidence. Not only is this measurement qualitatively important, it describes how well the analysis can be repeated with identical low concentration replicate samples [
21]. Equation 7 allows for a MDL calculation with no limits on the number of replicates. All ten replicates were used within this calculation that was provided by the EPA [
21] at a 99% confidence interval.
3. Results and Discussion
In order to ensure the HS-GC-FID was performing as expected, a resolution mixture was analyzed on both the DB-ALC-1 and DB-ALC-2 columns. The resolution mixture was run at the suggested instrumental and headspace parameters provided by Agilent Technologies (
Table 1). Each component within the resolution mixture was also run individually to ensure correct identification.
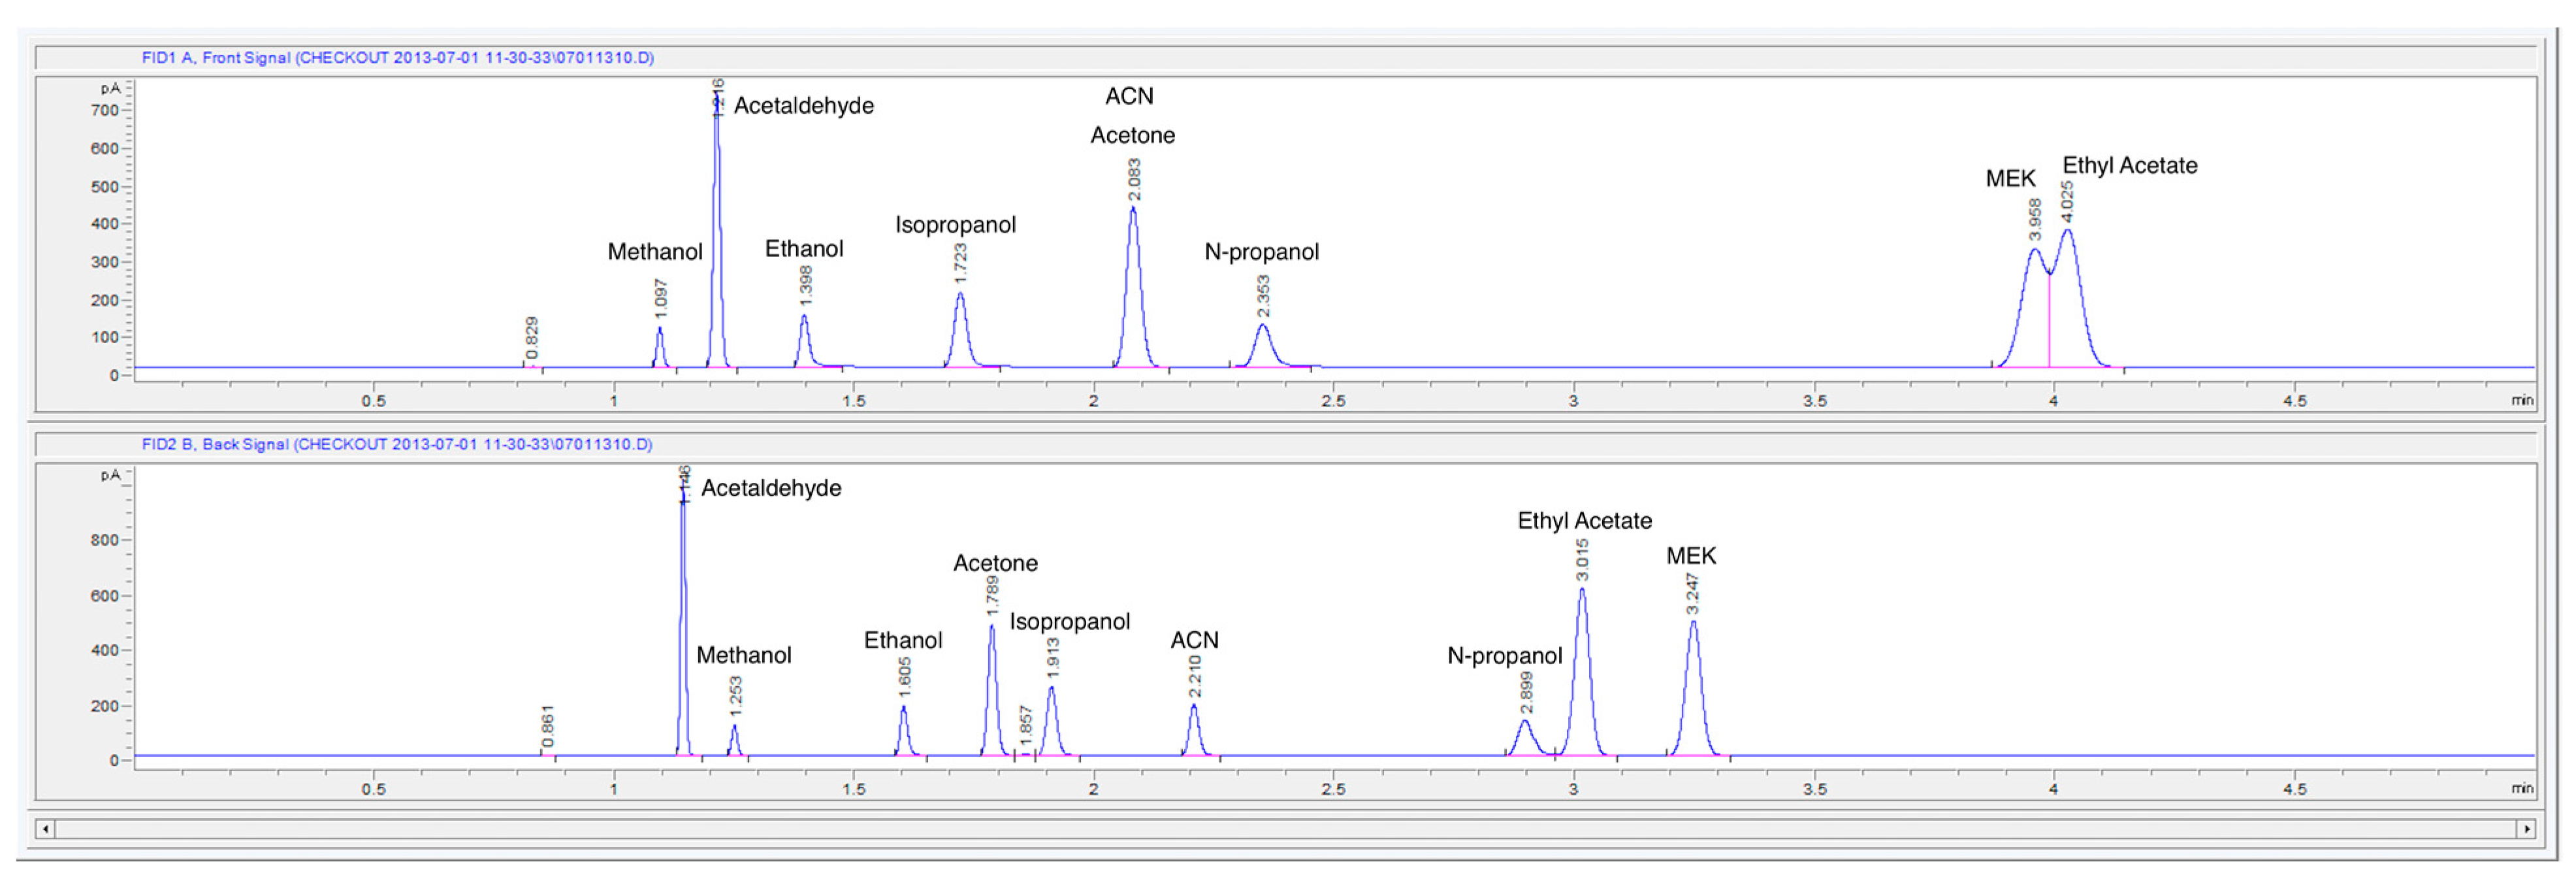
Figure 2 depicts the optimized chromatogram of the resolution mixture on both DB-ALC1 (FID1) and DB-ALC2 (FID2). It should be noted that the original instrumental temperature program provided by Agilent Technologies suggested a 10-min run time. In further evaluation of the headspace parameters, the total run time was changed to 4 min due to ethanol and both internal standards (
n-propanol and
t-butanol) eluting before 4 min. By shortening the run time for each analysis both time and money are conserved due to less use of consumables and more runs completing in a typical workday.
Figure 2.
Gas headspace chromatograms of a resolution mixture on DB-ALC1 (top) and DB-ALC2 (bottom). The mixture was run under the OEM (Agilent Technologies) instrumental and headspace parameters (
Table 1). All nine components eluted before 4.5 min and 3.5 min, respectively. MEK represents methyl ethyl ketone and ACN represents acetonitrile. The co-elution within DB-ALC1 (top) was resolved by analyzing individual compounds. Retention times for the internal standard
t-butanol (not shown) are 2.07 min (DB-ALC1) and 2.18 min (DB-ALC2).
Both internal standards,
n-propanol and
t-butanol, were also run under the initial OEM instrumental and headspace parameters on both DB-ALC1 and DB-ALC2 columns.
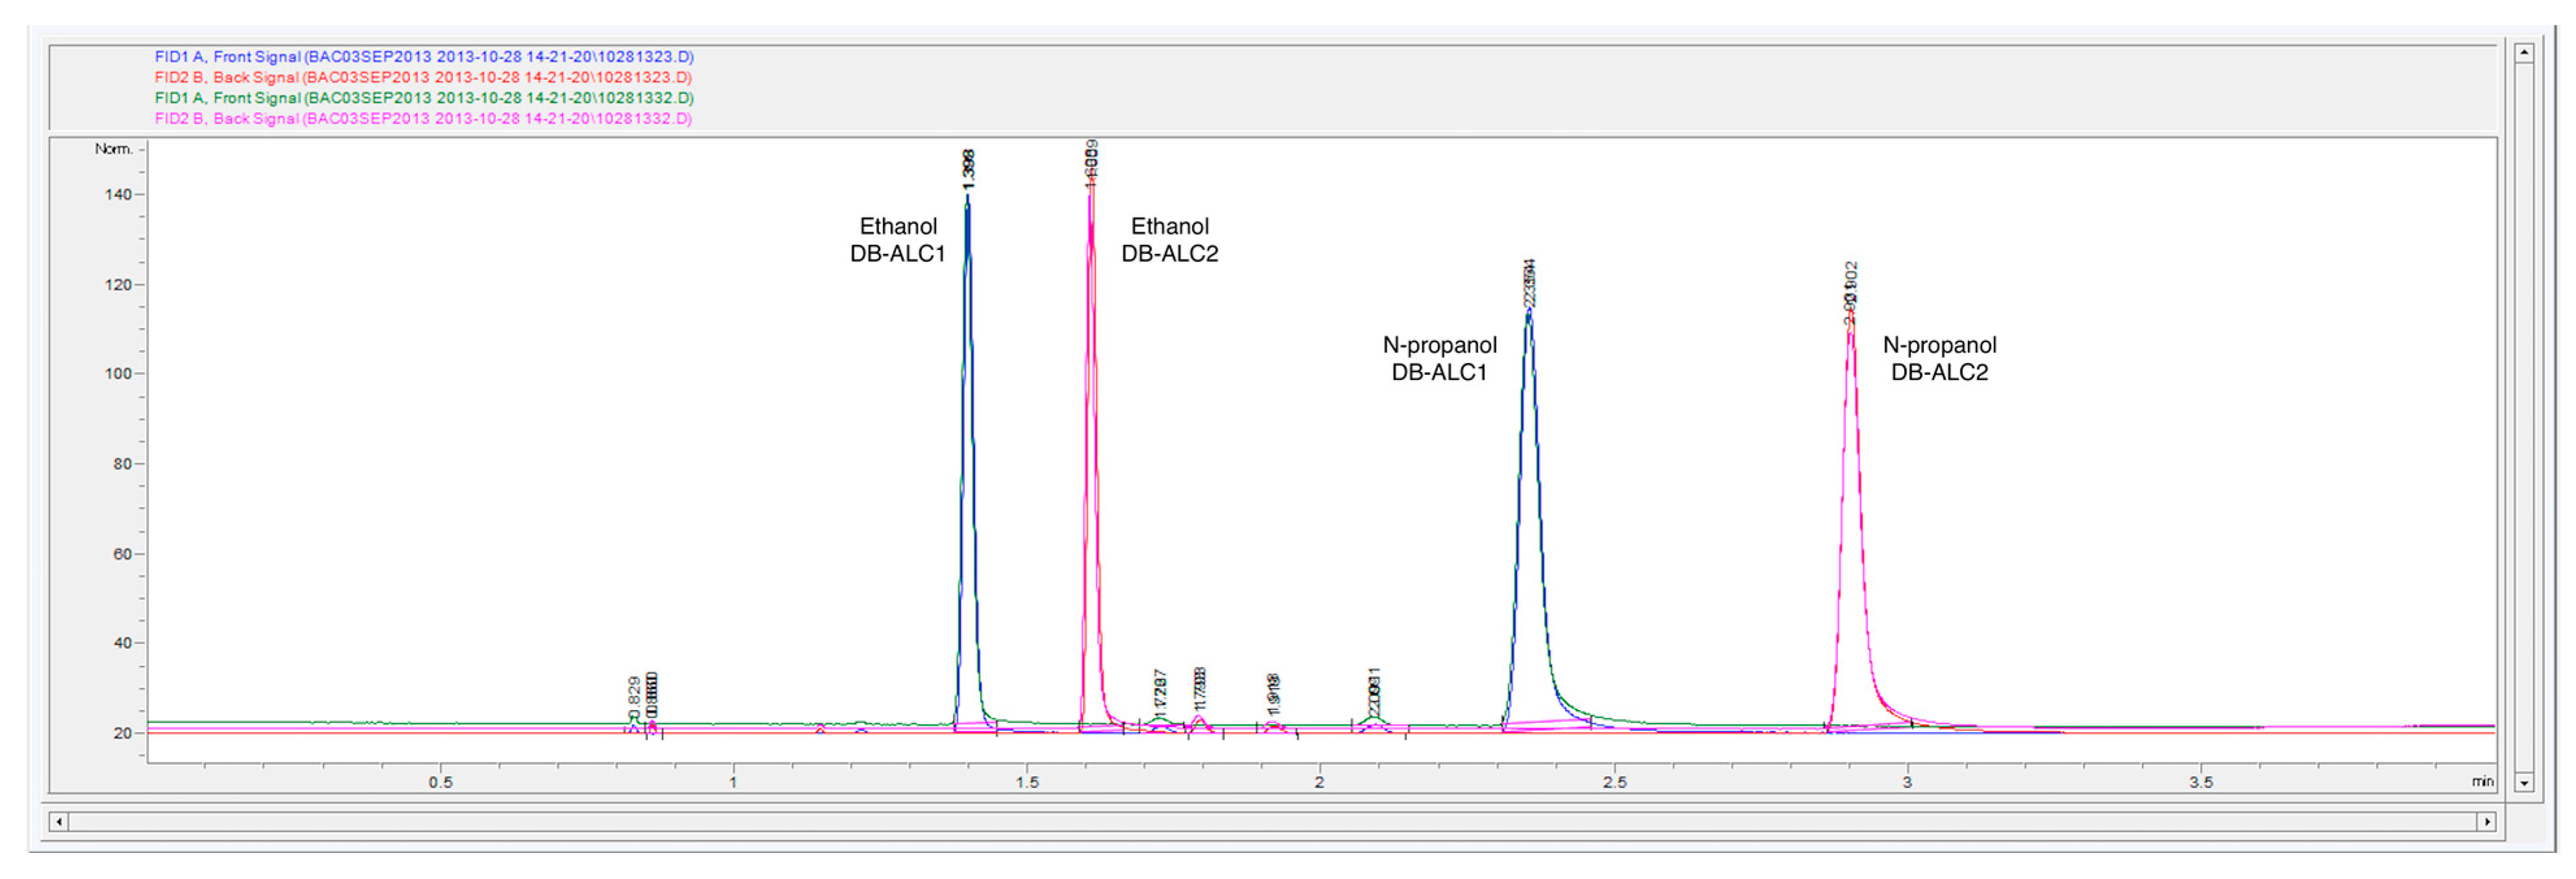
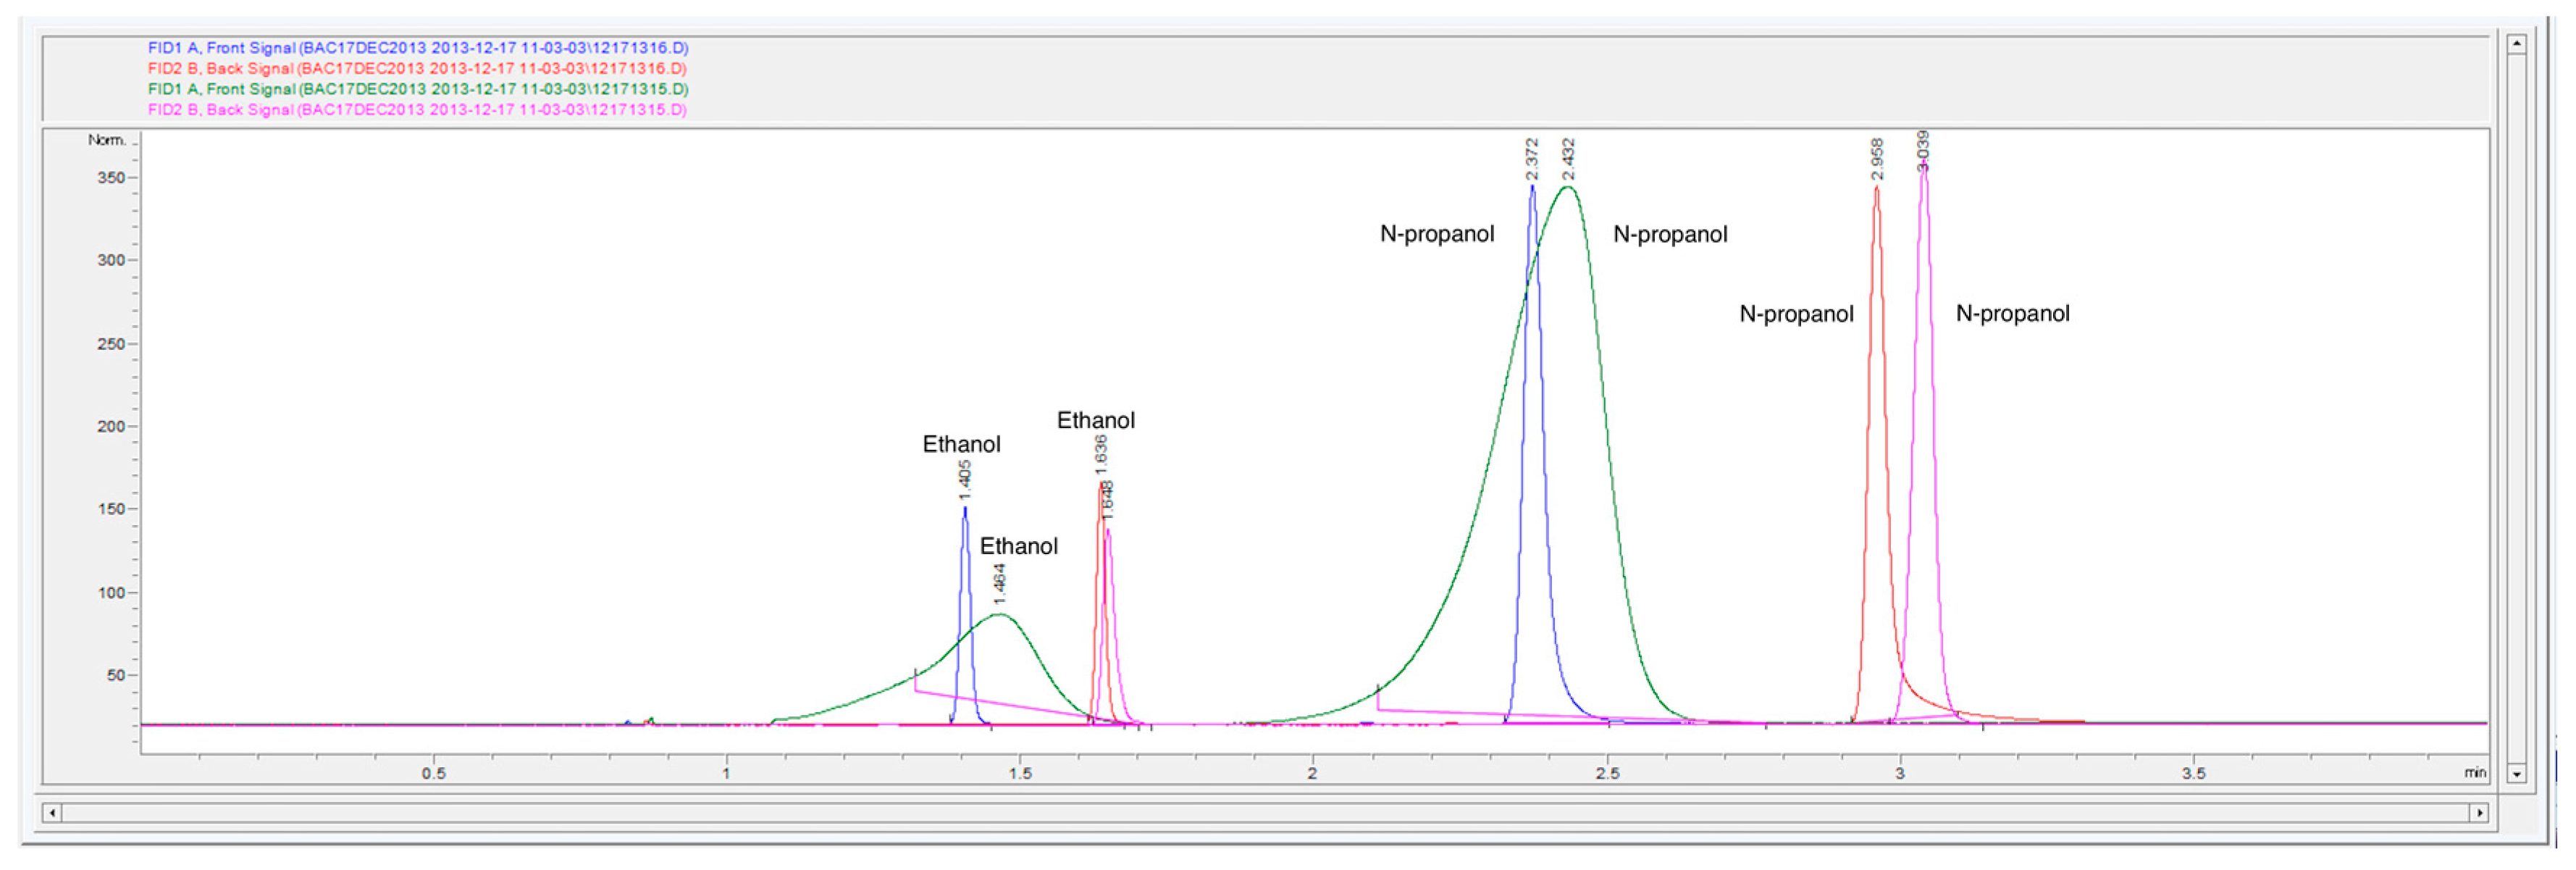
Figure 3 are the chromatograms from DB-ALC1 and DB-ALC2 (overlapped) of ethanol and
n-propanol (internal standard) within the continuing calibration verification standard.
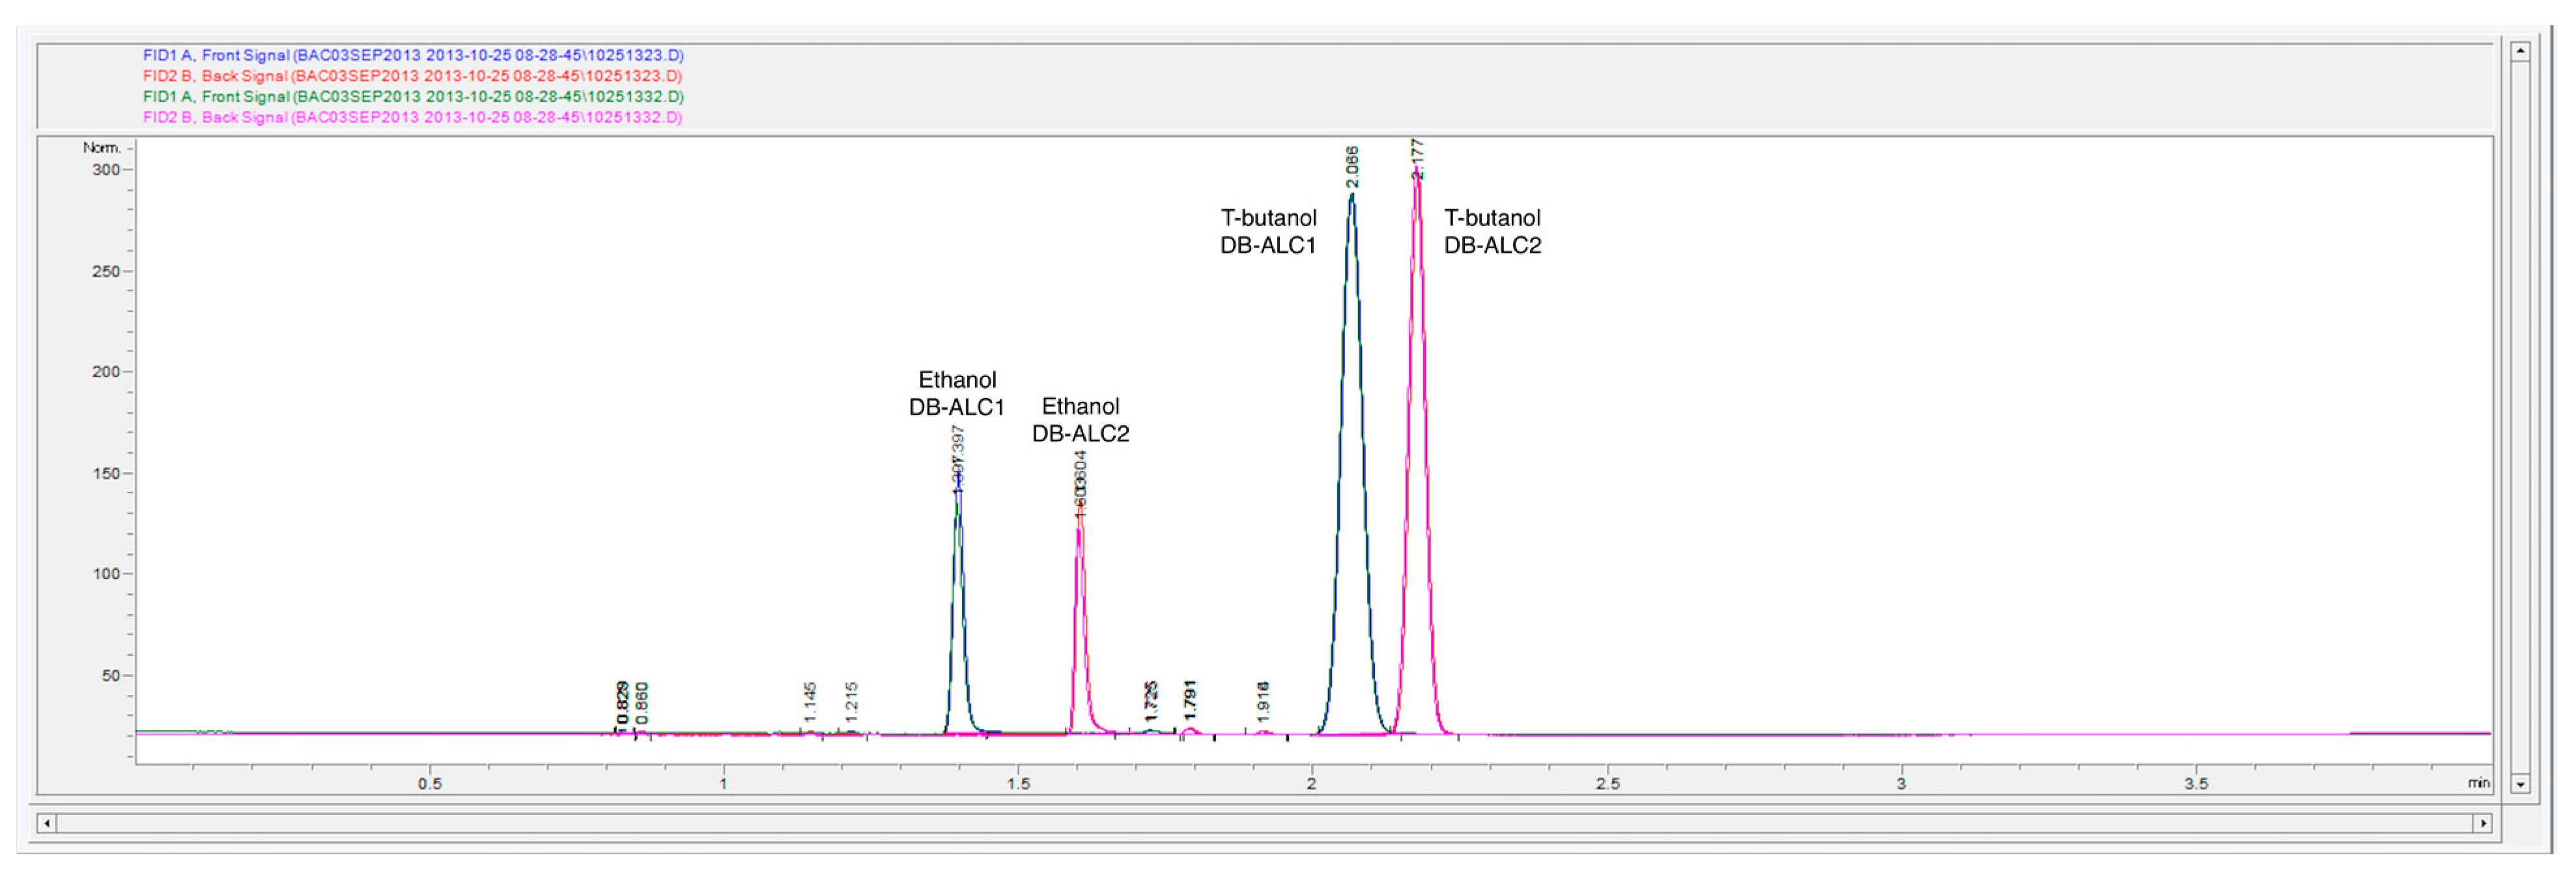
Figure 4 are the chromatograms from DB-ALC1 and DB-ALC2 (overlapped) of ethanol and
t-butanol (internal standard) within the continuing calibration verification standard. Baseline resolution and acceptable peak shape are displayed for both chromatograms. There is slight tailing occurring in both
n-propanol peaks within
Figure 3. Peak tailing is attributed to reversible adsorption within the transfer line and column. Agilent OpenLab CDS ChemStation was used for the determination of the peak areas using equivalent integration parameters in order to maintain consistency.
Figure 3.
Gas headspace chromatograms of two continuing calibration verifications (overlaid) with
n-propanol as an internal standard. Samples were run under the original headspace parameters (
Table 1) provided by Agilent Technologies (100 °C headspace oven temperature, headspace vial pressurization of 15 psi).
Figure 4.
Gas headspace chromatograms of two continuing calibration verifications (overlaid) with
t-butanol as an internal standard. Samples were run under the OEM headspace parameters (
Table 1) provided by Agilent Technologies (100 °C headspace oven temperature, headspace vial pressurization of 15 psi).
Each set of altered headspace parameters was evaluated in a single sequence with a full calibration curve (0.02 g/dL–0.30 g/dL), ten replicates of both 0.02 g/dL and 0.08 g/dL and continuing calibration verification samples (0.08 g/dL) throughout in order to directly compare the overall results.
n-Propanol and
t-butanol were run separately with each set of altered headspace parameters. Both external and internal quantification methods were performed on all altered headspace parameters; however, the internal standard method consistently reduced the percent error in the determination of the ethanol concentration.
Table 3 presents all the data collected using
n-propanol as an internal standard.
Table 4 presents all the collected data using
t-butanol as an internal standard.
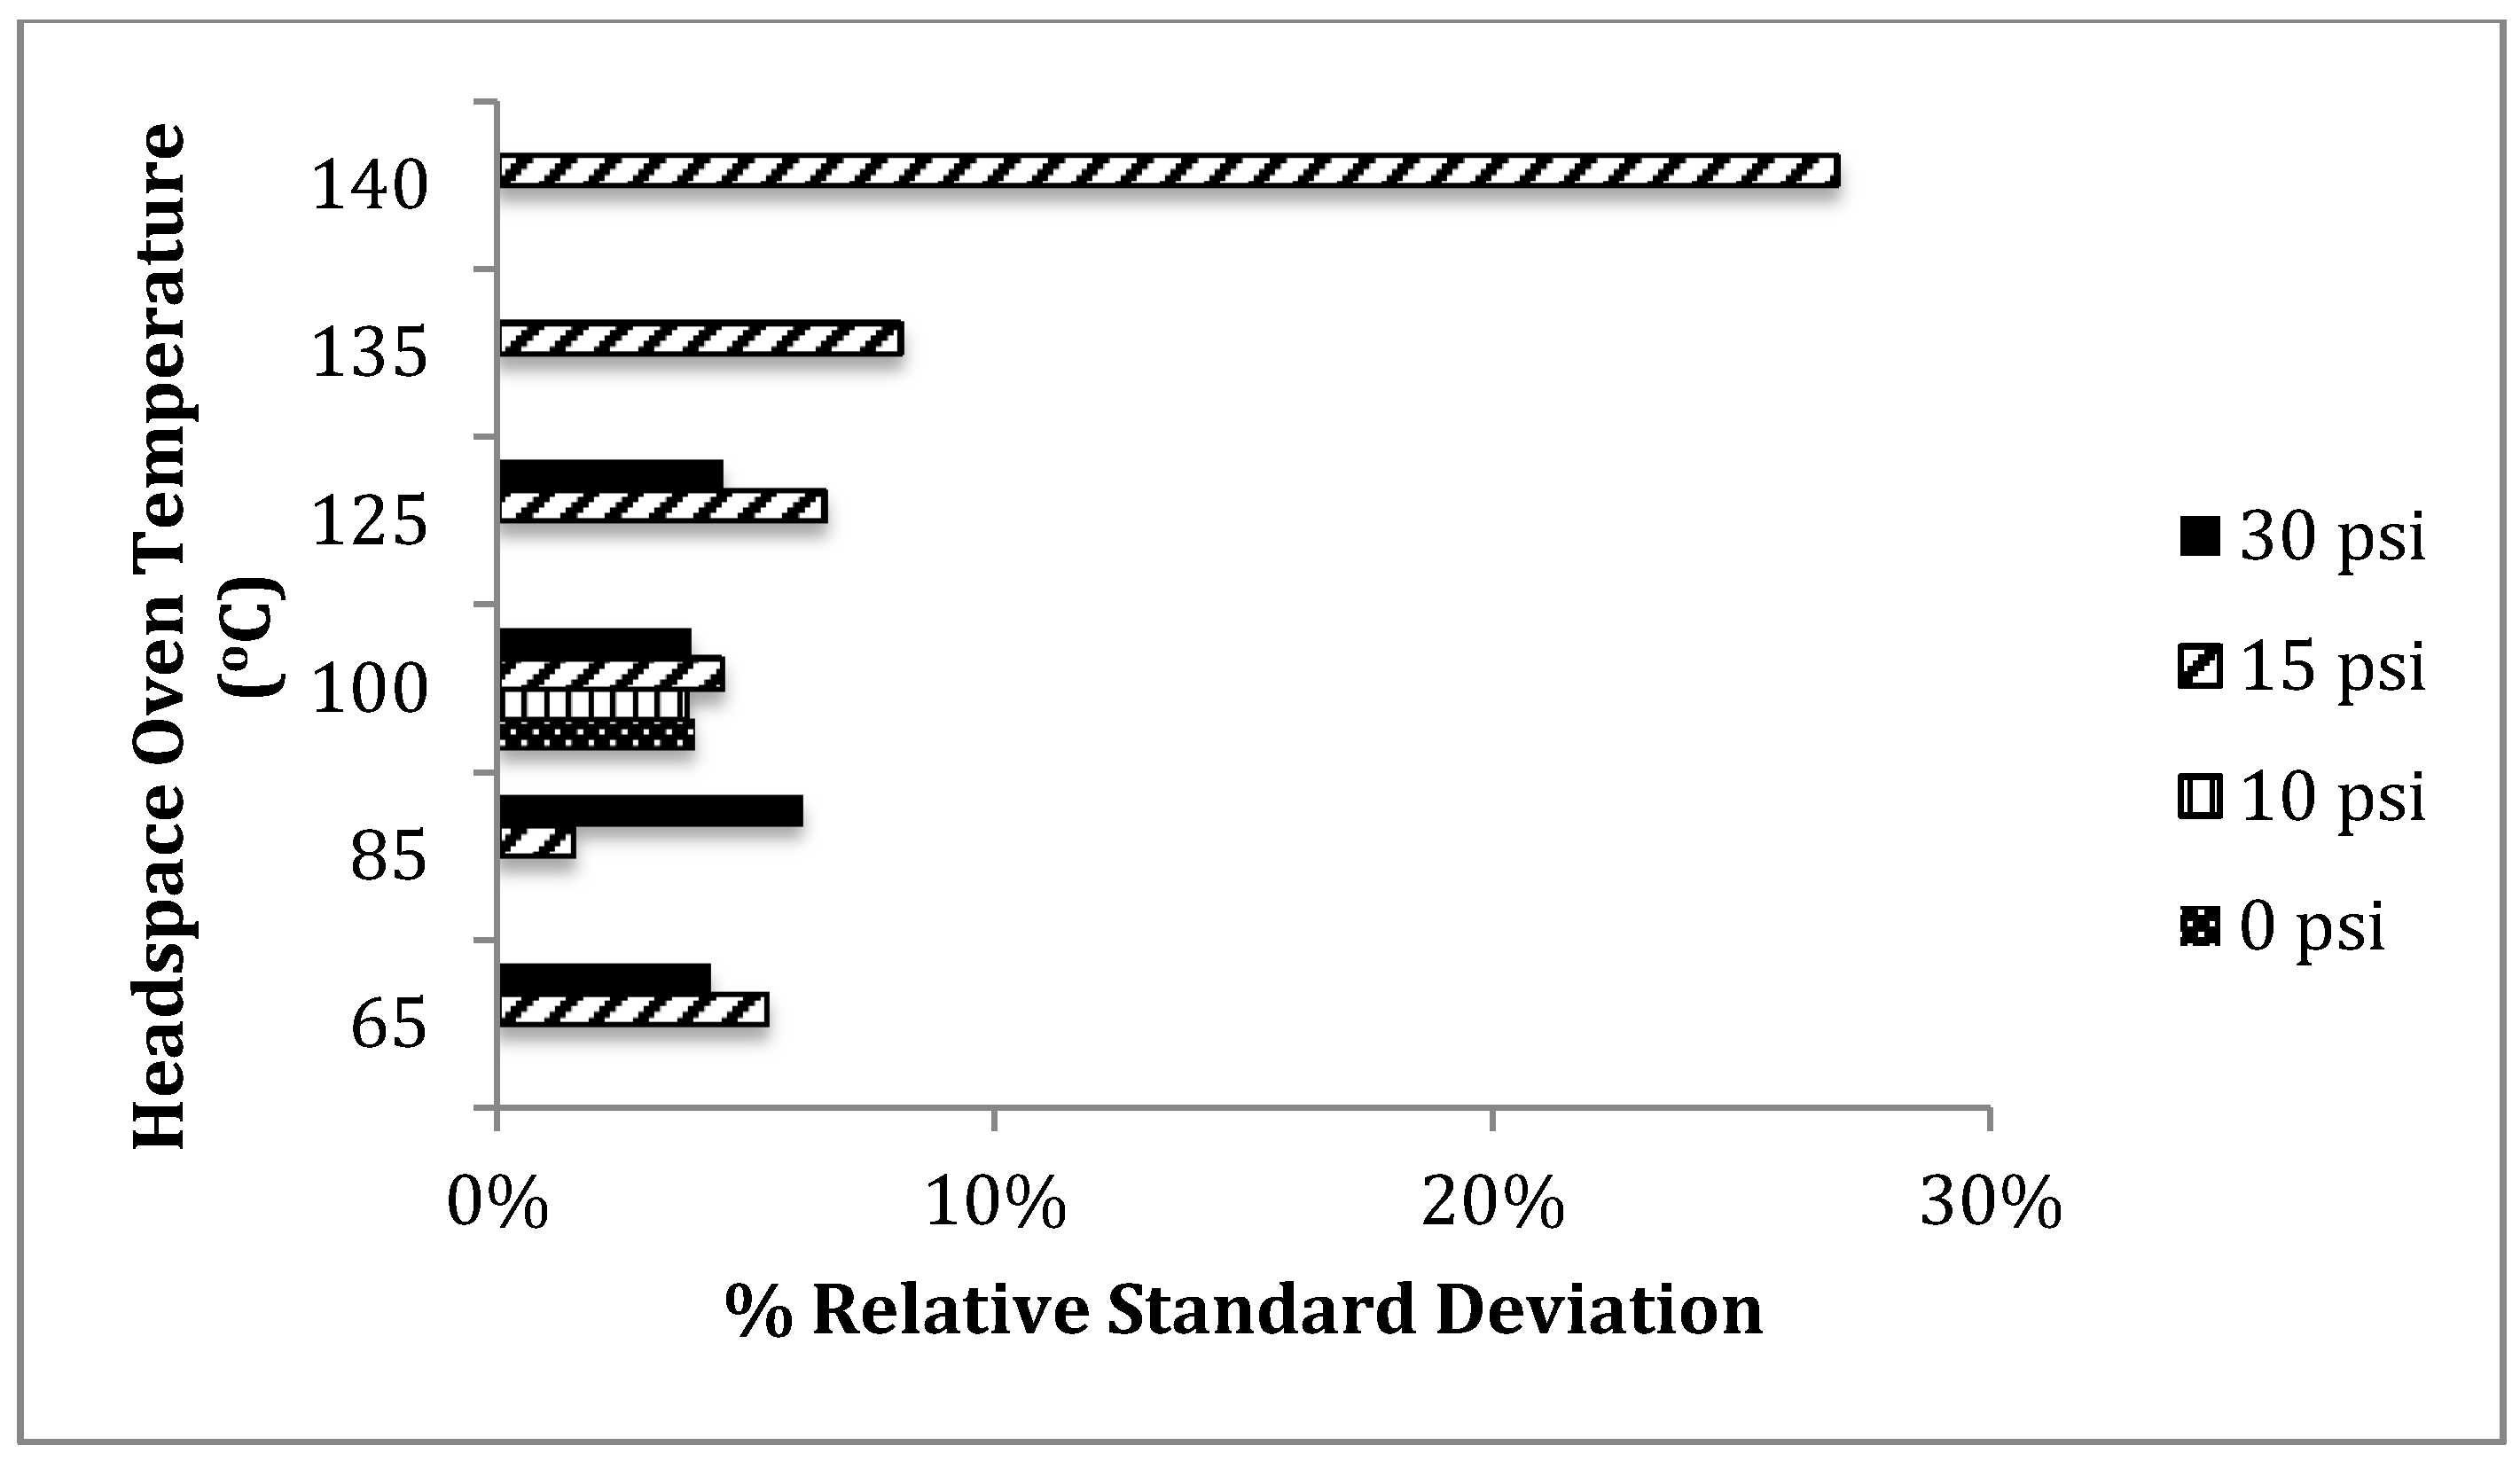
The comparison of the data collected with
n-propanol as an internal standard showed overall lower percent relative standard deviations at the common threshold of 0.08 g/dL at three different HS-oven and headspace vial pressurization parameters: (1) 85 °C, 15 psi, (2) 100 °C, 10 psi, and (3) 100 °C, 30 psi. When compared to the original instrumental parameters provided by Agilent Technologies, these three parameters produced about 1.0% to 3.0% lower percent relative standard deviation. The condition of 85 °C headspace oven temperature and 15psi headspace vial pressurization produced the overall lowest percent relative standard deviation of about 1.5%.
Figure 5 shows graphically the small variations in relative standard deviation amongst the several possible headspace parameters. With the exception of the altered headspace parameter of 140 °C, the alteration of the headspace oven temperature and headspace vial pressurization within the studied range has a rather small effect on the accuracy and precision of the determination of blood alcohol concentration when
n-propanol is used as an internal standard.
Table 3.
n-Propanol altered headspace parameters analysis results and statistics.
Table 3.
n-Propanol altered headspace parameters analysis results and statistics.
| Headspace Parameter | 65 °C, 15 psi | 65 °C, 30 psi | 85 °C, 15 psi | 85 °C, 30 psi | 100 °C, 0 psi | 100 °C, 10 psi | 100 °C, 15 psi | 100 °C, 30 psi | 125 °C, 15 psi | 125 °C, 30 psi | 135 °C, 15 psi | 140 °C, 15 psi |
|---|
| Column | ALC1 | ALC2 | ALC1 | ALC2 | ALC1 | ALC2 | ALC1 | ALC2 | ALC1 | ALC2 | ALC1 | ALC2 | ALC1 | ALC2 | ALC1 | ALC2 | ALC1 | ALC2 | ALC1 | ALC2 | ALC1 | ALC2 | ALC1 | ALC2 |
|---|
| Ethanol tR | 1.399 | 1.6 | 1.383 | 1.59 | 1.393 | 1.6 | 1.394 | 1.6 | 1.577 | 1.81 | 1.57 | 1.807 | 1.399 | 1.606 | 1.575 | 1.805 | 1.401 | 1.62 | 1.396 | 1.614 | 1.407 | 1.7 | 1.7 | 1.8 |
| n-propanoltR | 2.351 | 2.888 | 2.327 | 2.878 | 2.343 | 2.882 | 2.346 | 2.901 | 2.659 | 3.28 | 2.65 | 3.267 | 2.353 | 2.899 | 2.651 | 3.265 | 2.359 | 2.915 | 2.348 | 2.905 | 2.4 | 3.02 | 2.56 | 3.25 |
CCAL1
% Error | 5.03 | 7.35 | 3.27 | 3.39 | 3.29 | 7.70 | 1.13 | 5.58 | 3.92 | 4.95 | 8.76 | 8.51 | 0.24 | 0.59 | 4.85 | 4.79 | 4.62 | 6.49 | 3.34 | 4.65 | 14.35 | 2.79 | N/A | N/A |
CCAL2
% Error | 3.62 | 6.74 | 1.59 | 0.53 | 2.13 | 7.37 | 8.27 | 3.77 | 9.63 | 13.14 | 12.11 | 11.01 | 3.27 | 2.49 | 6.60 | 5.81 | 2.40 | 7.57 | 2.99 | 7.61 | 38.91 | 5.54 | N/A | N/A |
CCAL3
% Error | 3.74 | 7.05 | 4.57 | 3.11 | 1.45 | 6.68 | 3.64 | 7.26 | 12.13 | 18.54 | N/A | N/A | 5.82 | 4.79 | 7.56 | 7.07 | 2.53 | 0.42 | 4.32 | 7.92 | 11.03 | 0.70 | N/A | N/A |
| 0.02 %RSD | 5.00 | 5.78 | 2.02 | 2.59 | 2.13 | 2.49 | 13.99 | 8.25 | 1.90 | 3.08 | 6.99 | 7.31 | 4.38 | 4.53 | 3.81 | 3.50 | 4.52 | 6.39 | 5.62 | 9.77 | 14.32 | 3.92 | 38.39 | 22.77 |
| MDL | 0.0027 | 0.003 | 0.001 | 0.001 | 0.001 | 0.001 | 0.0001 | 0.00004 | 0.0011 | 0.0017 | 0.0041 | 0.004 | 0.0027 | 0.0026 | 0.00002 | 0.00002 | 0.0026 | 0.0037 | 0.003 | 0.005 | 0.0084 | 0.0023 | 0.0264 | 0.0144 |
| 0.08 %RSD | 5.26 | 5.54 | 4.19 | 4.36 | 1.43 | 1.61 | 28.16 | 25.20 | 3.58 | 4.31 | 3.71 | 3.88 | 4.47 | 4.53 | 3.65 | 4.09 | 2.09 | 11.02 | 3.36 | 5.70 | 7.45 | 8.72 | 16.94 | 36.87 |
Table 4.
t-Butanol altered parameters analysis results and statistics.
Table 4.
t-Butanol altered parameters analysis results and statistics.
| Headspace Parameter | 65 °C, 15 psi | 65 °C, 30 psi | 85 °C, 15 psi | 85 °C, 30 psi | 100 °C, 0 psi | 100 °C, 10 psi | 100 °C, 15 psi | 100 °C, 30 psi | 125 °C, 15 psi | 125 °C, 30 psi | 135 °C, 15 psi | 140 °C, 15 psi |
|---|
| Column | ALC1 | ALC2 | ALC1 | ALC2 | ALC1 | ALC2 | ALC1 | ALC2 | ALC1 | ALC2 | ALC1 | ALC2 | ALC1 | ALC2 | ALC1 | ALC2 | ALC1 | ALC2 | ALC1 | ALC2 | ALC1 | ALC2 | ALC1 | ALC2 |
|---|
| Ethanol tR | 1.383 | 1.596 | 1.395 | 1.605 | 1.383 | 1.599 | 1.393 | 1.6 | 1.577 | 1.81 | 1.575 | 1.808 | 1.399 | 1.606 | 1.575 | 1.805 | 1.4 | 1.6 | 1.396 | 1.62 | 1.6 | 1.8 | 1.5 | 1.8 |
| t-butanol tR | 2.041 | 2.158 | 2.057 | 2.158 | 2.042 | 2.163 | 2.057 | 2.162 | 2.328 | 2.451 | 2.327 | 2.451 | 2.066 | 2.18 | 2.327 | 2.448 | 2.07 | 2.193 | 2.065 | 2.189 | 2.25 | 2.5 | 2.2 | 2.4 |
CCAL1
% Error | 5.48 | 5.64 | 56.26 | 51.95 | 6.34 | 7.23 | 5.51 | 4.80 | 8.06 | 6.37 | 4.49 | 4.35 | 2.39 | 1.74 | 1.20 | 0.14 | 0.03 | 1.22 | 4.45 | 5.57 | 22.32 | 2.20 | 23.97 | 12.36 |
CCAL2
% Error | 0.88 | 1.08 | 10.2 | 4.96 | 7.11 | 8.58 | 6.72 | 0.63 | 4.11 | 5.99 | 8.00 | 7.16 | 8.05 | 7.37 | 1.60 | 1.58 | 3.75 | 5.37 | 2.79 | 6.71 | 3.84 | 0.60 | N/A | N/A |
CCAL3
% Error | 10.95 | 10.42 | 13.72 | 5.54 | 12.11 | 13.23 | 11.59 | 2.01 | 0.92 | 1.68 | 2.84 | 1.91 | 9.29 | 9.66 | 1.89 | 1.78 | 0.81 | 1.73 | 10.25 | 18.16 | N/A | 58.35 | N/A | 7.52 |
| 0.02 %RSD | 5.09 | 6.02 | N/A | N/A | 3.90 | 4.02 | 10.80 | 4.50 | 4.27 | 5.22 | 4.14 | 3.87 | 17.08 | 4.26 | 1.68 | 2.15 | 7.54 | 7.75 | 5.63 | 5.93 | 11.28 | 12.13 | 95.04 | 29.72 |
| MDL | 0.0025 | 0.0027 | N/A | N/A | 0.0017 | 0.0016 | 0.0001 | 0.00002 | 0.0023 | 0.0026 | 0.0022 | 0.0021 | 0.002 | 0.0019 | 0.001 | 0.0012 | 0.0044 | 0.0056 | 0.0035 | 0.0033 | 0.0061 | 0.0071 | 0.0274 | 0.0134 |
| 0.08 %RSD | 5.97 | 6.03 | 15.78 | 15.45 | 1.28 | 1.33 | 9.53 | 6.25 | 1.79 | 2.23 | 3.06 | 3.22 | 9.29 | 9.18 | 3.32 | 3.36 | 9.89 | 9.65 | 5.01 | 10.95 | 31.21 | 17.35 | 92.14 | 31.82 |
Figure 5.
Percent relative standard deviation versus headspace parameters using n-propanol (internal standard). An average percent value was taken between both DB-ALC1 and DB-ALC2 from the ten replicate samples of 0.08 g/dL.
Figure 5.
Percent relative standard deviation versus headspace parameters using n-propanol (internal standard). An average percent value was taken between both DB-ALC1 and DB-ALC2 from the ten replicate samples of 0.08 g/dL.
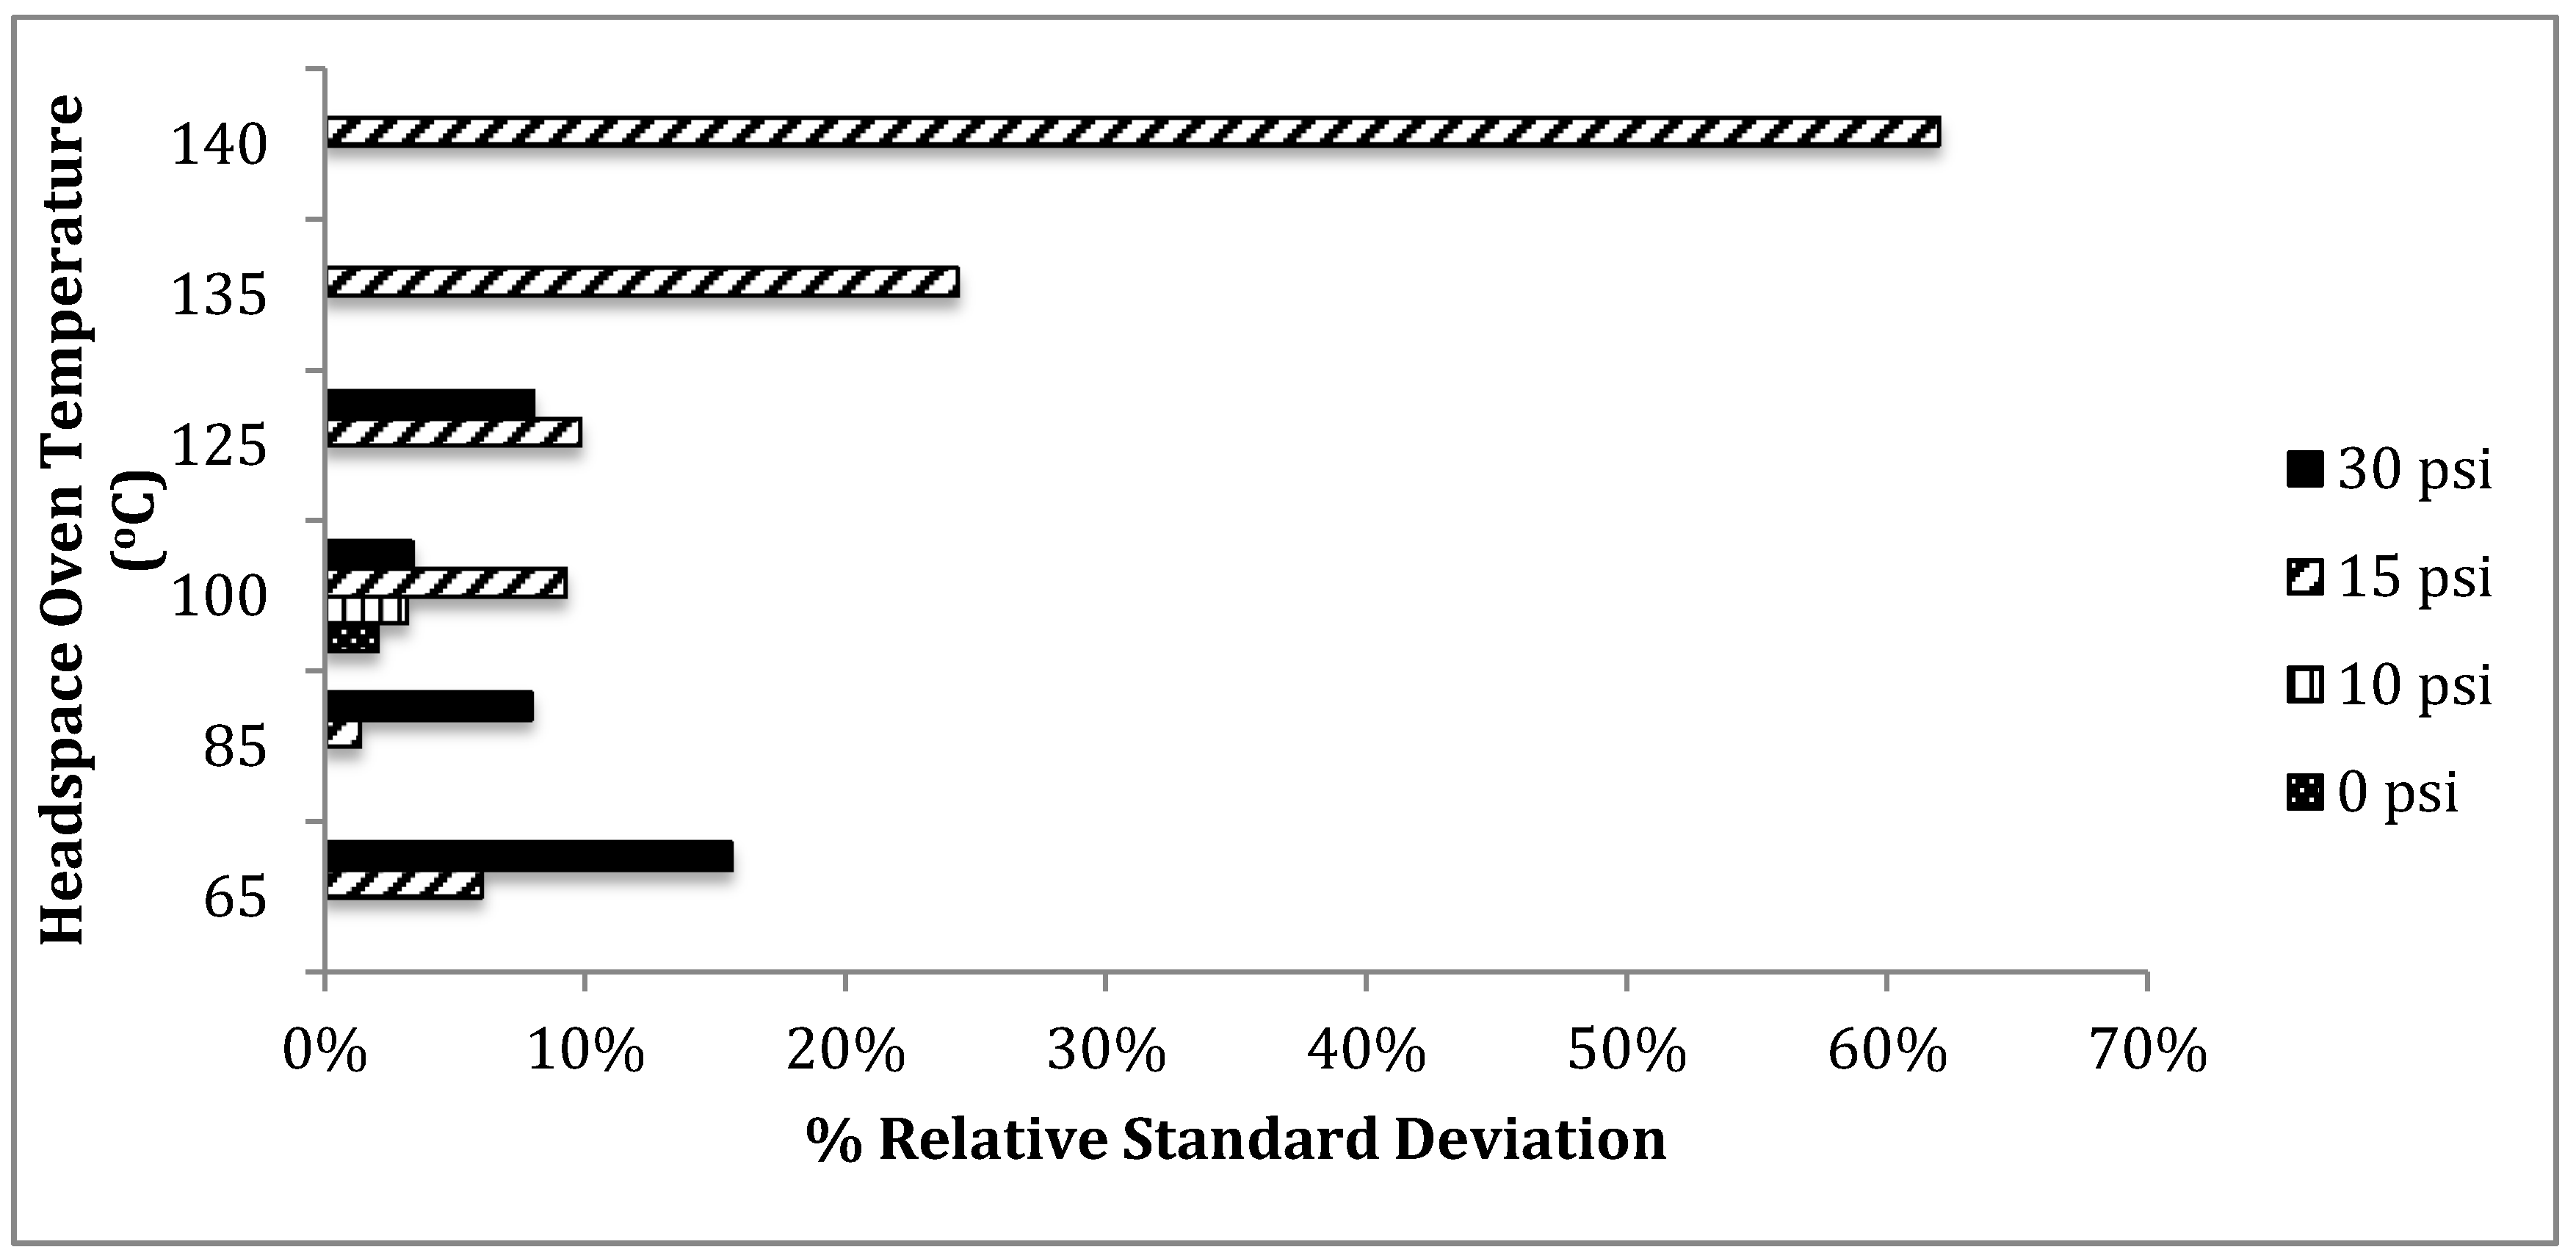
The comparison of the data collected with
t-butanol as an internal standard showed overall lower percent relative standard deviations at the common threshold of 0.08 g/dL at three different headspace parameters: (1) 85 °C, 15 psi, (2) 100 °C, 0 psi, and (3) 100 °C, 10 psi. In comparison to the original instrumental parameters provided by Agilent Technologies, these three parameters produced about 6.0% to 8.0% lower percent relative standard deviation. Again, the condition of 85 °C headspace oven temperature and 15 psi for headspace vial pressurization produced the overall lowest percent relative standard deviation of about 1.3%.
Figure 6 graphically shows more variation amongst the percent relative standard deviation for the different headspace parameters. The effect of altering the headspace parameters is much greater on the determination of the blood alcohol concentration when
t-butanol is used as an internal standard.
Figure 6.
Percent relative standard deviation versus headspace parameters using t-butanol (internal standard). An average percent value was taken from both DB-ALC1 and DB-ALC2 from ten replicates at 0.08 g/dL.
Figure 6.
Percent relative standard deviation versus headspace parameters using t-butanol (internal standard). An average percent value was taken from both DB-ALC1 and DB-ALC2 from ten replicates at 0.08 g/dL.
Relative standard deviation at the common threshold of 0.08 g/dL shows consistently lower percentages at an altered headspace parameter of 85 °C for the headspace oven temperature and 15 psi for the headspace vial pressurization when compared to the original headspace parameters (
Table 1) for both
n-propanol and
t-butanol as internal standards. Despite the headspace oven temperature being either below or at the internal standards,
t-butanol (82 °C) and
n-propanol (97 °C) boiling points, this temperature has a greater effect on the sample diluent. In order to properly vaporize the analytes within each sample without the sample diluent interfering, the headspace equilibration temperature should be lower than the boiling point of the sample diluent used [
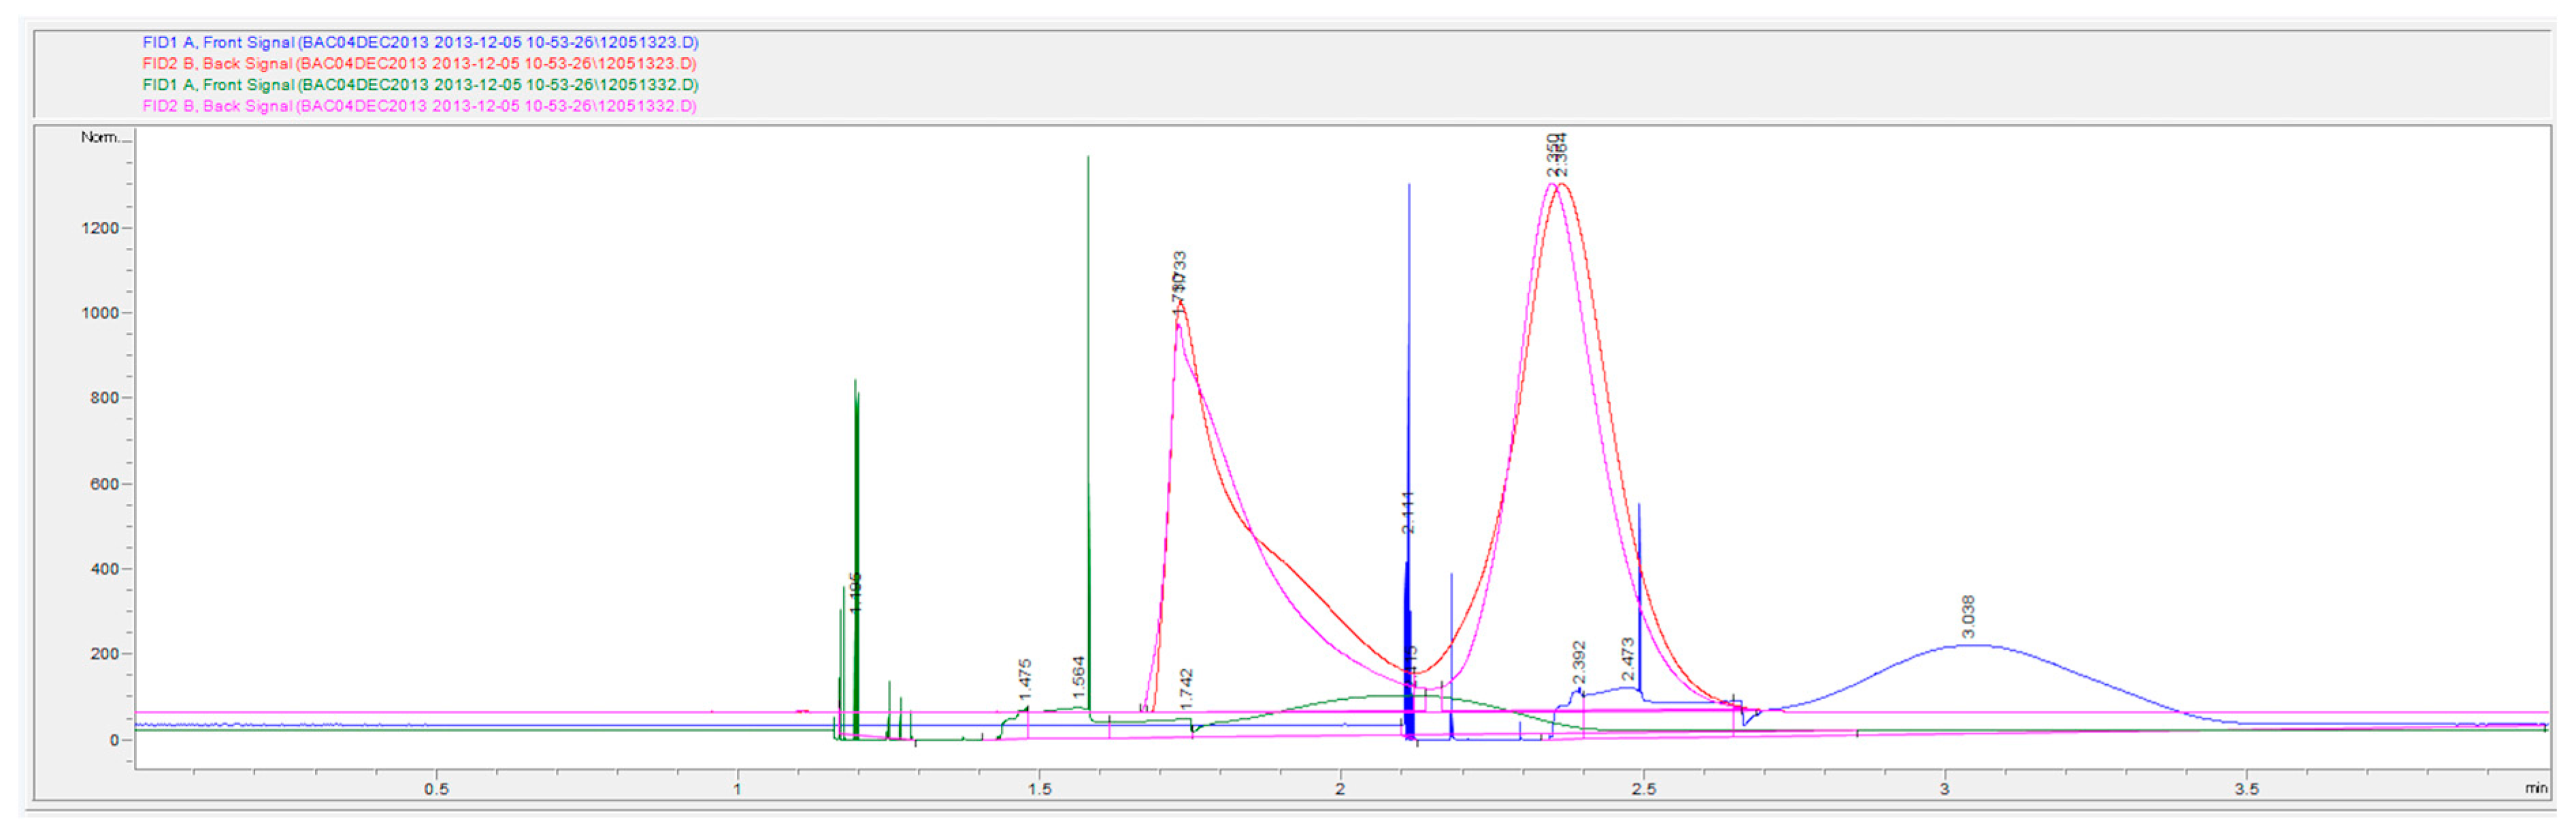
10]. In the case of water as a sample diluent, the headspace oven temperature must be lower than 100 °C to avoid vaporizing a large amount of water. If the temperature was set above 100 °C, the equilibration will result in a high vial pressure, potentially overloading the GC with a large amount of both the sample diluent and analytes. Both
Figure 7 and
Figure 8 depict individual replicate samples that were run under altered headspace parameters with a headspace oven temperature above 100 °C with
n-propanol and
t-butanol internal standards, respectively.
Figure 7.
Gas headspace chromatograms of two replicate samples (overlaid) at 0.02 g/dL with n-propanol as the internal standard. Samples were run under altered headspace parameters (135 °C headspace oven temperature, headspace vial pressurization of 15 psi). The first replicate corresponds to the blue (DB-ALC1) and red (DB-ALC2) signals and the second replicate corresponds to the green (DB-ALC1) and pink (DB-ALC2) signals.
Figure 8.
Gas headspace chromatograms of two replicate samples (overlaid) at 0.08 g/dL with t-butanol as the internal standard. Samples were run under altered headspace parameters (140 °C headspace oven temperature, headspace vial pressurization of 15 psi). The first replicate corresponds to the blue (DB-ALC1) and red (DB-ALC2) signals and the second replicate corresponds to the green (DB-ALC1) and pink (DB-ALC2) signals.
Method detection limits play a key role in determining the limit of quantification for a specific method of analysis. In most cases, and in the case of blood alcohol concentration determination, the lower the MDL, the better. This value will not only substantiate the sensitivity of the instrument, it should be reported along with the quantified result for final reporting. The original instrumental and headspace parameters provided by Agilent Technologies yielded a MDL of about 0.002 g/dL with
n-propanol and
t-butanol [
19]. Method detection limit was calculated by multiplying the standard deviation by the student’s t-value for the correct degrees of freedom.
A concentration of 0.02 g/dL was used in order to determine the method detection limit at the different headspace parameters. This concentration was chosen for the spike level based on the calculated method detection limits provided by the OEM parameters (
Table 1). The spike level used in the determination of the method detection limit should lie between the calculated MDL and ten times the calculated value [
21]. With previous values of 0.002 g/dL, a spike level of 0.02 g/dL was an appropriate choice, as seen in
Table 5.
Table 5.
Calculated method detection limit (MDL).
Table 5.
Calculated method detection limit (MDL).
| n-Propanol | t-Butanol |
|---|
| FID1 | FID2 | FID1 | FID2 |
|---|
| Standard Deviation | 0.00087 | 0.00088 | 0.000703 | 0.00067 |
| T-Value | 2.821 | 2.821 | 2.821 | 2.821 |
| Calculated MDL (g/dL) | 0.00245427 | 0.00248248 | 0.0019835 | 0.00189007 |
| 10 × Calc. MDL (g/dL) | 0.0245427 | 0.0248248 | 0.019835 | 0.0189007 |
| Actual Spike Level (g/dL) | 0.020 | 0.020 | 0.020 | 0.020 |
The comparison of the data collected with
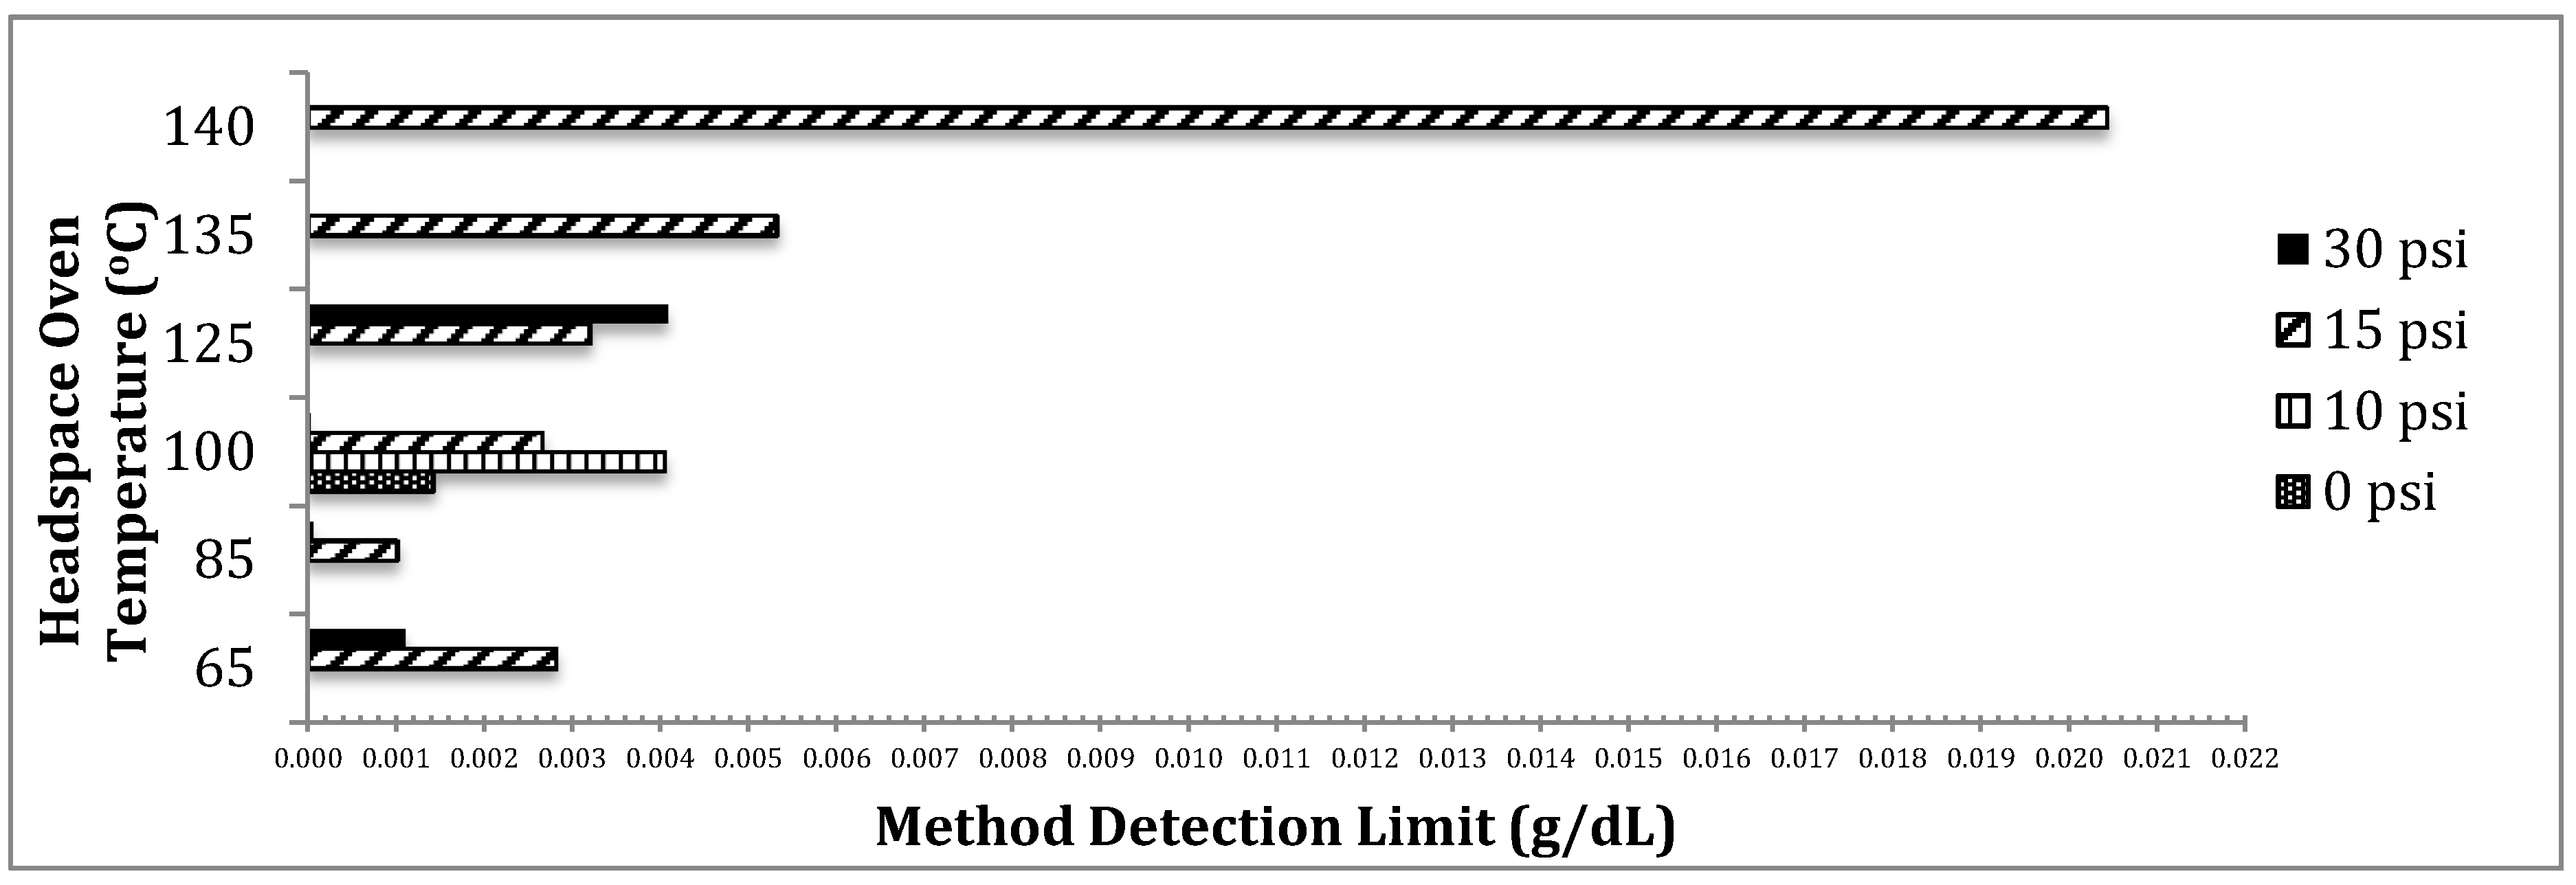
n-propanol as an internal standard showed overall lower MDLs at three different headspace parameters: (1) 100 °C, 30 psi, (2) 85 °C, 30 psi, and (3) 85 °C, 15psi. In comparison to the original parameters, these altered parameters produced about a 60% to 99% decrease in the method detection limit. The condition of 100 °C headspace oven temperature and 30 psi headspace vial pressurization produced the overall lowest MDL of about 0.00002 g/dL.
Figure 9 graphically shows the variation in MDLs amongst the several possible headspace parameters. The effect of altering the headspace parameters is much greater on the MDL than the percent relative standard deviation when
n-propanol is used as an internal standard.
Figure 9.
Method detection limits versus headspace parameters using n-propanol (internal standard). An average value was taken from both DB-ALC1 and DB-ALC2 from ten replicates at 0.02 g/dL.
Figure 9.
Method detection limits versus headspace parameters using n-propanol (internal standard). An average value was taken from both DB-ALC1 and DB-ALC2 from ten replicates at 0.02 g/dL.
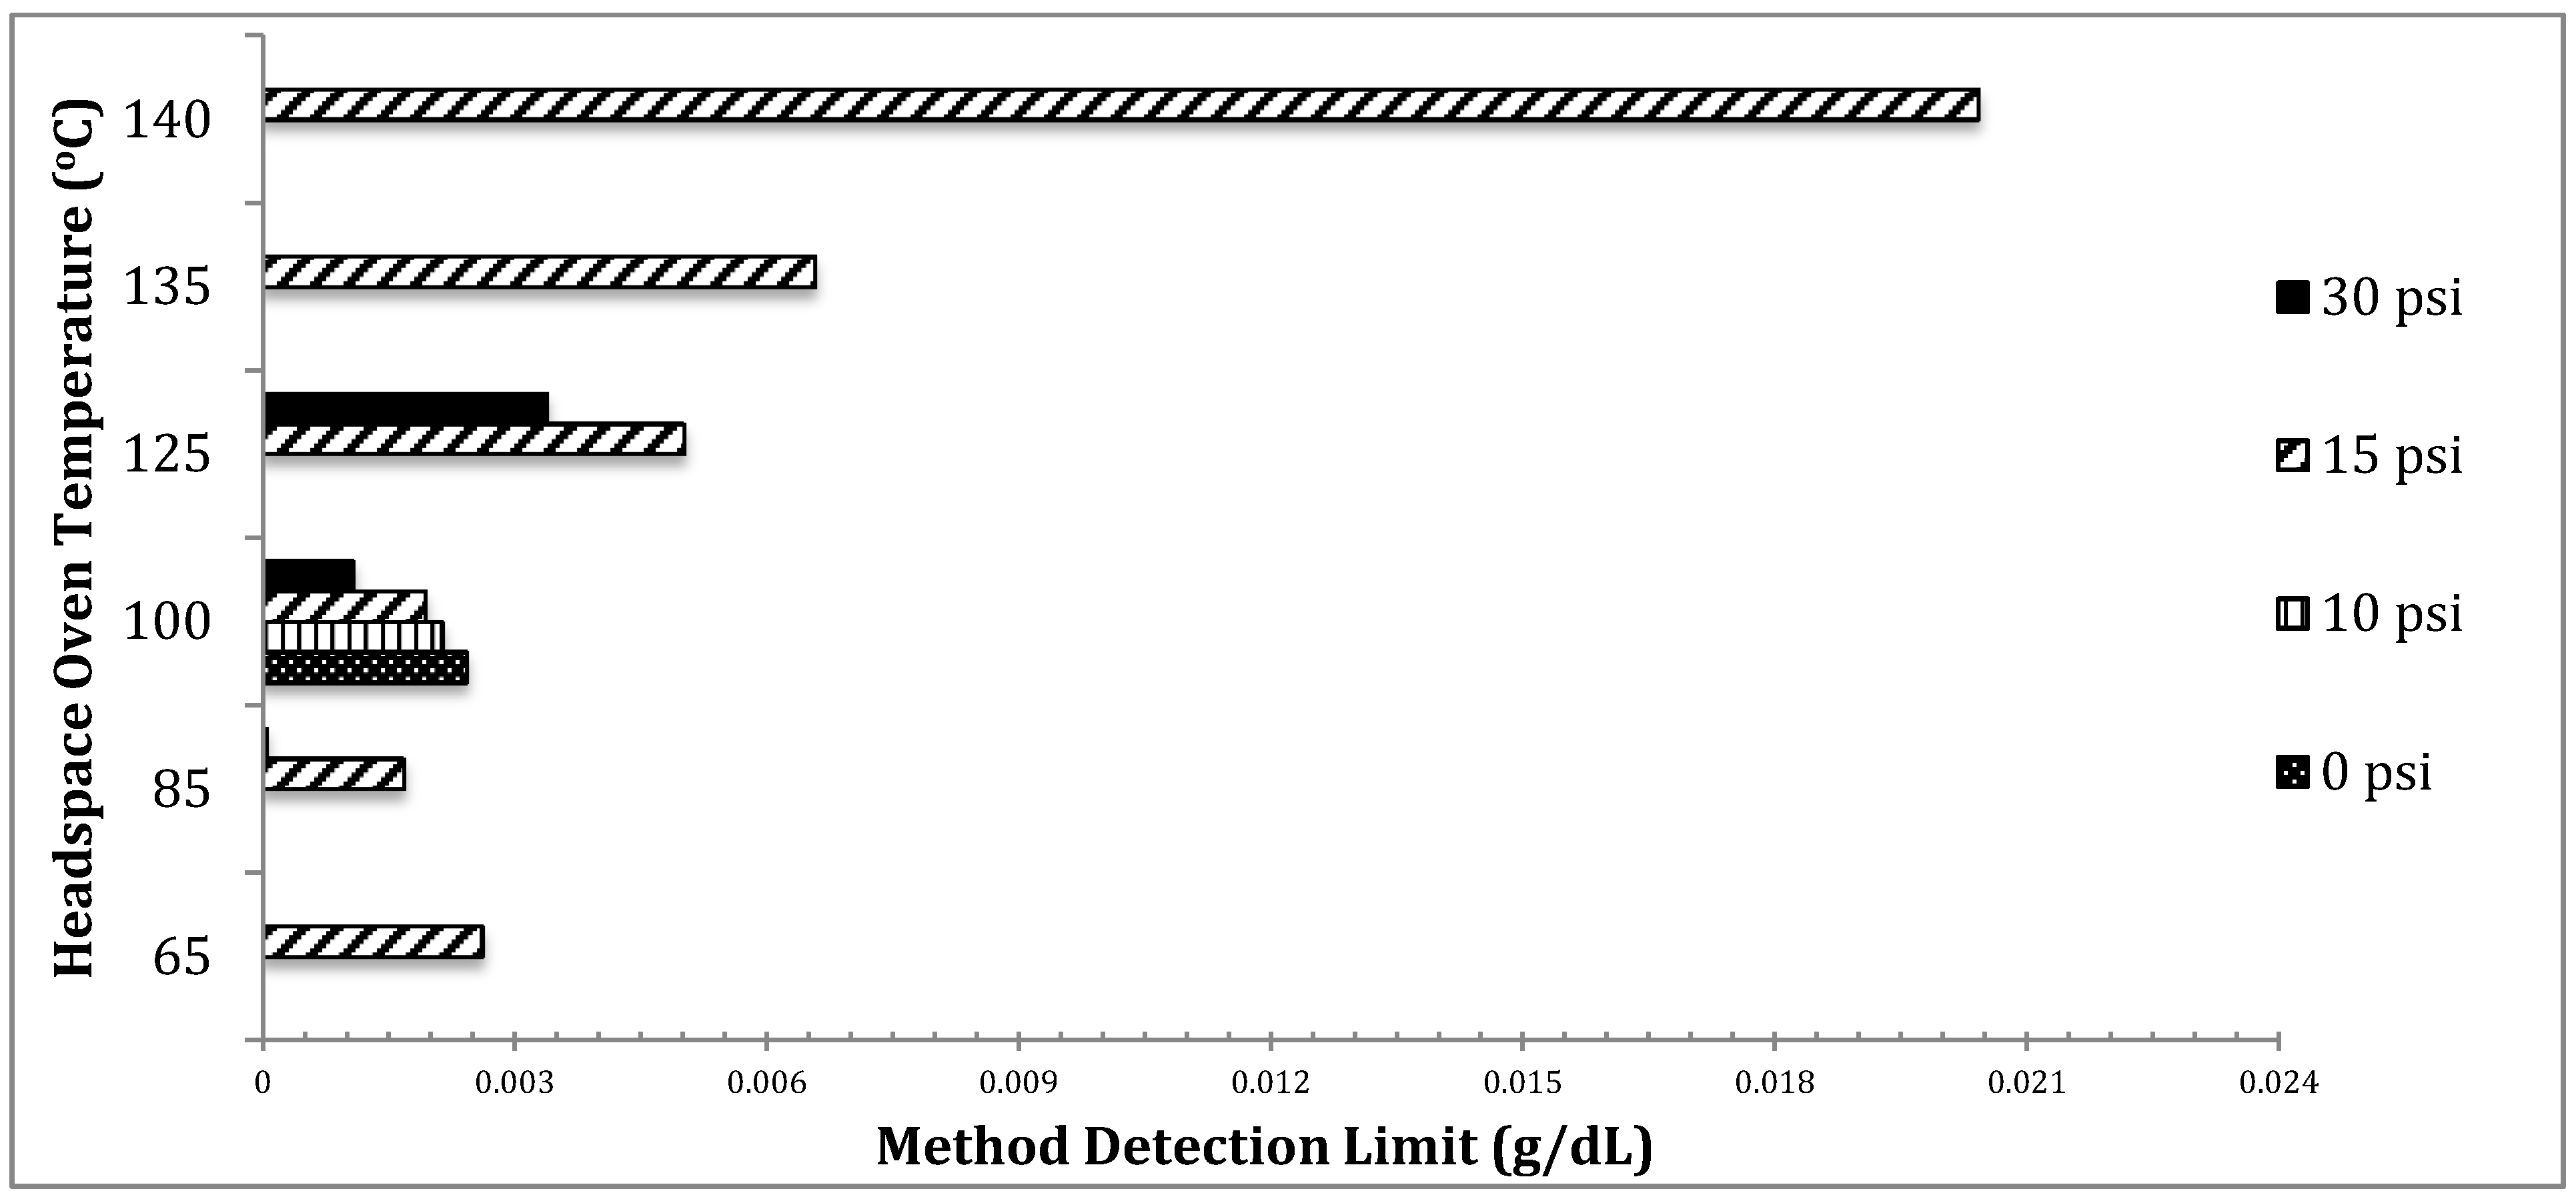
The comparison of the data collected with
t-butanol as an internal standard showed overall lower MDLs at three different headspace parameters: (1) 85 °C, 30 psi, (2) 100 °C, 30 psi, and (3) 85 °C, 15 psi. In comparison to the original parameters, these altered parameters produced about a 96 to 100% decrease in the method detection limit. The condition of 85 °C headspace oven temperature and 30 psi headspace vial pressurization produced the overall lowest MDL of about 0.00004 g/dL.
Figure 10 graphically shows the relatively small variation in MDLs amongst the several possible headspace parameters. The effect of altering the headspace parameters is rather small on the MDL when compared to the percent relative standard deviation when
t-butanol is used as an internal standard.
Figure 10.
Method detection limit versus headspace parameter using t-butanol (internal standard). An average value was taken from both DB-ALC1 and DB-ALC2 from ten replicates of 0.02 g/dL.
Figure 10.
Method detection limit versus headspace parameter using t-butanol (internal standard). An average value was taken from both DB-ALC1 and DB-ALC2 from ten replicates of 0.02 g/dL.
4. Conclusions
This study concludes that an improvement in accuracy and precision for blood alcohol concentration can be obtained using altered headspace parameters that produce lower percent relative standard deviations at the common threshold value of 0.08 g/dL and lower method detection limits.
t-Butanol (RSD = 1.3%) produced a slightly lower percent relative standard deviation at 0.08 g/dL when compared to
n-propanol (RSD = 1.5%); however, both performed optimally at an altered headspace parameter of 85 °C headspace oven temperature and 15 psi headspace vial pressurization, relative to the recommended settings by the OEM (
Table 1). Despite these values,
n-propanol was less affected by the alteration of the headspace parameters in producing accurate and precise blood alcohol concentrations.
n-Propanol excelled in producing the lowest recorded method detection limit at 0.00002 g/dL while at 100 °C headspace oven temperature and 30 psi headspace vial pressurization. The lowest recorded method detection limit was produced by
t-butanol: 0.00004 g/dL at 85 °C headspace oven temperature and 30-psi headspace vial pressurization. It appears, based on the data in this study, that alteration of the OEM headspace parameters (
Table 1) produces both an improvement in MDL and an improvement in precision at 0.08 g/dL, but interestingly these do not seem to occur at the same headspace parameters.
The chromatographic performance of the analytes was the main concern in the alteration of the headspace parameters. Variations in sample preparation were of no interest in this analysis. Chromatographic resolution and peak shape are vital in determining peak area for quantification of blood alcohol determination. With minor alterations of few headspace parameters, the accuracy and precision of the alcohol concentration can be drastically altered. Determining the optimal parameters are of utmost importance to achieve the most robust and precise analysis. Therefore, it is recommended from these data that the headspace oven temperature for this instrumentation be set to 85 °C, with a headspace vial pressurization of 15 psi, for the best overall performance.


