
Comprehensive Characterization of 76 Pharmaceuticals and Metabolites in Wastewater by LC-MS/MS


Abstract
:1. Introduction
2. Experimental
2.1. Chemicals and Reagents
2.2. Wastewaters: Sampling, Pretreatment and Extraction
2.3. LC-MS/MS Analysis
2.4. Quality Assurance
3. Results and Discussion
3.1. Optimization of the Ionization Parameters
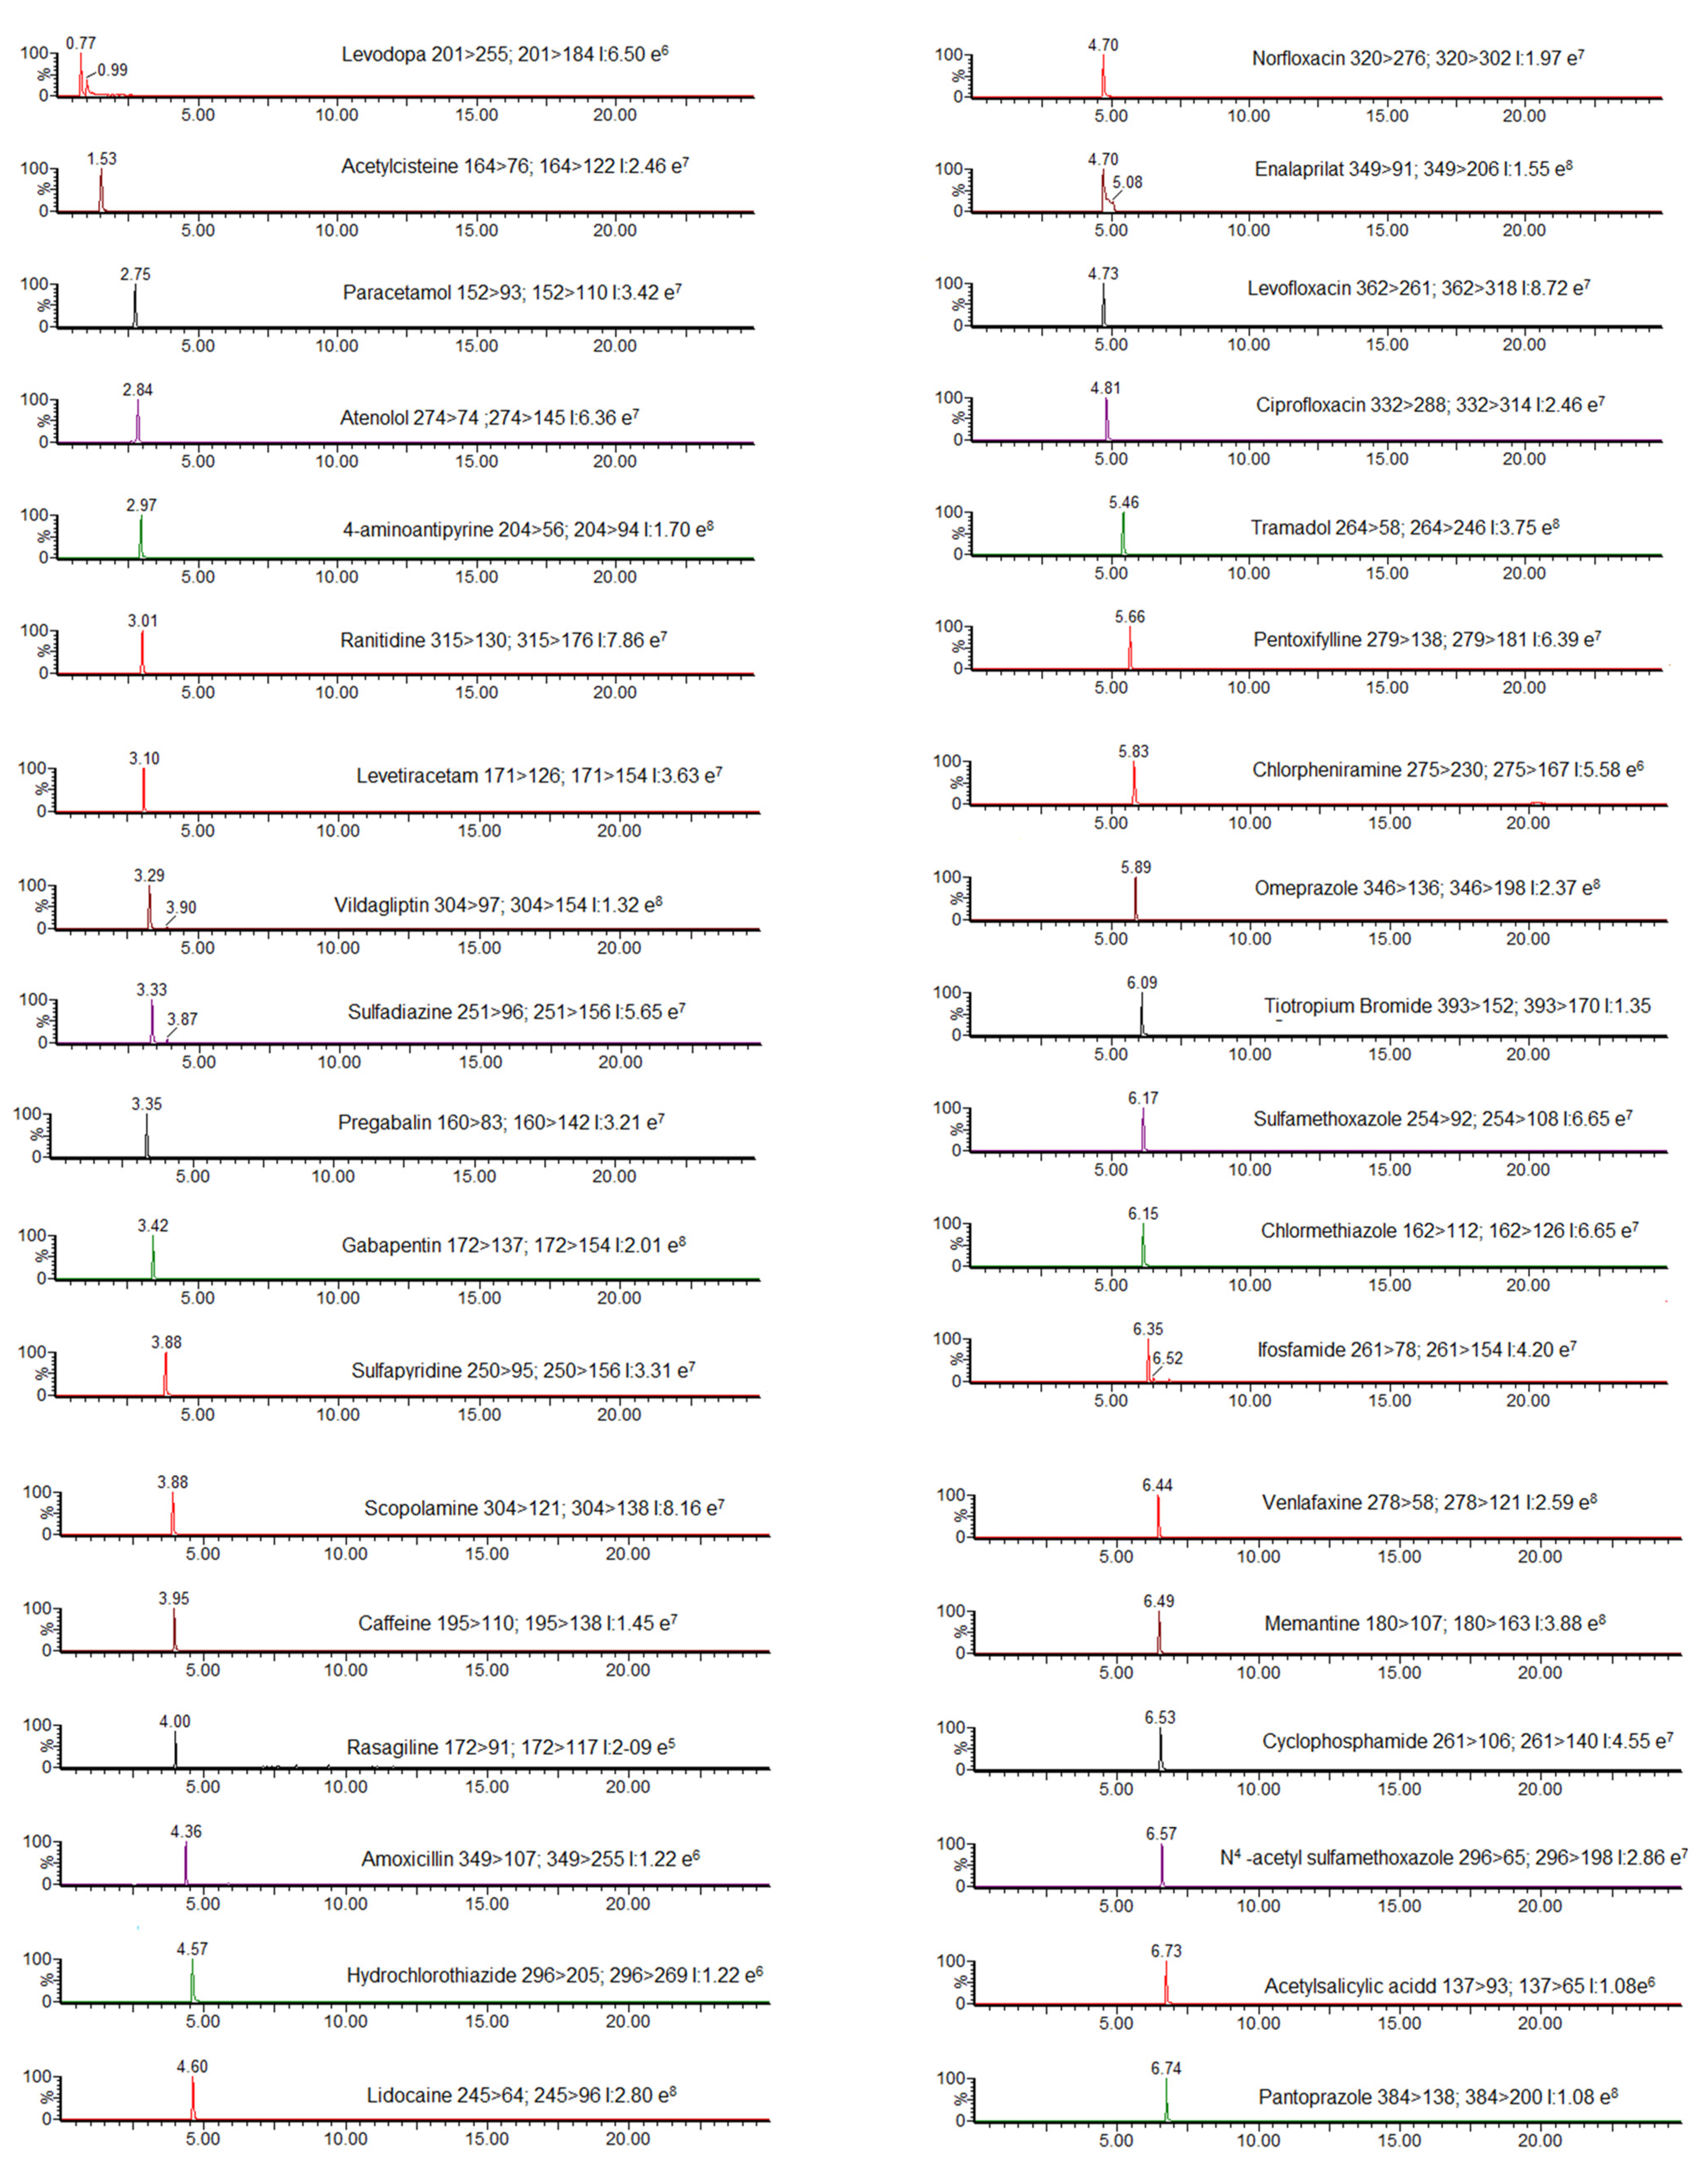
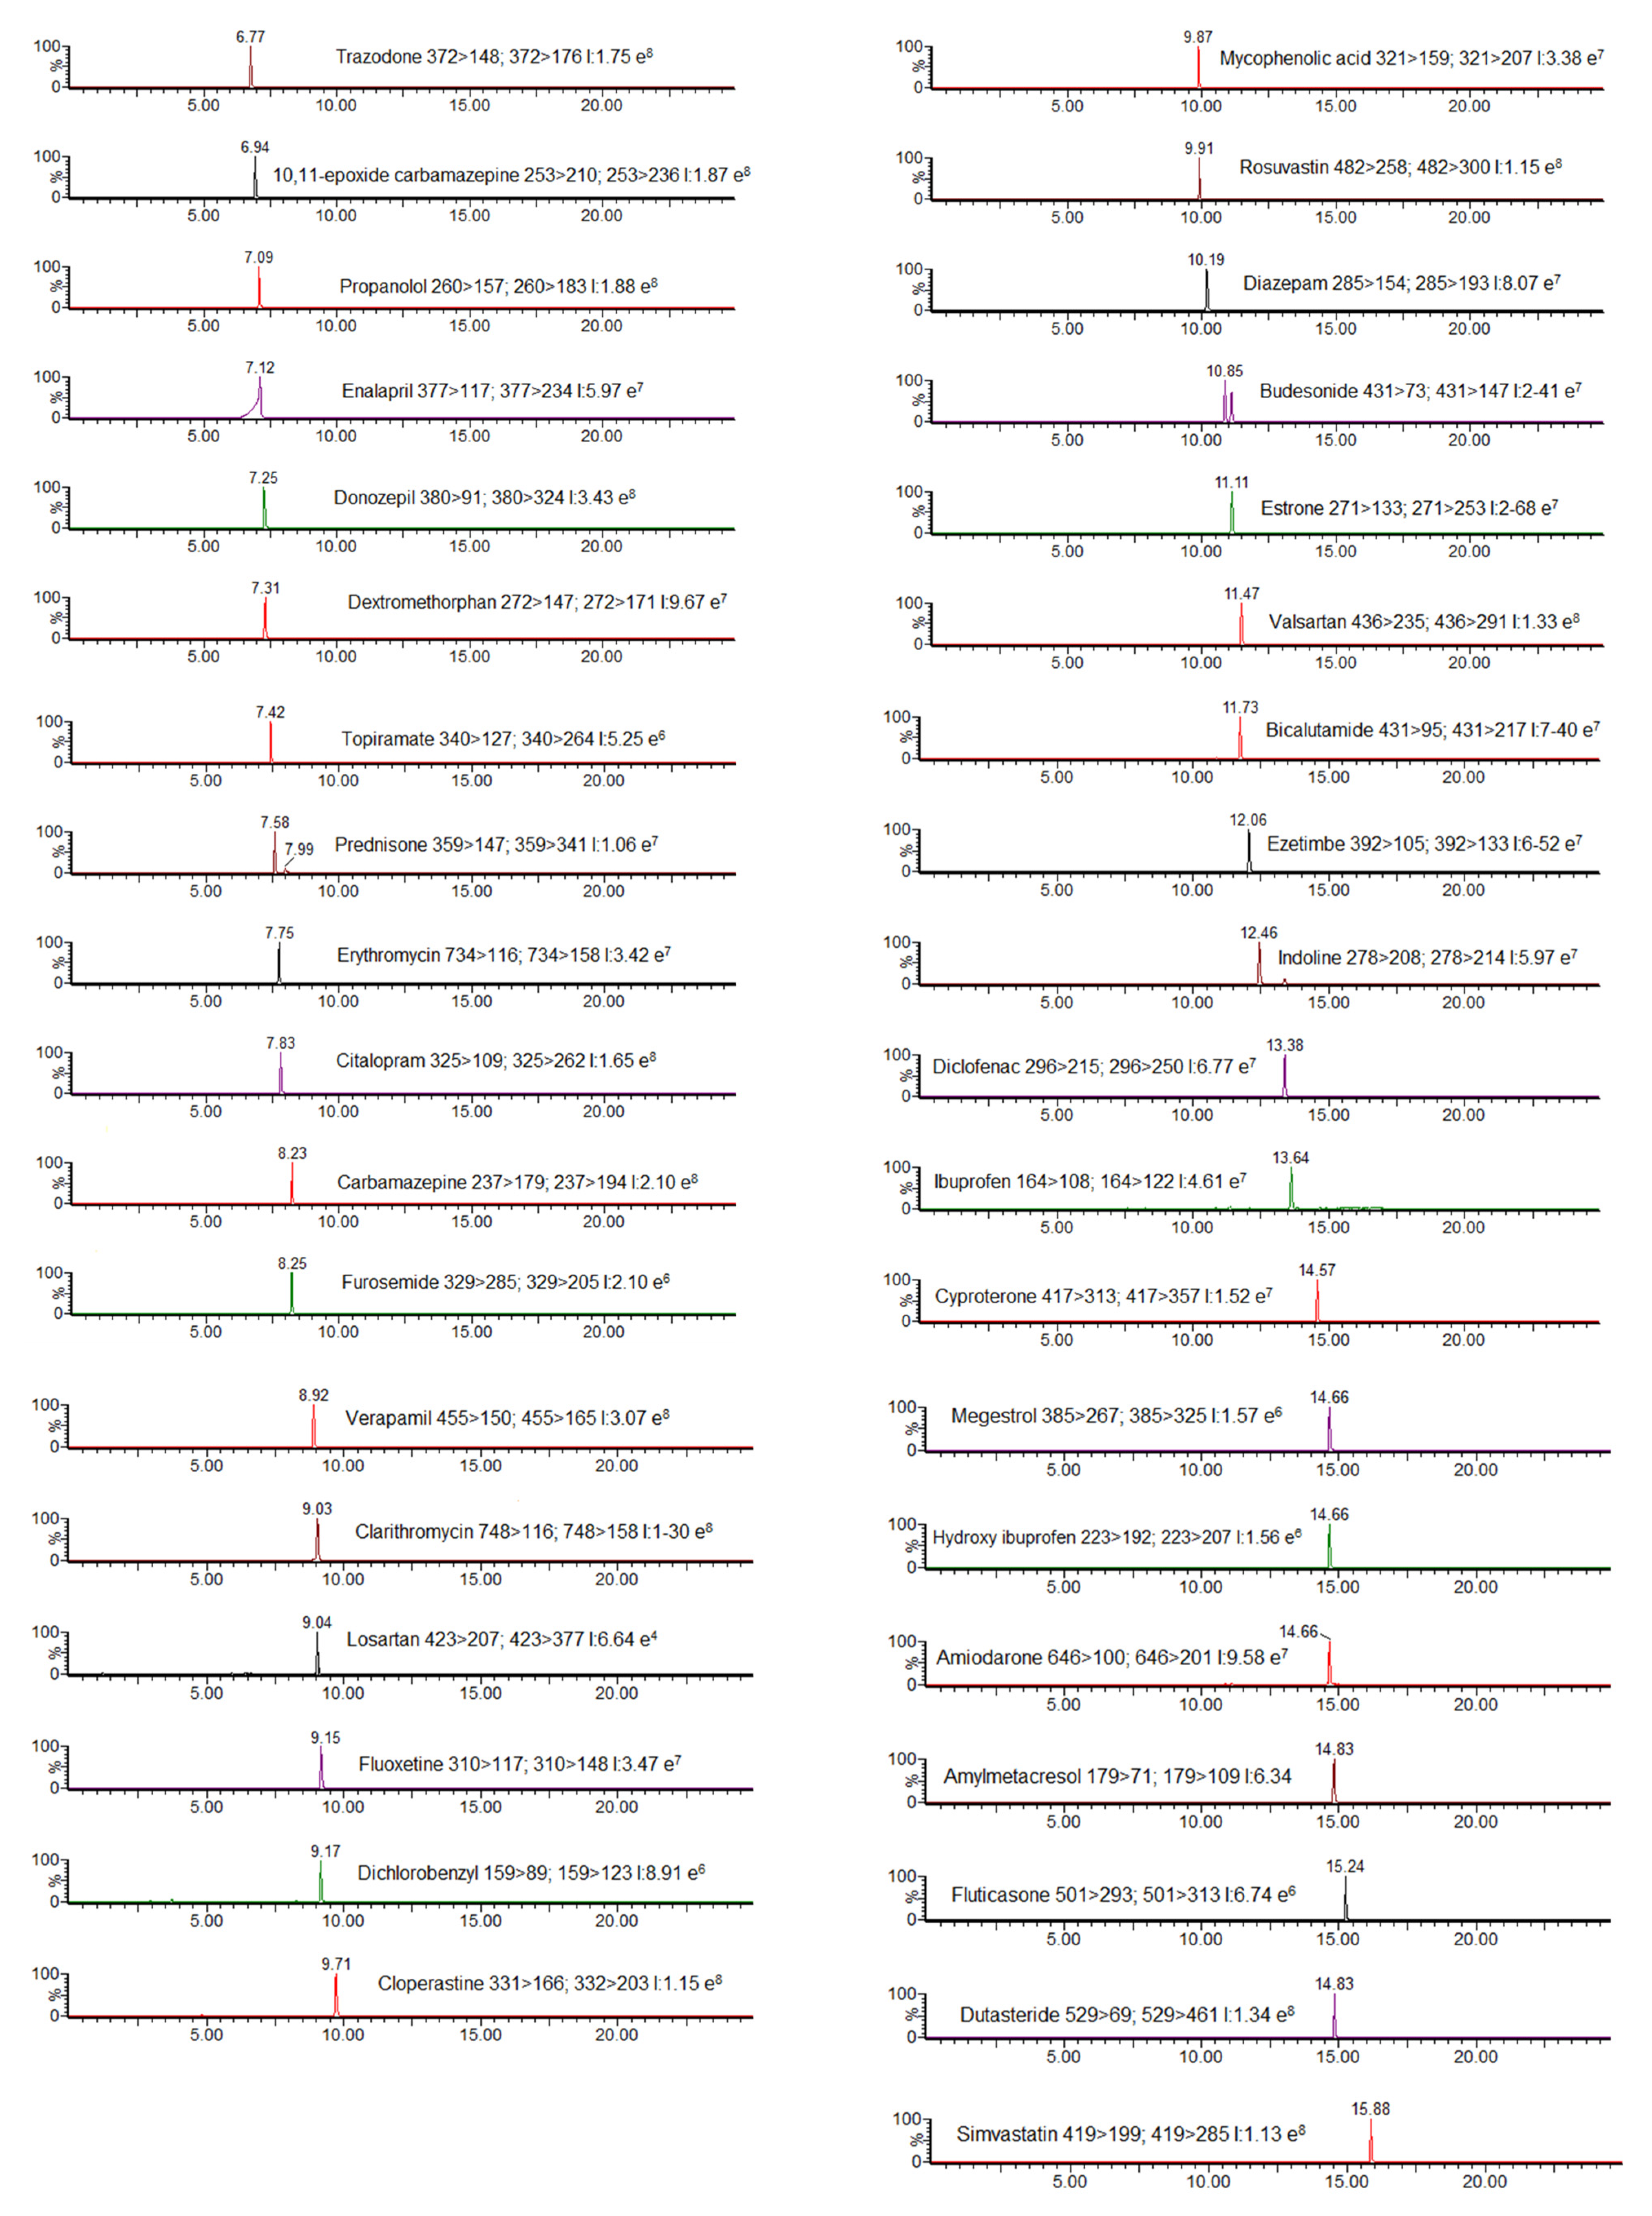
3.2. Optimization of the Chromatographic Conditions
3.3. Optimization of Extraction Procedure and Quality Parameters
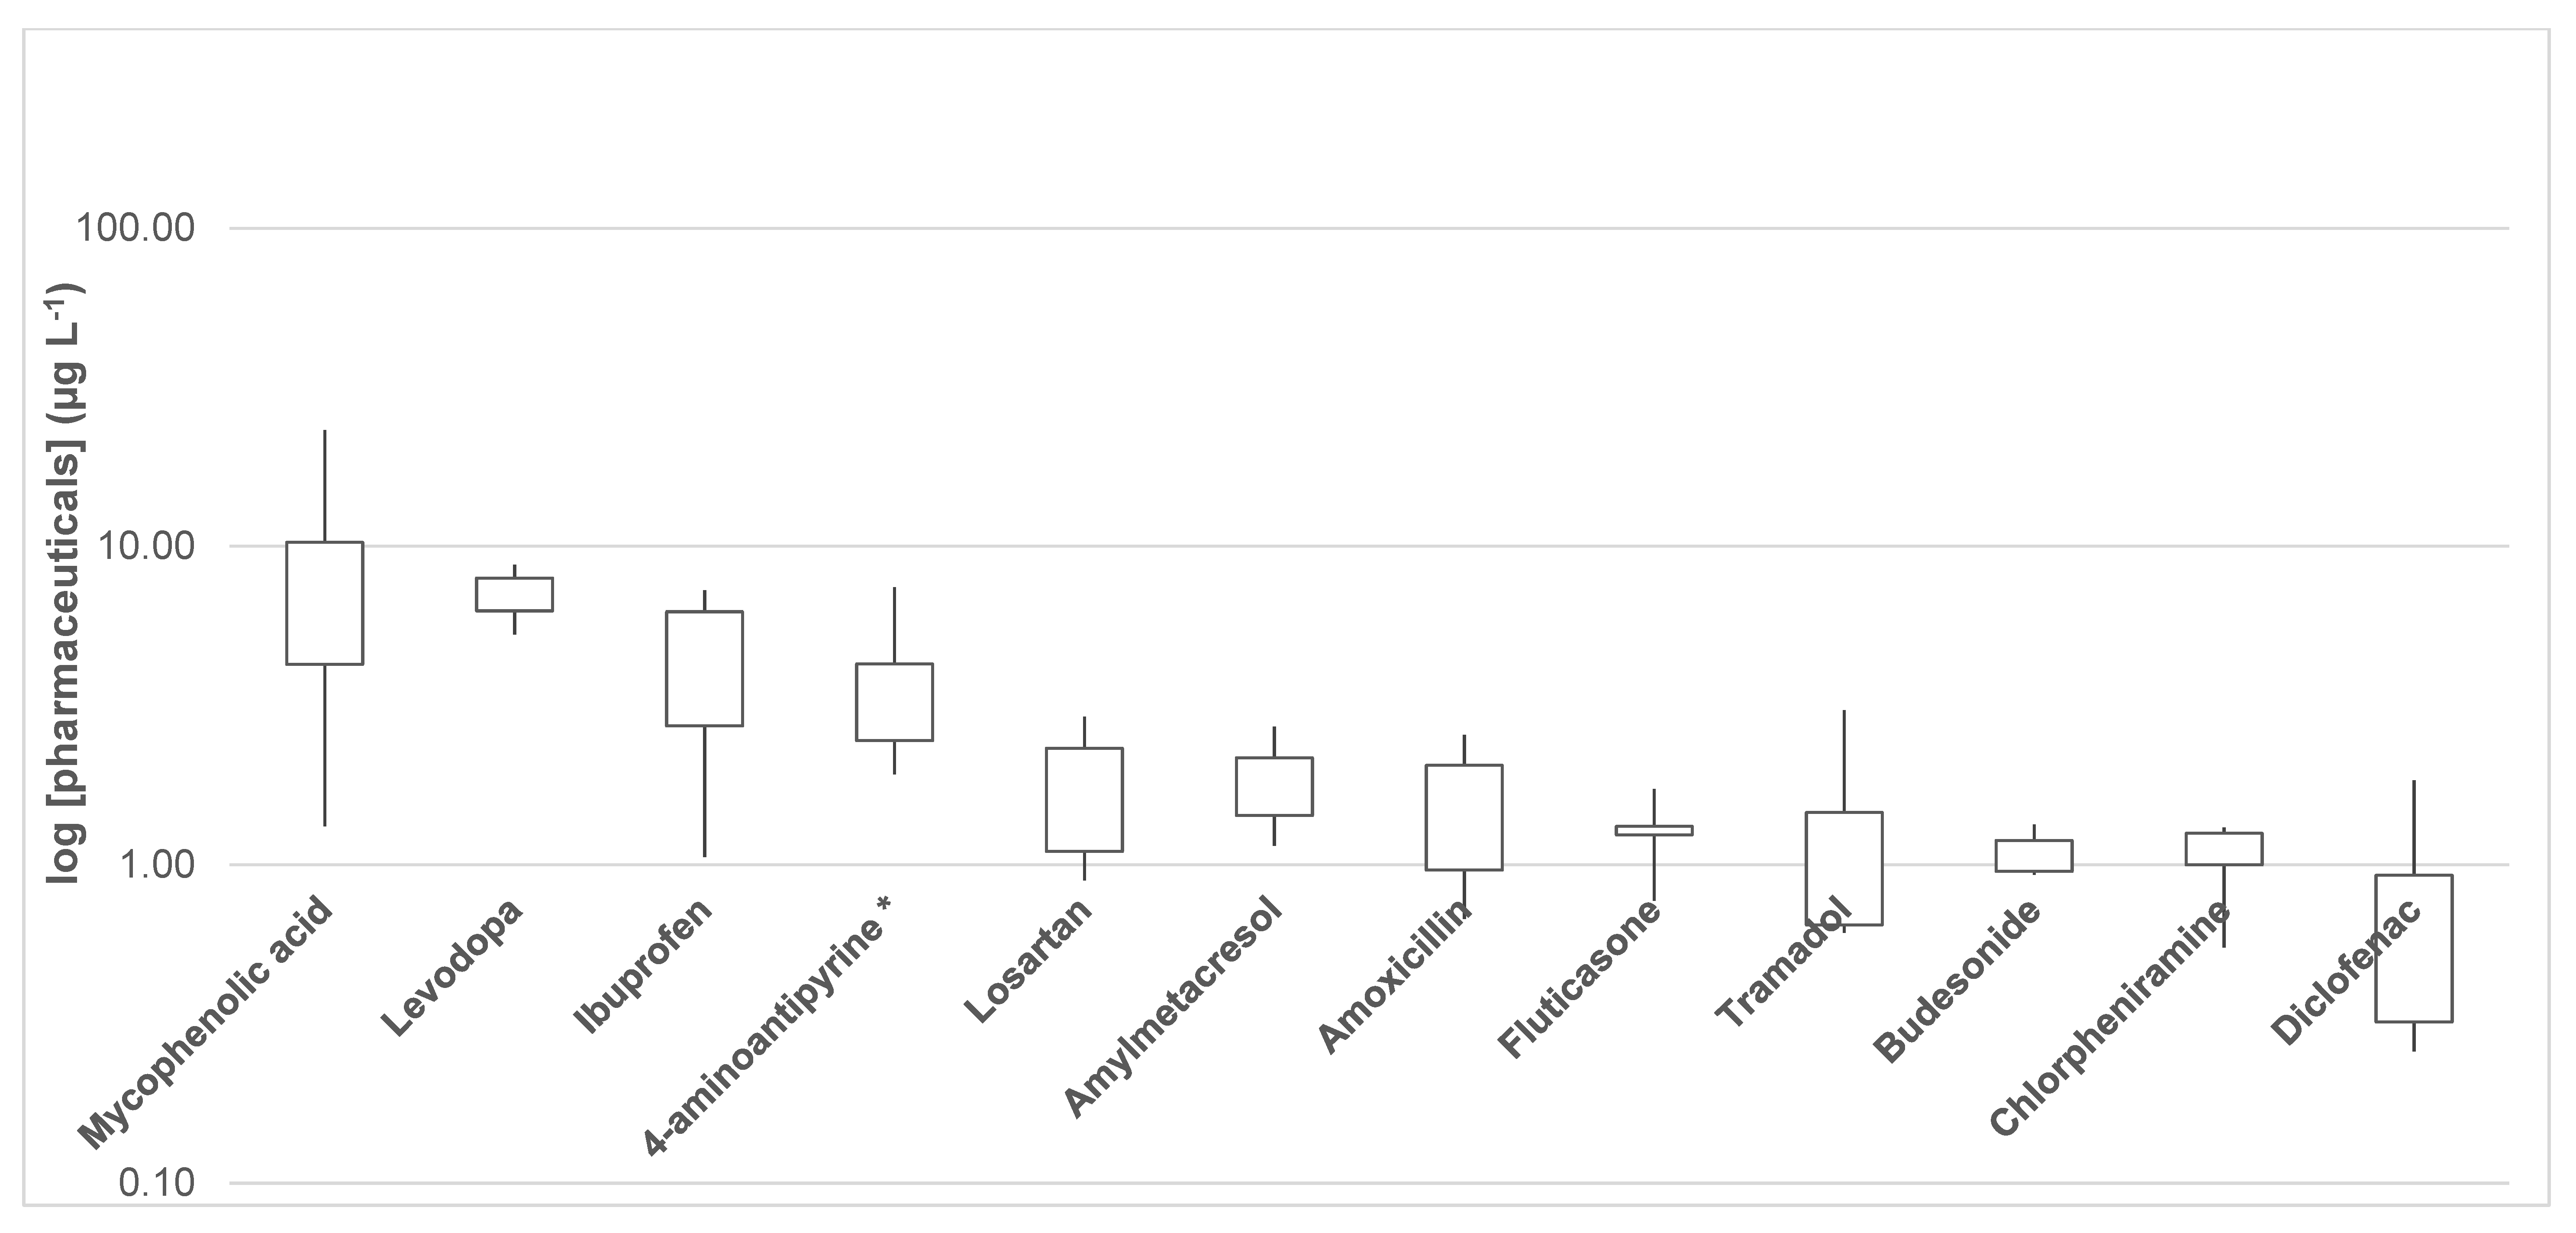
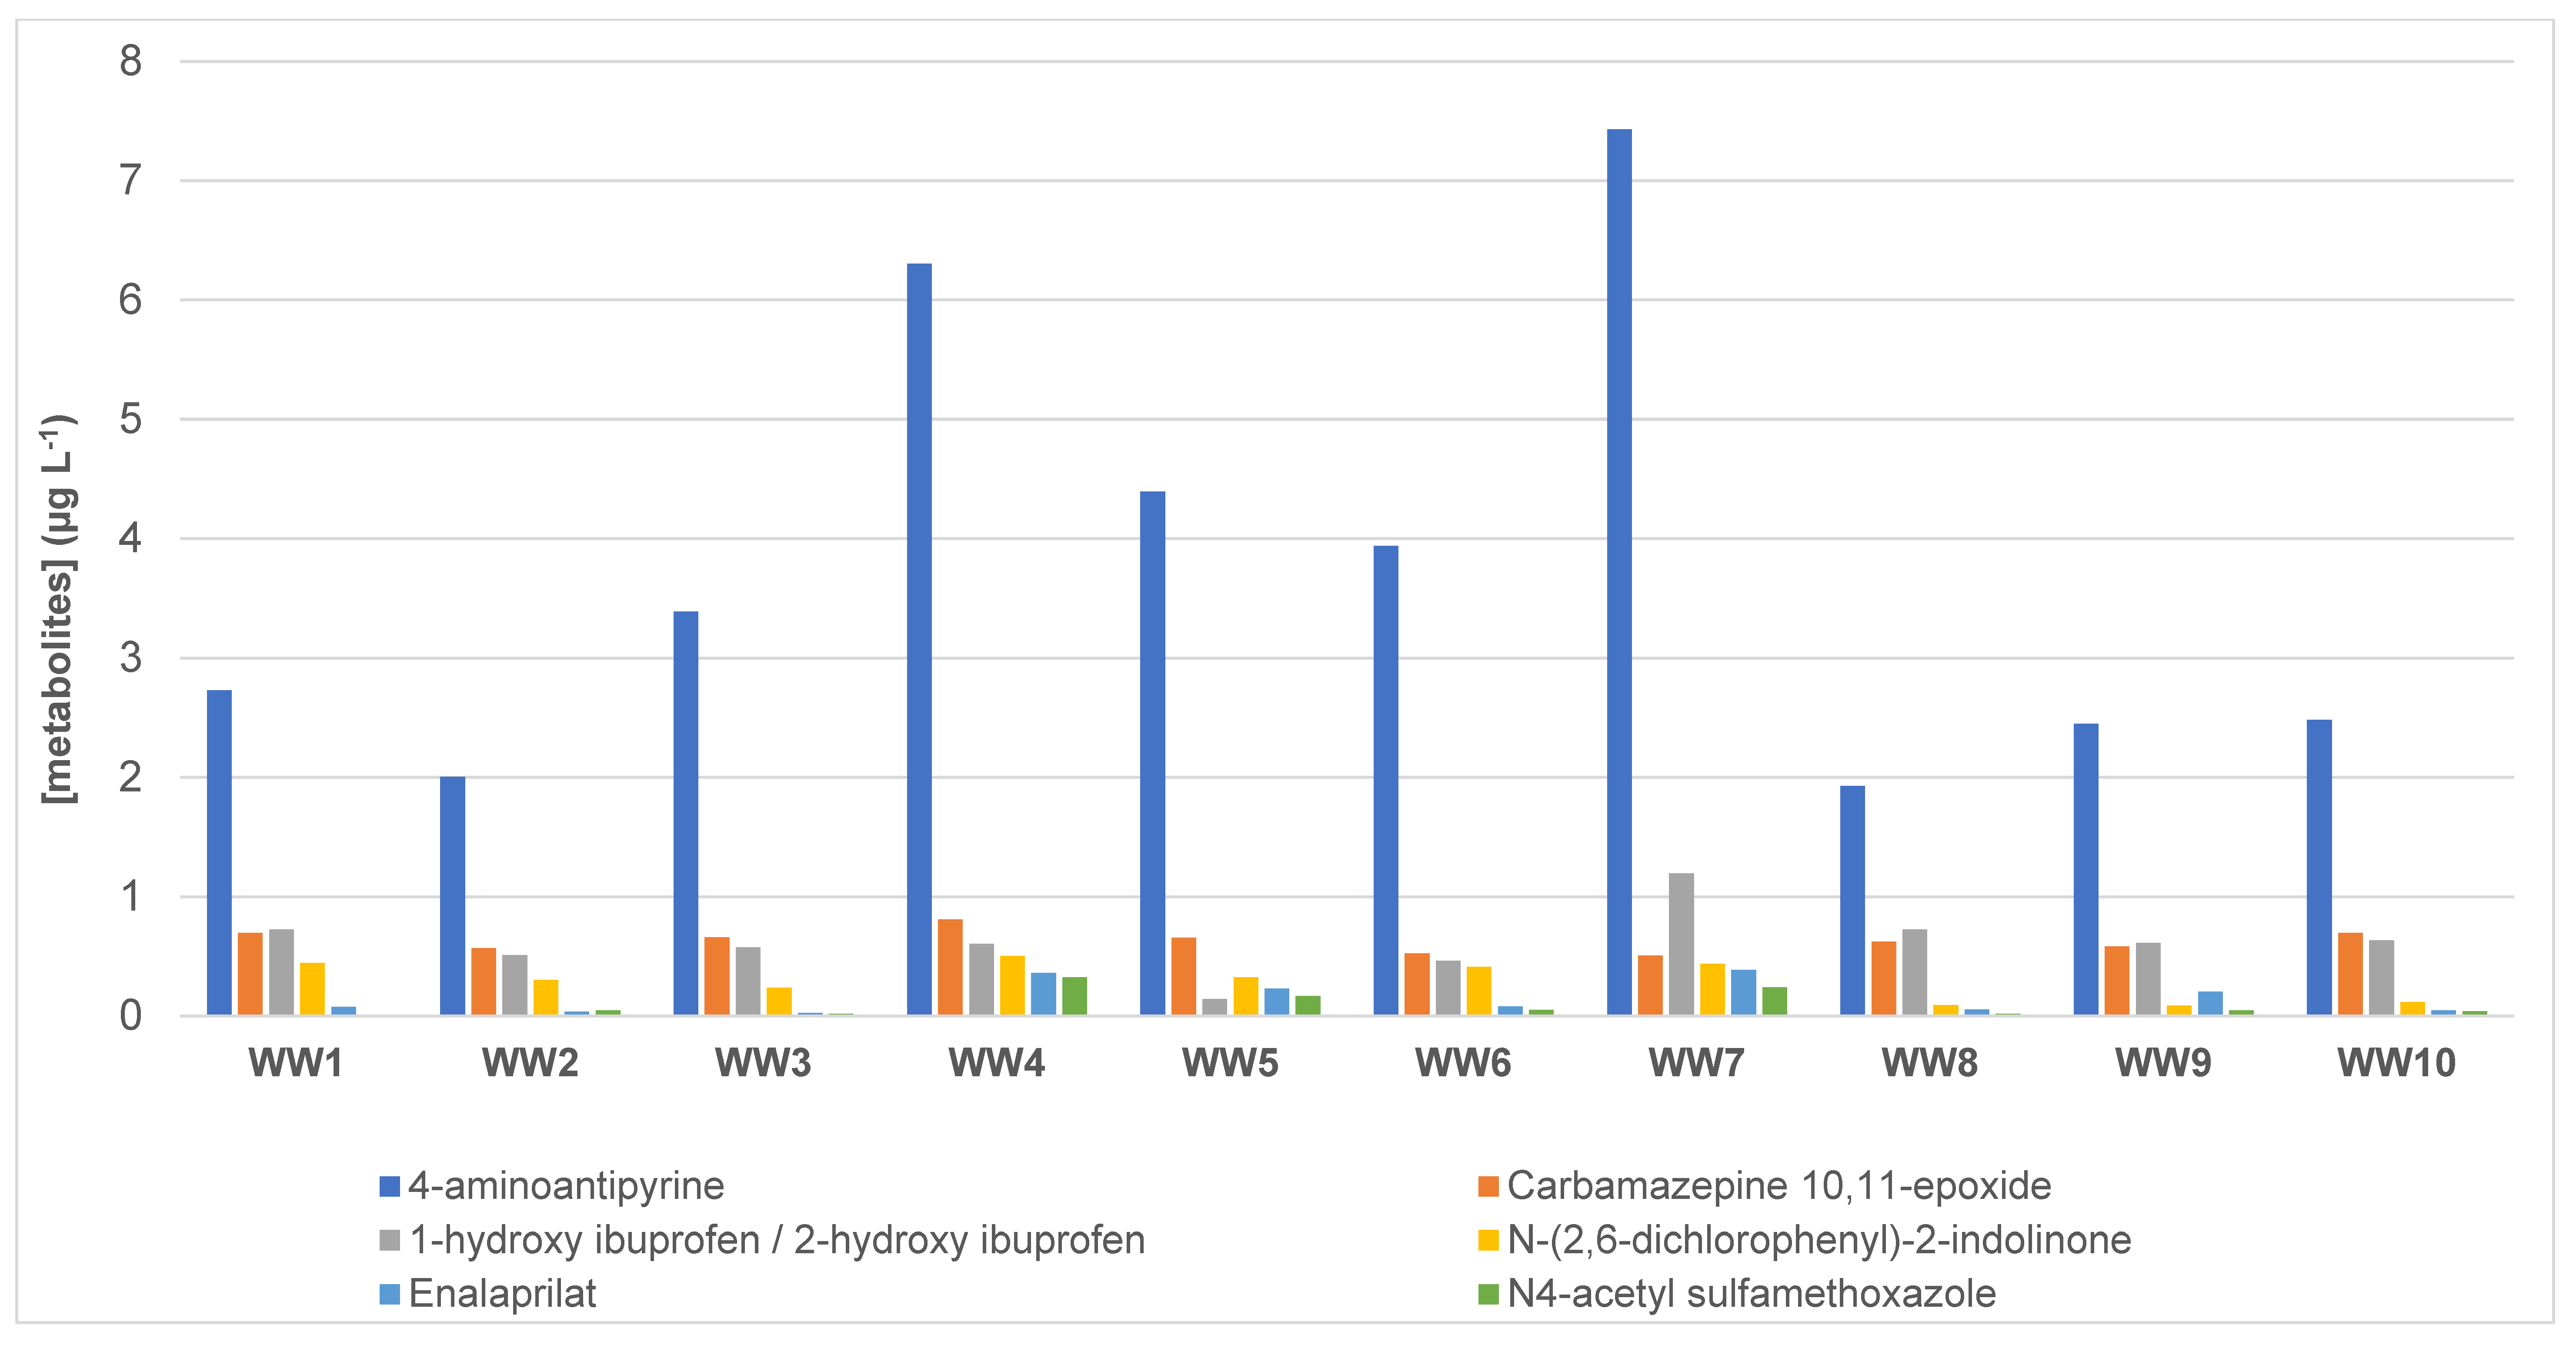
3.4. Presence of Pharmaceutical Residues and Metabolites in Wastewater Samples
4. Conclusions
Supplementary Materials
Author Contributions
Funding
Acknowledgments
Conflicts of Interest
References
- Daughton, C.G. Non-regulated water contaminants: Emerging research. Environ. Impact Assess. Rev. 2004, 24, 711–732. [Google Scholar] [CrossRef]
- Richardson, S.D.; Ternes, T.A. Water analysis: Emerging contaminants and current issues. Anal. Chem. 2011, 83, 4616–4648. [Google Scholar] [CrossRef]
- Gurke, R.; Rossmann, J.; Schubert, S.; Sandmann, T.; Rößler, M.; Oertel, R.; Fauler, J. Development of a SPE-HPLC-MS/MS method for the determination of most prescribed pharmaceuticals and related metabolites in urban sewage samples. J. Chromatogr. B 2015, 990, 23–30. [Google Scholar] [CrossRef] [PubMed]
- Babié, S.; Pavlovic, D.M.; Asperger, D.; Perisa, M.; Zrneié, M.; Horvat, A.J.M.; Kastelan-Macan, M. Determination of multi-class pharmaceuticals in wastewater by liquid chromatography–tandem mass spectrometry (LC-MS–MS). Anal. Bioanal. Chem. 2010, 1185–1194. [Google Scholar] [CrossRef]
- Paíga, P.; Santos, L.H.M.L.M.; Delerue-Matos, C. Development of a multi-residue method for the determination of human and veterinary pharmaceuticals and some of their metabolites in aqueous environmental matrices by SPE-UHPLC–MS/MS. J. Pharm. Biomed. Anal. 2017, 135, 75–86. [Google Scholar] [CrossRef] [Green Version]
- Nödler, K.; Licha, T.; Bester, K.; Sauter, M. Development of a multi-residue analytical method, based on liquid chromatography–tandem mass spectrometry, for the simultaneous determination of 46 micro-contaminants in aqueous samples. J. Chromatogr. A 2010, 1217, 6511–6521. [Google Scholar] [CrossRef] [PubMed]
- Balakrishnan, V.K.; Terry, K.A.; Toito, J. Determination of sulfonamide antibiotics in wastewater: A comparison of solid phase microextraction and solid phase extraction methods. J. Chromatogr. A 2006, 1131, 1–10. [Google Scholar] [CrossRef] [PubMed]
- Pedrouzo, M.; Borrull, F.; Marcé, R.M.; Pocurull, E. Simultaneous determination of macrolides, sulfonamides, and other pharmaceuticals in water samples by solid-phase extraction and LC-(ESI) MS. J. Sep. Sci. 2008, 31, 2182–2188. [Google Scholar] [CrossRef]
- Gracia-lor, E.; Sancho, J.V.; Hernández, F. Multi-class determination of around 50 pharmaceuticals, including 26 antibiotics, in environmental and wastewater samples by ultra-high performance liquid chromatography–tandem mass spectrometry. J. Chromatogr. A 2011, 1218, 2264–2275. [Google Scholar] [CrossRef]
- Gracia-Lor, E.; Ibáñez, M.; Zamora, T.; Sancho, J.V.; Hernández, F. Investigation of pharmaceutical metabolites in environmental waters by LC-MS/MS. Environ. Sci. Pollut. Res. 2014, 21, 5496–5510. [Google Scholar] [CrossRef] [Green Version]
- Miao, X.S.; Yang, J.J.; Metcalfe, C.D. Carbamazepine and its metabolites in wastewater and in biosolids in a municipal wastewater treatment plant. Environ. Sci. Technol. 2005, 39, 7469–7475. [Google Scholar] [CrossRef] [PubMed]
- Ferrando-Climent, L.; Collado, N.; Buttiglieri, G.; Gros, M.; Rodriguez-Roda, I.; Rodriguez-Mozaz, S.; Barceló, D. Comprehensive study of ibuprofen and its metabolites in activated sludge batch experiments and aquatic environment. Sci. Total Environ. 2012, 438, 404–413. [Google Scholar] [CrossRef] [PubMed]
- Kümmerer, K. The presence of pharmaceuticals in the environment due to human use-present knowledge and future challenges. J. Environ. Manag. 2009, 90, 2354–2366. [Google Scholar] [CrossRef] [PubMed]
- Rzymski, P.; Drewek, A.; Klimaszyk, P. Pharmaceutical pollution of aquatic environment: An emerging and enormous challenge. Limnol. Rev. 2017, 17, 97–107. [Google Scholar] [CrossRef] [Green Version]
- Zhang, Z.L.; Zhou, J.L. Simultaneous determination of various pharmaceutical compounds in water by solid-phase extraction-liquid chromatography-tandem mass spectrometry. J. Chromatogr. A 2007, 1154, 205–213. [Google Scholar] [CrossRef] [PubMed]
- Gómez-Canela, C.; Sala-Comorera, T.; Pueyo, V.; Barata, C.; Lacorte, S. Analysis of 44 pharmaceuticals consumed by elderly using liquid chromatography coupled to tandem mass spectrometry. J. Pharm. Biomed. Anal. 2019, 168, 55–63. [Google Scholar] [CrossRef] [PubMed]
- Santos, M.S.F.; Franquet-Griell, H.; Alves, A.; Lacorte, S. Development of an analytical methodology for the analysis of priority cytostatics in water. Sci. Total Environ. 2018, 645, 1264–1272. [Google Scholar] [CrossRef]
- Petrie, B.; Camacho-Muñoz, D. Analysis, Fate and Toxicity of Chiral Non-Steroidal Anti-Inflammatory Drugs in Wastewaters and the Environment: A Review; Springer: Berlin/Heidelberg, Germany, 2021; Volume 19, ISBN 0123456789. [Google Scholar]
- Caballo, C.; Sicilia, M.D.; Rubio, S. Enantioselective determination of representative profens in wastewater by a single-step sample treatment and chiral liquid chromatography-tandem mass spectrometry. Talanta 2014, 134, 325–332. [Google Scholar] [CrossRef] [PubMed]
- Wang, Z.; Zhao, P.; Zhu, B.; Jiang, Z.; Guo, X. Magnetic solid-phase extraction based on Fe3O4/graphene nanocomposites for enantioselective determination of representative profens in the environmental water samples and molecular docking study on adsorption mechanism of graphene. J. Pharm. Biomed. Anal. 2018, 156, 88–96. [Google Scholar] [CrossRef]
- Nguyen, P.Y.; Carvalho, G.; Reis, M.A.M.; Oehmen, A. A review of the biotransformations of priority pharmaceuticals in biological wastewater treatment processes. Water Res. 2021, 188, 116446. [Google Scholar] [CrossRef]
- Leclercq, M.; Mathieu, O.; Gomez, E.; Casellas, C.; Fenet, H.; Hillaire-Buys, D. Presence and fate of carbamazepine, oxcarbazepine, and seven of their metabolites at wastewater treatment plants. Arch. Environ. Contam. Toxicol. 2009, 56, 408–415. [Google Scholar] [CrossRef] [PubMed]
- Ameri, A.; Shakibaie, M.; Pournamdari, M.; Ameri, A.; Foroutanfar, A. Journal of Photochemistry & Photobiology A: Chemistry Degradation of diclofenac sodium using UV/biogenic selenium nanoparticles/H2O2: Optimization of process parameters. J. Photochem. Photobiol. A Chem. 2020, 392, 112382. [Google Scholar] [CrossRef]
- Kostich, M.S.; Batt, A.L.; Lazorchak, J.M. Concentrations of prioritized pharmaceuticals in effluents from 50 large wastewater treatment plants in the US and implications for risk estimation. Environ. Pollut. 2014, 184, 354–359. [Google Scholar] [CrossRef]
- Kostich, M.S.; Lazorchak, J.M. Risks to aquatic organisms posed by human pharmaceutical use. Sci. Total Environ. 2008, 389, 329–339. [Google Scholar] [CrossRef] [PubMed]


| Target Compound | Retention Time (Rt) | Precursor Ion [M + H]+ | C.V. (V) | q1 Transition | C.E. (eV) | q2 Transition | C.E. (eV) |
|---|---|---|---|---|---|---|---|
| Acetylsalicylic acid | 6.63 | 137 [M − H]− | 6 | 137 > 93 | 14 | 137 > 65 | 26 |
| Aspirin-d3 ^ | 6.63 | 137 [M − H]− | 10 | 137 > 93 | 16 | 137 > 65 | 26 |
| Salicylic acid * | 6,10 | 137 [M − H]− | 6 | 137 > 93 | 16 | 137 > 65 | 28 |
| Ranitidine | 3.18 | 315 | 18 | 315 > 176 | 18 | 315 > 130 | 24 |
| Omeprazole | 6.07 | 346 | 35 | 346 > 198 | 11 | 346 > 136 | 35 |
| Pantoprazole | 6.93 | 384 | 26 | 384 > 200 | 12 | 384 > 138 | 37 |
| Esomeprazole | 6.07 | 346 | 14 | 346 > 198 | 10 | 346 > 136 | 32 |
| Vildagliptin | 3.48 | 304 | 30 | 304 > 154 | 26 | 304 > 97 | 28 |
| Amiodarone | 14.90 | 646 | 30 | 646 > 201 | 40 | 646 > 100 | 30 |
| Hydrochlorothiazide | 4.15 | 296 [M − H]− | 40 | 296 > 205 | 23 | 296 > 269 | 17 |
| Furosemide | 8.51 | 329 [M − H]− | 43 | 329 > 285 | 13 | 329 > 205 | 20 |
| Pentoxifylline | 5.87 | 279 | 54 | 279 > 181 | 15 | 279 > 138 | 23 |
| Lidocaine | 4.81 | 235 | 27 | 235 > 86 | 23 | 235 > 58 | 36 |
| Lidocaine-d10 ^ | 4.81 | 245 | 24 | 245 > 96 | 10 | 245 > 64 | 38 |
| Propranolol | 7.28 | 260 | 40 | 260 > 183 | 15 | 260 > 157 | 17 |
| Propranolol-d7 ^ | 7.26 | 267 | 22 | 267 > 161 | 26 | 267 > 116 | 18 |
| Atenolol | 3.03 | 267 | 41 | 267 > 145 | 25 | 267 > 74 | 23 |
| Atenolol-d7 ^ | 3.01 | 274 | 34 | 274 > 145 | 26 | 274 > 74 | 22 |
| Verapamil | 9.08 | 455 | 31 | 455 > 165 | 30 | 455 > 150 | 40 |
| Enalapril | 4.79 | 377 | 45 | 377 > 234 | 19 | 377 > 117 | 40 |
| Enalaprilat * | 4.87 | 349 | 20 | 349 > 206 | 16 | 349 > 91 | 40 |
| Losartan | 9.27 | 423 | 31 | 423 > 377 | 9 | 423 > 207 | 20 |
| Valsartan | 11.80 | 436 | 20 | 436 > 291 | 16 | 436 > 235 | 18 |
| Simvastatin | 16.01 | 419 | 34 | 419 > 285 | 8 | 419 > 199 | 10 |
| Rosuvastatin | 10.18 | 482 | 32 | 482 > 300 | 34 | 482 > 258 | 30 |
| Ezetimibe | 12.39 | 392 | 12 | 392 > 133 | 22 | 392 > 105 | 40 |
| Estrone | 11.44 | 271 | 40 | 271 > 253 | 12 | 271 > 133 | 20 |
| Cyproterone | 14.80 | 417 | 28 | 417 > 357 | 15 | 417 > 313 | 22 |
| Dutasteride | 15.54 | 529 | 72 | 529 > 461 | 32 | 529 > 69 | 44 |
| Prednisone | 7.81 | 359 | 7 | 359 > 341 | 11 | 359 > 147 | 36 |
| Amoxicillin | 4.51 | 349 | 56 | 349 > 255 | 16 | 349 > 107 | 40 |
| Sulfapyridine | 4.05 | 250 | 40 | 250 > 156 | 13 | 250 > 95 | 21 |
| Sulfamethoxazole | 6.34 | 254 | 20 | 254 > 108 | 20 | 254 > 92 | 28 |
| N4-acetyl sulfamethoxazole * | 6.78 | 296 | 21 | 296 > 198 | 17 | 296 > 65 | 40 |
| Sulfadiazine | 3.56 | 251 | 30 | 251 > 156 | 13 | 251 > 96 | 20 |
| Erythromycin | 7.93 | 734 | 44 | 734 > 158 | 30 | 734 > 116 | 44 |
| Clarithromycin | 9.24 | 748 | 20 | 748 > 158 | 16 | 748 > 116 | 46 |
| Ciprofloxacin | 5.00 | 332 | 40 | 332 > 314 | 20 | 332 > 245 | 20 |
| Norfloxacin | 4.88 | 320 | 22 | 320 > 302 | 18 | 320 > 276 | 16 |
| Levofloxacin | 4.90 | 362 | 44 | 362 > 318 | 18 | 362 > 261 | 26 |
| Cyclophosphamide | 6.75 | 261 | 26 | 261 > 140 | 20 | 261 > 106 | 16 |
| Ifosfamide | 6.55 | 261 | 42 | 261 > 154 | 20 | 261 > 78 | 18 |
| Megestrol | 14.83 | 385 | 8 | 385 > 325 | 12 | 385 > 267 | 16 |
| Bicalutamide | 12.04 | 431 | 33 | 431 > 217 | 14 | 431 > 95 | 50 |
| Mycophenolic acid | 10.15 | 321 | 14 | 321 > 207 | 20 | 321 > 159 | 36 |
| Diclofenac | 13.71 | 296 | 26 | 296 > 250 | 12 | 296 > 215 | 20 |
| Diclofenac-13C6 ^ | 13.71 | 338 | 38 | 338 > 303 | 14 | 338 > 111 | 20 |
| N-(2,6-dichlorophenyl)-2-indolinone ** | 12.80 | 278 | 40 | 278 > 208 | 20 | 278 > 214 | 20 |
| Ibuprofen | 13.98 | 161 | 54 | 161 > 119 | 12 | 161 > 105 | 12 |
| Ibuprofen-d3^ | 13.98 | 164 | 40 | 164 > 122 | 12 | 164 > 108 | 10 |
| 1-hydroxy ibuprofen/2-hydroxy ibuprofen * | 14.89 | 223 | 96 | 223 > 207 | 11 | 223 > 193 | 11 |
| Tramadol | 5.82 | 264 | 9 | 264 > 246 | 10 | 264 > 58 | 17 |
| 4-aminoantipyrine * | 3.14 | 204 | 20 | 204 > 94 | 17 | 204 > 56 | 20 |
| Paracetamol | 2.98 | 152 | 32 | 152 > 110 | 20 | 152 > 93 | 20 |
| Acetaminophen-(methyl-d3) ^ | 2.98 | 155 | 30 | 155 > 110 | 38 | 155 > 93 | 20 |
| Carbamazepine | 8.47 | 237 | 30 | 237 > 194 | 20 | 237 > 179 | 36 |
| Carbamazepine-13C6 ^ | 8.47 | 243 | 40 | 243 > 200 | 16 | 243 > 185 | 34 |
| Carbamazepine 10,11-epoxide * | 7.16 | 253 | 29 | 253 > 236 | 9 | 253 > 210 | 10 |
| Topiramate | 7.64 | 340 | 18 | 340 > 264 | 6 | 340 > 127 | 20 |
| Gabapentin | 3.50 | 172 | 27 | 172 > 154 | 10 | 172 > 137 | 14 |
| Gabapentin-13C3 ^ | 3.50 | 175 | 30 | 175 > 157 | 12 | 175 > 140 | 12 |
| Levetiracetam | 3.27 | 171 | 25 | 171 > 154 | 5 | 171 > 126 | 13 |
| Pregabalin | 3.54 | 160 | 29 | 160 > 142 | 8 | 160 > 83 | 14 |
| Levodopa | 1.07 | 198 | 45 | 198 > 152 | 7 | 198 > 107 | 25 |
| Levodopa-d3 ^ | 1.07 | 201 | 24 | 201 > 184 | 6 | 201 > 155 | 10 |
| Rasagiline | 3.60 | 172 | 70 | 172 > 117 | 14 | 172 > 91 | 32 |
| Diazepam | 10.53 | 285 | 30 | 285 > 193 | 33 | 285 > 154 | 25 |
| Clomethiazole | 6.41 | 162 | 40 | 162 > 126 | 18 | 162 > 112 | 34 |
| Scopolamine | 4.07 | 304 | 27 | 304 > 156 | 15 | 304 > 138 | 21 |
| Fluoxetine | 9.38 | 310 | 27 | 310 > 148 | 7 | 310 > 44 | 13 |
| Citalopram | 7.98 | 325 | 10 | 325 > 262 | 16 | 325 > 109 | 22 |
| Escitalopram | 7.98 | 325 | 54 | 325 > 263 | 17 | 325 > 109 | 23 |
| Trazodone | 6.98 | 372 | 31 | 372 > 176 | 22 | 372 > 148 | 36 |
| Venlafaxine | 6.66 | 278 | 47 | 278 > 121 | 31 | 278 > 58 | 17 |
| Caffeine | 4.13 | 195 | 22 | 195 > 138 | 18 | 195 > 110 | 22 |
| Donepezil | 7.45 | 380 | 36 | 380 > 243 | 36 | 380 > 91 | 39 |
| Memantine | 6.69 | 180 | 30 | 180 > 163 | 11 | 180 > 107 | 21 |
| Dichlorobenzyl alcohol | 9.42 | 159 | 45 | 159 > 123 | 19 | 159 > 89 | 30 |
| Amylmetacresol | 15.40 | 179 | 32 | 179 > 109 | 8 | 179 > 71 | 8 |
| Budesonide | 11.28 | 431 | 29 | 431 > 147 | 30 | 431 > 73 | 30 |
| Fluticasone | 15.00 | 501 | 58 | 501 > 313 | 12 | 501 > 293 | 18 |
| Tiotropium bromide | 6.27 | 393 | 55 | 393 > 170 | 29 | 393 > 152 | 27 |
| Acetylcysteine | 1.70 | 164 | 24 | 164 > 122 | 6 | 164 > 76 | 16 |
| Dextromethorphan | 7.48 | 272 | 46 | 272 > 171 | 38 | 272 > 147 | 30 |
| Cloperastine | 9.50 | 332 | 42 | 332 > 203 | 18 | 332 > 166 | 45 |
| Chlorpheniramine | 6.02 | 275 | 6 | 275 > 230 | 18 | 275 > 167 | 43 |
| Compound | Linearity (ng µL−1) | R2 | IDL (pg) | Intra-Day Precision (%) | %R ± RSD (WW) | MDL (ng L−1) | LOQ (ng L−1) | Matrix Effect (%) |
|---|---|---|---|---|---|---|---|---|
| Acetylsalicylic acid/Salicylic acid * | 0.01–1 | 0.9921 | 0.73 | 3 | 60 ± 11 | 21 | 70 | 53 |
| Ranitidine | 0.01–1 | 0.9953 | 2.10 | 18 | 100 ± 11 | 5 | 16 | 63 |
| Omeprazole/Esomeprazole | 0.01–0.1 | 0.9938 | 0.91 | 1 | 61 ± 2 | 2 | 5 | 89 |
| Pantoprazole | 0.01–0.5 | 0.9975 | 0.13 | 5 | 87 ± 2 | 1 | 2 | 68 |
| Vildagliptin | 0.01–1 | 0.9989 | 0.23 | 11 | 93± 7 | 0.4 | 1 | 66 |
| Amiodarone | 0.01–1 | 0.9928 | 1.74 | 11 | 53± 5 | 1 | 2 | 29 |
| Hydrochlorothiazide | 0.01–1 | 0.9900 | 0.01 | 16 | 160 ± 6 | 4 | 13 | 92 |
| Furosemide | 0.01–1 | 0.9926 | 0.48 | 11 | 45 ± 22 | 8 | 28 | 60 |
| Pentoxifylline | 0.01–1 | 0.9914 | 0.56 | 4 | 94 ± 8 | 1 | 3 | 63 |
| Lidocaine | 0.01–1 | 0.9945 | 0.03 | 4 | 140 ± 9 | 1 | 2 | 94 |
| Propranolol | 0.01–1 | 0.9933 | 0.02 | 3 | 90 ± 10 | 5 | 18 | 65 |
| Atenolol | 0.01–1 | 0.9920 | 1.12 | 5 | 109 ± 12 | 4 | 14 | 115 |
| Verapamil | 0.01–1 | 0.9949 | 1.04 | 4 | 90 ± 7 | 2 | 5 | 59 |
| Enalapril | 0.01–1 | 0.9929 | 0.47 | 7 | 85 ± 5 | 1 | 5 | 81 |
| Enalaprilat * | 0.01–1 | 0.9952 | 2.12 | 8 | 86 ± 12 | 1 | 4 | 77 |
| Losartan | 0.01–1 | 0.9934 | 1.50 | 9 | 160 ± 20 | 4 | 12 | 108 |
| Valsartan | 0.01–1 | 0.9923 | 0.49 | 3 | 70 ± 6 | 2 | 8 | 177 |
| Simvastatin | 0.01–1 | 0.9982 | 0.26 | 9 | 78 ± 6 | 3 | 9 | 102 |
| Rosuvastatin | 0.01–1 | 0.9924 | 1.10 | 7 | 126 ± 5 | 6 | 21 | 96 |
| Ezetimibe | 0.01–1 | 0.9903 | 1.22 | 1 | 59 ± 15 | 9 | 30 | 43 |
| Estrone | 0.01–1 | 0.9952 | 1.73 | 3 | 74 ± 9 | 13 | 42 | 69 |
| Cyproterone | 0.01–1 | 0.9940 | 1.04 | 1 | 84± 6 | 2 | 8 | 66 |
| Dutasteride | 0.01–1 | 0.9955 | 0.19 | 3 | 41 ± 7 | 2 | 5 | 34 |
| Prednisone | 0.01–1 | 0.9929 | 0.44 | 1 | 77 ± 9 | 14 | 47 | 101 |
| Amoxicillin | 0.01–1 | 0.9945 | 2.81 | 13 | 102 ± 5 | 8 | 15 | 98 |
| Sulfapyridine | 0.01–1 | 0.9900 | 0.21 | 6 | 98± 6 | 0.5 | 2 | 68 |
| Sulfamethoxazole | 0.01–1 | 0.9957 | 1.54 | 7 | 84± 6 | 16 | 53 | 66 |
| N4-acetyl sulfamethoxazole * | 0.01–1 | 0.9985 | 1.44 | 4 | 82 ± 3 | 2 | 6 | 51 |
| Sulfadiazine | 0.01–1 | 0.9905 | 0.76 | 5 | 98 ± 5 | 2 | 8 | 62 |
| Erythromycin | 0.01–0.5 | 0.9996 | 0.44 | 1 | 67 ± 6 | 2 | 8 | 63 |
| Clarithromycin | 0.01–0.5 | 0.9998 | 2.12 | 1 | 74 ± 9 | 9 | 29 | 73 |
| Ciprofloxacin | 0.01–1 | 0.9966 | 1.59 | 12 | 79 ± 13 | 16 | 53 | 54 |
| Norfloxacin | 0.01–1 | 0.9927 | 1.60 | 13 | 65 ± 11 | 11 | 37 | 63 |
| Levofloxacin | 0.01–1 | 0.9910 | 0.40 | 10 | 80 ± 10 | 3 | 11 | 81 |
| Cyclophosphamide | 0.01–1 | 0.9916 | 0.96 | 4 | 69 ± 13 | 22 | 73 | 69 |
| Ifosfamide | 0.01–1 | 0.9935 | 1.16 | 1 | 106 ± 3 | 31 | 102 | 75 |
| Megestrol | 0.01–1 | 0.9926 | 0.38 | 4 | 66 ± 12 | 7 | 23 | 65 |
| Bicalutamide | 0.01–1 | 0.9939 | 1.42 | 5 | 78 ± 9 | 2 | 7 | 68 |
| Mycophenolic acid | 0.01–1 | 0.9905 | 2.19 | 1 | 81 ± 3 | 4 | 14 | 63 |
| Diclofenac | 0.01–1 | 0.9959 | 2.27 | 1 | 72 ± 12 | 1 | 3 | 154 |
| N-(2,6-dichlorophenyl)-2-indolinone ** | 0.01–1 | 0.9923 | 1.20 | 2 | 89 ± 9 | 2 | 6 | 70 |
| Ibuprofen | 0.01–1 | 0.9971 | 2.07 | 1 | 100 ± 8 | 14 | 47 | 120 |
| 1-hydroxy ibuprofen/2-hydroxy ibuprofen * | 0.01–1 | 0.9906 | 5.84 | 12 | 86 ± 10 | 19 | 65 | 57 |
| Tramadol | 0.01–1 | 0.9925 | 0.04 | 8 | 176 ± 7 | 1 | 2 | 117 |
| 4-aminoantipyrine * | 0.01–1 | 0.9813 | 0.59 | 5 | 26 ± 11 | 23 | 78 | 115 |
| Paracetamol | 0.01–1 | 0.9958 | 1.09 | 1 | 52 ± 10 | 22 | 74 | 31 |
| Carbamazepine | 0.01–1 | 0.9914 | 0.67 | 4 | 117 ± 12 | 2 | 8 | 84 |
| Carbamazepine 10,11-epoxide * | 0.01–1 | 0.9900 | 0.24 | 1 | 109 ± 6 | 0.4 | 1 | 73 |
| Topiramate | 0.01–1 | 0.9949 | 0.47 | 3 | 93 ± 4 | 15 | 50 | 75 |
| Gabapentin | 0.01–1 | 0.9921 | 0.04 | 3 | 86 ± 14 | 2 | 5 | 30 |
| Levetiracetam | 0.01–1 | 0.9953 | 0.76 | 2 | 92 ± 7 | 0.4 | 1 | 68 |
| Pregabalin | 0.01–1 | 0.9913 | 0.24 | 7 | 51 ± 6 | 3 | 9 | 95 |
| Levodopa | 0.01–1 | 0.9975 | 1.61 | 7 | 101 ± 11 | 7 | 18 | 99 |
| Rasagiline | 0.01–1 | 0.9993 | 1.06 | 9 | 32 ± 5 | 26 | 87 | 84 |
| Diazepam | 0.01–1 | 0.9945 | 1.44 | 1 | 81 ± 6 | 12 | 41 | 86 |
| Clomethiazole | 0.01–1 | 0.9942 | 0.98 | 1 | 63 ± 14 | 26 | 87 | 38 |
| Scopolamine | 0.01–1 | 0.9920 | 1.55 | 1 | 70 ± 9 | 26 | 85 | 69 |
| Fluoxetine | 0.01–1 | 0.9959 | 1.49 | 5 | 68 ± 12 | 14 | 48 | 63 |
| Citalopram/Escitalopram | 0.01–1 | 0.9987 | 0.20 | 1 | 102 ± 15 | 4 | 12 | 61 |
| Trazodone | 0.01–1 | 0.9969 | 0.06 | 4 | 97 ± 6 | 4 | 15 | 60 |
| Venlafaxine | 0.01–1 | 0.9997 | 0.44 | 9 | 52 ± 10 | 10 | 15 | 79 |
| Caffeine | 0.01–1 | 0.9913 | 1.10 | 12 | 52 ± 5 | 8 | 18 | 77 |
| Donepezil | 0.01–0.5 | 0.9967 | 0.15 | 2 | 74 ± 8 | 21 | 69 | 67 |
| Memantine | 0.01–1 | 0.9951 | 0.96 | 1 | 104 ± 9 | 30 | 101 | 67 |
| Dichlorobenzyl alcohol | 0.01–1 | 0.9932 | 3.57 | 1 | 75 ± 5 | 40 | 135 | 89 |
| Amylmetacresol | 0.01–1 | 0.9936 | 5.87 | 4 | 62 ± 6 | 18 | 59 | 93. |
| Budesonide | 0.01–1 | 0.9960 | 1.62 | 14 | 86 ± 3 | 7 | 25 | 76 |
| Fluticasone | 0.01–1 | 0.9904 | 0.95 | 7 | 58 ± 6 | 17 | 57 | 38 |
| Tiotropium bromide | 0.01–1 | 0.9906 | 0.75 | 2 | 70 ± 20 | 30 | 130 | 36 |
| Dextromethorphan | 0.01–1 | 0.9958 | 0.34 | 6 | 98 ± 8 | 3 | 8 | 71 |
| Cloperastine | 0.01–1 | 0.9950 | 0.14 | 6 | 85 ± 8 | 3 | 11 | 59 |
| Chlorpheniramine | 0.01–0.5 | 0.9958 | 0.88 | 15 | 100 ± 2 | 20 | 68 | 65 |
| WW1 | WW2 | WW3 | WW4 | WW5 | WW6 | WW7 | WW8 | WW9 | WW10 | Mean | |
|---|---|---|---|---|---|---|---|---|---|---|---|
| Acetylsalicylic acid/Salicylic acid * | <LOQ | <LOQ | <LOQ | <LOQ | <LOQ | <LOQ | <LOQ | <LOQ | <LOQ | <LOQ | <LOQ |
| Ranitidine | 0.045 | 0.048 | 0.048 | 0.097 | 0.081 | 0.036 | 0.098 | 0.026 | <LOQ | 0.026 | 0.056 |
| Omeprazole/Esomeprazole | 0.013 | 0.010 | 0.010 | 0.011 | 0.010 | 0.011 | 0.008 | 0.012 | 0.010 | 0.011 | 0.011 |
| Pantoprazole | 0.0038 | 0.0098 | 0.0065 | 0.0197 | 0.0024 | 0.0057 | 0.0047 | 0.0038 | 0.0024 | 0.0075 | 0.0066 |
| Vildagliptin | 0.173 | 0.170 | 0.243 | 0.314 | 0.253 | 0.261 | 0.260 | 0.240 | 0.212 | 0.206 | 0.233 |
| Amiodarone | 0.032 | 0.025 | 0.022 | 0.115 | 0.056 | 0.016 | 0.033 | <LOQ | <LOQ | <LOQ | 0.043 |
| Hydrochlorothiazide | <LOQ | <LOQ | <LOQ | <LOQ | <LOQ | <LOQ | <LOQ | <LOQ | <LOQ | <LOQ | <LOQ |
| Furosemide | <LOQ | <LOQ | <LOQ | <LOQ | <LOQ | <LOQ | <LOQ | <LOQ | <LOQ | <LOQ | <LOQ |
| Pentoxifylline | <LOQ | <LOQ | 0.038 | 0.083 | 0.099 | 0.179 | 0.168 | 0.058 | 0.082 | 0.073 | 0.098 |
| Lidocaine | 0.122 | 0.114 | 0.131 | 0.153 | 0.203 | 0.206 | 0.262 | 0.196 | 0.195 | 0.245 | 0.183 |
| Propranolol | <LOQ | <LOQ | 0.038 | 0.083 | 0.099 | 0.179 | 0.168 | 0.058 | 0.082 | 0.073 | 0.098 |
| Atenolol | 0.456 | 0.153 | 0.209 | 0.146 | 0.899 | 0.650 | 1.51 | 0.946 | 1.39 | 0.304 | 0.666 |
| Verapamil | 0.017 | 0.048 | 0.029 | 0.278 | 0.145 | 0.041 | 0.113 | 0.046 | 0.054 | 0.049 | 0.082 |
| Enalapril | 0.300 | 0.150 | 0.140 | 0.190 | 0.250 | 0.210 | 0.070 | 0.040 | 0.230 | 0.250 | 0.183 |
| Enalaprilat * | 0.076 | 0.036 | 0.026 | 0.361 | 0.230 | 0.079 | 0.385 | 0.053 | 0.205 | 0.047 | 0.150 |
| Losartan | 2.19 | 0.894 | 1.67 | 1.12 | 1.04 | 2.37 | 2.85 | 2.09 | 2.93 | 1.09 | 1.825 |
| Valsartan | 0.918 | 0.377 | 0.861 | 1.216 | 0.632 | 0.178 | 2.483 | 1.520 | 1.577 | 0.856 | 1.062 |
| Simvastatin | 0.011 | 0.023 | 0.011 | 0.005 | 0.033 | 0.005 | 0.004 | 0.006 | 0.007 | 0.053 | 0.016 |
| Rosuvastatin | 0.061 | 0.076 | 0.082 | 0.219 | 0.144 | 0.085 | 0.331 | 0.053 | 0.052 | 0.029 | 0.113 |
| Ezetimibe | 0.015 | 0.041 | 0.010 | 0.266 | 0.110 | 0.029 | 0.061 | <LOQ | <LOQ | <LOQ | 0.076 |
| Estrone | 0.027 | 0.028 | 0.033 | 0.168 | 0.093 | 0.029 | 0.231 | 0.012 | 0.020 | 0.014 | 0.066 |
| Cyproterone | <LOQ | <LOQ | <LOQ | <LOQ | <LOQ | <LOQ | <LOQ | <LOQ | <LOQ | <LOQ | <LOQ |
| Dutasteride | <LOQ | 0.006 | 0.005 | 0.017 | 0.022 | 0.015 | 0.127 | 0.014 | 0.017 | 0.024 | 0.027 |
| Prednisone | 0.038 | 0.022 | 0.018 | 0.353 | 0.217 | 0.097 | 0.351 | 0.077 | 0.137 | 0.103 | 0.141 |
| Amoxicillin | 0.844 | 2.51 | 1.14 | 1.67 | 1.08 | 2.56 | 1.82 | 2.13 | 0.676 | 0.925 | 1.535 |
| Sulfapyridine | 0.170 | 0.055 | 0.071 | 0.094 | 0.122 | 0.164 | 0.220 | 0.080 | 0.077 | 0.124 | 0.118 |
| Sulfamethoxazole | 0.223 | 0.198 | 0.366 | 0.266 | 0.187 | 0.210 | 0.255 | 0.265 | 0.492 | 0.268 | 0.273 |
| N4-acetyl sulfamethoxazole * | <LOQ | 0.045 | 0.019 | 0.324 | 0.167 | 0.050 | 0.241 | 0.017 | 0.045 | 0.041 | 0.105 |
| Sulfadiazine | 0.014 | 0.017 | 0.010 | 0.026 | 0.067 | 0.034 | 0.066 | 0.016 | 0.063 | 0.044 | 0.036 |
| Erythromycin | 0.070 | 0.060 | 0.045 | 0.026 | 0.074 | 0.024 | 0.020 | 0.042 | 0.036 | 0.045 | 0.044 |
| Clarithromycin | 0.149 | 0.115 | 0.157 | 0.039 | 0.200 | 0.066 | 0.190 | 0.091 | 0.065 | 0.031 | 0.110 |
| Ciprofloxacin | 0.134 | 0.096 | 0.030 | 0.107 | 0.111 | 0.124 | 0.074 | 0.144 | 0.114 | 0.082 | 0.102 |
| Norfloxacin | <LOQ | 0.324 | 0.213 | 0.102 | 0.171 | 0.196 | 0.054 | 0.304 | <LOQ | 0.098 | 0.183 |
| Levofloxacin | 0.236 | 0.144 | 0.222 | 0.273 | 0.139 | 0.064 | 0.084 | 0.107 | 0.139 | 0.132 | 0.154 |
| Cyclophosphamide | <LOQ | 0.267 | <LOQ | 0.648 | 0.135 | 0.128 | <LOQ | 0.235 | 0.082 | 0.275 | 0.253 |
| Ifosfamide | 0.029 | 0.045 | 0.021 | 0.251 | 0.219 | 0.080 | 0.364 | 0.047 | 0.030 | 0.025 | 0.111 |
| Megestrol | 0.028 | 0.042 | <LOQ | 0.319 | 0.232 | 0.132 | 0.262 | 0.039 | 0.056 | 0.051 | 0.129 |
| Bicalutamide | 0.051 | 0.066 | 0.037 | 0.432 | 0.156 | 0.095 | 0.193 | 0.031 | 0.035 | 0.038 | 0.113 |
| Mycophenolic acid | 4.95 | 1.32 | 4.23 | 9.99 | 10.40 | 6.32 | 23.24 | 4.37 | 15.26 | 3.39 | 8.35 |
| Diclofenac | 0.528 | 1.84 | 0.849 | 0.310 | 0.259 | 0.321 | 0.321 | 1.02 | 0.686 | 0.953 | 0.709 |
| N-(2.6-dichlorophenyl)-2-indolinone ** | 0.444 | 0.302 | 0.236 | 0.502 | 0.322 | 0.412 | 0.438 | 0.090 | 0.086 | 0.117 | 0.295 |
| Ibuprofen | 5.23 | 6.14 | 6.65 | 7.28 | 6.27 | 4.34 | 5.06 | 1.06 | 2.20 | 1.35 | 4.56 |
| 1-hydroxy ibuprofen/2-hydroxy ibuprofen * | 0.726 | 0.509 | 0.575 | 0.606 | 0.141 | 0.462 | 1.20 | 0.724 | 0.611 | 0.633 | 0.618 |
| Tramadol | 0.693 | 0.624 | 1.41 | 1.48 | 0.612 | 0.633 | 1.16 | 3.06 | 1.19 | 1.52 | 1.24 |
| 4-aminoantipyrine * | 2.73 | 2.01 | 3.39 | 6.30 | 4.40 | 3.94 | 7.43 | 1.93 | 2.45 | 2.48 | 3.70 |
| Paracetamol | 0.140 | 0.060 | 0.130 | 0.200 | 0.330 | 0.150 | 0.230 | 0.160 | 0.200 | 0.090 | 0.169 |
| Carbamazepine | 0.135 | 0.190 | 0.322 | 0.348 | 0.241 | 0.421 | 0.743 | 0.308 | 0.195 | 0.223 | 0.313 |
| Carbamazepine 10.11-epoxide * | 0.695 | 0.569 | 0.658 | 0.810 | 0.655 | 0.523 | 0.506 | 0.623 | 0.583 | 0.695 | 0.632 |
| Topiramate | 0.135 | 0.190 | 0.322 | 0.348 | 0.241 | 0.421 | 0.743 | 0.308 | 0.195 | 0.223 | 0.313 |
| Gabapentin | 0.698 | 0.496 | 0.808 | 0.601 | 0.765 | 0.516 | 1.326 | 0.485 | 1.12 | 0.782 | 0.760 |
| Levetiracetam | 0.052 | 0.051 | 0.049 | 0.324 | 0.106 | 0.052 | 0.456 | 0.047 | 0.129 | 0.062 | 0.133 |
| Pregabalin | 0.178 | 0.102 | 0.238 | 0.262 | 0.275 | 0.227 | 0.331 | 0.202 | 0.323 | 0.275 | 0.241 |
| Levodopa | 7.95 | 6.10 | 8.76 | 7.48 | 5.30 | 6.77 | <LOQ | 8.50 | 6.96 | 6.29 | 7.12 |
| Rasagiline | <LOQ | <LOQ | <LOQ | <LOQ | <LOQ | <LOQ | <LOQ | <LOQ | <LOQ | <LOQ | <LOQ |
| Diazepam | 0.309 | 0.112 | 0.058 | 0.190 | 0.014 | 0.024 | 0.059 | 0.018 | 0.023 | 0.049 | 0.086 |
| Clomethiazole | 0.006 | 0.006 | <LOQ | <LOQ | <LOQ | <LOQ | <LOQ | 0.009 | 0.012 | 0.010 | 0.009 |
| Scopolamine | 0.143 | 0.024 | 0.012 | 0.092 | 0.086 | 0.024 | 0.223 | 0.024 | 0.036 | 0.020 | 0.068 |
| Fluoxetine | 0.026 | 0.078 | 0.043 | 0.199 | 0.163 | 0.073 | 0.090 | 0.099 | 0.098 | 0.059 | 0.093 |
| Citalopram/Escitalopram | <LOQ | 0.218 | 0.309 | 0.034 | 0.217 | 0.298 | 0.039 | <LOQ | 0.155 | 0.286 | 0.195 |
| Trazodone | 0.096 | 0.035 | 0.102 | 0.146 | 0.088 | 0.067 | 0.163 | 0.115 | 0.099 | 0.104 | 0.102 |
| Venlafaxine | 0.559 | 0.581 | 0.597 | 0.820 | 0.648 | 0.277 | 0.646 | 0.104 | 0.550 | 0.797 | 0.558 |
| Caffeine | 0.450 | 0.089 | 0.201 | 0.643 | 0.882 | 0.388 | 1.158 | 0.476 | 0.994 | 0.445 | 0.573 |
| Donepezil | 0.009 | 0.017 | 0.008 | 0.205 | 0.069 | 0.041 | 0.154 | 0.016 | 0.019 | 0.017 | 0.056 |
| Memantine | 0.056 | 0.028 | 0.055 | 0.089 | 0.133 | 0.052 | 0.134 | 0.053 | 0.088 | 0.039 | 0.073 |
| Dichlorobenzyl alcohol | 0.709 | 0.622 | 0.812 | 0.669 | 0.745 | 0.790 | 0.861 | 0.540 | 0.534 | 0.540 | 0.682 |
| Amylmetacresol | 2.72 | 2.28 | 1.93 | 1.35 | 1.26 | 1.66 | 2.25 | 1.78 | 1.75 | 1.15 | 1.81 |
| Budesonide | 0.930 | 0.946 | 0.947 | 1.16 | 1.04 | 0.971 | 1.10 | 1.34 | 1.21 | 1.22 | 1.08 |
| Fluticasone | 1.24 | 1.30 | <LOQ | 1.73 | 1.55 | 1.30 | 1.32 | 1.26 | 0.77 | 1.24 | 1.30 |
| Tiotropium bromide | 0.551 | 0.533 | 0.533 | 0.718 | 0.531 | 0.527 | 0.572 | 0.535 | 0.551 | 0.530 | 0.558 |
| Dextromethorphan | 0.731 | 0.730 | 0.728 | 0.780 | 0.858 | 0.788 | 0.978 | 0.766 | 0.793 | 0.803 | 0.796 |
| Cloperastine | 0.726 | 0.728 | 0.725 | 1.18 | 0.831 | 0.776 | 0.899 | 0.742 | 0.775 | 0.742 | 0.812 |
| Chlorpheniramine | 0.550 | 1.00 | 0.960 | 1.00 | 1.27 | 1.31 | 1.06 | 1.27 | 1.22 | 1.01 | 1.07 |
Publisher’s Note: MDPI stays neutral with regard to jurisdictional claims in published maps and institutional affiliations. |
© 2021 by the authors. Licensee MDPI, Basel, Switzerland. This article is an open access article distributed under the terms and conditions of the Creative Commons Attribution (CC BY) license (https://creativecommons.org/licenses/by/4.0/).
Share and Cite
Gómez-Canela, C.; Edo, S.; Rodríguez, N.; Gotor, G.; Lacorte, S. Comprehensive Characterization of 76 Pharmaceuticals and Metabolites in Wastewater by LC-MS/MS. Chemosensors 2021, 9, 273. https://doi.org/10.3390/chemosensors9100273
Gómez-Canela C, Edo S, Rodríguez N, Gotor G, Lacorte S. Comprehensive Characterization of 76 Pharmaceuticals and Metabolites in Wastewater by LC-MS/MS. Chemosensors. 2021; 9(10):273. https://doi.org/10.3390/chemosensors9100273
Chicago/Turabian StyleGómez-Canela, Cristian, Sílvia Edo, Natalia Rodríguez, Gemma Gotor, and Sílvia Lacorte. 2021. "Comprehensive Characterization of 76 Pharmaceuticals and Metabolites in Wastewater by LC-MS/MS" Chemosensors 9, no. 10: 273. https://doi.org/10.3390/chemosensors9100273