Article

Coal Calorific Value Detection Technology Based on NIRS-XRF Fusion Spectroscopy

1
State Key Laboratory of Quantum Optics and Quantum Optics Devices, Institute of Laser Spectroscopy, Shanxi University, Taiyuan 030006, China
2
Collaborative Innovation Center of Extreme Optics, Shanxi University, Taiyuan 030006, China
3
School of Optoelectronic Engineering, Xi’an Technological University, Xi’an 710021, China
4
SINOPEC Research Institute of Petroleum Processing Co., Ltd., Beijing 100083, China
*
Author to whom correspondence should be addressed.
Chemosensors 2023, 11(7), 363; https://doi.org/10.3390/chemosensors11070363
Submission received: 19 May 2023 / Revised: 23 June 2023 / Accepted: 27 June 2023 / Published: 28 June 2023

Abstract

:
Calorific value is an important index for evaluating coal quality, and it is important to achieve the rapid detection of calorific value to improve production efficiency. In this paper, a calorific value detection method based on NIRS-XRF fusion spectroscopy is proposed, which utilizes NIRS to detect organic functional groups and XRF to detect inorganic ash-forming elements in coal. NIRS, XRF and NIRS-XRF fusion spectrum were separately used to establish partial least squares (PLS) regression models for coal calorific value, and better prediction performance was obtained by using fusion spectrum (the determination coefficient of calibration set (R2) was 0.98, the root mean square error of prediction set (RMSEP) was 0.19 MJ/kg, the average relative deviation for prediction (MARDP) was 0.95%). The variable selection is very important for model performance. The effective variables were extracted using Pearson correlation coefficients to further optimize the prediction model, and the evaluation indexes of the optimized model are R2 = 0.99, RMSEP = 0.16 MJ/kg and MARDP = 0.70%. In addition, the repeatability of the proposed method was briefly evaluated. The results show that the proposed method is an effective analysis method to detect the calorific value of coal, which provides a new idea and technique for coal quality detection.

1. Introduction

Coal is one of the most important energy sources in the world. It is widely used in the fields of power generation, steel, cement, etc., and is closely related to the development of the national economy [1,2]. The calorific value is an important index to evaluate the quality of coal, which can be used to assess the price and quality of coal, regulate the combustion system and reduce the emission of pollutants, and it is defined as the total energy released by the complete combustion of a unit weight of coal with oxygen under a certain condition and the cooling of combustion products to room temperature [3,4]. At present, calorific value detection in China is mainly based on the oxygen bomb method according to The Method for Determining the Calorific Value of Coal (Chinese national standard GB/T 213-2008), which calculates the calorific value based on the increase in water temperature caused by the exothermic combustion of a certain amount of coal sample in a combustion chamber filled with excess oxygen, but this method has a complicated operation process and a long analysis period, which seriously lags behind industrial production.
At present, the existing detection methods for coal quality include atomic absorption spectrometry (AAS) [5,6], inductively coupled plasma atomic emission spectrometry (ICP-AES) [7,8], prompt gamma neutron activation analysis (PGNAA) [9,10], laser-induced breakdown spectroscopy (LIBS) [11,12], etc. The basic principle of AAS is that monochromatic light with a wavelength corresponding to the characteristic lines of a target element is emitted by the source and absorbed by the base atoms of the target element in the sample gas. The degree of absorption of the light is proportional to the concentration of the target element in the sample. This method has good sensitivity, but it requires a complex and time-consuming sample pretreatment process [13]. ICP-AES uses inductively coupled plasma as the excitation source to excite the sample and emit the characteristic spectral lines of the elements, which are analyzed using an atomic emission spectrometer, but it also requires a time-consuming pretreatment process [2]. Consequently, neither of these methods can be used for rapid analysis of coal quality. PGNAA uses a neutron beam to irradiate a coal sample and calculates the calorific value of coal by analyzing the characteristic γ-ray spectrum. It can quickly obtain analysis results, but such equipment may have radioactive pollution during operation, requiring strict safety protection measures and high prices [14]. The principle of LIBS is that a high-energy laser beam is used to ablate coal samples to generate plasma and calculate the caloric value by analyzing the radiation spectrum of the plasma, but plasma is easily affected by fluctuations in the energy of the laser pulse and external environmental [15], which affects the repeatability of measurement results. Therefore, a rapid, non-polluting and stable caloric value detection technique is urgently needed.
Near-infrared spectroscopy (NIRS) is an effective method for rapid online analysis of organic materials [16,17]. Organic functional groups that contain hydrogen can form a wide absorption band in the NIR spectral range, and coal is primarily composed of organic materials containing a large number of functional groups and some other minerals, so it is feasible to apply the NIRS technique for the rapid analysis of some properties of coal. For example, Bona [18] and Andres et al. [19,20] first used PLS regression clustering analysis to establish the relationship between coal industry indicators and NIRS spectra, and the absolute measurement error of organic matter properties such as volatile matter, fixed carbon and calorific value for some clusters was 13%; Wang et al. [21] applied the NIRS method combining PLS, SVM and PCA to the analysis of coal quality with high accuracy for fixed carbon and volatile matter. Wang et al. [22] proposed NIRS based on a cooperative adaptive moving window PLS genetic algorithm to measure the industrial index of coal, with RMSE of 0.964 MJ/kg, 1.172%, 1.851% and 0.889% for calorific value, moisture, ash and volatile fraction, respectively; Begum et al. [23] used five absorption bands in the visible to near-infrared range The multiple linear regression model predicted the calorific value of coal with an R2 and mean absolute error of 0.92 and 4.84%, respectively. It is important to note that the calorific value of coal is influenced not only by the content of organic groups in coal, but also by the content of inorganic ash-forming elements (such as Si, Al, Ca, etc.) [24]. NIRS technology only analyzes the information of organic functional groups in coal, which poses limitations on its application in the determination of coal quality, specifically in the analysis of multiple elements, especially ash-forming elements.
X-ray fluorescence spectroscopy (XRF) is a commonly used method for elemental analysis that does not require complex sample pretreatment, can simultaneously provide non-destructive analysis of multiple elements and has a wide range of applications in geochemistry, materials science, archaeology and other fields [25,26]. It works by exciting atoms within a material with high-energy X-rays, which causes the atoms to release energy in the form of fluorescence. The fluorescence radiation is then detected and analyzed to determine the elements and chemical compositions present in the material. Many studies using XRF for coal quality analysis have been reported in recent years. Vincze et al. [27] used iterative Monte Carlo simulation and XRF to quantify coal ash particles from different coal types in several Hungarian power plants and determined the major, minor and trace elemental composition of the particles. Zhang et al. [28] developed an online coal analysis system consisting of an XRF analyzer and a laser rangefinder for real-time determination of heavy metals in coal dust. The disadvantage of XRF is that it can only analyze elements with atomic numbers higher than 11 and cannot analyze major organic elements such as C and H, which are essential in coal [29].
Since all spectral analysis techniques have certain strengths and limitations, a combination of two complementary spectral methods can provide more comprehensive and accurate information about the sample; the use of fusion spectroscopy can lead to better classification and prediction results [30]. Data fusion can be generally divided into three levels: low-level fusion, mid-level fusion and high-level fusion [31]. Low-level data fusion typically utilizes the entire spectral information, mid-level data fusion involves extracting features from the original data before data fusion and high-level fusion first calculates the results of different data sources separately and then combines these results to obtain the final result. In this research, we used Pearson correlation coefficients to extract effective variables to achieve mid-level data fusion.
In the present study, a coal calorific value detection device and method based on NIRS-XRF fusion spectroscopy was proposed, which used NIRS and XRF to simultaneously detect the spectral information of organic matter and inorganic ash-forming elements in coal. Meanwhile, NIRS and XRF spectroscopy combined with PLS were used to predict the calorific value of coal samples. Low-level and mid-level fusion models were utilized to improve the performance of calorific value prediction models. The method proposed in this paper provides a new idea and technique for coal quality analysis.

2. Experiment

2.1. Sample Preparation

In this experiment, a total of 35 coal samples were collected from Yangquan Sunshine Power Plant in Shanxi Province, and the coal purchased by this power plant was all anthracite coal. Before the start of the experiment, all coal samples were ground to particles smaller than 0.2 mm, and the air-dried basis calorific value was measured by the staff at the plant according to the Chinese national standard GB/T 213-2008, which is shown in Table 1. The samples numbered C1~C30 were used as the calibration set to establish the model; the range of the calorific value in the calibration set was between 18 MJ/kg and 27 MJ/kg, which basically covered the calorific value of the coal samples used by the plant. Additionally, the samples numbered P1~P5 were used as the prediction set to evaluate the performance of the model, and the range of calorific value for the prediction set samples was included in the calibration set. The samples were measured in the order of their number. The sample for the calibration set was measured on one day, and the sample for the prediction set was measured once a day for five days.

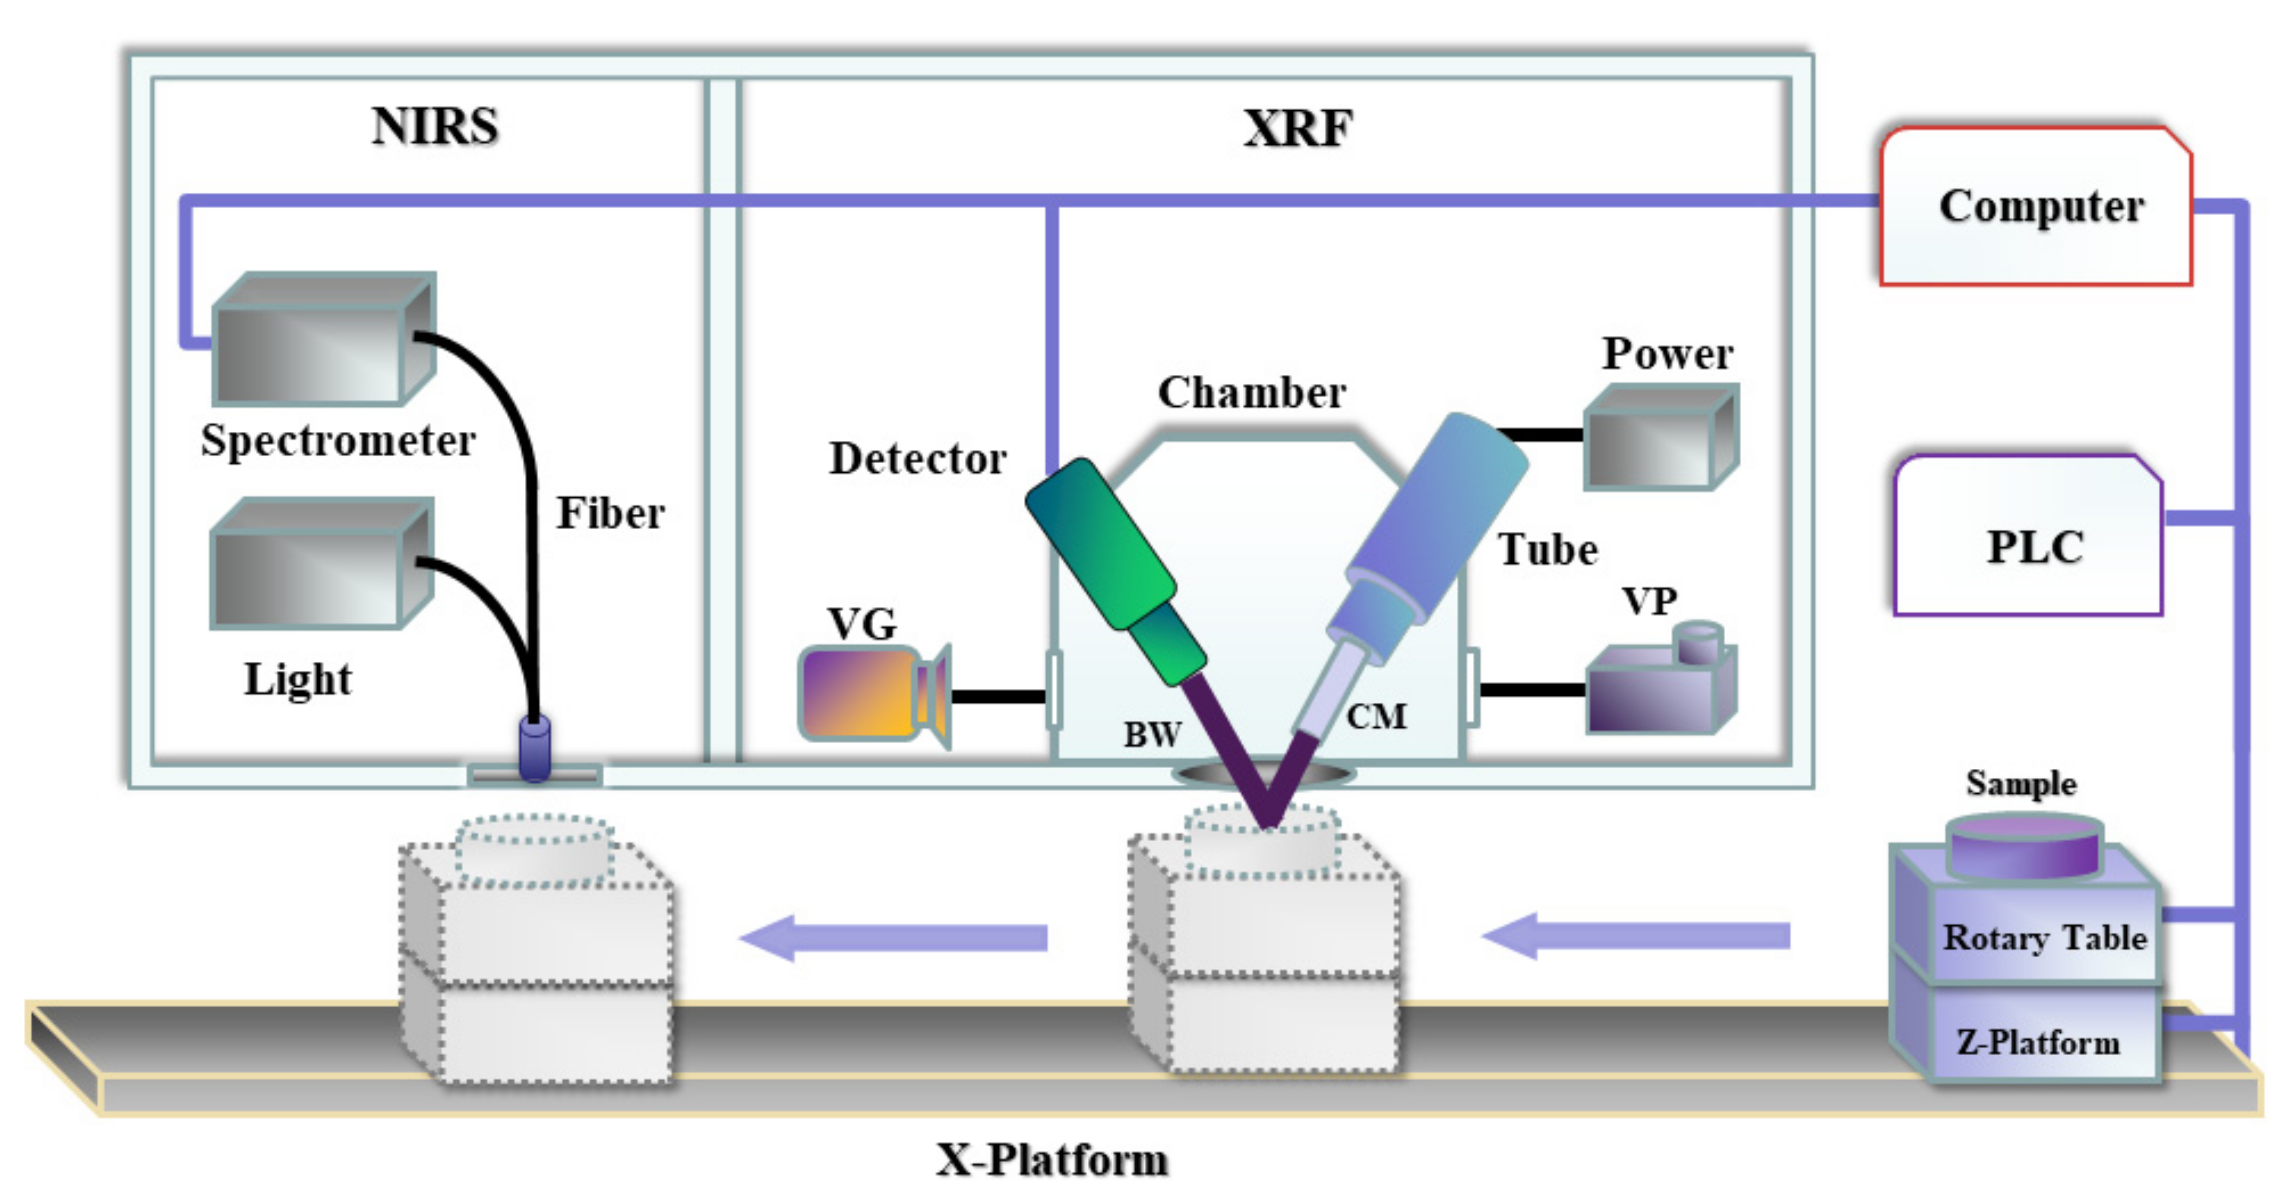
2.2. Experimental Setup and Measurement

The NIRS-XRF fusion spectroscopy experimental setup is depicted in Figure 1. The experiment setup mainly consisted of the NIRS module, XRF module and delivery module. In the NIRS module, the wavelength range and power of the used halogen lamp light source (AvaLight-HAL-S-Mini, Avantes, Apeldoorn, The Netherlands) were 360~2500 nm and 0.5 mW. The wavelength range of the used Fourier transform near-infrared spectrometer (C15511. HAMAMATSU, Hamamatsu, Japan) was 4000~9090 cm−1, and the spectral resolution was 15 cm−1. Each spectrum was the result of 4000 scans of the spectrometer. A fiber probe (FCR-7UVIR200, Avantes, Apeldoorn, The Netherlands) containing 7 fibers, with the end of the fiber divided into two bundles; one bundle (containing 6 fibers) was connected to the NIRS light source for illumination and the other bundle (containing 1 fiber) was connected to the near-infrared spectrometer for signal collection. The probe was located 4 mm above the coal sample and was used to obtain the reflection spectral information of the coal sample.
The XRF module was based on energy dispersive XRF technology. The X-ray tube (VF-50J-45°, VAREX, Salt Lake City, UT, USA) was powered by a high-voltage power supply (MNX50W, SPELLMAN, Atlanta, GA, USA). The generated initial X-rays hit the surface of the coal sample after the collimator and beryllium window, then the generated secondary X-ray fluorescence signal was detected by an SDD (VICO-DV H20, KETEK, Munich, Germany), and the spectral resolution was 0.003 keV. The vacuum pump was used to ensure that the air pressure in the vacuum chamber was lower than the set value, and the vacuum gauge was used to monitor the air pressure in the vacuum chamber. The beryllium window was located 2 mm above the coal sample.
In the delivery module, the X-platform was used to deliver the sample to the bottom of the detection module, the Z-platform was used to control the height of the sample and the powdered coal sample was placed in the sample cell on the rotary table. The sample weight was approximately 5 g for each measurement. During NIRS and XRF measurements, the X-platform and rotary table cooperated to make the scanning trajectory of the detection module spiral. All movements were controlled by the PLC (S7-200, SIEMENS, Munich, Germany).
The whole measurement process for the coal sample was as follows: the PLC controlled the X-platform to move towards the XRF module, while the vacuum pump started to work. When the air pressure in the vacuum chamber fell to 100 Pa, the XRF spectrum of the coal sample started to be measured, the operating voltage and current of the high-voltage power supply were 16 kV and 0.6 mA, respectively, and the integration time of SDD was set to 60 s. After the XRF module measurement was completed, the X-platform moved toward the NIRS module, and the NIRS spectrometer measured each coal sample five times; the average spectrum was presented as the NIRS spectrum of the sample. After the measurement was completed, the X-platform returned to the starting point. Since both XRF and NIRS are non-destructive and fast measurement techniques, there was no strict requirement for the sequence of measurement of the coal samples. The temperature of the experimental environment was maintained at 25 °C.

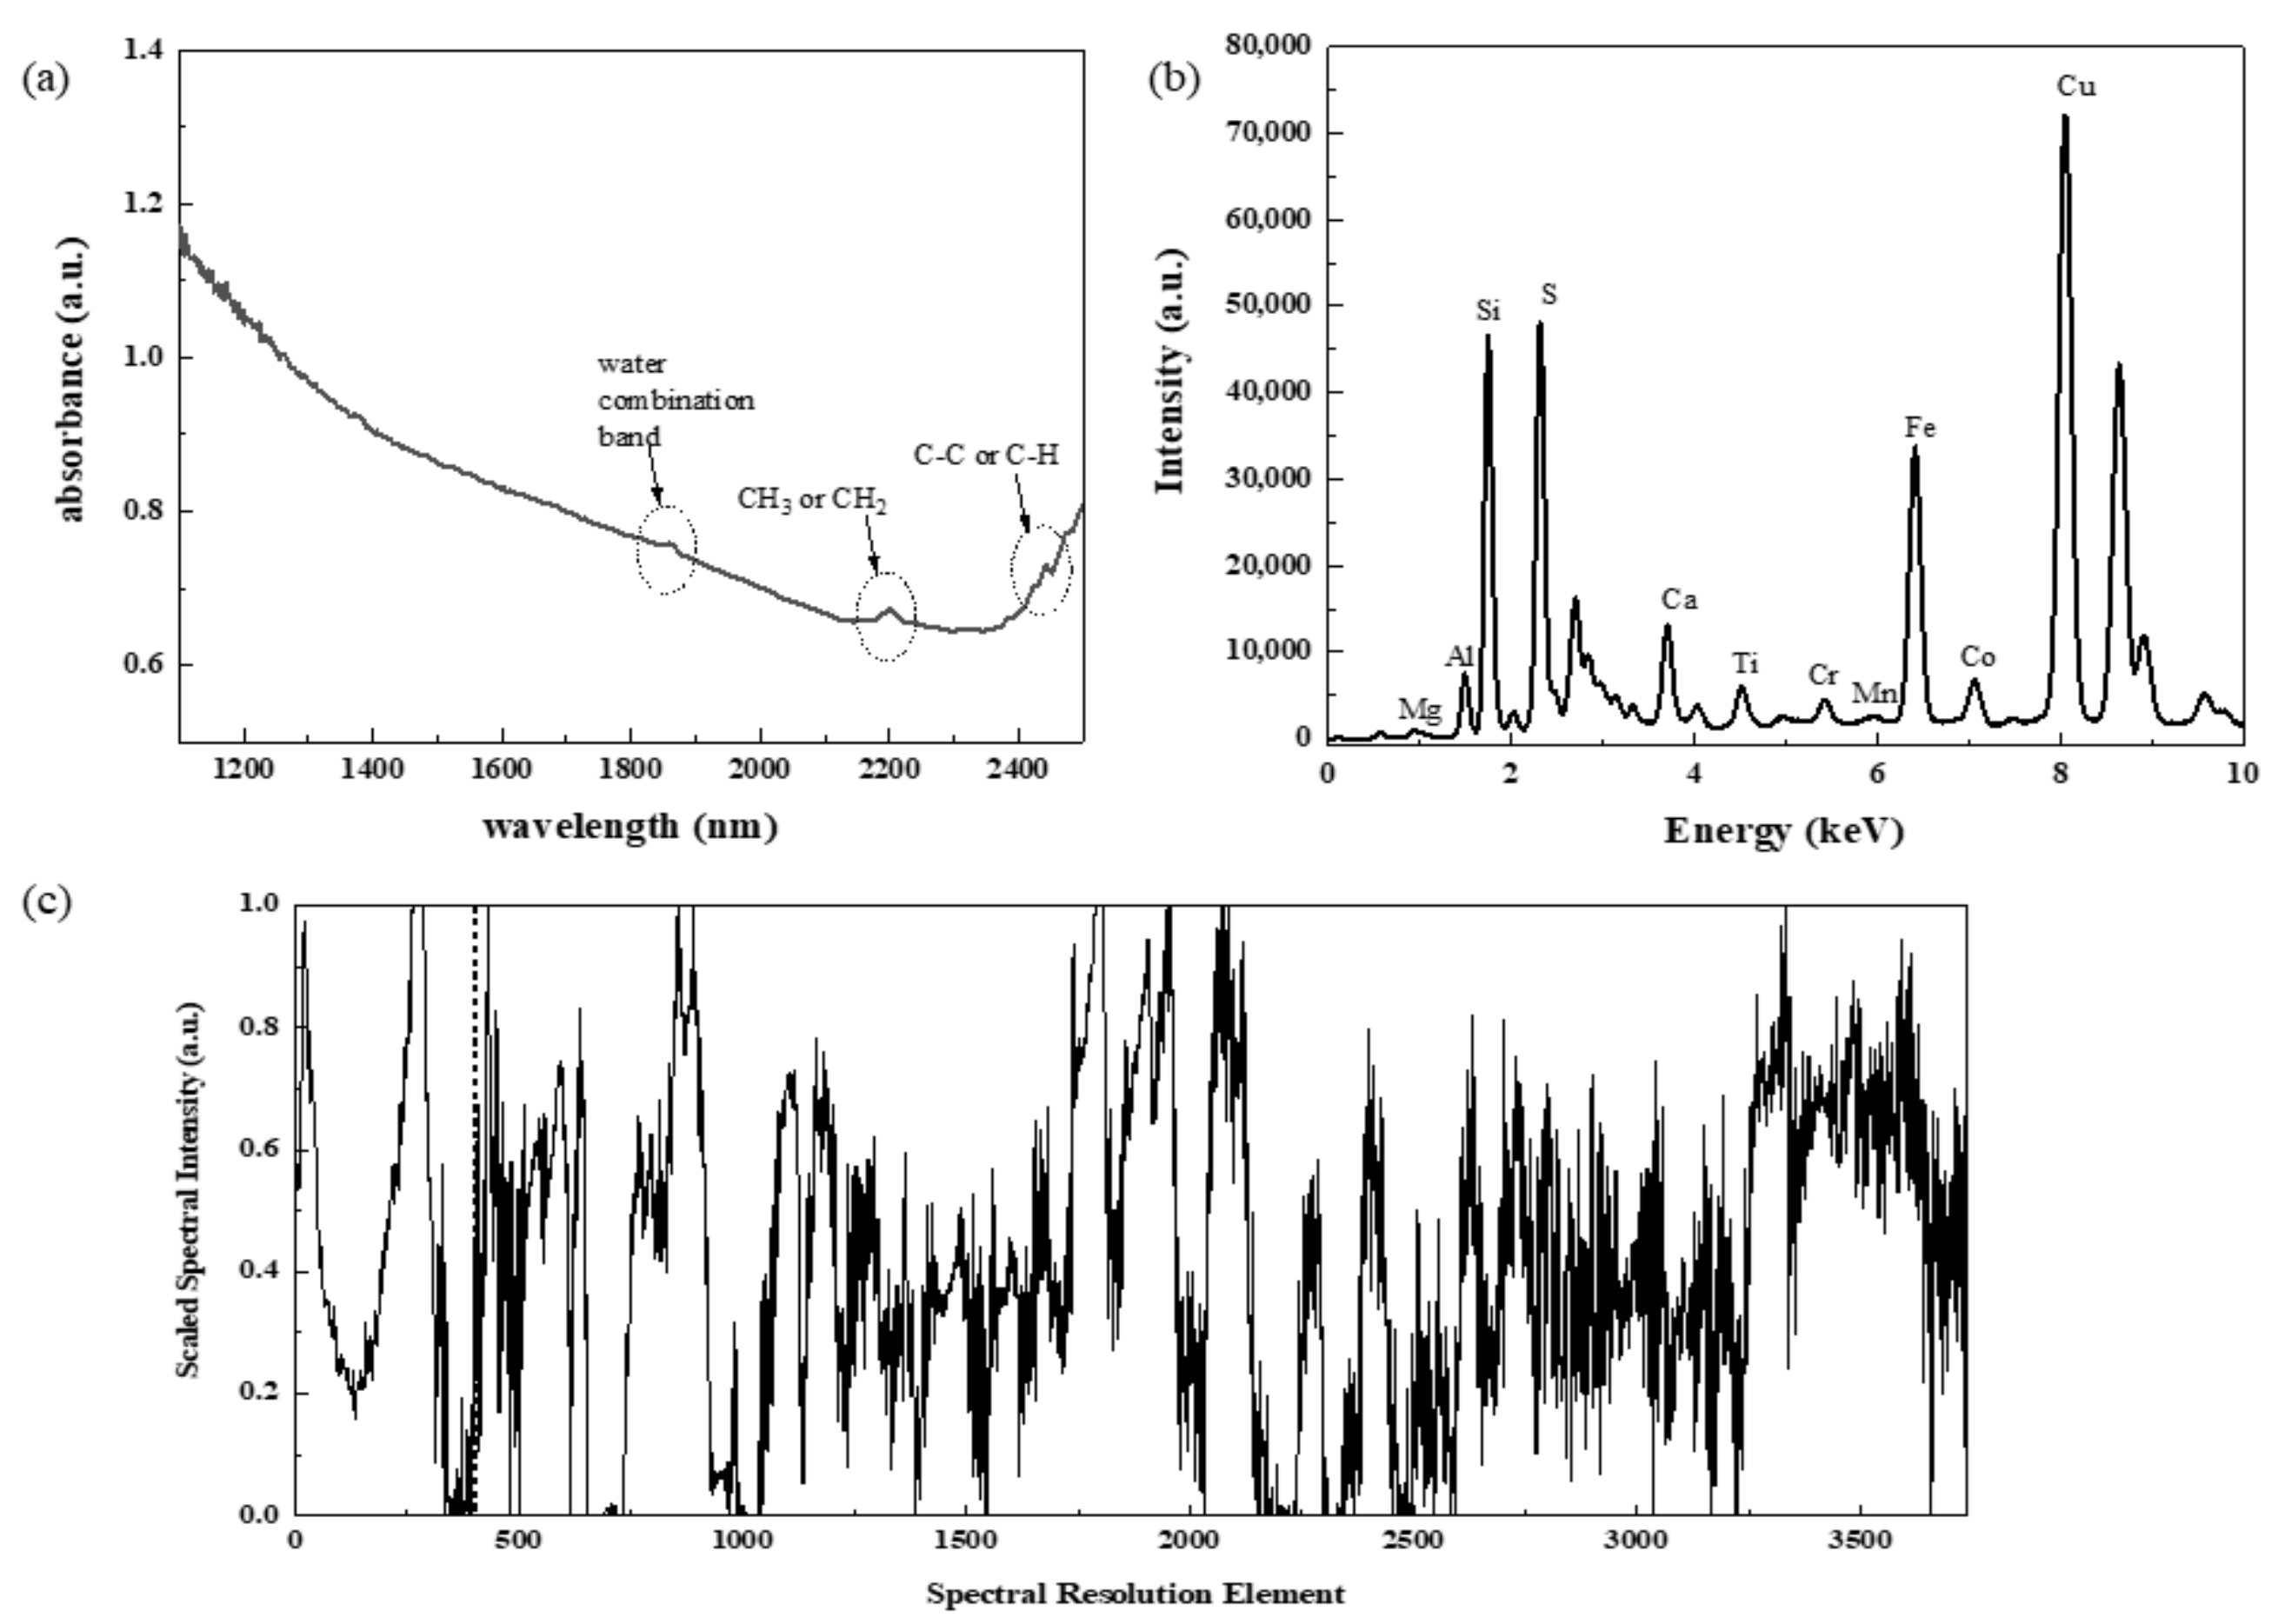
2.3. Spectral Pre-Processing Methods

Spectral pre-processing is an important part of chemometric measurements, and the pre-processing process affects the final robustness and reliability of the model. In this study, the pre-processing process for spectra was as follows:
Firstly, Savitzky–Golay convolution smoothing (SG smoothing) was used for the two spectra separately to eliminate the effect of high-frequency noise on the spectral information. The core idea of this smoothing method is to fit a k-order polynomial to data points within a certain length window, and determine the smoothed value of each point by performing a polynomial regression on a series of points. The characteristic of this method is that the shape and width of the signal can be ensured to be unchanged while filtering out the noise. In this paper, a 5-point window and a 3-order polynomial regression were used to smooth and filter the two spectra of coal samples.
Secondly, standard normal variate (SNV) was used to eliminate the effect of scattering caused by the inhomogeneous particle size of coal samples. This method calculates the mean and standard deviation of each data point of the spectrum and uses the calculated values to adjust each spectrum; the calculation formula of SNV for spectra is:
X S N V = x i x ¯ i = 1 n ( x i x ¯ ) 2 n 1
where xi represents the i-th point of the sample spectrum, x represents the average value of the spectrum, n is the total number of points in the spectrum and XSNV is the spectral data after SNV.
Finally, all variables of both spectra were scaled to the interval (0, 1) in order to eliminate the order-of-magnitude differences between the variables, and the scaling method used is given by the following equation:
y = ( y max y min ) ( x x min ) x max x min + y min
where ymax and ymin are the upper and lower bounds of the interval, x is the variable, xmin and xmax are the minimum and maximum values of the variable and y represents the variable after scaling.
Both NIRS spectrum and XRF spectrum belong to high-dimensional data. A coal sample spectrum contains hundreds of variables, and the correlation between different variables and the calorific value of coal is different. Some variables are highly correlated with the calorific value, and usually these variables contain relatively more useful information, which is very important for predicting the calorific value of coal. There are also some variables that are less relevant to calorific value and contain less useful information. In this paper, we used Pearson coefficient to select the effective variables. The correlation coefficient can respond to the degree of linear correlation between two variables; a positive number means that the two variables are positively correlated, a negative number means that they are negatively correlated and the larger the absolute value of the coefficient, the greater the degree of linear correlation between the two variables. It is defined by the following equation:
r = cov ( X , Y ) σ X σ Y
where r is the Pearson correlation coefficient, cov(X, Y) is the covariance between the variable X and the target index Y and σX and σY are the respective standard deviations.

2.4. Prediction Model

Partial least squares (PLS) regression is used to establish the relationship between multiple independent variables and dependent variables. It combines the advantages of principal component analysis (PCA) and linear regression analysis, and can be applied to cases with small sample sizes. In this experiment, two different prediction models were established based on PLS. The first prediction model used the full information of the NIRS and XRF fusion spectra to establish the model (low-level fusion model), while the second prediction model used Pearson correlation coefficients to extract the effective variables in the fusion spectra before modeling (mid-level fusion model). In order to achieve the best performance of the PLS model and avoid overfitting as much as possible, ten-fold cross-validation was used to determine the number of factors, and the number of factors for different PLS models (NIRS, XRF, NIRS-XRF) were 4, 6 and 9 respectively.

2.5. Evaluation Indexes

The evaluation indexes applied included the determination coefficient of the calibration set (R2), the root mean square error of the prediction set (RMSEP) and the mean absolute relative error for prediction (MARDP). The definitions of R2, RMSEP and MARDP are as follows.
R 2 = 1 - i = 1 j ( y i y ^ i ) 2 i = 1 j ( y i y ¯ i ) 2
R M S E P = i k ( y i y ^ i ) 2 k
M A R D P = 1 k i = 1 k y i y ^ i y i × 100 %
where yi and ŷi are the predicted values and reference value of coal samples, respectively, y - i represents the average of the reference values of all coal samples, i is the sample measurement sequence, j is the total number of samples in the calibration set and k is the total number of samples in the prediction set. The closer the value of R2 was to 1, the better the linearity of the model built in the calibration set; the closer RMSEP and MARDp were to 0, the smaller the deviation of the predicted value from the reference value. The R2, RMSEp and MARDp were used to evaluate the accuracy of the prediction results of the model.
Measurement repeatability is a very important index in industrial production. The standard deviation (SD) was used for evaluation of the repeatability of the established model, which was defined as:
S D = i = 1 j ( x i x ¯ ) 2 j 1
where xi is the predicted value for the same coal sample, j is the total number of repeated measurements and x is the average of the predicted values. The smaller the SD, the better the repeatability of the measurement.

3. Results and Discussion

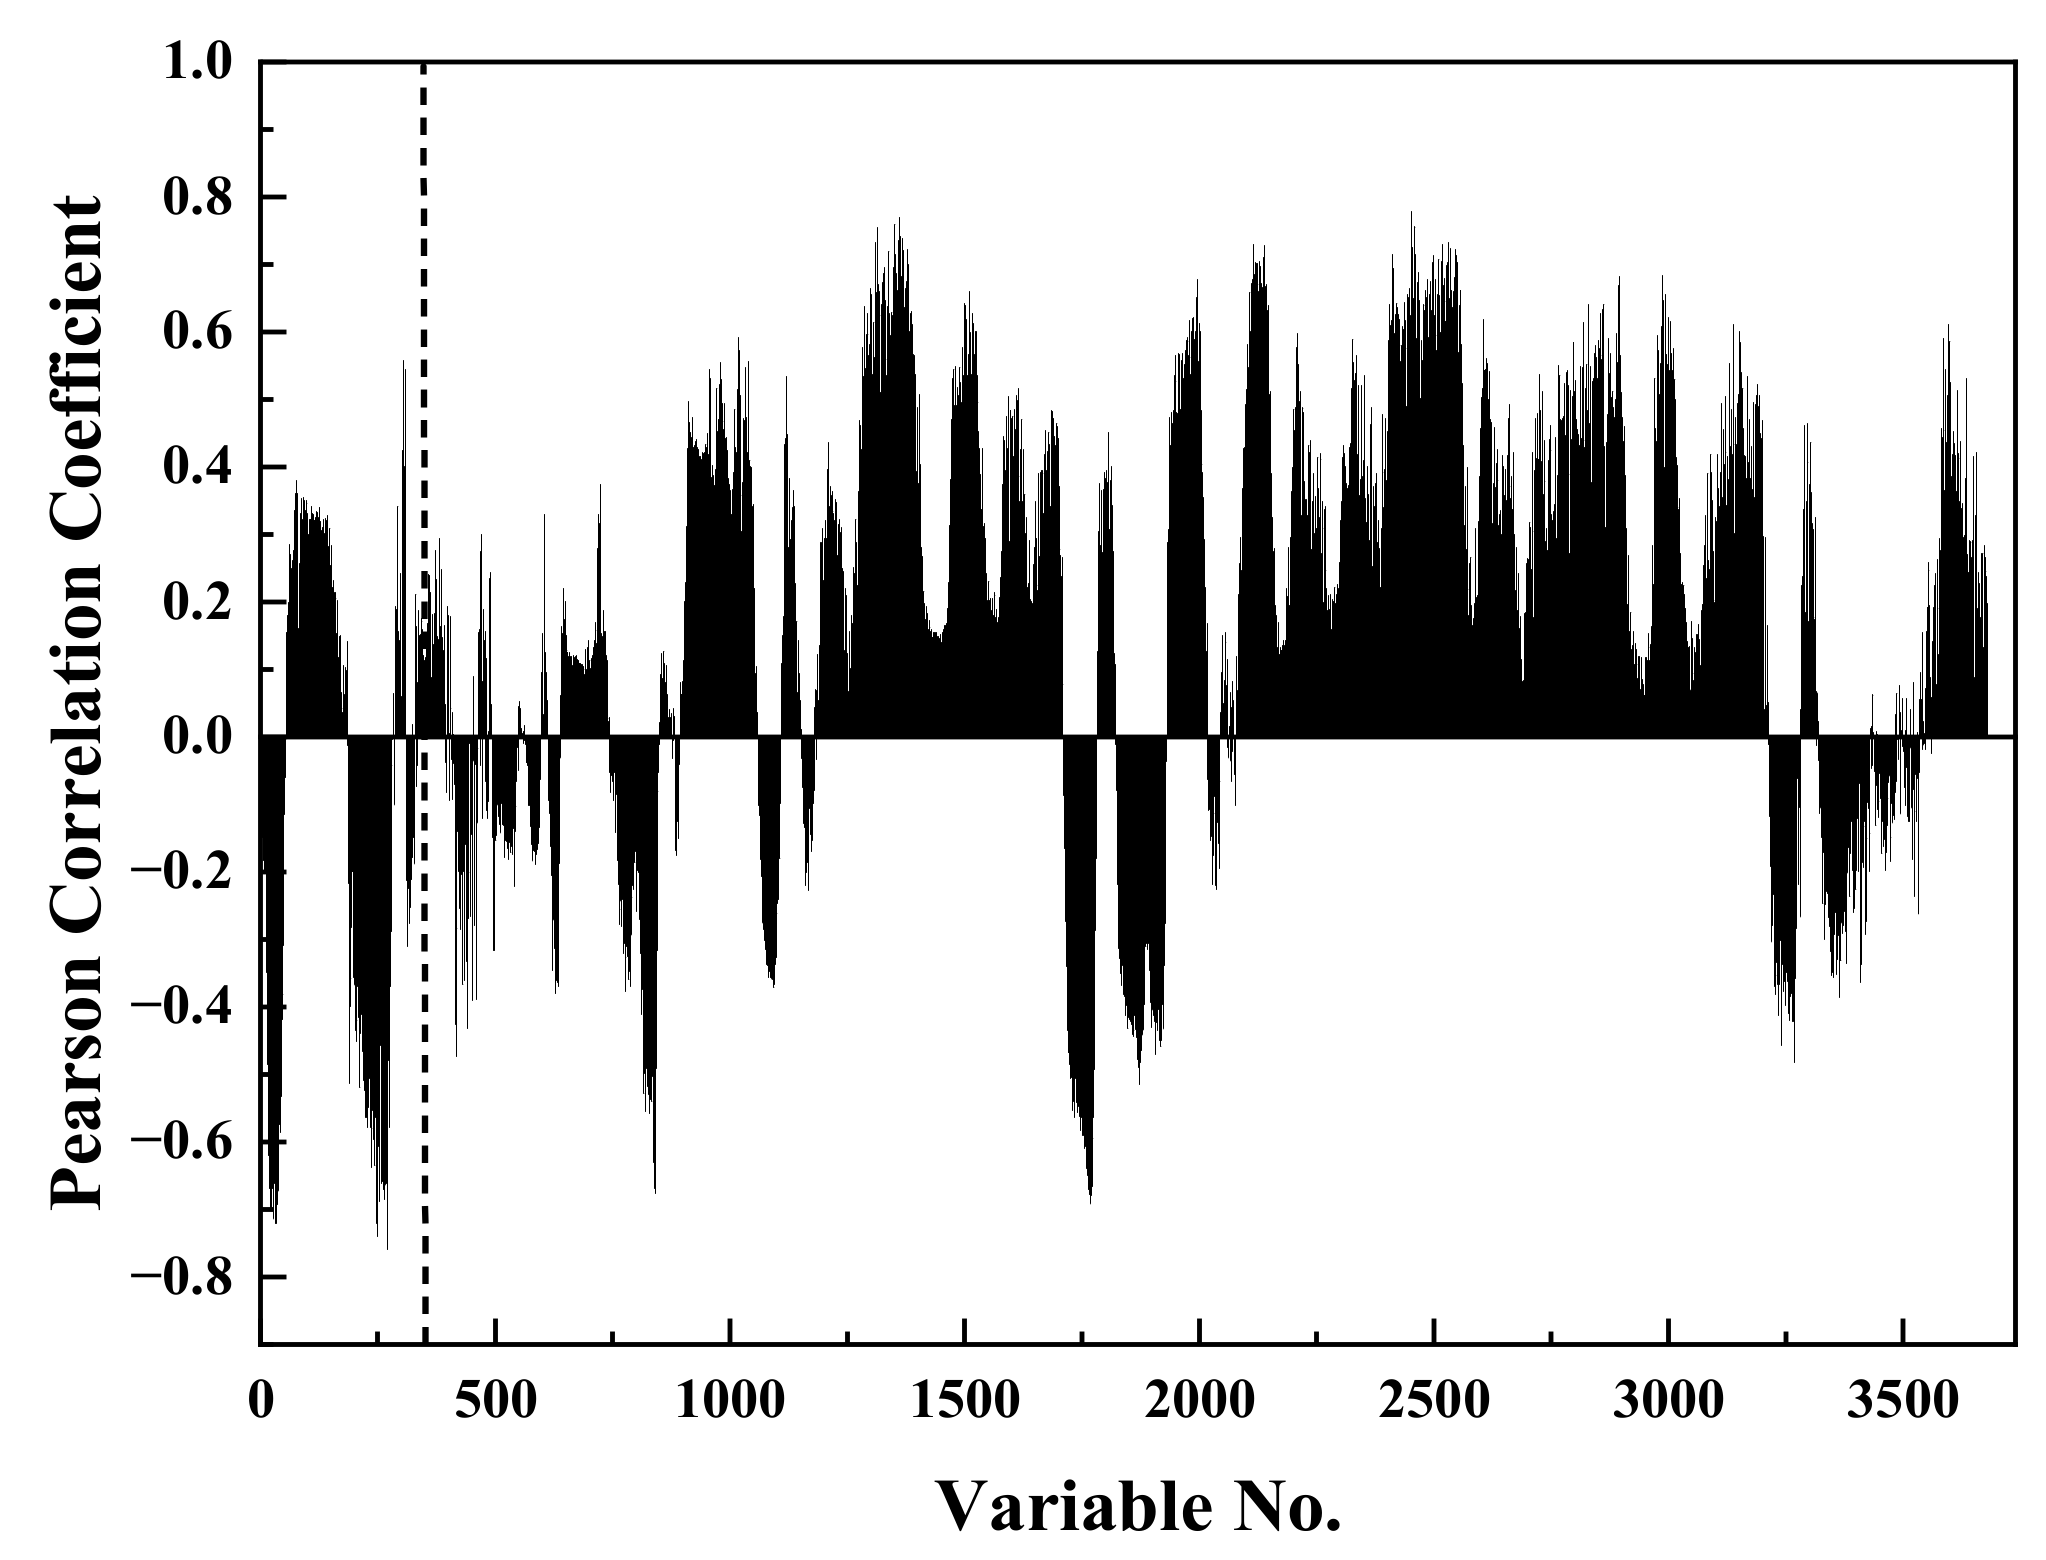
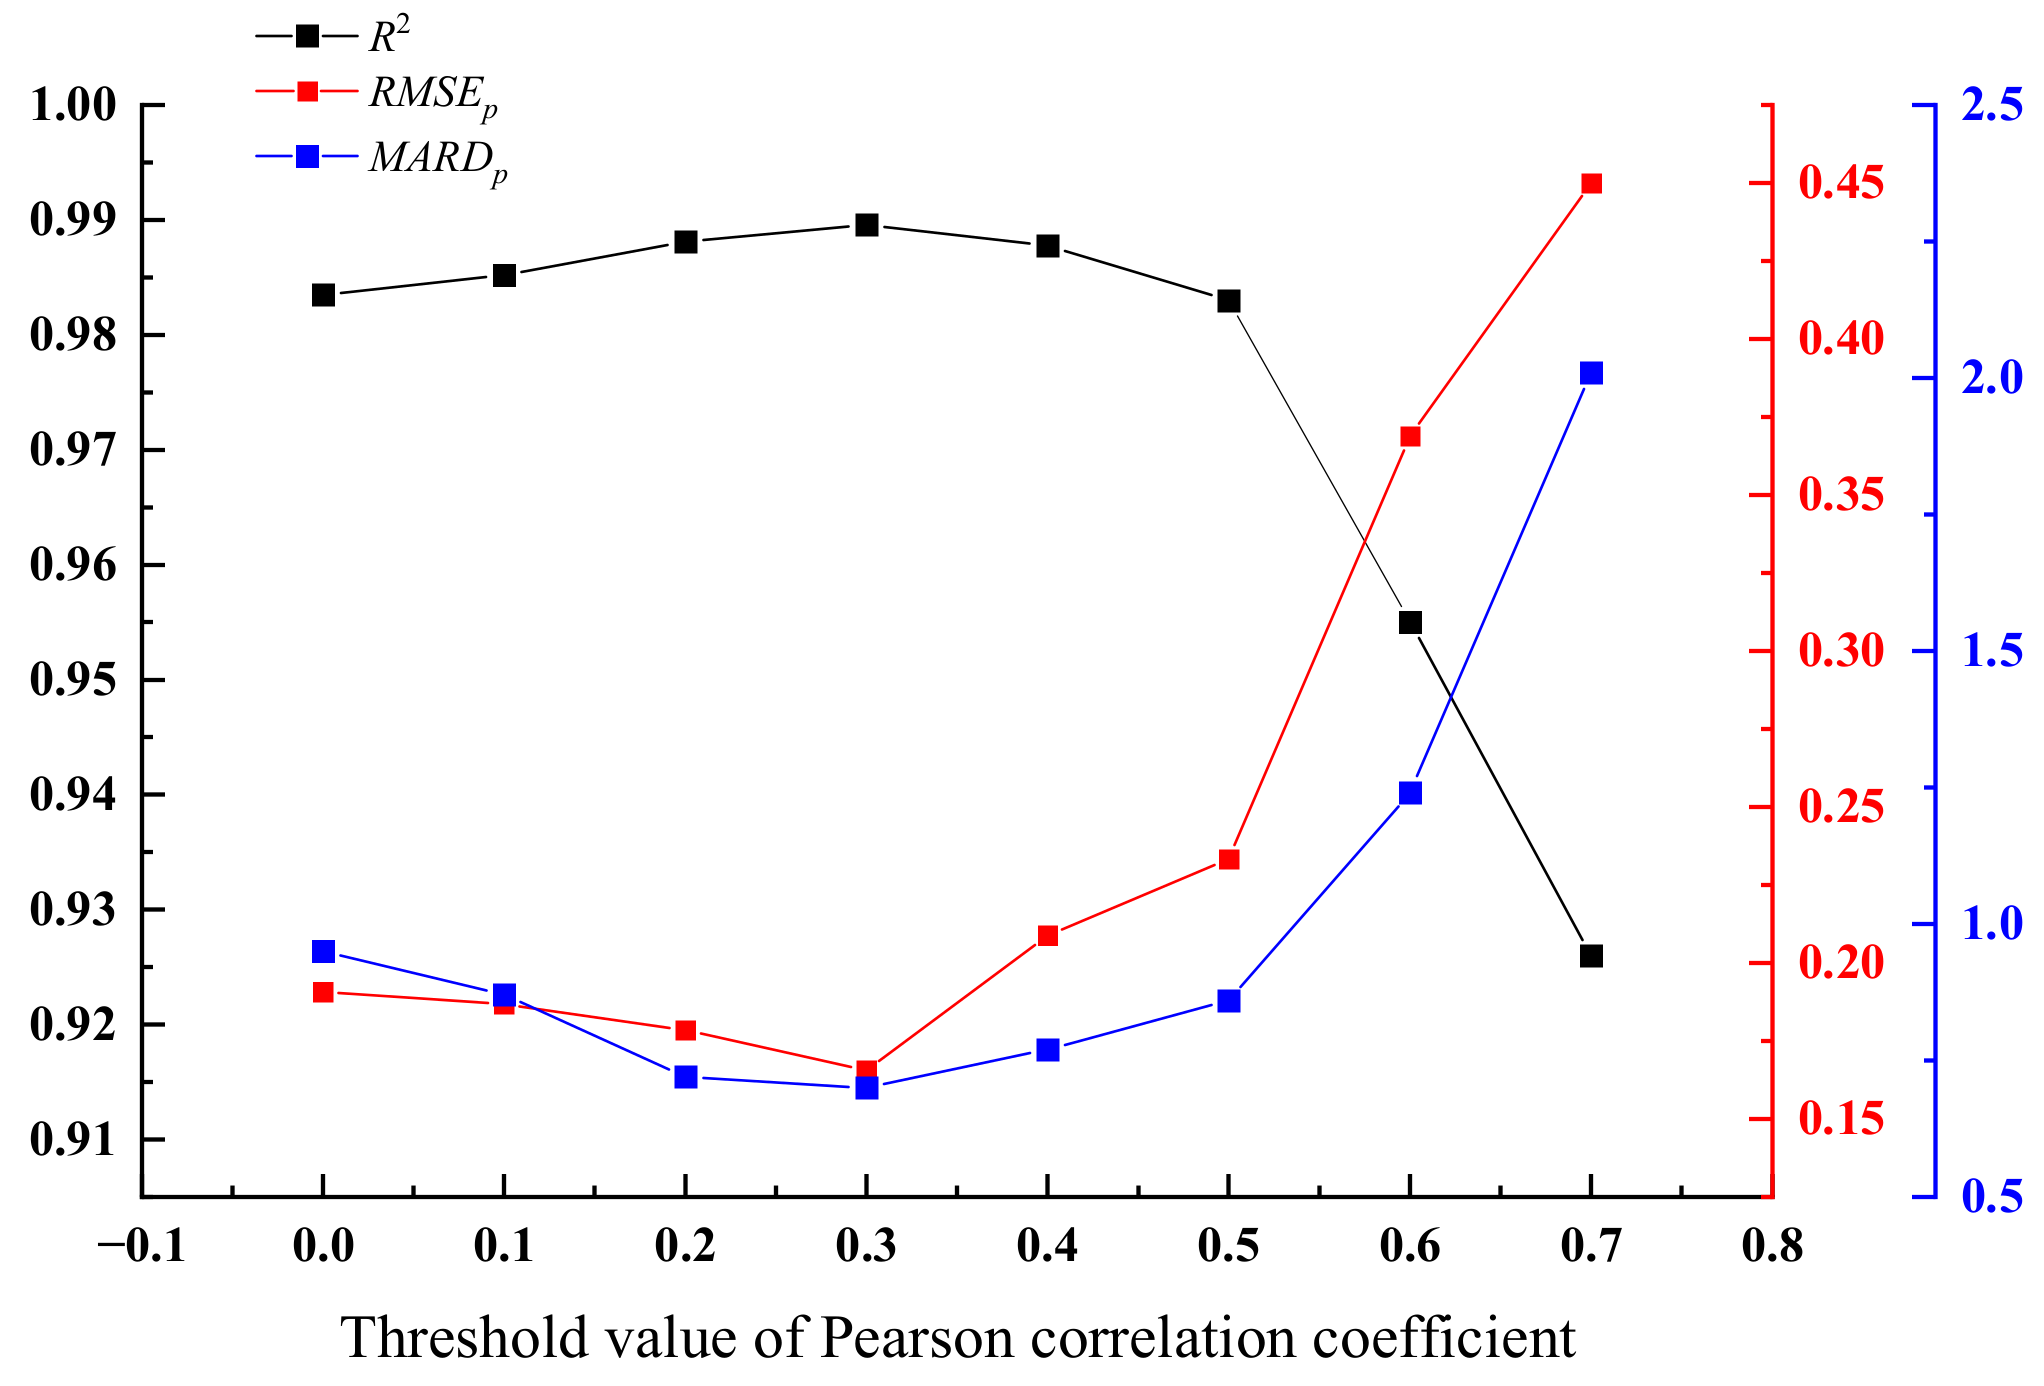
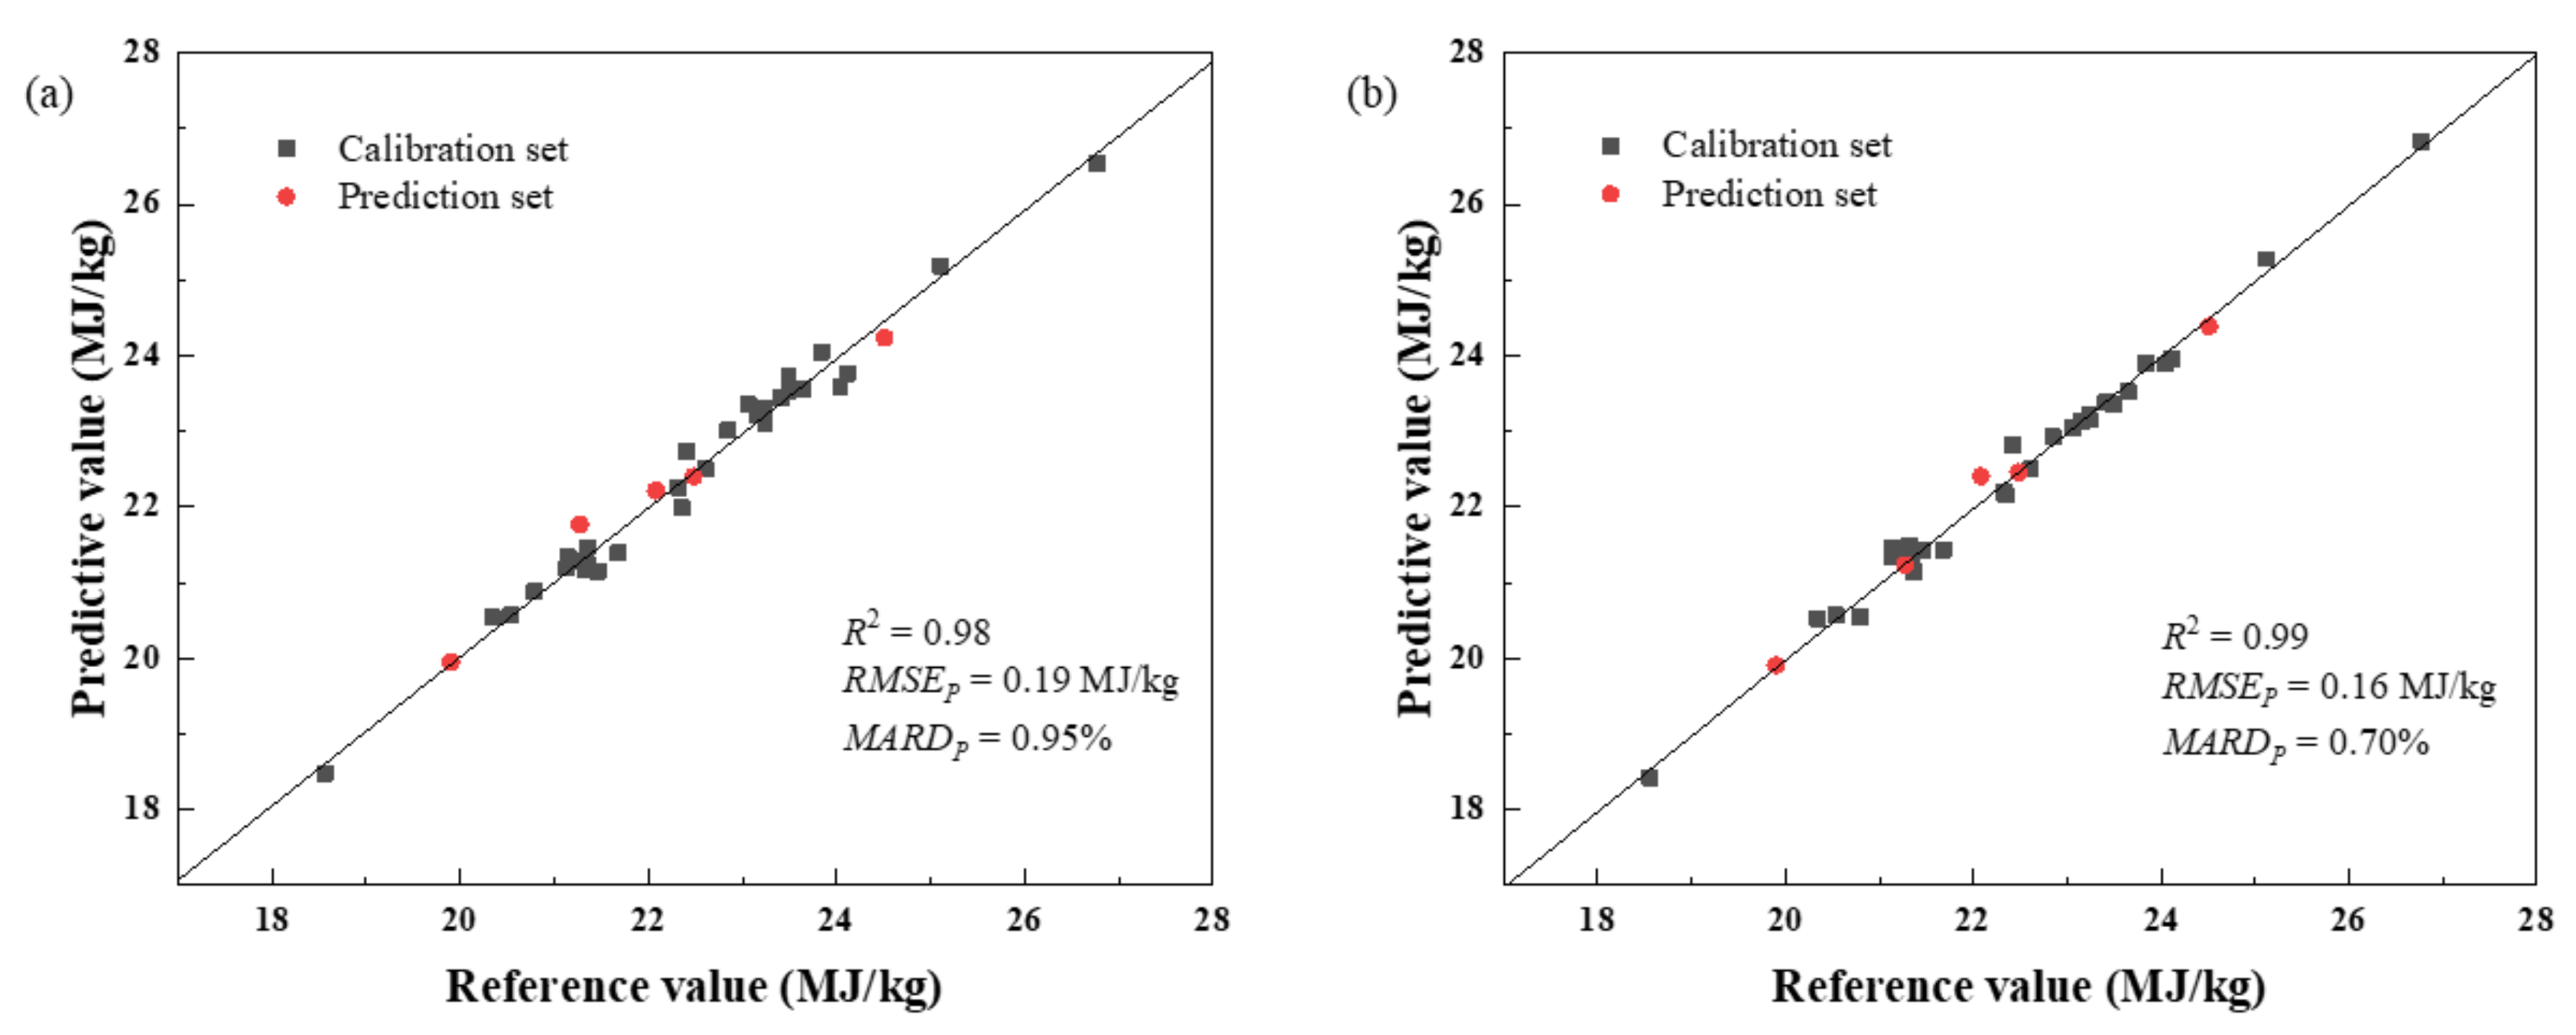
3.1. Analysis of Coal Calorific Value via Low-Level Fusion Model

The raw NIRS and XRF spectra of sample C18 are shown in Figure 2a,b. The two spectra were individually processed using SG smoothing and SNV, and then these two spectra were connected end to end to obtain a fusion spectrum, which is shown in Figure 2c. The two complementary spectral techniques can provide more comprehensive and accurate information about the sample than the single spectral technique, and the use of fusion spectroscopy can achieve better classification and prediction results [30]. Table 2 compares the model prediction performance of the single spectrum and the NIRS-XRF fusion spectrum (low-level fusion model).
Table 2 compares the prediction performance of the models established using different methods. The evaluation indexes of the low-level fusion model for calorific value were R2 = 0.98, RMSEP = 0.19 MJ/kg and MARDP = 0.95%, and it can be seen that the prediction performance of the model established by the NIRS-XRF fusion spectrum had a great improvement compared with only using the NIRS spectrum (R2 = 0.95, RMSEP = 0.33 MJ/kg, MARDP = 1.21%) and XRF spectrum (R2 = 0.94, RMSEP = 0.39 MJ/kg, MARDP = 1.60%).

3.2. Analysis of Coal Calorific Value via Mid-Level Fusion Model

In the Section 3.1, the better prediction results were obtained by using the full data of NIRS and XRF spectra, but this may have introduced some information that was not related to the coal calorific value. The low-value variables may have affected the final prediction results, and too many variables in the model would slow down the calculation speed. Therefore, in order to obtain more accurate prediction results, it was necessary to extract features of NIRS-XRF fusion spectroscopy to eliminate the low-value information. Figure 3 shows the Pearson correlation coefficients (r) between all variables of the spectra and the calorific value. The left side of the dashed line is the Pearson correlation coefficients of the NIR spectrum, and the right side is the Pearson coefficient of the XRF spectrum. In this experiment, we selected the variables with absolute Pearson correlation coefficients greater than the set threshold (t) as input variables for the PLS model.
Figure 4 shows the prediction performance of the PLS model established with variables selected using different threshold values. It can be seen that the R2 of the model increased first and then decreased as the threshold increased, while the RMSEP and AREP increased first and then decreased. The best performance of the model was achieved when t = 0.3. The reason for this phenomenon was that when the threshold value was set too large, although the selected variables had a strong linear correlation with the calorific value, a lot of useful variables were discarded, which led to the poor performance of the model; when the threshold was set too small, the selected variables contained a lot of low-value information and the prediction performance of the model was affected. Table 3 shows the number of variables selected for establishing the model under different thresholds and the corresponding calculation time. When t = 0.0, all variables were used to build the model, which was the low-level fusion model. It can be seen that as the threshold decreased, the number of variables and calculation time increased.
Figure 5 compares the predictive performance of the low-level fusion model and the mid-level fusion model. The diagonal line in the figure represents the partial least squares fit for calibration set. We used the model established using the selected effective variables at t = 0.3 as the mid-level fusion model. Compared with the low-level fusion model, the number of variables was reduced from 3739 to 2302. R2 was improved from 0.98 to 0.99, RMSEP was reduced from 0.19 MJ/kg to 0.16 MJ/kg and AREP was reduced from 0.95% to 0.70%. These results show that appropriate variable selection can improve the accuracy of the model.

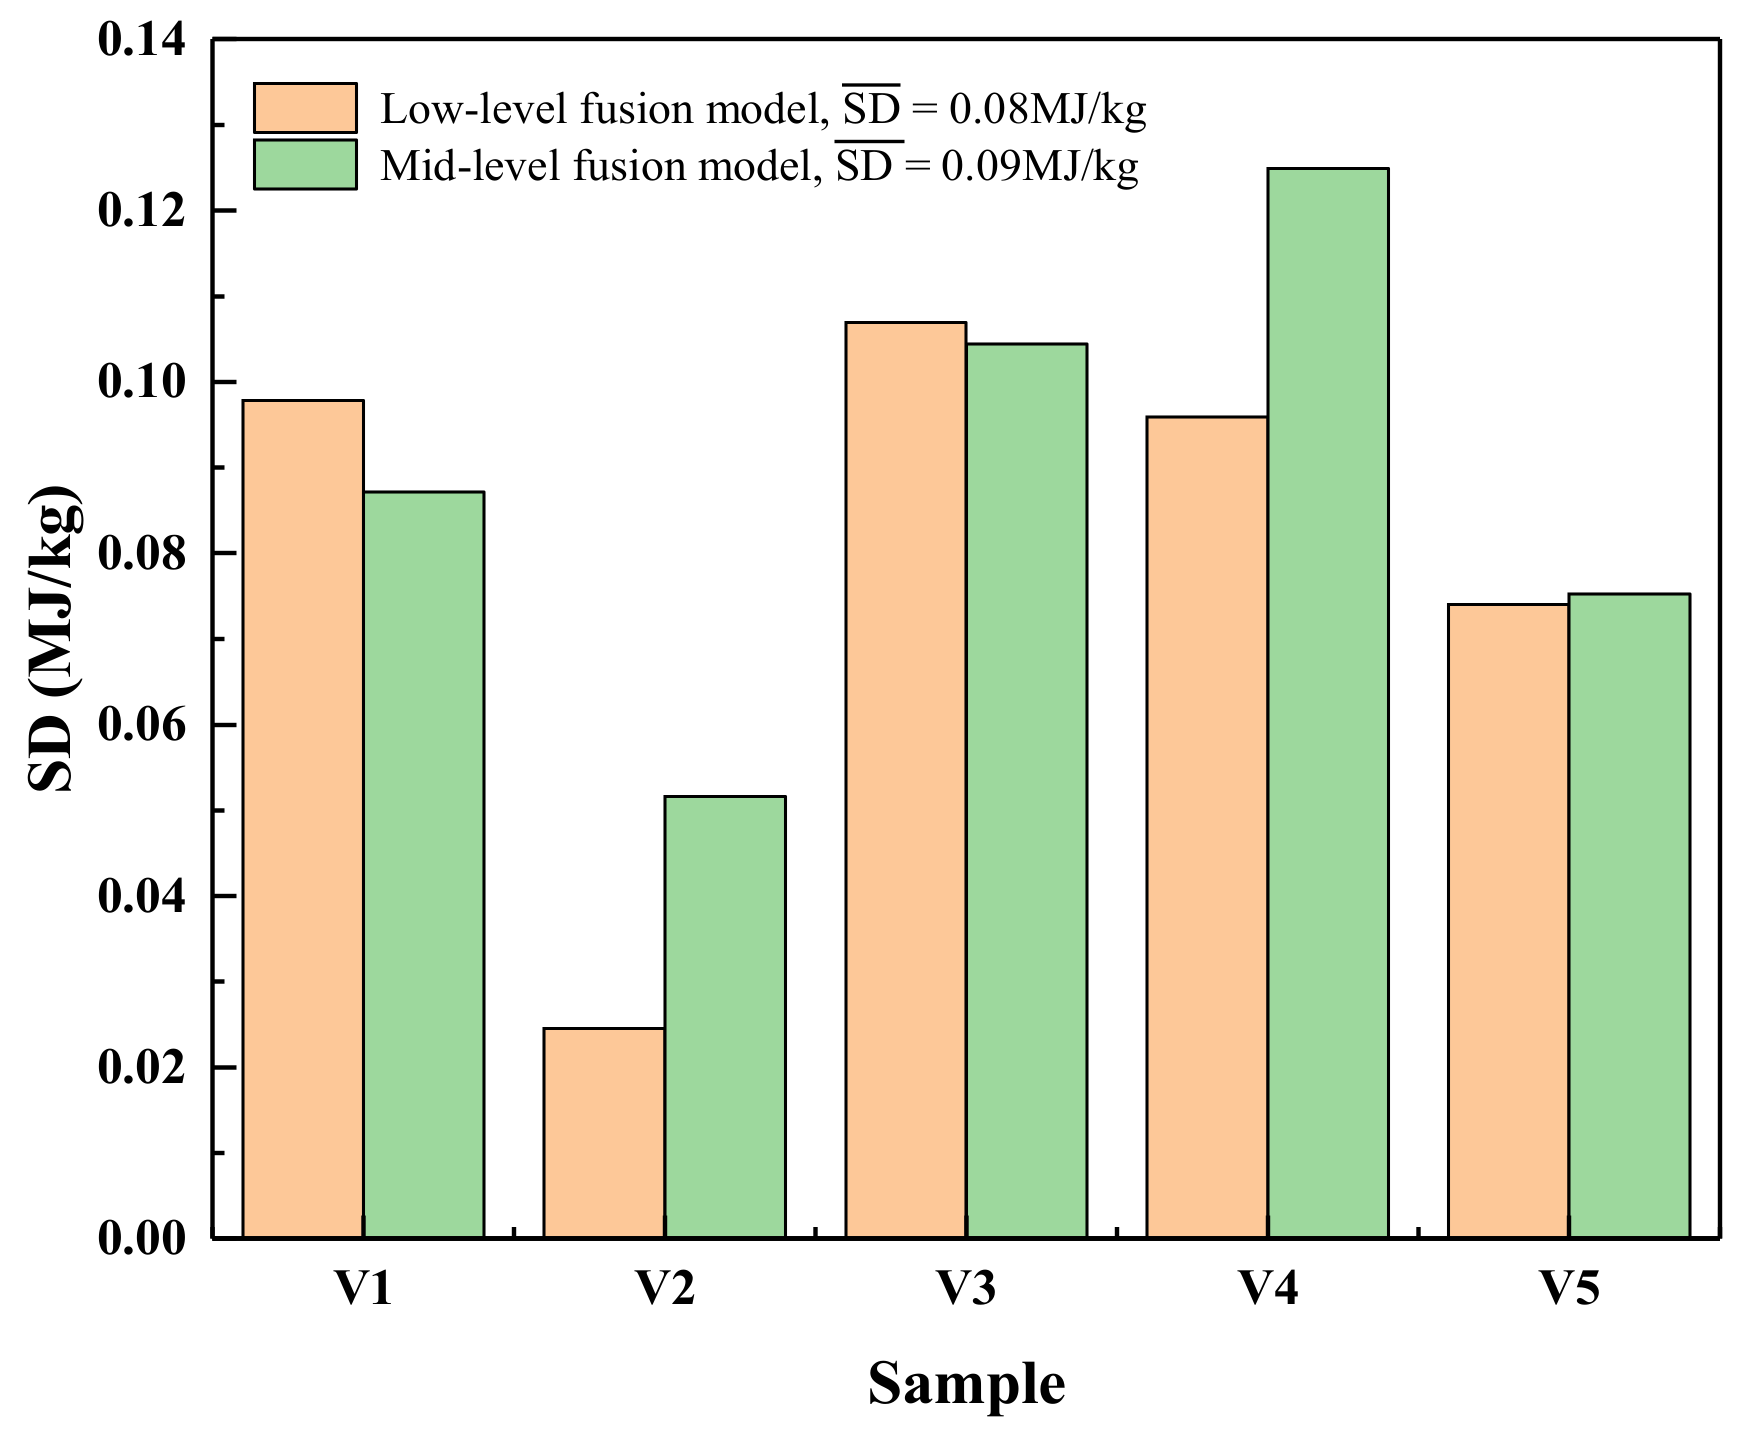
3.3. Repeatability Evaluation

In this experiment, each sample of the prediction set was tested five times to evaluate the repeatability of the model. Figure 6 shows the repeatability of the prediction set. The average standard deviation of the five samples using the low-level fusion model was 0.08 MJ/kg, and the average standard deviation using the mid-level fusion model was 0.09 MJ/kg.

4. Conclusions

In this paper, a coal calorific value detection technique based on NIRS-XRF fusion spectroscopy was proposed, which used NIRS to detect organic functional groups and XRF to detect inorganic ash-forming elements in coal. The two complementary spectral techniques can provide more comprehensive and accurate information about the sample than the single spectral technique (R2 = 0.98, RMSEP = 0.19 MJ/kg, MARDP = 0.95%). In order to avoid the influence of low-value information in the spectrum on the model, the Pearson correlation coefficient was used to extract effective variables to further optimize the prediction performance of the model (R2 = 0.99, RMSEP = 0.16 MJ/kg, MARDP = 0.70%). Finally, the reproducibility of the two models was briefly evaluated, and the average standard deviations of the low-level fusion model and the medium-level fusion model were 0.08 MJ/kg and 0.09 MJ/kg, respectively.
However, the method used in this article still has some limitations due to the complex matrix effects of coal. Some variables do not have a linear relationship with calorific value, and using PLS algorithms and Pearson correlation coefficients cannot effectively utilize these variables. This problem can be optimized by using nonlinear algorithms such as BP neural network algorithms, which will be the subject of our next research. In summary, NIRS-XRF fusion spectroscopy is an effective analysis method to detect the calorific value of coal, which provides a new idea and technique for coal quality detection.

Author Contributions

Conceptualization, J.L. and L.Z.; Data curation, R.G. and S.W.; Formal analysis, Y.Z. and S.J.; Funding acquisition, S.J.; Investigation, J.L. and R.G.; Methodology, J.L. and S.W.; Project administration, W.Y. and S.J.; Resources, L.Z. and S.J.; Software, J.L. and Y.Z.; Supervision, Y.Z. and S.W.; Writing—original draft, J.L.; Writing—review and editing, L.Z. and W.Y. All authors have read and agreed to the published version of the manuscript.

Funding

This research was funded by the National Key R&D Program of China (2017YFA0304203); the National Energy R&D Center of Petroleum Refining Technology (ZC0607-0138); the Changjiang Scholars and Innovative Research Team at the University of Ministry of Education of China (IRT_17R70); the National Natural Science Foundation of China (NSFC) (61975103, 61875108, 627010407); the 111 Project (D18001); and the Fund for Shanxi “1331KSC”.

Institutional Review Board Statement

Not applicable.

Informed Consent Statement

Not applicable.

Data Availability Statement

Data is available on request.

Conflicts of Interest

The authors declare no conflict of interest.

References

  1. Yang, Q.; Zhang, L.; Zou, S.; Zhang, J. Intertemporal optimization of the coal production capacity in China in terms of uncertain demand, economy, environment, and energy security. Energy Policy 2020, 139, 111360. [Google Scholar] [CrossRef]
  2. Liu, K.; He, C.; Zhu, C.; Chen, J.; Zhan, K.; Li, X. A review of laser-induced breakdown spectroscopy for coal analysis. TrAC Trends Anal. Chem. 2021, 143, 116357. [Google Scholar] [CrossRef]
  3. Mason, D.M.; Gandhi, K.N. Formulas for calculating the calorific value of coal and coal chars: Development, tests, and uses. Fuel Process. Technol. 1983, 7, 11–22. [Google Scholar] [CrossRef]
  4. Sheta, S.; Afgan, M.S.; Hou, Z.; Yao, S.-C.; Zhang, L.; Li, Z.; Wang, Z. Coal analysis by laser-induced breakdown spectroscopy: A tutorial review. J. Anal. At. Spectrom. 2019, 34, 1047–1082. [Google Scholar] [CrossRef]
  5. Ikävalko, E.; Laitinen, T.; Revitzer, H. Optimised method of coal digestion for trace metal determination by atomic absorption spectroscopy. Fresenius J. Anal. Chem. 1999, 363, 314–316. [Google Scholar] [CrossRef]
  6. Baysal, A.; Akman, S. A practical method for the determination of sulphur in coal samples by high-resolution continuum source flame atomic absorption spectrometry. Talanta 2011, 85, 2662–2665. [Google Scholar] [CrossRef]
  7. Caroli, S.; Mazzeo, A.F.; Laurenzi, A.; Senofonte, O.; Violante, N. Determination of sulphur in coal products by inductively coupled plasma atomic emission spectrometry. J. Anal. At. Spectrom. 1988, 3, 245–248. [Google Scholar] [CrossRef]
  8. Iwashita, A.; Nakajima, T.; Takanashi, H.; Ohki, A.; Fujita, Y.; Yamashita, T. Effect of pretreatment conditions on the determination of major and trace elements in coal fly ash using ICP-AES. Fuel 2006, 85, 257–263. [Google Scholar] [CrossRef]
  9. Jia, W.-B.; Hei, D.-Q.; Xu, A.-G.; Chen, X.-W.; Li, A.-M. Influence of sample weight in coal composition online analysis by PGNAA. At. Energy Sci. Technol. 2011, 45, 1011. [Google Scholar]
  10. CLim, S.; Abernethy, D.A. On-line coal analysis using fast neutron-induced gamma-rays. Appl. Radiat. Isot. 2005, 63, 697–704. [Google Scholar]
  11. Yao, S.; Mo, J.; Zhao, J.; Li, Y.; Zhang, X.; Lu, W.; Lu, Z. Development of a Rapid Coal Analyzer Using Laser-Induced Breakdown Spectroscopy (LIBS). Appl. Spectrosc. 2018, 72, 1225–1233. [Google Scholar] [CrossRef]
  12. Li, W.; Dong, M.; Lu, S.; Li, S.; Wei, L.; Huang, J.; Lu, J. Improved measurement of the calorific value of pulverized coal particle flow by laser-induced breakdown spectroscopy (LIBS). Anal. Methods 2019, 11, 4471–4480. [Google Scholar] [CrossRef]
  13. Haider, A.F.M.Y.; Rony, M.A.; Lubna, R.S.; Abedin, K.M. Detection of multiple elements in coal samples from Bangladesh by laser-induced breakdown spectroscopy. Opt. Laser Technol. 2011, 43, 1405–1410. [Google Scholar] [CrossRef]
  14. Yao, S.; Qin, H.; Wang, Q.; Lu, Z.; Yao, X.; Yu, Z.; Chen, X.; Zhang, L.; Lu, J. Optimizing analysis of coal property using laser-induced breakdown and near-infrared reflectance spectroscopies. Spectrochim. Acta Part A Mol. Biomol. Spectrosc. 2020, 239, 118492. [Google Scholar] [CrossRef] [PubMed]
  15. Fu, Y.-T.; Gu, W.-L.; Hou, Z.-Y.; Muhammed, S.A.; Li, T.-Q.; Wang, Y.; Wang, Z. Mechanism of signal uncertainty generation for laser-induced breakdown spectroscopy. Front. Phys. 2020, 16, 22502. [Google Scholar] [CrossRef]
  16. Lestander, T.A.; Samuelsson, R. Prediction of Resin and Fatty Acid Content of Biorefinery Feedstock by On-line Near-Infrared (NIR) Spectroscopy. Energy Fuels 2010, 24, 5148–5152. [Google Scholar] [CrossRef]
  17. Tripathi, M.M.; Hassan, E.B.M.; Yueh, F.-Y.; Singh, J.P.; Steele, P.H.; Ingram, L.L. Reflection–absorption-based near infrared spectroscopy for predicting water content in bio-oil. Sens. Actuators B Chem. 2009, 136, 20–25. [Google Scholar] [CrossRef]
  18. Bona, M.; Andrés, J. Coal analysis by diffuse reflectance near-infrared spectroscopy: Hierarchical cluster and linear discriminant analysis. Talanta 2007, 72, 1423–1431. [Google Scholar] [CrossRef]
  19. Andrés, J.; Bona, M. Analysis of coal by diffuse reflectance near-infrared spectroscopy. Anal. Chim. Acta 2005, 535, 123–132. [Google Scholar] [CrossRef]
  20. Andrés, J.; Bona, M. ASTM clustering for improving coal analysis by near-infrared spectroscopy. Talanta 2006, 70, 711–719. [Google Scholar] [CrossRef]
  21. Wang, Y.; Yang, M.; Wei, G.; Hu, R.; Luo, Z.; Li, G. Improved PLS regression based on SVM classification for rapid analysis of coal properties by near-infrared reflectance spectroscopy. Sens. Actuators B Chem. 2014, 193, 723–729. [Google Scholar] [CrossRef]
  22. Wang, S.-H.; Zhao, Y.; Hu, R.; Zhang, Y.-Y.; Han, X.-H. Analysis of Near-Infrared Spectra of Coal Using Deep Synergy Adaptive Moving Window Partial Least Square Method Based on Genetic Algorithm. Chin. J. Anal. Chem. 2019, 47, e19034–e19044. [Google Scholar] [CrossRef]
  23. Begum, N.; Chakravarty, D.; Das, B.S. Estimation of Gross Calorific Value of Bituminous Coal using various Coal Properties and Reflectance Spectra. Int. J. Coal Prep. Util. 2019, 42, 979–985. [Google Scholar] [CrossRef]
  24. Shirazi, A.R.; Börtin, O.; Eklund, L.; Lindqvist, O. The impact of mineral matter in coal on its combustion, and a new approach to the determination of the calorific value of coal. Fuel 1995, 74, 247–251. [Google Scholar] [CrossRef]
  25. West, M.; Ellis, A.T.; Potts, P.J.; Streli, C.; Vanhoof, C.; Wobrauschek, P. 2015 Atomic Spectrometry Update—A review of advances in X-ray fluorescence spectrometry and their applications. J. Anal. At. Spectrom. 2015, 30, 1839–1889. [Google Scholar] [CrossRef]
  26. Ward, C.R.; Kelloway, S.J.; Vohra, J.; French, D.; Cohen, D.R.; Marjo, C.E.; Wainwright, I.E. In-situ inorganic analysis of coal seams using a hand-held field-portable XRF Analyser. Int. J. Coal Geol. 2018, 191, 172–188. [Google Scholar] [CrossRef]
  27. Vincze, L.; Somogyi, A.; Osán, J.; Vekemans, B.; Török, S.; Janssens, K.; Adams, F. Quantitative Trace Element Analysis of Individual Fly Ash Particles by Means of X-ray Microfluorescence. Anal. Chem. 2002, 74, 1128–1135. [Google Scholar] [CrossRef] [PubMed]
  28. Yan, Z.; XinLei, Z.; WenBao, J.; Qing, S.; YongSheng, L.; DaQian, H.; Da, C. Online X-ray Fluorescence (XRF) Analysis of Heavy Metals in Pulverized Coal on a Conveyor Belt. Appl. Spectrosc. 2016, 70, 272–278. [Google Scholar] [CrossRef] [PubMed]
  29. Redoglio, D.; Golinelli, E.; Musazzi, S.; Perini, U.; Barberis, F. A large depth of field LIBS measuring system for elemental analysis of moving samples of raw coal. Spectrochim. Acta Part B At. Spectrosc. 2016, 116, 46–50. [Google Scholar] [CrossRef]
  30. Borràs, E.; Ferré, J.; Boqué, R.; Mestres, M.; Aceña, L.; Busto, O. Data fusion methodologies for food and beverage authentication and quality assessment—A review. Anal. Chim. Acta 2015, 891, 1–14. [Google Scholar] [CrossRef]
  31. Moros, J.; Javier Laserna, J. Unveiling the identity of distant targets through advanced Raman-laser-induced breakdown spectroscopy data fusion strategies. Talanta 2015, 134, 627–639. [Google Scholar] [CrossRef] [PubMed]
Figure 1. Schematic diagram of the experimental setup (BW: beryllium window, CM: collimator, VG: vacuum gauge, VP: vacuum pump).
Chemosensors 11 00363 g001
Figure 2. The spectra of sample C18, (a) the raw NIRS spectrum, (b) the raw XRF spectrum, (c) the NIRS-XRF fusion spectrum after pre-processing.
Chemosensors 11 00363 g002
Figure 3. The Pearson correlation coefficients of all variables in the NIRS-XRF fusion spectrum.
Chemosensors 11 00363 g003
Figure 4. Comparison of the prediction performance of the models established with variables selected using different threshold values.
Chemosensors 11 00363 g004
Figure 5. Comparison of low-level fusion model and mid-level fusion model prediction performance; (a) low-level fusion model, (b) mid-level fusion model.
Chemosensors 11 00363 g005
Figure 6. Comparison between SDs of calorific values predicted by low-level fusion model and mid-level model.
Chemosensors 11 00363 g006
Table 1. The air-dried basis basic calorific values of the calibration set and prediction set in this experiment.
No.Calorific Value
(MJ/kg)
No.Calorific Value
(MJ/kg)
No.Calorific Value
(MJ/kg)
C124.11 ± 0.03C223.15 ± 0.05C321.14 ± 0.05
C423.65 ± 0.02C525.11 ± 0.05C623.41 ± 0.04
C721.32 ± 0.07C821.46 ± 0.04C923.06 ± 0.01
C1021.13 ± 0.04C1120.79 ± 0.06C1220.34 ± 0.08
C1320.54 ± 0.05C1423.84 ± 0.09C1522.41 ± 0.04
C1621.31 ± 0.04C1721.35 ± 0.07C1818.56 ± 0.07
C1923.24 ± 0.08C2023.49 ± 0.08C2123.23 ± 0.03
C2221.68 ± 0.03C2322.32 ± 0.01C2423.49 ± 0.01
C2521.36 ± 0.04C2622.35 ± 0.04C2722.85 ± 0.04
C2824.04 ± 0.07C2926.77 ± 0.03C3022.61 ± 0.09
P122.48 ± 0.04P224.51 ± 0.02P321.27 ± 0.07
P422.08 ± 0.06P519.90 ± 0.03
Table 2. Comparison of the prediction performance of the models established using different methods.
MethodR2RMSEP (MJ/kg)MARDP (%)
NIRS0.950.331.21
XRF0.940.391.60
NIRS-XRF0.980.190.95
Table 3. Number of variables and calculation speed at different threshold values.
tNumber of VariablesCalculation Time (s)tNumber of VariablesCalculation Time (s)
0.037390.3090.414060.106
0.131880.2670.57630.074
0.226730.1750.62980.052
0.323020.1510.7750.041
Disclaimer/Publisher’s Note: The statements, opinions and data contained in all publications are solely those of the individual author(s) and contributor(s) and not of MDPI and/or the editor(s). MDPI and/or the editor(s) disclaim responsibility for any injury to people or property resulting from any ideas, methods, instructions or products referred to in the content.

