Article

Additional Enhancement of Surface-Enhanced Raman Scattering Spectra of Myoglobin Precipitated under Action of Laser Irradiation on Self-Assembled Nanostructured Surface of Ag Films

by
Irina A. Boginskaya
1,*,
Ekaterina A. Slipchenko
1,
Marina V. Sedova
1,
Julia Yu. Zvyagina
1,
Alexander D. Maximov
2,
Aleksandr S. Baburin
3,4,
Ilya A. Rodionov
3,4,
Alexander M. Merzlikin
1,
Ilya A. Ryzhikov
1,3 and
Andrey N. Lagarkov
1
1
Institute for Theoretical and Applied Electromagnetics RAS, Moscow 125412, Russia
2
Physics Department, MIREA-Russian Technological University, Moscow 119454, Russia
3
FMN Laboratory, Bauman Moscow State Technical University, Moscow 105005, Russia
4
Dukhov Automatics Research Institute, (VNIIA), Moscow 127055, Russia
*
Author to whom correspondence should be addressed.
Chemosensors 2023, 11(6), 321; https://doi.org/10.3390/chemosensors11060321
Submission received: 18 April 2023 / Revised: 19 May 2023 / Accepted: 25 May 2023 / Published: 1 June 2023
(This article belongs to the Special Issue SERS: Analytical and Biological Challenges)

Abstract

:
The modifications of the microstructure of myoglobin deposited onto SERS-active Ag-based substrates by drying a drop of aqueous solution with and without laser irradiation and the corresponding surface-enhanced Raman scattering (SERS) spectra are studied. It is shown that drying with laser irradiation leads to the formation of protein aggregates of various types, including crystal-like aggregates. It is also shown that after such drying, the aggregates generally have SERS spectra characterized by a change in the position of the vibration bands and the ratios of their amplitudes compared to the spectra of proteins dried without additional treatment. In particular, parts of the SERS spectra of aggregates formed under laser irradiation are characterized by an additional enhancement (up to 100×) compared to the SERS spectra of myoglobin dried in air at room temperature. The crystallization processes were modeled using the results of atomic force microscopy morphology studies of dried myoglobin on the SERS-active substrates to determine the conditions under which crystal-like aggregates start to grow at surface irregularities, specifically those with a volume close to that of the critical-size nucleus, and where the lowest energy of formation occurs. A correlation is established between surface irregularities, the amplitude, and the change in the SERS spectra during the drying of a myoglobin solution sample on a nanostructured Ag-based surface.

1. Introduction

The detection of blood plasma proteins at low concentrations is important in clinical practice. In particular, a method for the rapid detection of low concentrations of myoglobin in blood plasma, a marker of myocardial infarction, is urgently needed [1].
Proteins at low concentrations can be detected from a surface-enhanced Raman scattering (SERS) spectrum [2,3,4,5,6]. To obtain a SERS spectrum, the analyte is deposited onto a SERS-active substrate based on thin films of noble metals or colloidal solutions of Ag or Au nanoparticles. However, the fabrication of such substrates typically requires complex and expensive processes, such as electron lithography, plasma chemical etching, and chemical synthesis [7,8,9,10,11,12,13,14]. The simplification of the fabrication process while maintaining high substrate sensitivity is thus a priority.
The vacuum deposition of metal films combined with various surface treatment technologies has been used to fabricate substrates with various surface characteristics [5,15,16,17,18,19,20]. By controlling the process parameters (e.g., substrate temperature, precursor sputtering rate, and chamber pressure), it is possible to obtain SERS-active substrates in the form of thin metal films with various morphologies. This fabrication process requires a smaller amount of equipment compared to that for other methods, such as plasma chemical etching and electron lithography, making it promising for mass production.
We previously developed a technology for manufacturing SERS-active substrates based on electron-beam evaporation in vacuum for acquiring Raman spectra [5,21]. These substrates were found to be suitable for the study of viruses and proteins such as myoglobin and albumin, where a drop of an analyte solution dropped onto the substrates is dried in air at room temperature [3,5,22,23,24]. To extend this earlier study, we consider the sample preparation in more detail here since transferring an analyte from solution to a special condensed state on the substrate surface, which determines the amplitude and vibrational band ensemble of the SERS spectra, is important. The present work develops a set of methods and technologies for sample preparation that ensure the acquisition of SERS spectra for proteins from low-concentration solutions.
A sample preparation method that ensures the formation of a dried concentrated analyte substance on the surface of a metal substrate is crucial for creating the required conformation of the analyte on the surface and ensuring the optimal conditions for the adhesion of the analyte to the SERS-active substrate surface. The proposed drying method is simple and convenient since it requires a minimum amount of the analyte, on the order of several microliters, and a minimum sample preparation time. This process compares favorably with the use of colloidal solutions of nanoparticles since it does not require a chemisorption process using additional reagents, the precise control of the pH of the solution, a long sample preparation time, or various methods of surface modification using antibodies, which take several hours and require a number of expensive reagents. However, as shown in a previous study [5], this process requires the use of SERS-active substrates with a certain surface morphology.
In this work, an improved sample preparation method, in which laser irradiation at a frequency of the wavelength used to excite the spectrum is applied to the analyte, is presented. This procedure affects the conformation of the analyte and leads to the formation of crystal-like faceted analyte particles in the areas of substrates with a distinct SERS effect due to the localization of the field in the exitation wavelength [25].
It should be noted that a number of widely used laser processes for obtaining individual protein crystals are described in the literature. In the study of Iefuji et al. [26], nuclei were formed via the local supersaturation of the analyte solution around cavitation bubbles formed under the action of a picosecond laser. It was also shown that under such conditions, protein denaturation in colloidal solutions with Au particles occurs via a thermal, photochemical, or cavitation mechanism [27]. However, in the above works, a high protein concentration, the use of additional salts, and several hours of preparation were required. In addition, the processes are inapplicable to sample preparation for SERS analysis.
In this work, we apply laser irradiation to the sample preparation of myoglobin. This treatment increases the SERS signal on planar nanostructured self-assembled Ag films, which have been shown to be effective SERS-active substrates [5], and SERS-active substrates obtained using vacuum electron-beam evaporation. The SERS spectra of the protein precipitate on the surface of the substrate (obtained via drying) are measured and analyzed. Based on atomic force microscopy (AFM) data, the influence of substrate morphology parameters on the growth probability of crystal-like protein aggregates on surface irregularities is studied using thermodynamic concepts of nucleation processes. The obtained SERS spectra are found to contain patterns caused by the formation of three types of myoglobin deposits, two of which arise as a result of sample preparation with laser irradiation and are characterized by a two-order-of-magnitude increase in the SERS signal compared to that obtained with conventional drying in air. The consistent pattern of an increasing SERS signal is studied.

2. Materials and Methods

2.1. Preparation of Myoglobin Solutions

Freshly prepared solutions of myoglobin (Sigma-Aldrich, St. Louis, MO, USA) at concentrations of 60 and 0.6 nM in deionized water (Milli-Q, Merk, Darmstadt, Germany) were used in this work.

2.2. Substrate Fabrication

SERS-active substrates were prepared using electron-beam evaporation in vacuum of granular silver (Moscow Special Alloys Processing Plant, Moscow, Russia; purity: 99.99%) by a 10-kW electron-beam evaporator (Angstrom Engineering, Cambridge, ON, Canada) on a mica (001) surface. Before deposition, the mica surface was washed with isopropyl alcohol (Sigma-Aldrich, St. Louis, MO, USA). The deposition rate was 1 Å/s, and the substrate temperature was 300 K. The thickness of the films during deposition was controlled directly using optical control. After deposition, the film thickness was selectively measured using a stylus profilometer. The thickness of the obtained films was about 300 nm.

2.3. Sample Preparation of Analytes

Myoglobin solution aliquots with a volume of 3 µL were deposited onto the surface of the substrate using a highly precise pipette. The myoglobin droplets were dried in air without additional treatment and under the action of a defocused, p-polarized laser beam with a wavelength of 785 nm and a power of 112 mW (Toptica Photonics, Gräfelfing, Germany) embedded in a Raman spectrometer (WITec, Ulm, Germany). Measurements of the SERS spectra were carried out for the resulting precipitate. Optical images of the dried myoglobin precipitate were obtained using an optical microscope (Zeiss Microscopy GmbH, Jena, Germany) with an Epiplan Neofluar 50×/0.8 lens (Zeiss Microscopy GmbH, Jena, Germany).

2.4. Spectra Measurements

SERS spectra were measured using a Raman spectrometer (Alpha 300R+, WITec, Ulm, Germany) based on a confocal microscope using an Epiplan Neofluar 50×/0.8 lens (Zeiss Microscopy GmbH, Jena, Germany). The excitation wavelength was 785 nm, and the laser power was 54 mW. The accumulation time of the spectra was 60 s for the air-dried samples and 10 s for the laser-prepared samples (due to the high intensity of the spectra). Five drops were formed for each type of sample preparation method (with or without laser irradiation) and for each concentration. 15 spectra were measured for each drop. The spectra of samples dried without laser irradiation were used as controls.

2.5. Spectra Processing

The spectra were processed using the OPUS base package (version 7.0; Bruker, Billerica, MA, USA). The baseline was subtracted using the rubber band correction algorithm built into OPUS. The spectra were corrected to the same accumulation time via multiplication by a coefficient of 6. The spectra for each type of sample preparation method were averaged, and the standard deviation was calculated to assess reproducibility.

2.6. Surface Morphology Studies

Surface morphology was investigated using AFM (Solver PRO, NT-MDT, Zelenograd, Russia). Images were taken in tapping mode. Probes (HA_NC/Au probe series, NT-MDT) with a resonance frequency of 140 kHz ± 10%, a force constant of 3.5 N/m, and a tip radius of less than 10 nm were used. The microstructure of the substrate surface based on AFM images of the surface was analyzed using Gwyddion software (version 2.60; CME, Brno, Czech Republic) with built-in algorithms for calculating the roughness parameters according to ISO 4287:1997.
Additionally, SEM investigation of surfaces was performed with a Zeiss Merlin scanning electron microscope (Zeiss Microscopy GmbH, Jena, Germany). SEM images were obtained using an in-lens detector and an accelerating voltage of 5 kV; the working distance from the sample to the detector was 2.2 mm.

3. Results

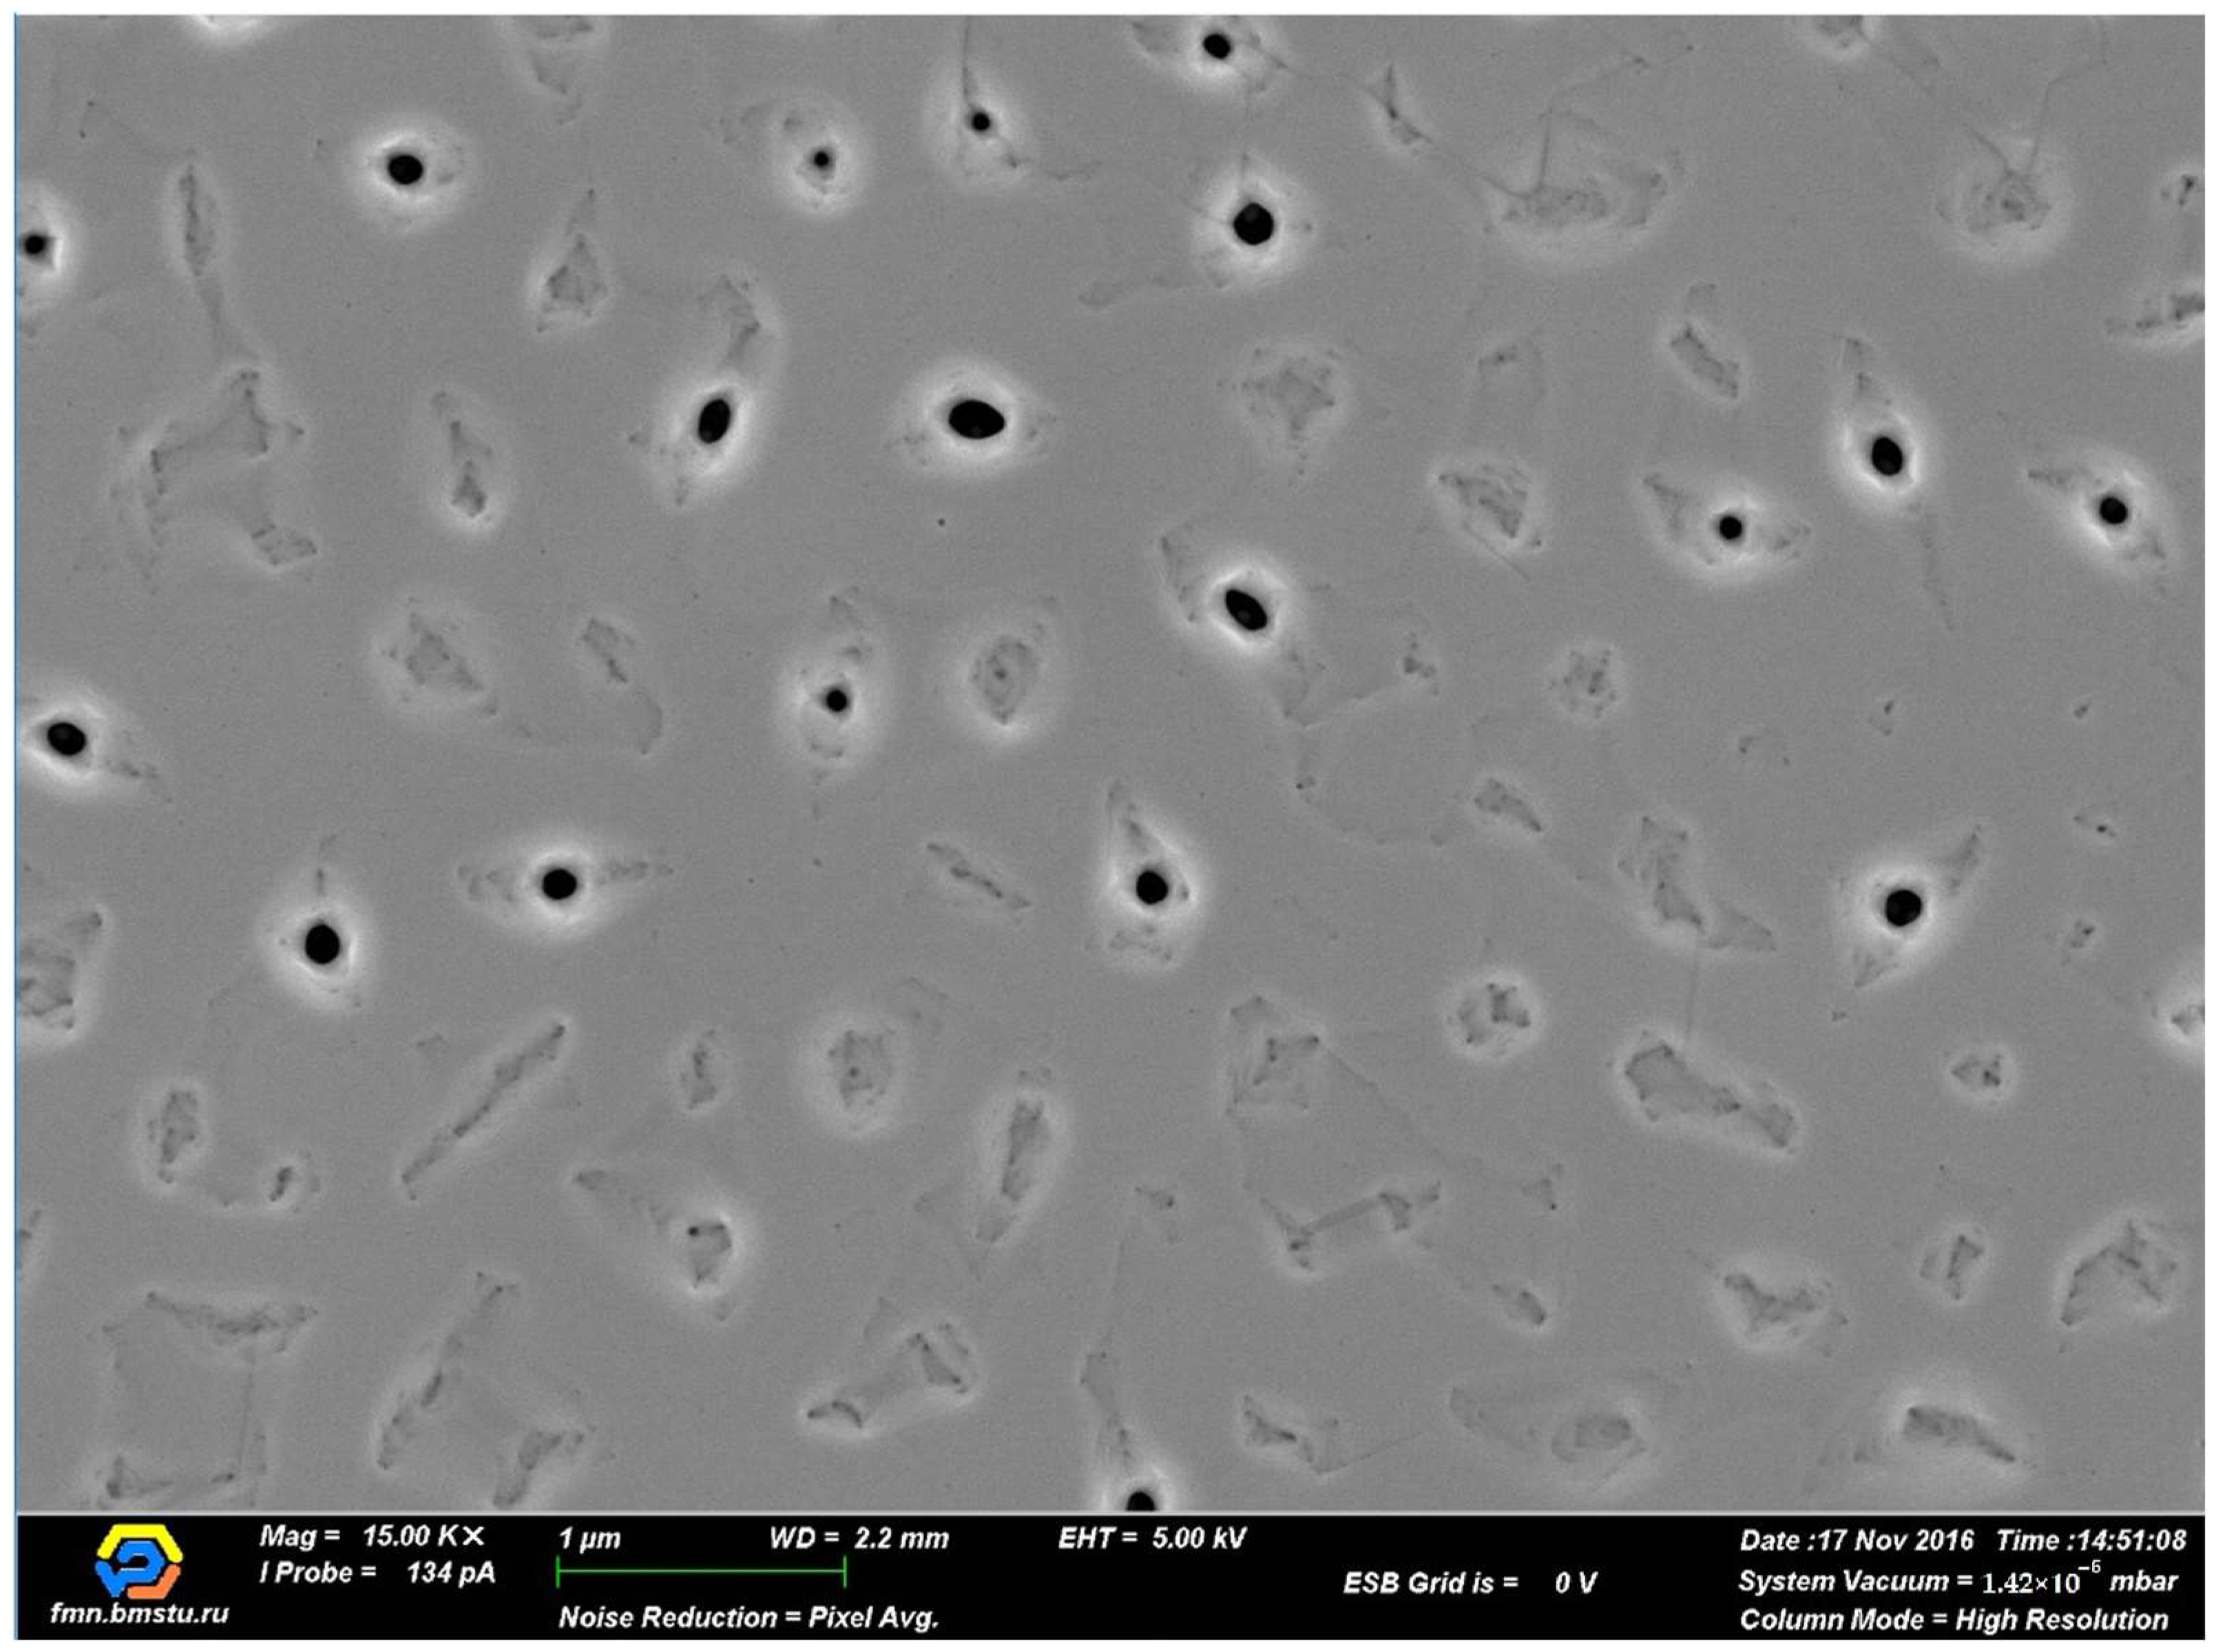
3.1. Microstructure Analysis

The SEM investigation result and the typical morphology image is shown in Figure 1.
Figure 1 shows that the surface is a set of extended plateaus formed by single-crystal regions of the silver film at the junctions of which surface inhomogeneities are formed and the structure cannot be studied in detail with SEM. For a more detailed study and confirmation of SEM results, let us look at the results of a surface study using AFM. The AFM morphology of the SERS films used in the experiment is shown in Figure 2.
As shown in Figure 2, the film is characterized by the presence of regular inhomogeneities in the nanostructure, which we define as surface irregularities. These irregularities are especially clearly visible in Figure 2b,d. Their depth is quite large, reaching 25 nm, compared to the common roughness. The structure of the surface irregularities is shown in more detail in Figure 2d. A morphology analysis using Gwyddion software and its built-in algorithms for analyzing surface parameters shows that the effective size of the nanostructure surface irregularities is 127 nm and that the average surface area occupied by them is 12.5%. In this case, the calculated root-mean-square roughness R q of the films is less than 5 nm. According to ISO 4287:1997, the parameter R 3 Z (i.e., the height between the third highest peak and the third lowest valley) can be used to assess the size of surface irregularities. Here, R 3 Z = 13 nm. This parameter gives an estimate of the size of local heterogeneity compared to the overall surface. The substrate can be described as a set of planar regions with low roughness, at the junctions of which surface irregularities form. An irregular surface can be approximated by a sector of a circle with a conical shape and an average apex angle of around 50°. This is later used to analyze the nucleation process of myoglobin crystallites at these features using the method described in Section 3.3.2. Such film growth was investigated in a previous study [5] on the preparation of single-crystal Au films. When the growth process of single crystals is disrupted, one can observe the formation of extended plateaus, at the junctions of which folded cone-shaped grooves appear (surface irregularities). In our case, we observed extended plateaus, the effective size of which is described by the parameter λ a (the wavelength of the profile according to ISO 4287:1997), which is 560 nm for our substrate.
This combination of the surface morphology parameters R q , R 3 Z , and λ a makes the film optically homogeneous, which is indicated by a low root-mean-square roughness and a rather large λ a . The film is likely SERS-active due to the high R 3 Z . The optimal combinations of parameters were examined in detail in our previous work [5]. It is presumed that under the action of laser radiation, the electromagnetic field will become localized at nanostructure irregularities. In addition, a film with a thickness of about 300 nm dissipates heat, allowing the measurement of spectra with long accumulation times and power levels of about 54 mW.

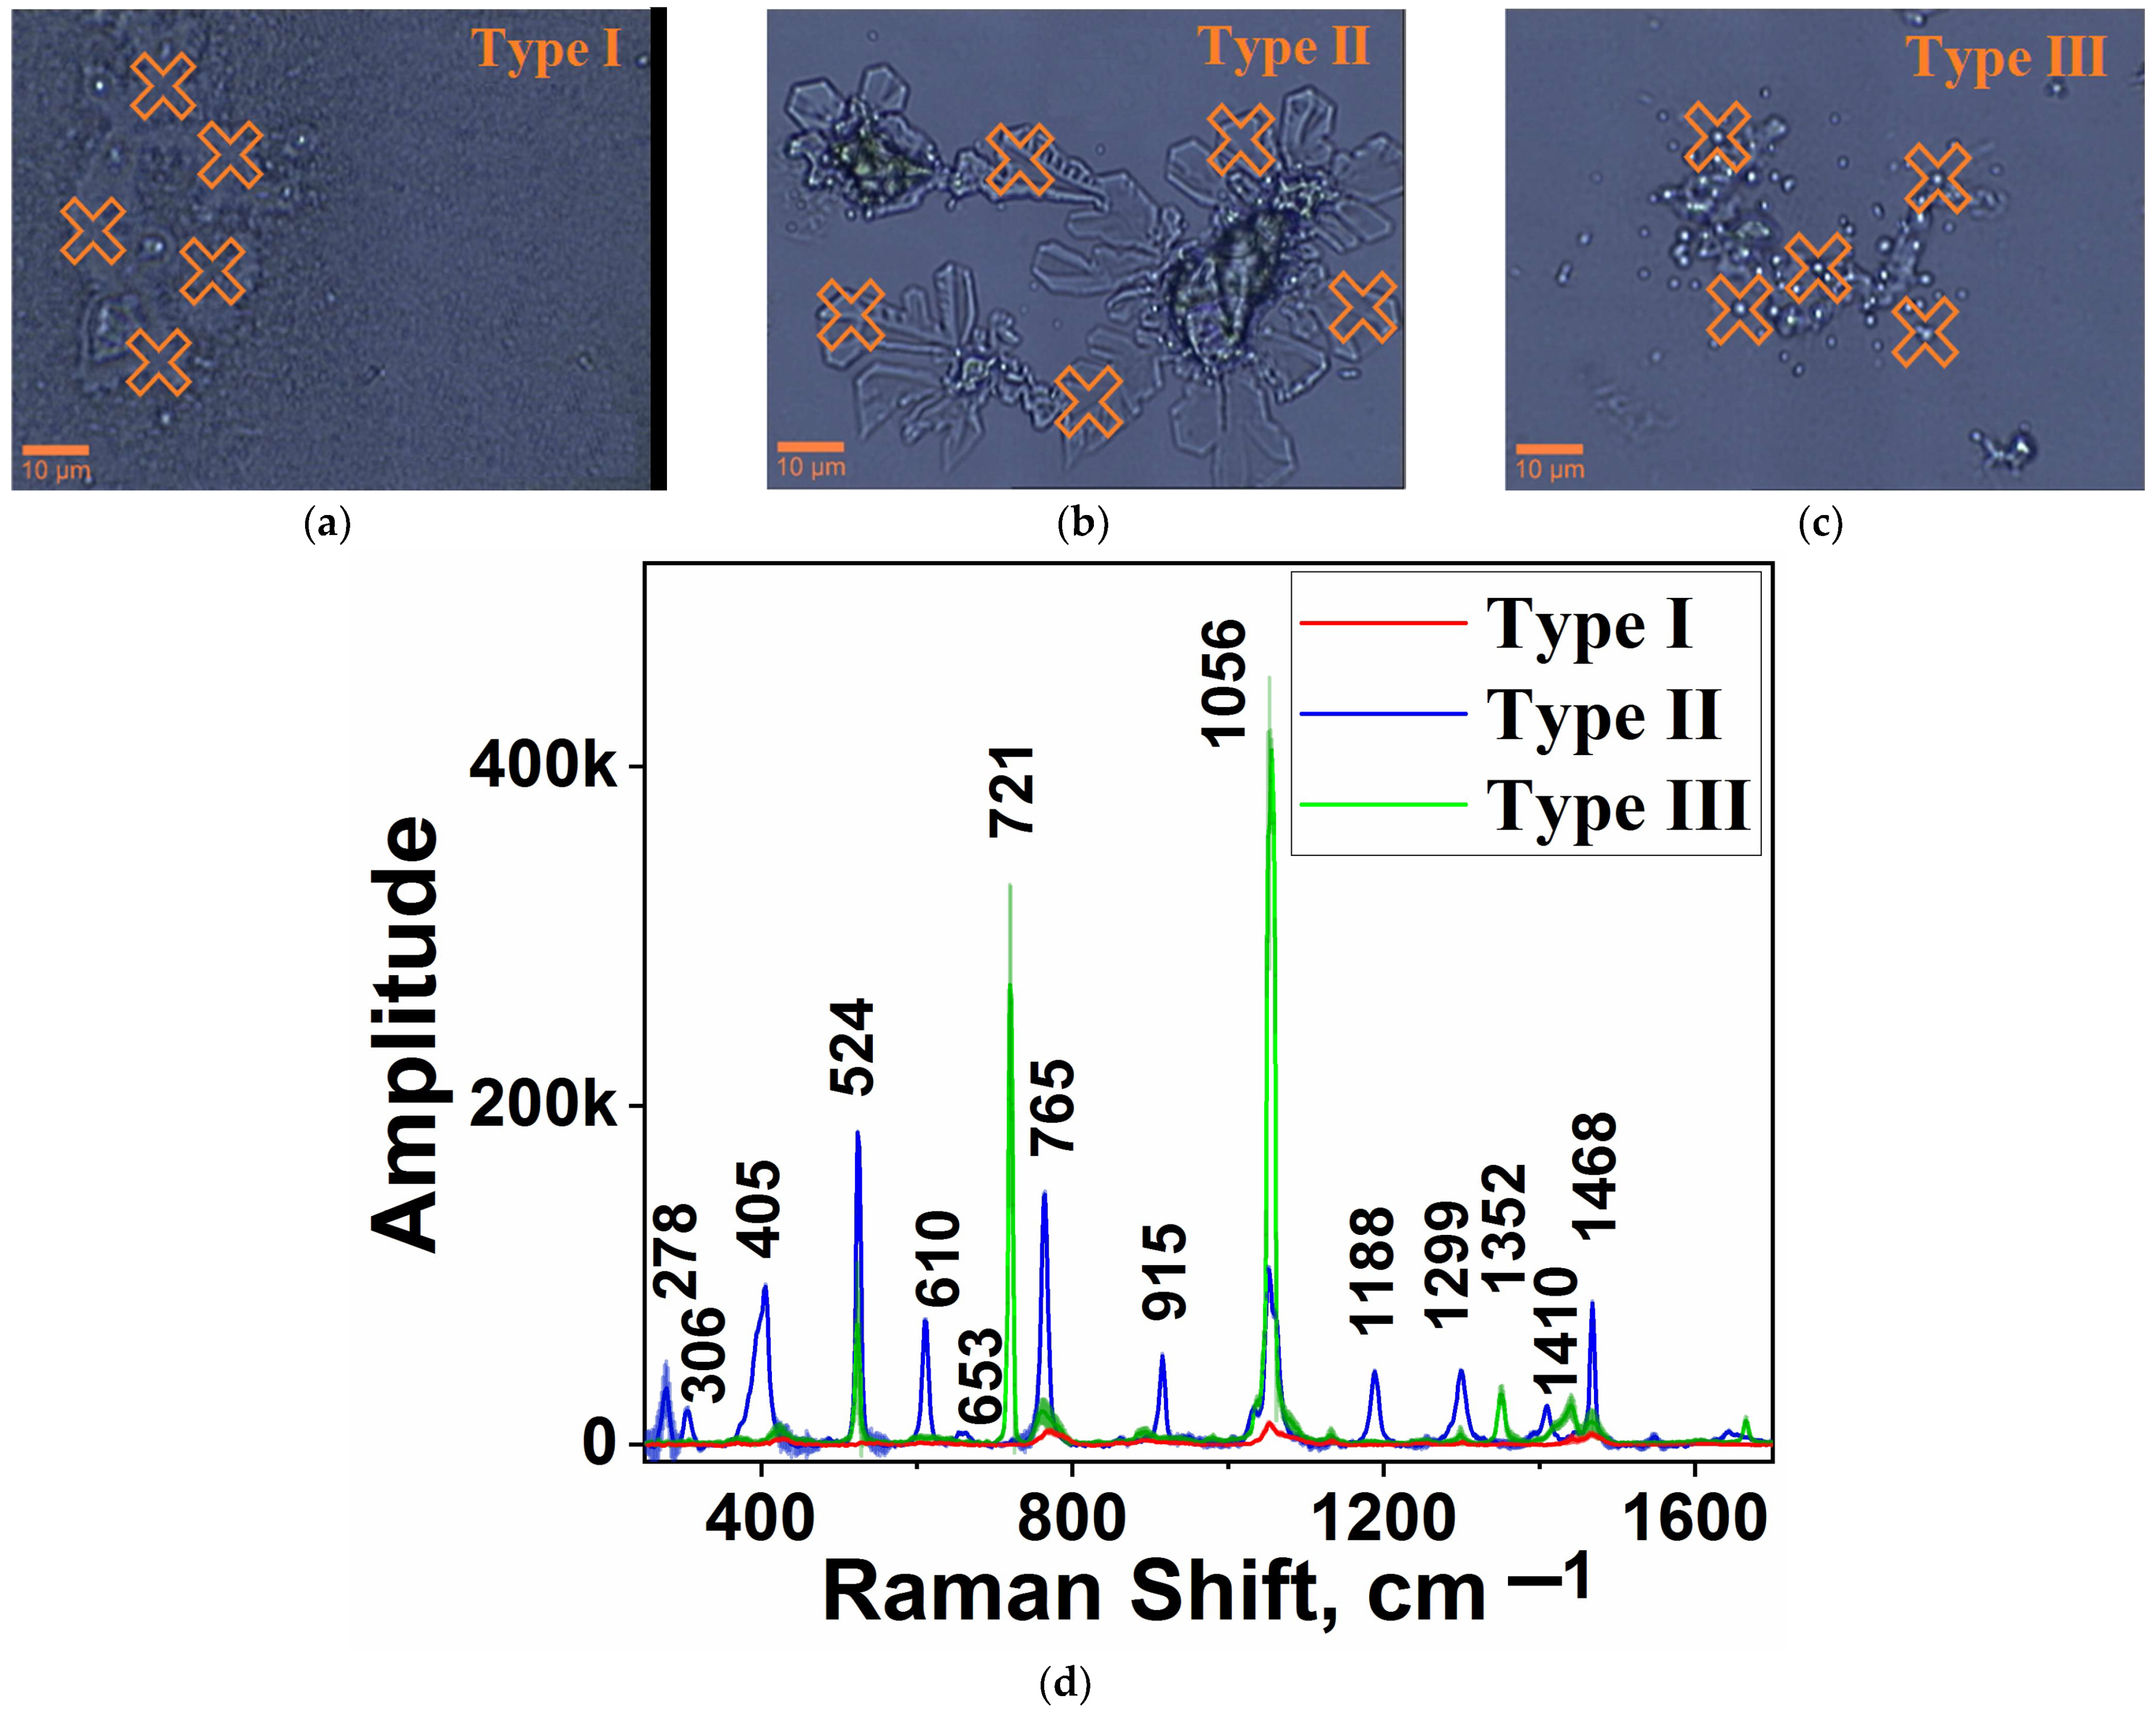
3.2. SERS Spectra of Myoglobin

After evaluating the morphology of surface irregularities, we studied the SERS spectra of myoglobin from solutions with various concentrations, dried with and without laser irradiation. The measured SERS spectra and optical images of the precipitate from three typical forms of myoglobin were obtained by drying protein solutions with various methods of sample preparation and are shown in Figure 3. The averaged SERS spectra and their standard deviations are shown.
The drying process resulted in the formation of three types of precipitate. Figure 3 shows typical images for each type. As shown in Figure 3a, sample preparation using drying in air without laser irradiation leads to the formation of amorphous structures, denoted here as type I. The precipitate from a drop of solution is a complex of agglomerates of various sizes, each of which is similar to that shown in Figure 3a. The SERS spectrum corresponding to type I is shown in Figure 3d in red. It is considered to be the control.
Drying with laser irradiation resulted in the formation of two types of structures, namely crystal-like aggregates whose morphology depends on the concentration of the dried solution. Type II (Figure 3b), formed at a concentration of 60 nM, consists of crystals with pronounced faceting. Type III (Figure 3c), formed at a concentration of 0.6 nM, consists of crystal dots (indicated by a white dot at the center of an orange cross). The size of the crystal dots for type III is much smaller than that of the crystals with pronounced faceting for type II. This is most likely due to the lack of material for the growth of a pronounced crystal at a lower concentration of myoglobin. This also indicates that the number of nucleation centers is quite large. Due to optical limitations, the crystallinity could not be observed. This is discussed in more detail in the section on AFM studies. The formation of crystal-like aggregates led to noticeable changes in the SERS spectra compared to those for sample preparation without laser irradiation. The types of spectra obtained for these structures differ from each other and from those obtained for the control. They are characterized by a significant increase in amplitude compared to that of the control. The typical areas from which the spectra were obtained are the centers of the orange crosses in Figure 3. For type I, the precipitate is flat, and thus the same spectrum is obtained throughout the surface. The aggregates of types II and III are also characterized by the same spectra throughout the surface. For the same sample preparation with laser irradiation on Ag films but with different morphology parameters [5], different results without pronounced faceted aggregates were observed. Only for a polycrystalline film with roughness parameters, R q = 1.9 nm, R 3 Z = 10 nm, and λ a = 196 nm, with surface irregularities with an average size of 62 nm and occupying less than 1% of the total area, the growth of type III crystal-like micro-objects was observed for preparation with laser irradiation (about 10 units of the crystallite for a lens field of view of 50×/0.8).
A primary comparison of the amplitudes of the SERS spectra for the three types of precipitate shows a two-order-of-magnitude increase in amplitude for types II and III compared to the control (type I). Most of the vibration bands for type II retain their position relative to the control vibration bands. Noticeable differences are observed for type III, where two bands dominate. The maximum type III oscillation band coincides with the maximum control band. For type II and the control, there is no oscillation band corresponding to the second-largest band for type III. The amplitude, shift, appearance, and disappearance of vibration bands in protein spectra are directly related to the conformation and orientation relative to the centers of enhancement of the electromagnetic field on the surface. Based on an analysis of the changes in the spectra of various types of proteins and the interpretation of the bands of vibrations in the spectra (see Table 1), an analysis of possible conformations of molecules during sample preparation was carried out.
The interpretation of the vibration bands in all spectra, taking into account their relative shift, is given in Table 1.
The observed changes in the position of the skeletal deformational bands within the range of 200–500 cm−1 most likely indicate a change in the conformation of the myoglobin molecule during laser drying.
Since the surface of nanostructured Ag films in an aqueous solution can have a positive charge [30,34], it can be assumed that myoglobin molecules are oriented towards the substrate by a region dominated by negatively charged Glu and Asp amino acids, aromatic amino acids (due to the system of π orbitals in the aromatic system), and sulfur-containing amino acids. For myoglobin, methionine is the only sulfur-containing amino acid. To assess the preferential orientation of the myoglobin molecule relative to the substrate during usual air drying, a previously reported model of the myoglobin molecule in RCSB PDB [35] was used, in which areas where negatively charged amino acids, methionine, and aromatic amino acids are concentrated are highlighted in color. It is presumed that the regions of the molecule enriched in the above amino acids will be oriented toward the substrate surface. They are thus likely to attract the entire molecule to the substrate, which ensures good contact with the surface and leads to high-amplitude SERS spectra. Table 1 shows the vibration bands for all the listed amino acids. The bands are at 1066, 1252, and 1352 cm−1 for negatively charged Glu, 927 cm−1 for negatively charged Asp, 1052 cm−1 for aromatic Phe, 854 and 1607 cm−1 for aromatic Tyr, 892 and 1352 cm−1 for aromatic Trp, and 627 and 1352 cm−1 for sulfur-containing Met. The Met band at 627 cm−1, which is directly due to C-S vibration, is characterized by a low amplitude due to the low content of Met in the myoglobin molecule (only two units per molecule). The observed in-spectra Asp vibration band is attributed precisely to C-COO vibration, which is consistent with literature data on the surface charge. For the aromatic amino acid Phe, there is a very strong vibration directly from the aromatic ring at 1552 cm−1, and for the aromatic amino acid Trp, there is a strong indole vibration at 770 cm−1. There are bands due to heme vibration at 1299, 1391, and 1607 cm−1. Heme, a coordination compound of iron in myoglobin, is responsible for oxygen transfer. The heme vibrational band suggests that the molecule is oriented by heme to the substrate. Since heme is located inside the molecule and does not interact directly with the surface, its vibration bands are quite weak in the type I spectrum. It can be argued that despite the shift of the main vibration band of myoglobin Phe from 1001–1008 cm−1 to 1054 cm−1, the molecule remains close to its native conformation, as evidenced by the retention of α-helix vibration bands at 927 cm−1 and Amide III at 1252 cm−1 for myoglobin [2].
It should be noted that the spectra show vibration bands that can be attributed to the dipeptides Leu–Gly, Ala–Ala, Pro–Leu, and Ala–Gln, which are quite rare in the myoglobin molecule. Their appearance thus determines the position of the molecule relative to the substrate. Based on the above assumptions, Figure 4 shows the orientation of the molecule of air-dried myoglobin (type I) relative to the substrate.
Figure 4 shows that the Met and heme positions determine the rotation of the molecule relative to the substrate because they are located uniquely, especially Met, since there are only two Met units in myoglobin. The second Met is inside the molecule and is not visible in Figure 4; nevertheless, it is also located close to the substrate. Negatively charged amino acids are located rather uniformly on the surface of the molecule, and dipeptides and aromatic amino acids are concentrated close to the heme position. Generally, a molecule can be fixed to the surface at surface irregularities (see Section 3.1).
Drying under the action of a laser produced a significant change in the type II and III spectra compared to that for the control. In general, the main vibrational bands are preserved, but their positions and amplitudes change. For example, S-S oscillations are observed for all three types of spectra, which indicates that the molecule most likely binds to the surface through sulfur, which is typical for the interaction of proteins with sulfur-containing amino acids and Ag substrates [30]. There are only two Met molecules in myoglobin, and thus the appearance of a weak C-S vibrational band is expected. There is some shift in their positions due to conformational changes: for type I, they are at 627 cm−1, for type II, they are at 653 and 663 cm−1, and for type III, they are at 625 and 644 cm−1.
A similar situation is observed for heme oscillations. For type I, heme vibrations are observed at 1299, 1391, and 1607 cm−1. For type II, they are at 1299, 1392, 1549, and 1643 cm−1. For type III, only a band at 1352 cm−1 is observed, which is the same as the position for type I. For type II, the number of heme vibration bands increases, apparently due to the formation of an unknown conformation. We can only assume that the formation of this conformation is associated with the action of ponderomotive forces and laser exposure, which leads to a rearrangement and new protein folding as the bands attributed to the oscillation of the α-helix and amide III disappear. The new structure is characterized by the formation of crystalline micro-objects, which is confirmed not only visually, especially for type II, but also by the appearance of narrower spectral bands. A comparison of the spectra for types I and II indicates that the spectra for the latter type mostly retains the positions of the main maximum oscillation bands, but these bands are noticeably narrower in terms of the half-width and larger in amplitude. At the same time, the previously low-amplitude oscillation bands increase in amplitude. The general increase in amplitude cannot be explained only by an increase in the size of the analyte, since according to the data of optical profilometry and AFM studies (given below), the amplitude is similar for types I and II. The narrowing of the vibration band width is characteristic of structure ordering, that is, the transition from an amorphous structure with no short-range order to the formation of a structure with long-range order. Moreover, for type II, most of the peaks observed in the spectrum of type I participate in the same way in the formation of a crystal with a pronounced faceting. The four maximum amplitude bands for type I, namely 770 cm−1 (Trp), 1052 cm−1 (Phe), 1066 cm−1 (Glu), and 1467 cm−1 (Lys), remain the same for type II, which indicates that the structure is ordered through these bonds, that is, they preferentially form a periodic structure. We also observe the presence of bands responsible for the interaction of the molecule with the substrate (for Met at 653, 663, and 1549 cm−1, for negatively charged Glu at 1061 and 1352 cm−1) and do not observe Asp vibrations. This indicates that during the formation of the new conformation in type II, aromatic amino acids and, for an unknown reason, positively charged Lys preferentially participate in the ordering. For type II, we observe heme bands at 1299, 1392, 1549, and 1643 cm−1, where the first two bands coincide with type I, which may indicate a partial preservation of their orientation in the molecule during the formation of a crystal with pronounced faceting.
A new process occurs for type III. The Phe band at 1056 cm−1 and the Asp band at 721 cm−1 become dominant and are characterized by an extremely high aspect ratio. The number of bands for type III decreased by 25% compared to that for type II. At the same time, we observe important bands such as Met at 625 and 644 cm−1, and heme only retained its position at 1300 cm−1 compared to types I and II. Crystalline dots, which produce the type III spectrum, do not appear faceted under an optical microscope due to the insufficient resolution of the microscope. However, an AFM study (described below) indicates the presence of faceting. The predominance of a limited number of high-amplitude vibrational bands in the spectrum indicates that crystal dots form at low concentrations, where ordering is achieved by interaction preferentially through aromatic structures and then through negatively charged Glu. It is likely that under the action of a laser and due to the appearance of ponderomotive forces, the native conformation is destroyed, leading to the release of aromatic amino acids for the formation of a new conformation of myoglobin. These amino acids are oriented in a new way during laser irradiation due to charge effects. With increasing concentrations of the solution, other amino acids have an opportunity to participate in the formation of long-range-order crystals, which leads to the growth of larger crystals and a change in the type of spectrum from type III to type II.

3.3. Study of Morphological Parameters of Myoglobin Precipitate

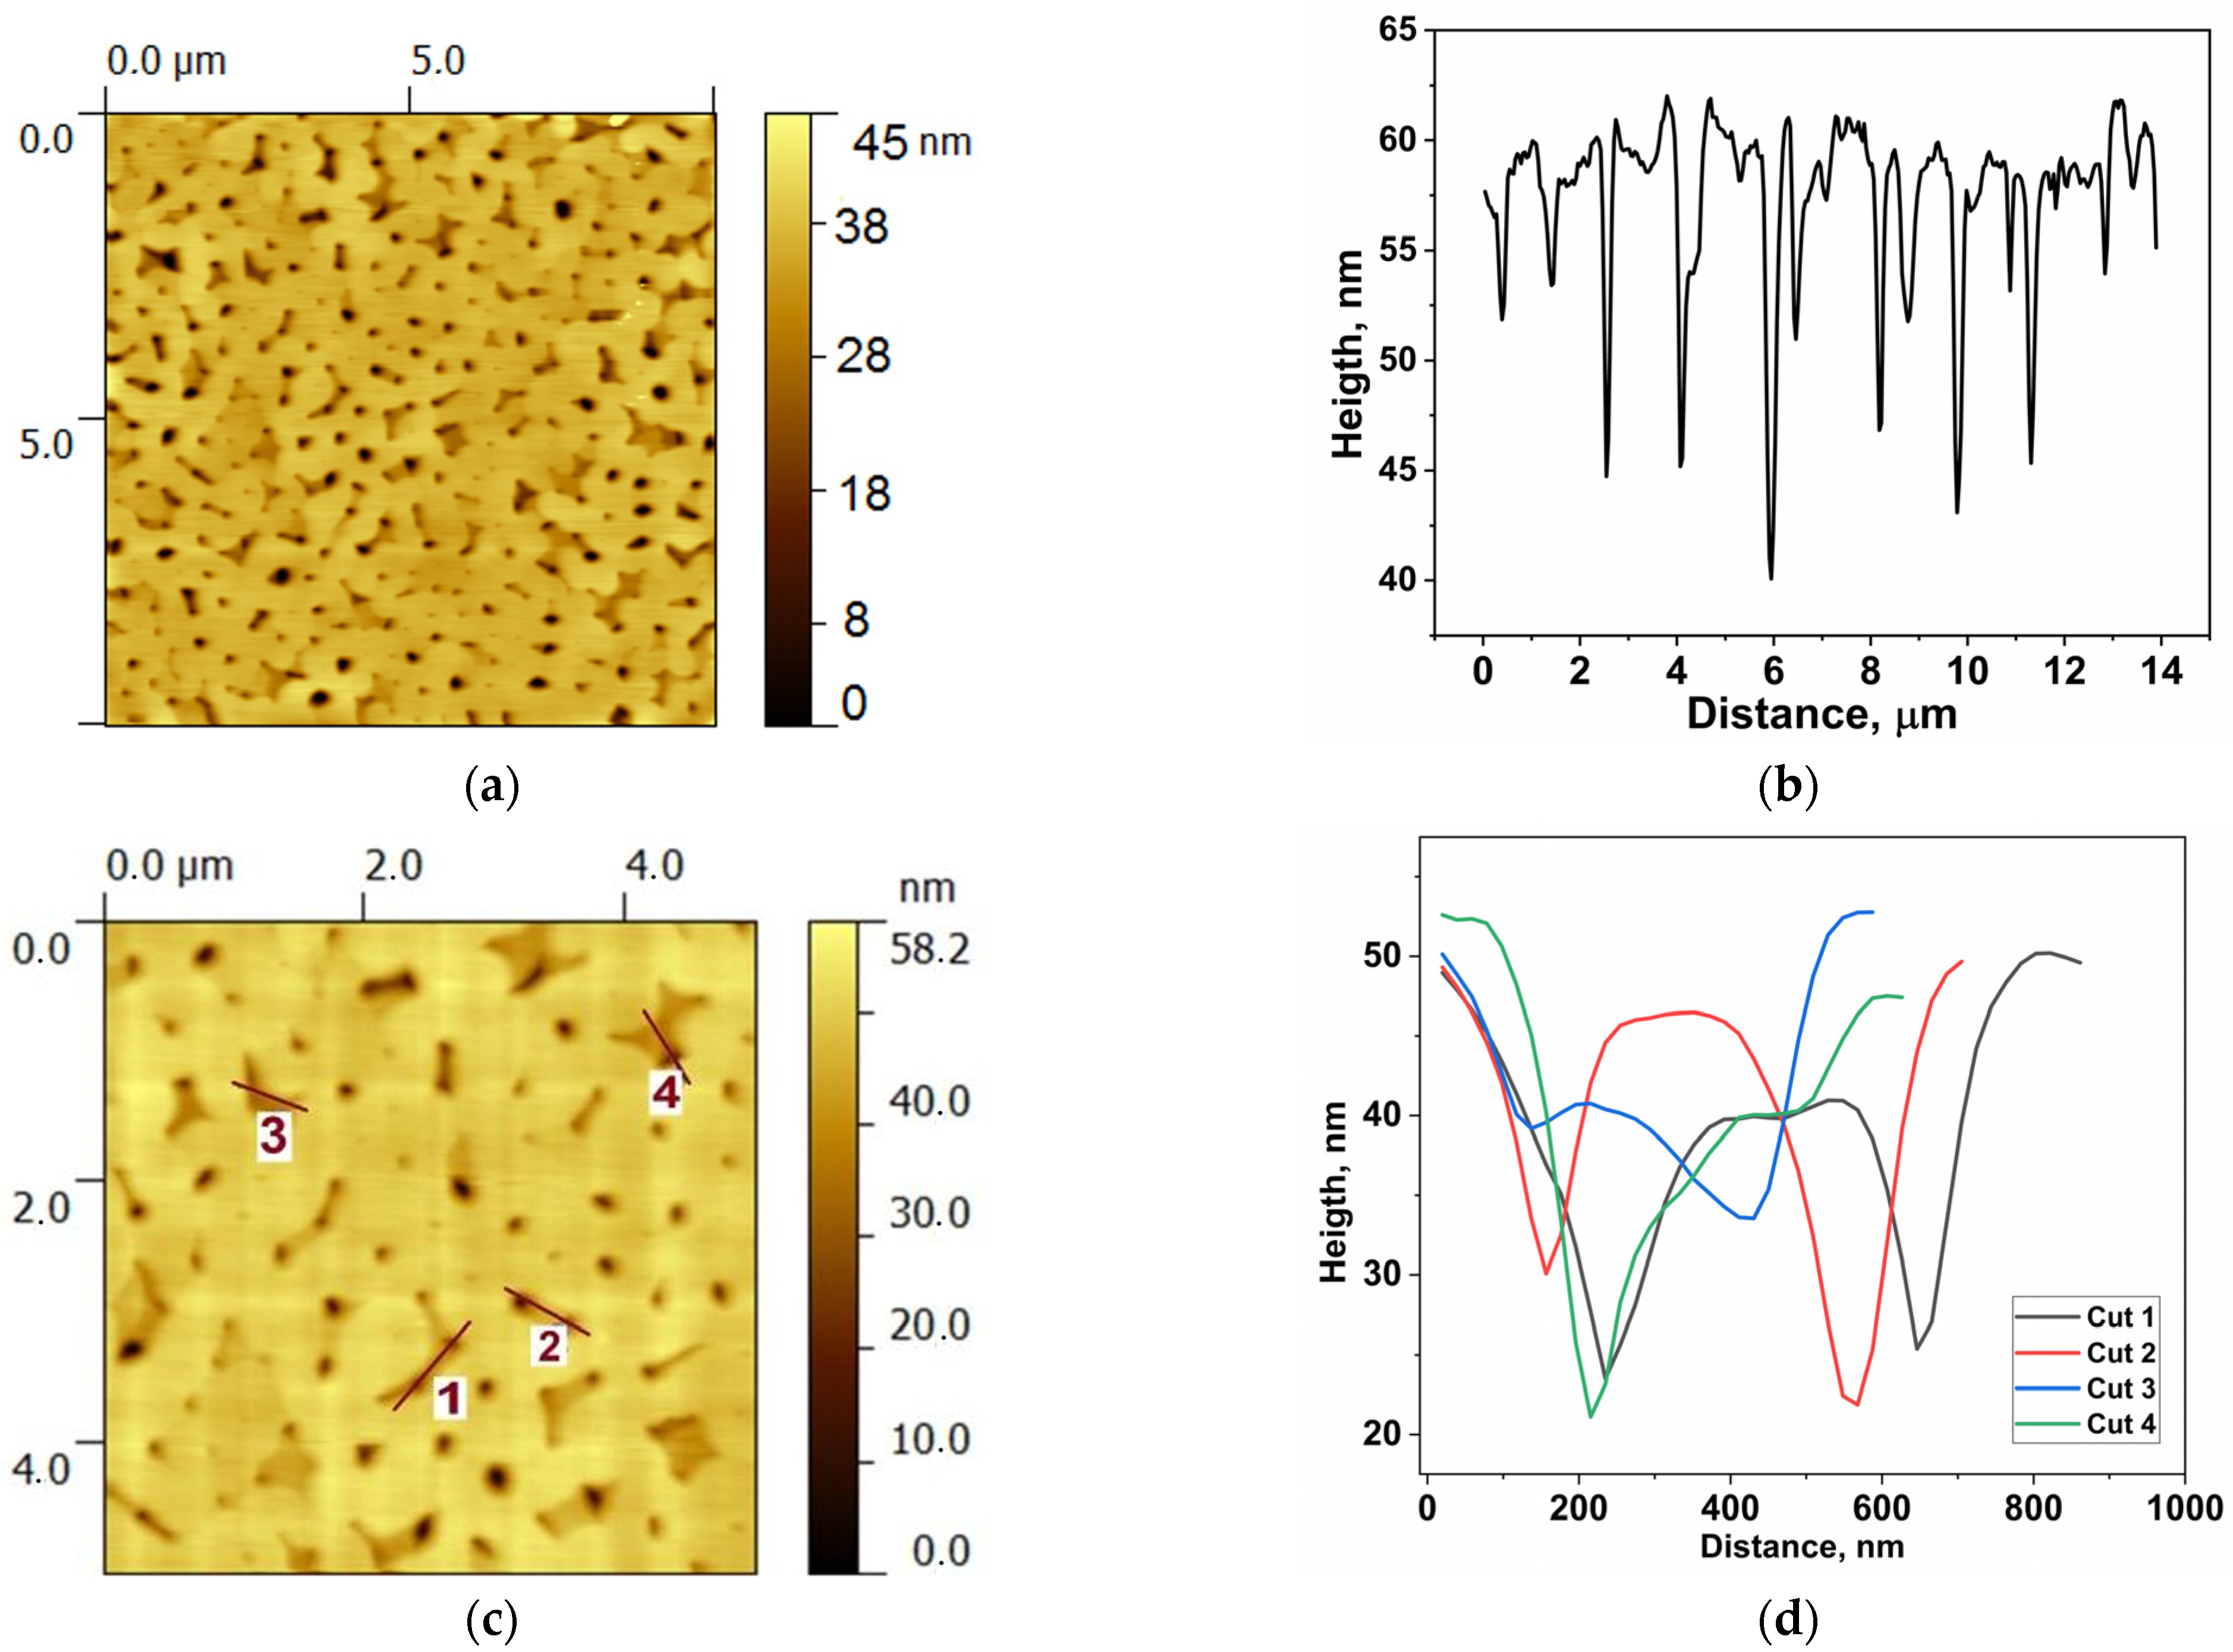
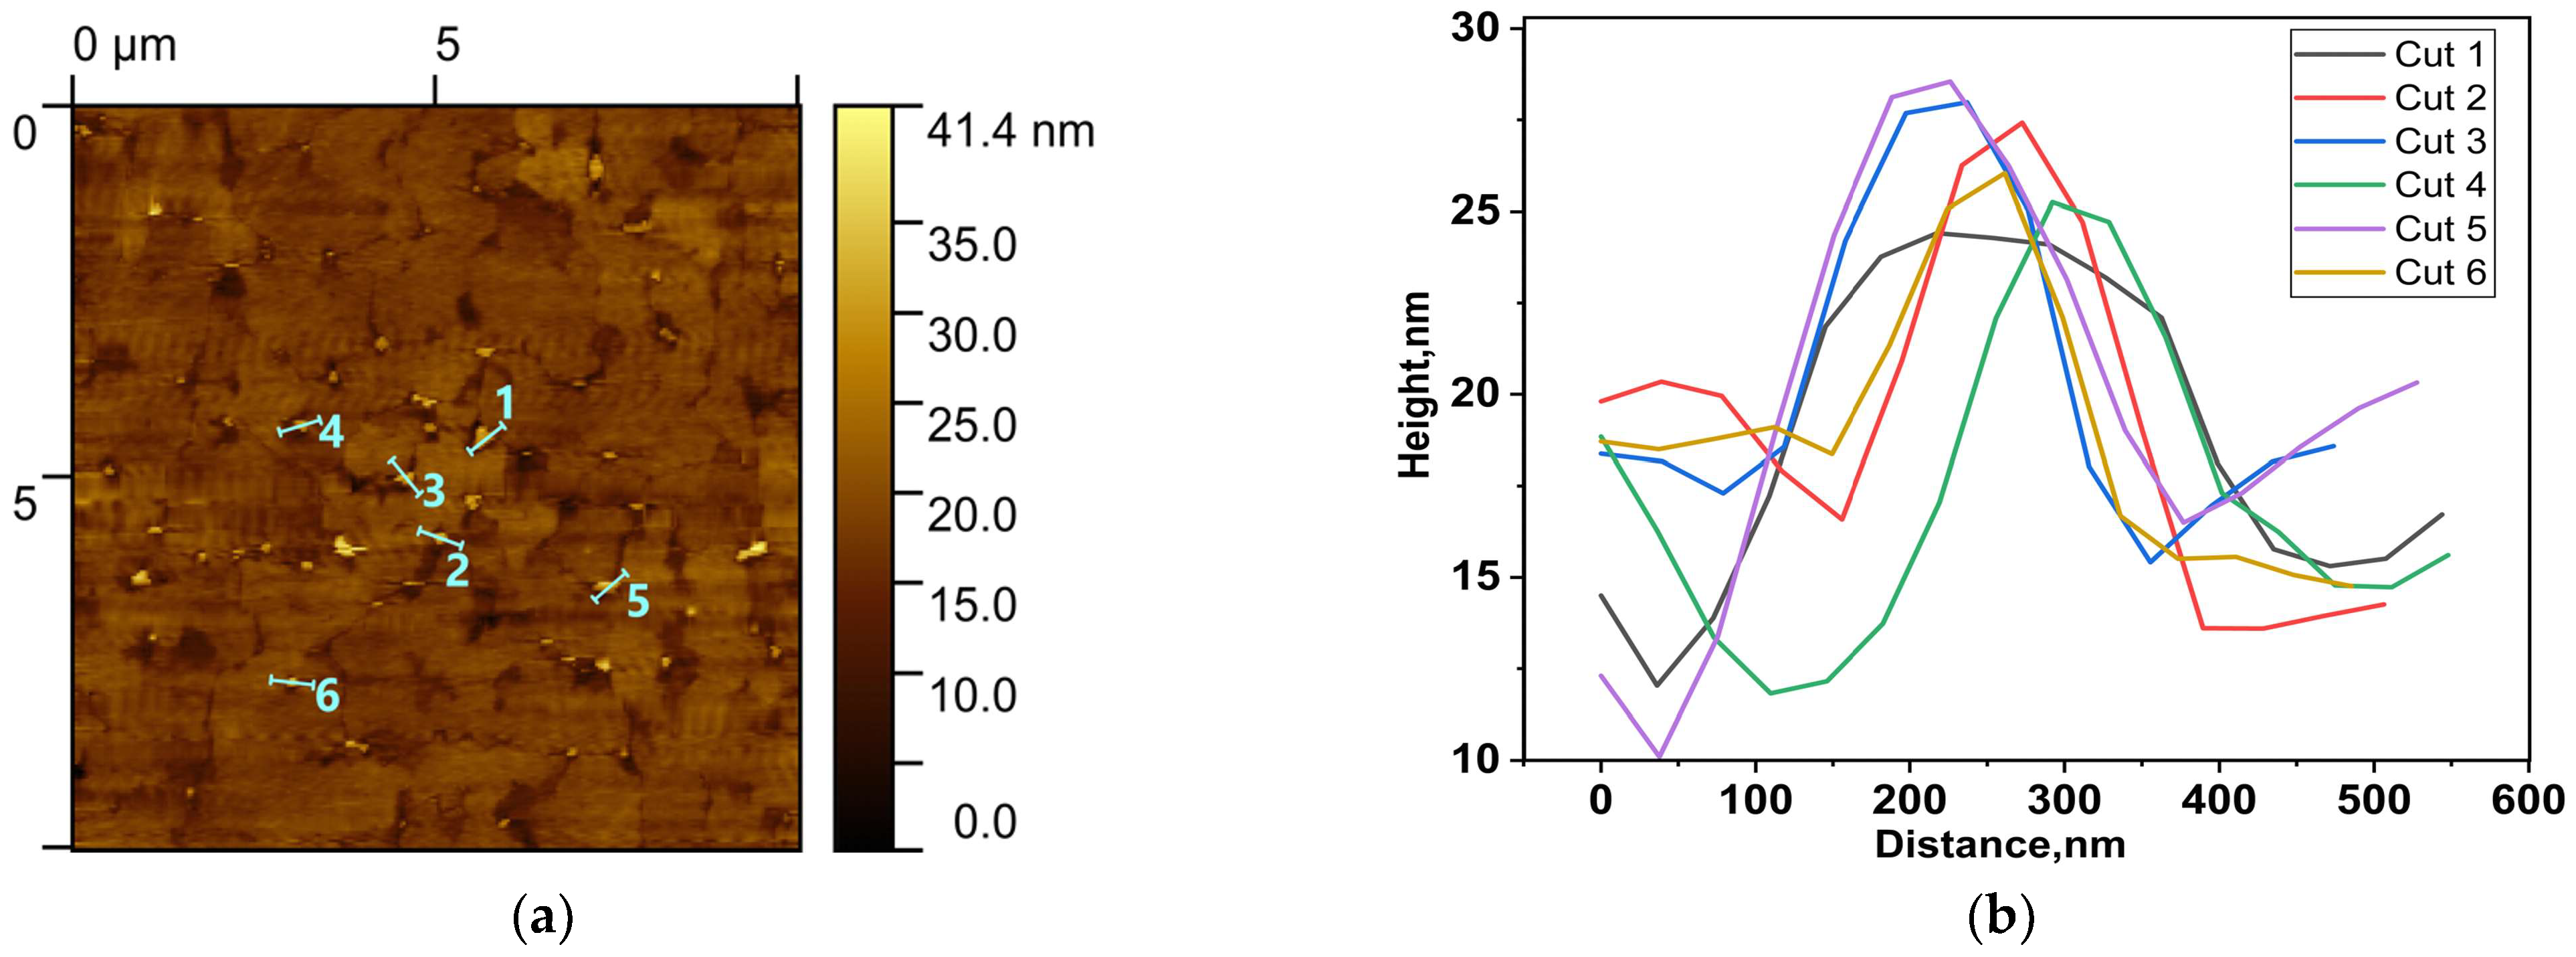
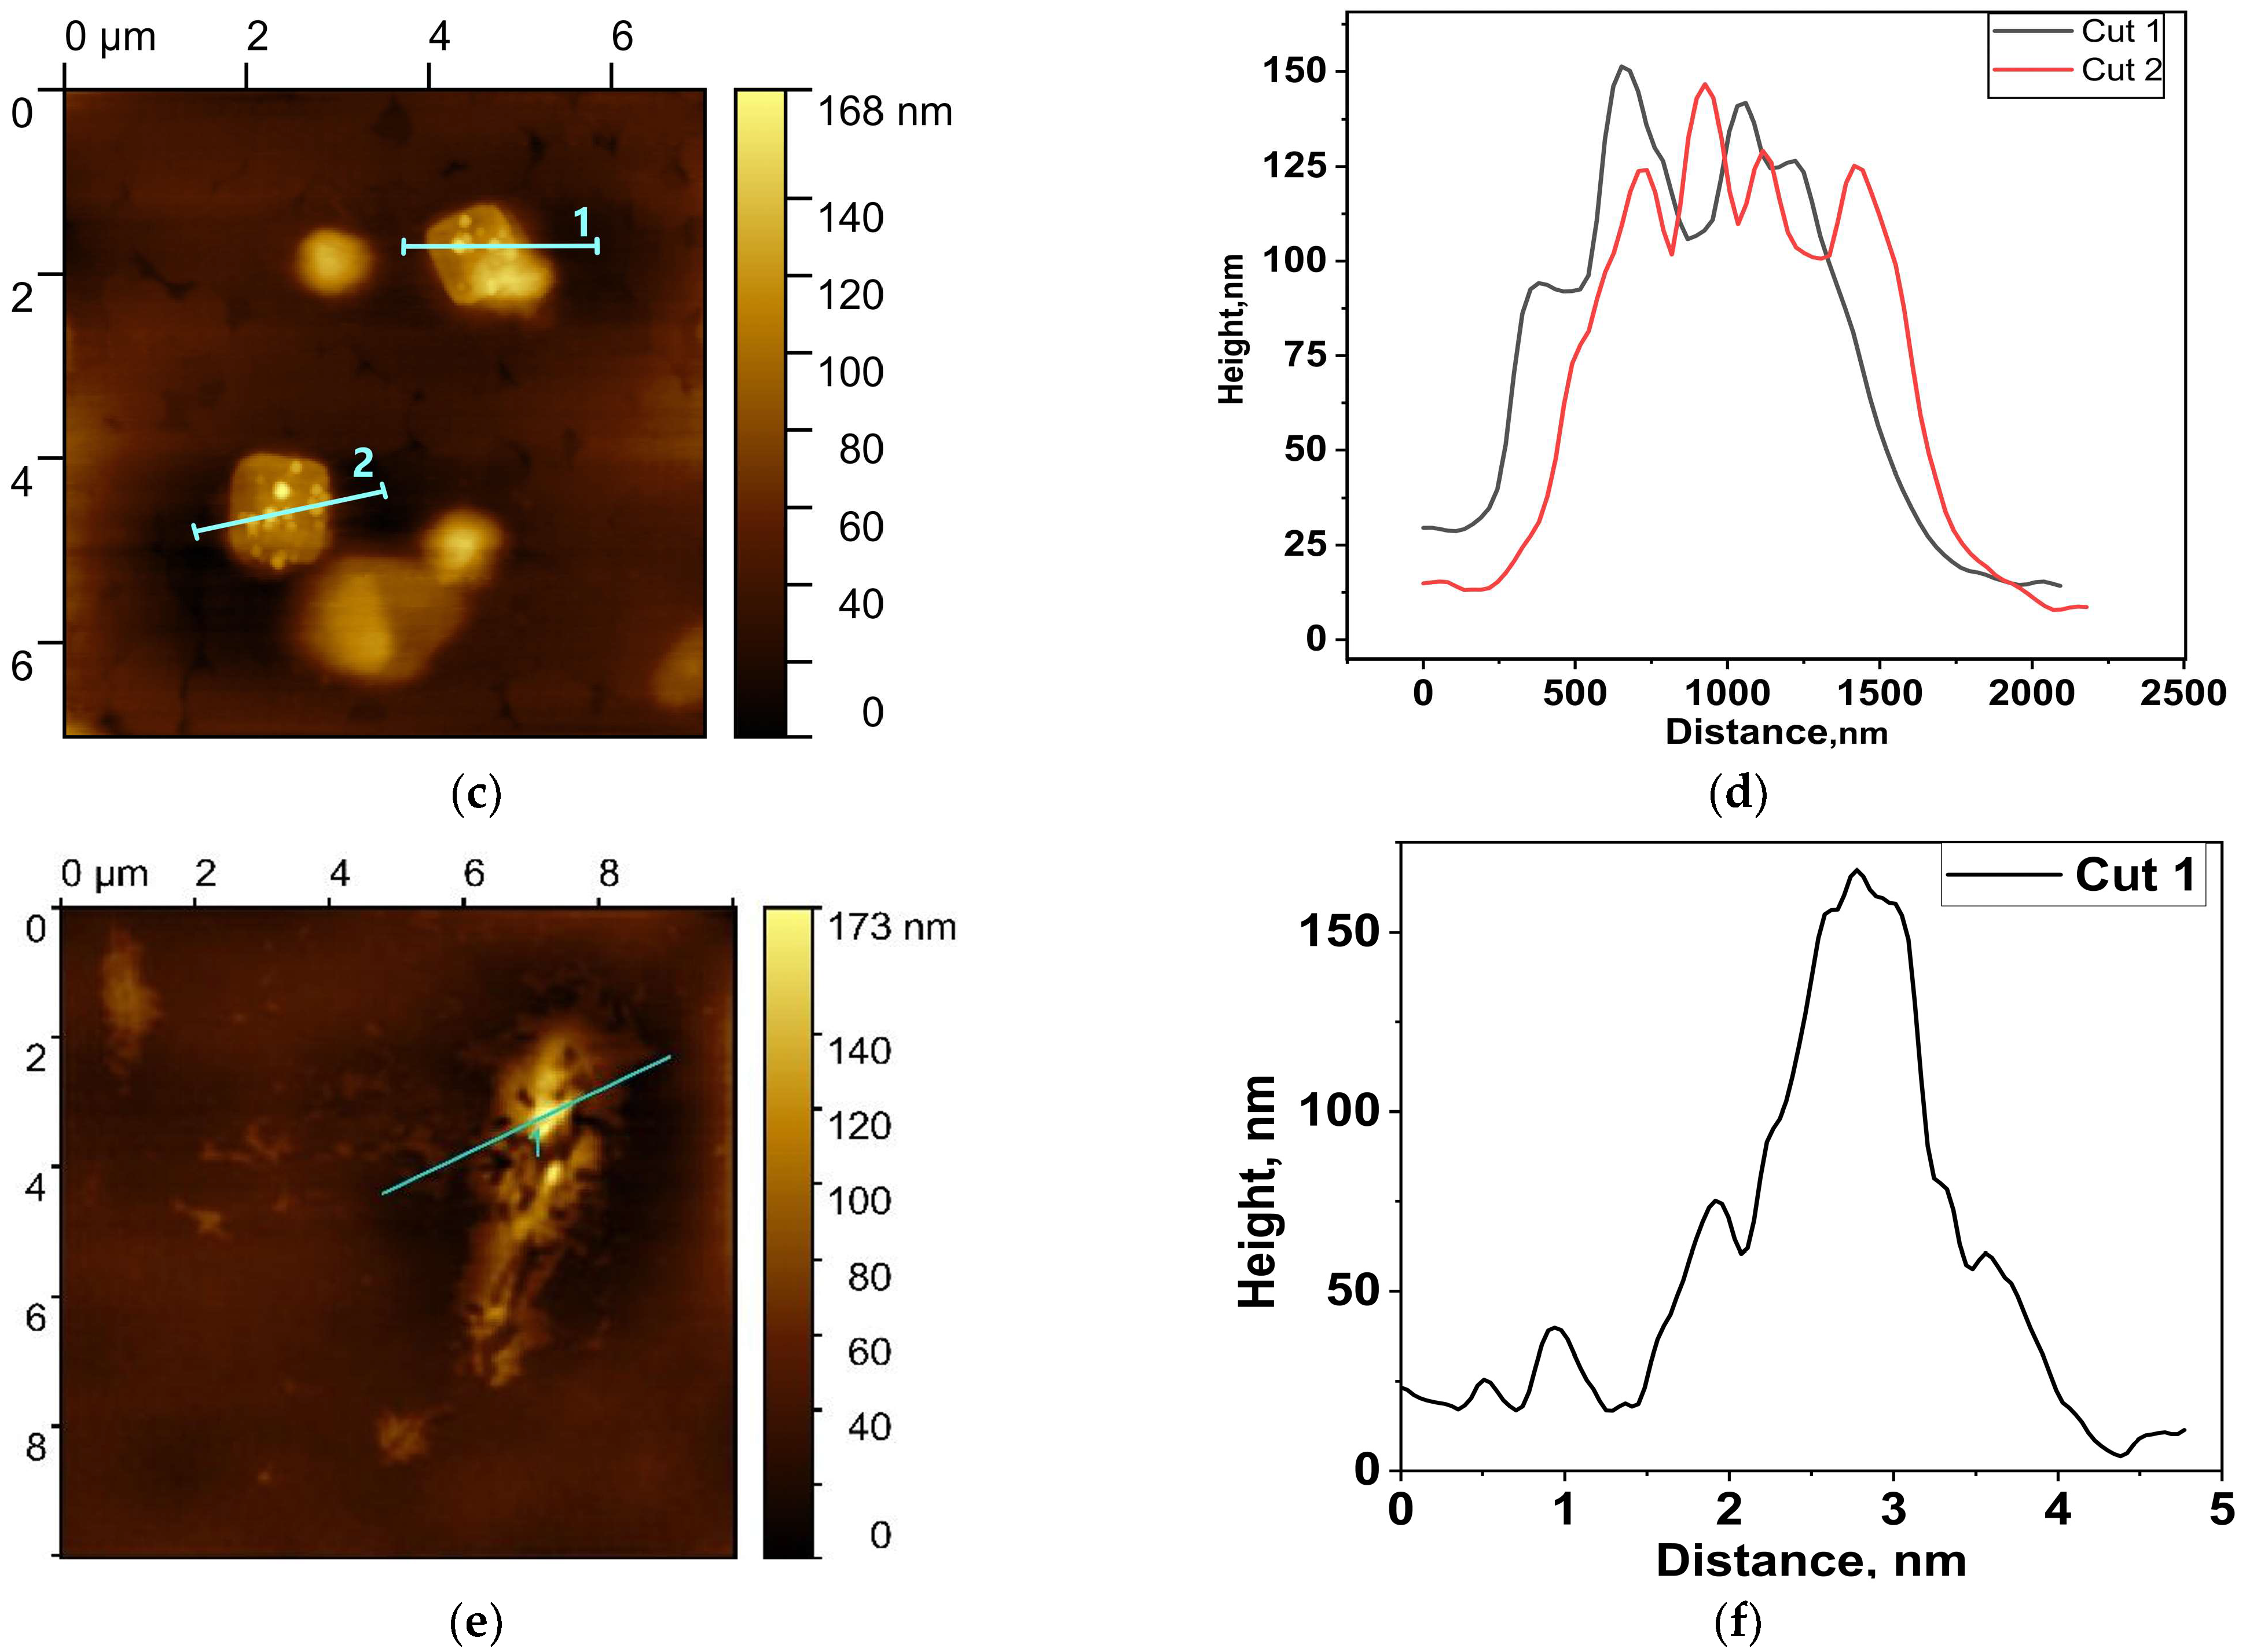
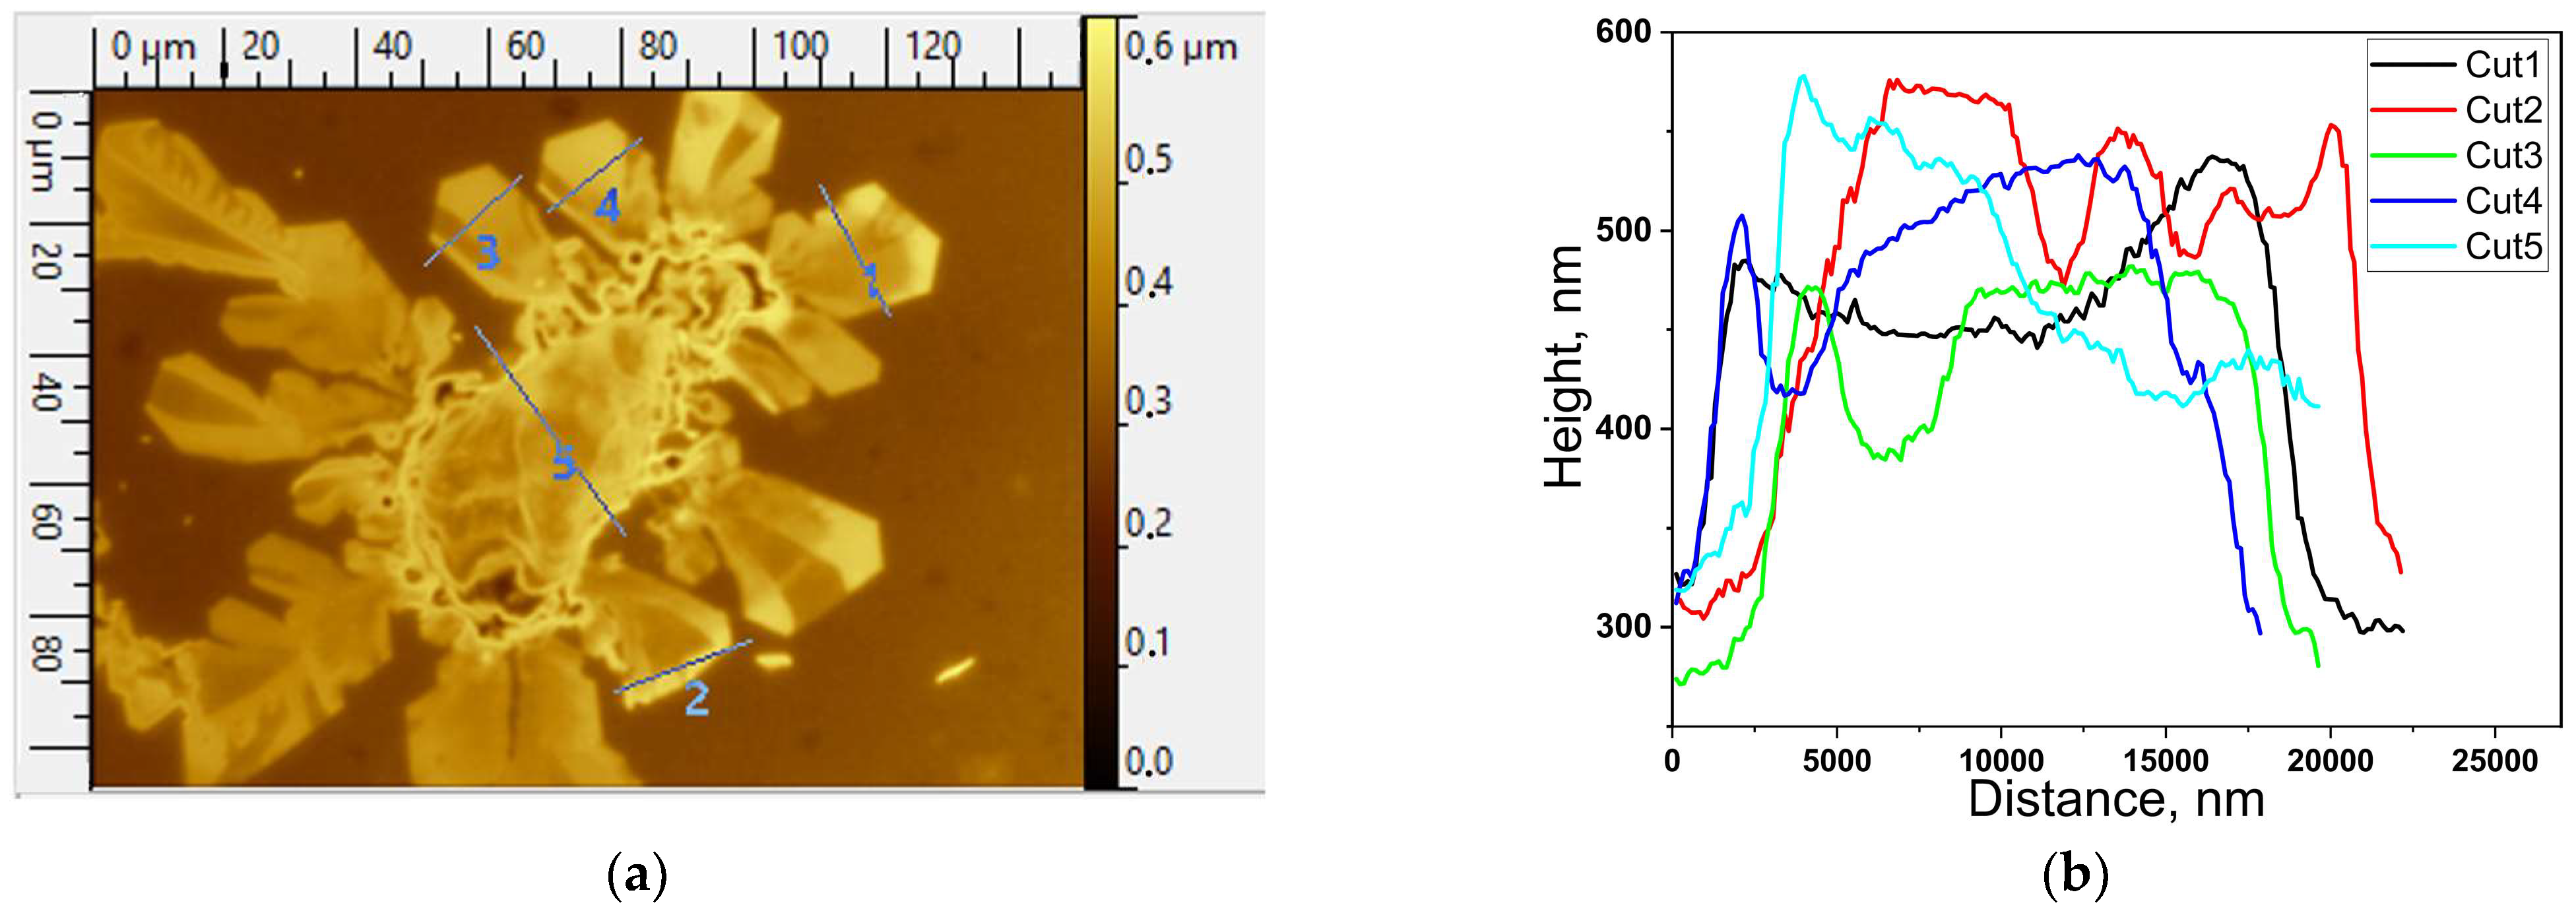
3.3.1. AFM Study of Dried Precipitate Morphology

The morphology of the dried precipitate was studied using AFM in tapping mode. Figure 5 shows AFM images of the surface morphology of the substrate areas containing myoglobin.
As shown in Figure 5, the growth of crystal-like aggregates of the protein (types II and III) starts at the surface irregularities of the SERS-active substrate. The nuclei have a height of 10–20 nm and are thus not visible under an optical microscope. Further growth under favorable conditions leads to the formation of a crystal facet (fully formed crystal dots), which is resolvable in an optical microscope (type III). Similar cases of crystal growth have been described for proteins on porous substrates [36,37]. The height of the formed crystal dots is about 150 nm. The height of the crystals with pronounced faceting (type II spectrum) could not be measured using AFM due to their large size in the substrate plane. However, the height was estimated to be around 200–300 nm using an optical profilometer (see Figure 6).
Figure 6 shows that the cross-section height of a crystal with a pronounced faceting is on the same order of magnitude as that of the objects in Figure 5 and does not exceed 300 nm. This height is similar to the height of the amorphous form of the protein, which is formed without laser irradiation during sample preparation. The size of crystal dots (type III spectrum) in the substrate plane is a few microns, whereas the effective size of crystals with pronounced faceting (type II spectrum) is tens of microns.

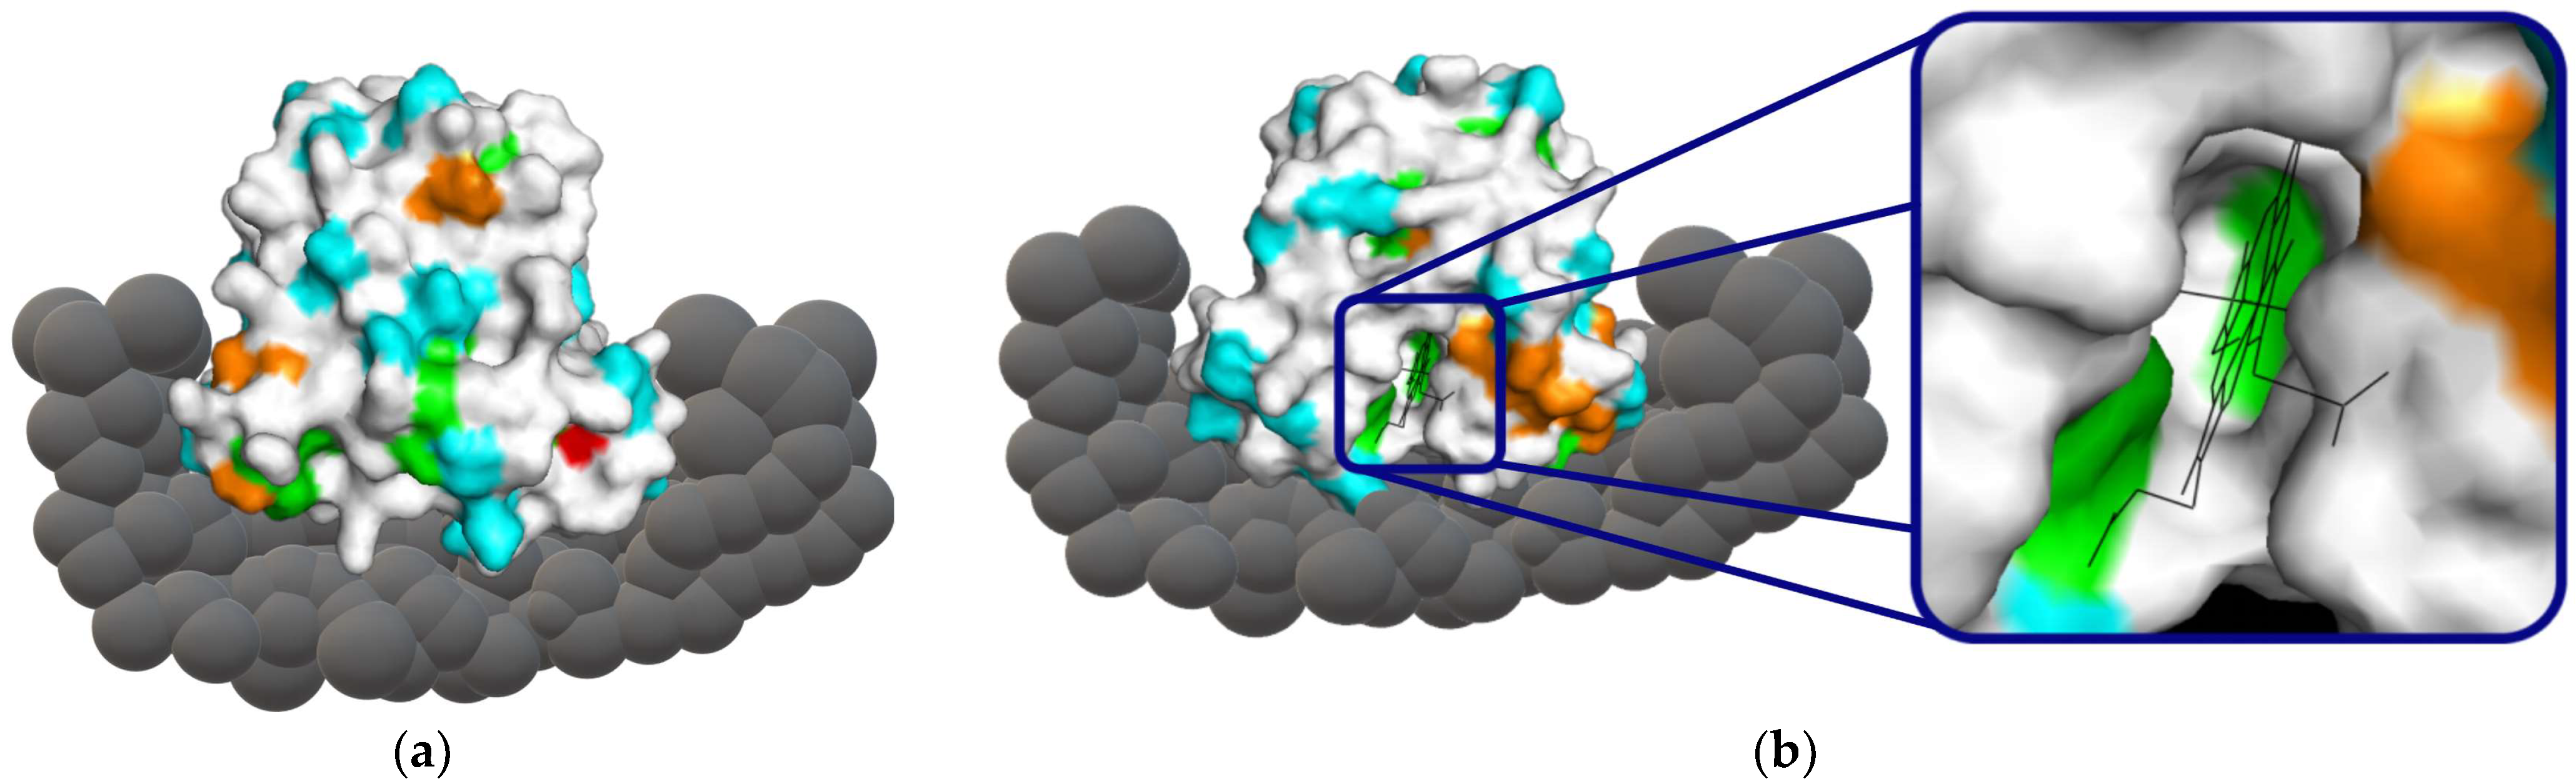
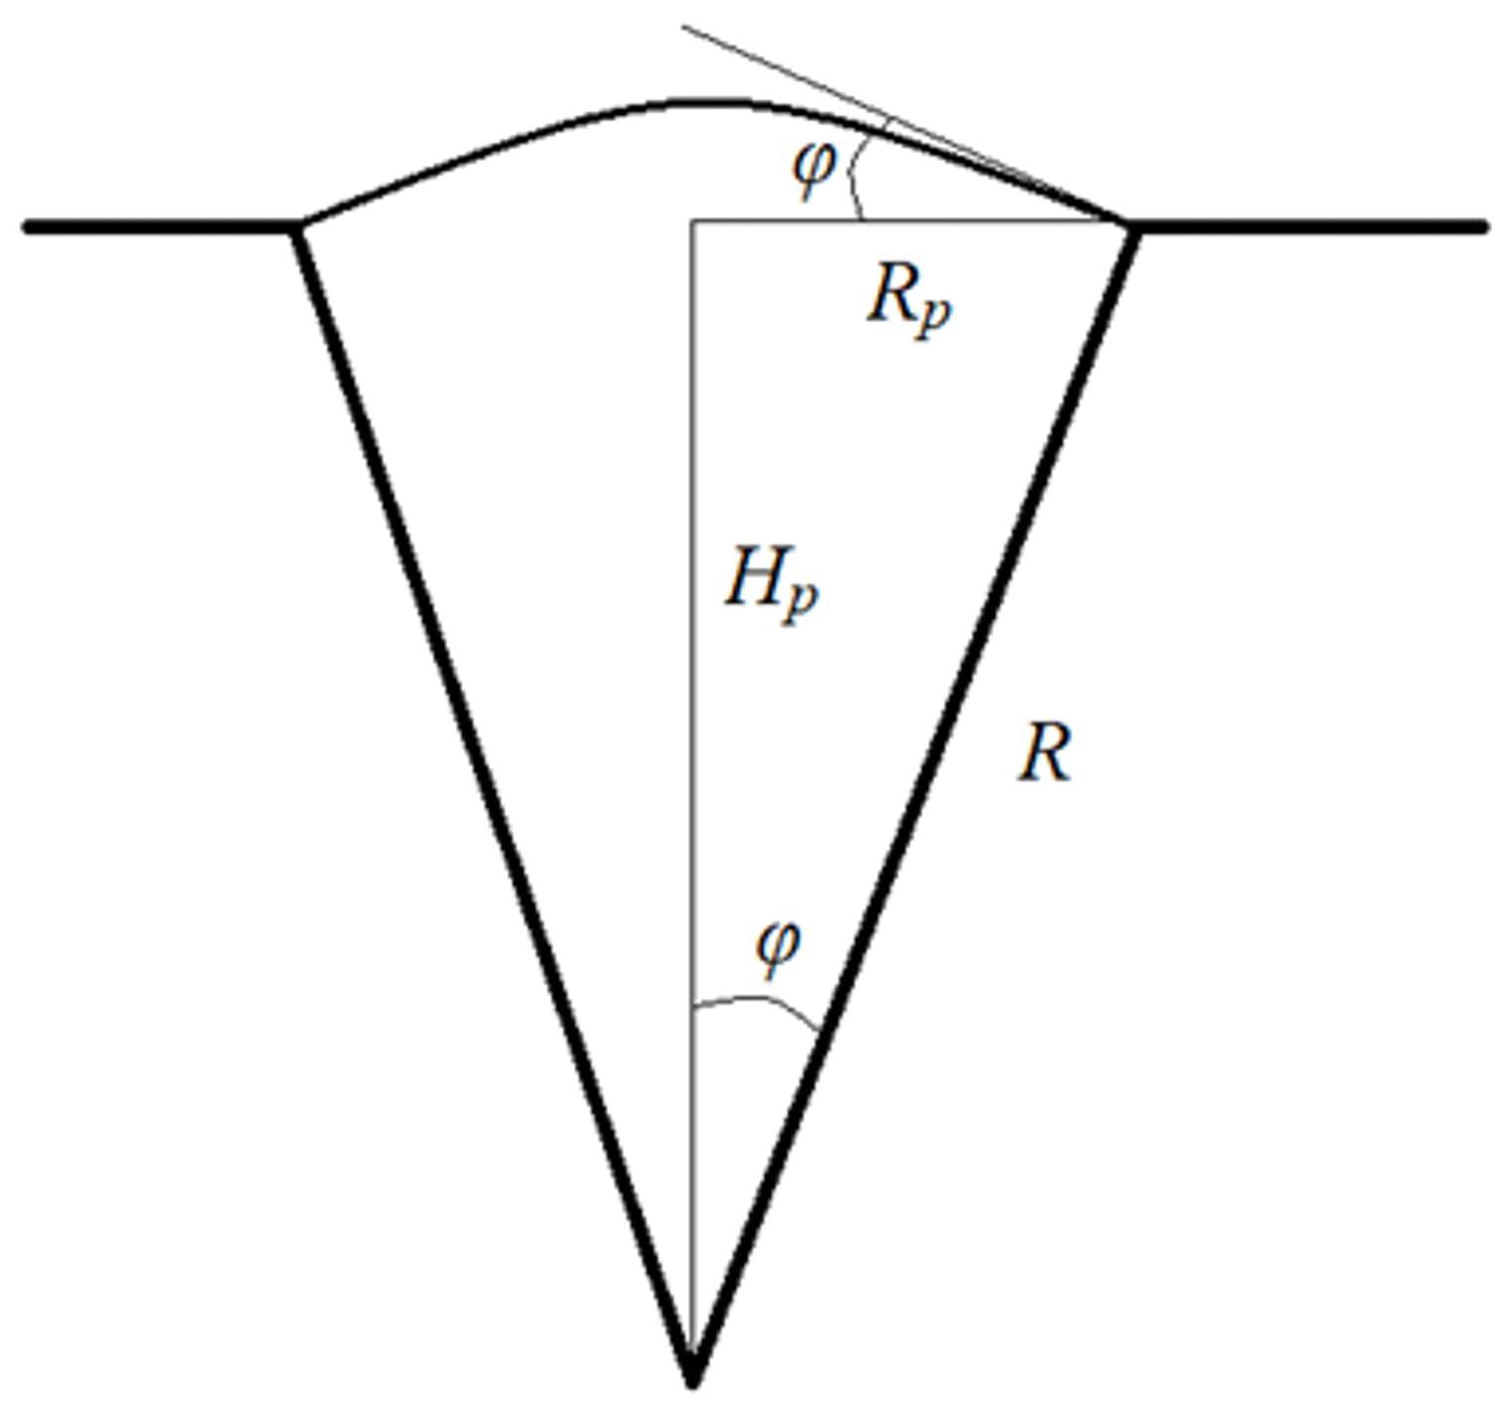
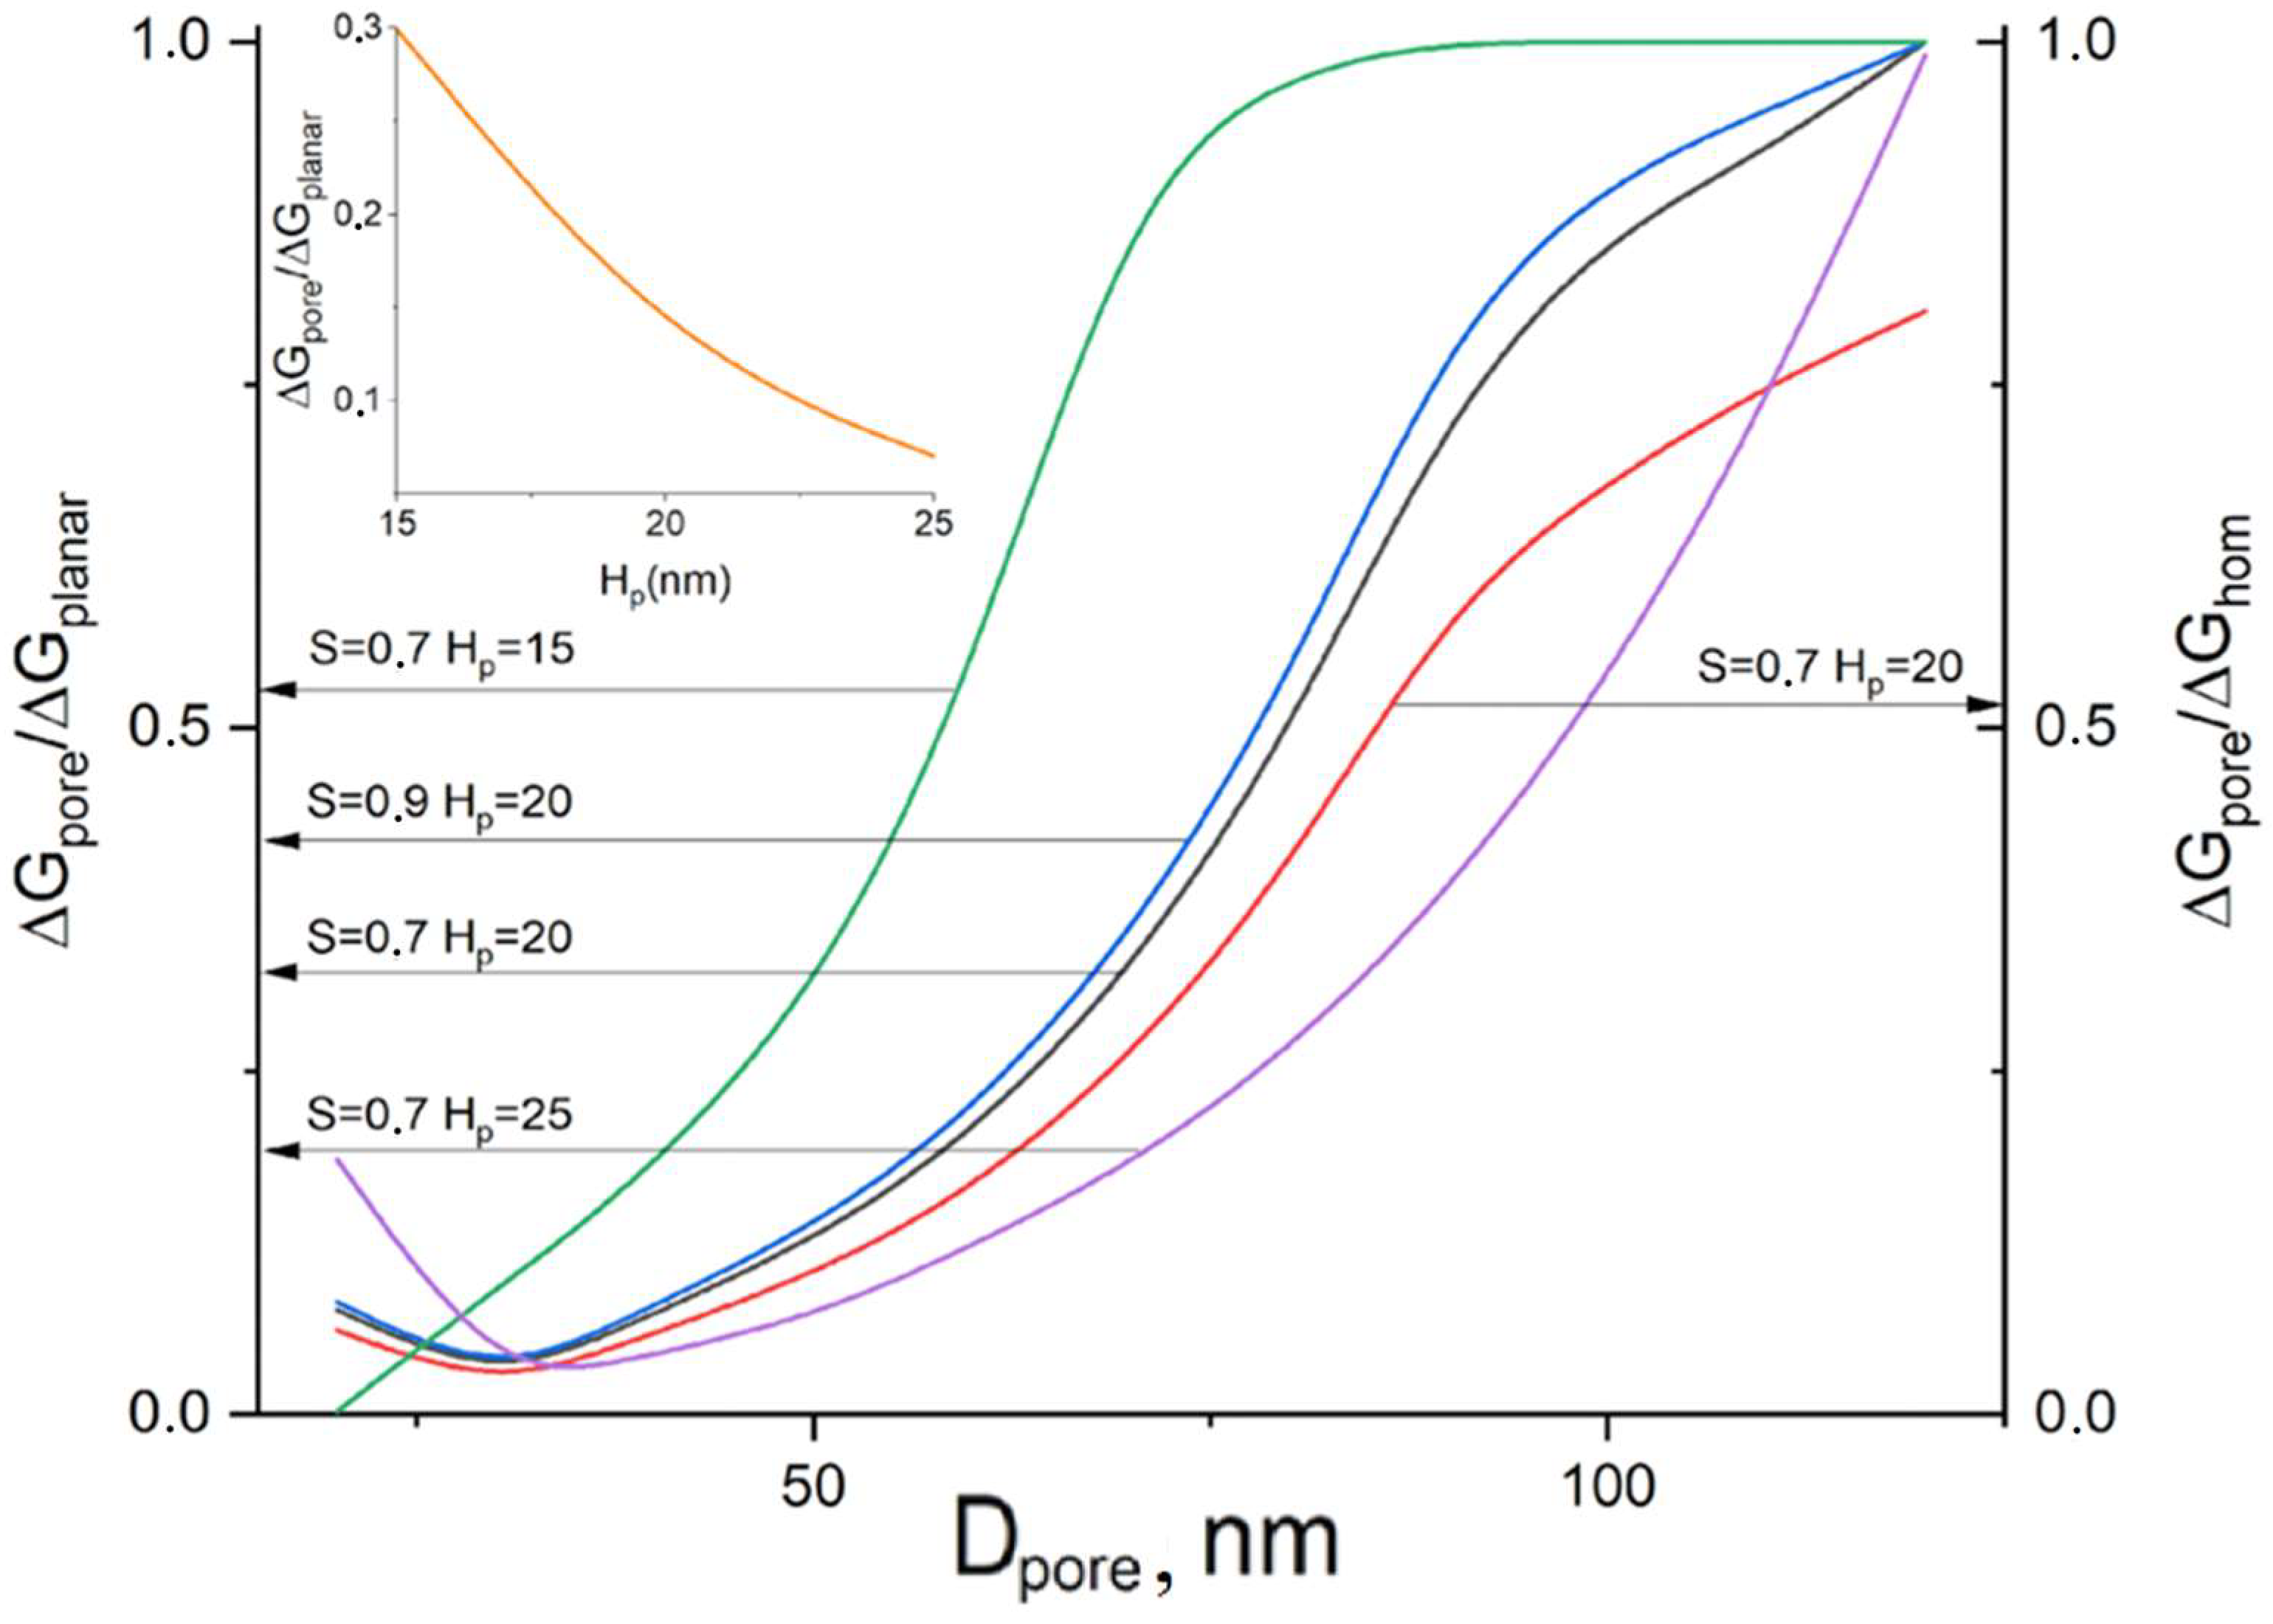
3.3.2. Modeling of Nucleation Energy

A calculation of the formation energies of critical-size nuclei was performed. Based on the AFM results, the formation energies of critical-size nuclei at surface features, on a planar surface, and in solution (according to a homogeneous mechanism) were calculated. According to a previous study [38], based on thermodynamic concepts, the nucleation rate can be expressed as:
I = A e x p Q d k T e x p ( G c r i t k T )
where Q d is the activation barrier of myoglobin transition from solution to the nucleus, G c r i t is the formation energy of a critical-size nucleus, and A is the collision factor, which includes the number of available sites for nucleation and their spatial location, the frequency of transition to such states, and the interphase energy between the solution and crystal [39]. During crystallization by different mechanisms, Q d is a constant value. The rate of nucleation thus depends on the formation energy of the critical-size nucleus.
A surface irregularity was approximated as a sector of a circle according to the AFM data, as shown in Figure 7.
In this case, the formation energy of a critical-size nucleus for homogeneous and heterogeneous mechanisms is respectively defined as:
Δ G h o m = 16 3 π σ l V m Δ μ
Δ G h e t = Δ μ V m V + σ l A l ( σ s σ i ) A s i
where σ l , σ s , σ i are the surface tensions of the nucleus-liquid, nucleus-pore, and liquid-pore boundaries, respectively, V m is the molar volume, μ = k T l n S is the gradient of the chemical potential, S is the supersaturation value, V is the volume of the nucleus, and A s i is the surface area of the nucleus-liquid. The hom and het indices correspond to homogeneous and heterogeneous mechanisms, respectively.
From the model concepts of the pore geometry for V , A l , and A s i , we have:
V = 1 3 π R 3 c o s φ s i n 2 φ + 1 3 R 3 ( 2 3 c o s φ + c o s 3 φ )
A l = 2 π R 2 ( 1 c o s φ )
A s i = π R 2 s i n φ
where φ is the angle of the spherical sector of the pore; t g φ = R p H p , where R p and H p are the radius and depth of the pore, respectively, obtained from AFM measurements. The surface tension ratios are given by the Young equation:
c o s θ = σ s σ i σ l
where θ is the wetting contact angle; in our model, it is equal to φ .
Substituting Equations (4)–(6) into Equation (3) and differentiating δ Δ G h e t δ R = 0 yields the radii of the critical-size nuclei. Substituting these radii into Equation (2) yields the corresponding formation energy of a critical-size nucleus. The calculations were made using code written in Python.
The results of the mathematical modeling of the influence of morphology on nucleation for various parameters of the substrate surface morphology are shown in Figure 8. For modeling, as indicated above in accordance with Figure 1, surface features from which the growth of crystal-like aggregates begins are approximated in the form of a conical shape and denoted as pores. Planar areas of the surface are denoted as planar. A comparison is made between the energy of nucleation in the free volume of the solution without phase boundaries according to a homogeneous mechanism and the energy of nucleation in a pore. The energy of nucleation in a pore is also compared with the energy of nucleation on a planar surface. The simulation results are shown in Figure 7.
As shown in Figure 8, the pore volume close to the volume of the critical-size nucleus has the lowest formation energy for a nucleus of critical size. As the pore size increases, the energy increases and tends to reach the limit of the heterogeneous case for a planar surface. In this case, the homogeneous mechanism is the least energetically favorable for the formation of a critical-size nucleus. As supersaturation increases, the energies for the planar and homogeneous cases decrease, but the energy of a pore with a volume close to the critical one remains the smallest. The inset in Figure 8 shows that an increase in the pore depth for a given diameter (dependence for 50 nm is shown) leads to a decrease in the formation energy. This is due to an increase in the pore-myoglobin contact surface. From the AFM results, we observe a coincidence in order of magnitude of the depth of the substrate surface irregularities with the numerical values of the pores, obtained as a result of simulation and most favorable for the growth of crystal-like aggregates. Thus, the use of a modeling method based on thermodynamic concepts of nucleation will make it possible to predict the most energetically favorable substrate morphologies for the formation of crystal-like aggregates with a maximum SERS signal, which will significantly increase the sensitivity of methods for monitoring proteins, in particular myoglobin.

4. Conclusions

We obtained the SERS spectra of myoglobin on SERS-active substrates with a self-assembled surface morphology. We showed that sample preparation with laser irradiation increases sensitivity by two orders of magnitude compared to that obtained without laser irradiation. Sample preparation with laser irradiation makes it possible to control the formation of crystal-like structures from an aqueous solution of myoglobin. The spectra measured on such structures are characterized by a change in the positions of the vibrational bands and the amplitude ratio. These spectra also show a significant narrowing after crystallization in comparison with the protein dried in air on the same SERS-active substrates due to the new conformation of the protein during sample preparation. Two types of crystal-like protein aggregates were obtained by precipitation from solutions with different concentrations, differing either in the enhancement of all lines (type II) or in the significant enhancement of only two lines (type III). Laser irradiation and the features of the surface structure are important for the formation of crystal-like objects since the growth of such objects was observed only for morphologies with complex surface irregularities. Modeling based on thermodynamic concepts showed that nucleation occurs only at morphological features. AFM data show that the height of the nucleus is 10–20 nm. Further growth under favorable conditions leads to the formation of faceting. The height of the faceted crystal-like aggregates is on the same order of magnitude as the height of amorphous protein structures formed without laser irradiation during sample preparation.

Author Contributions

Conceptualization, I.A.B. and I.A.R. (Ilya A. Ryzhikov); methodology, I.A.B., E.A.S., M.V.S., J.Y.Z. and A.D.M.; software, A.D.M.; validation, I.A.B., M.V.S. and A.D.M.; formal analysis, M.V.S. and A.D.M.; investigation, I.A.B., J.Y.Z. and A.S.B.; resources, I.A.R. (Ilya A. Rodionov), I.A.R. (Ilya A. Ryzhikov) and A.N.L.; data curation, I.A.R. (Ilya A. Rodionov) and I.A.R. (Ilya A. Ryzhikov); writing—original draft preparation I.A.B., E.A.S., J.Y.Z., A.D.M. and A.S.B.; writing—review and editing, M.V.S., I.A.R. (Ilya A. Rodionov) and I.A.R. (Ilya A. Ryzhikov); visualization, I.A.B., E.A.S. and A.D.M.; supervision, I.A.R. (Ilya A. Rodionov), A.M.M., I.A.R. (Ilya A. Ryzhikov) and A.N.L.; project administration, I.A.R. (Ilya A. Ryzhikov); funding acquisition, A.M.M. and I.A.R. (Ilya A. Rodionov). All authors have read and agreed to the published version of the manuscript.

Funding

This research was funded by the Ministry of Education and Science of the Russian Federation [Registration Theme FFUR-2024-0003].

Institutional Review Board Statement

Not applicable.

Informed Consent Statement

Not applicable.

Data Availability Statement

Data are contained within the article.

Conflicts of Interest

The authors declare no conflict of interest.

References

  1. Plebani, M.; Zaninotto, M. Diagnostic Strategies Using Myoglobin Measurement in Myocardial Infarction. Clin. Chim. Acta 1998, 272, 69–77. [Google Scholar] [CrossRef]
  2. Das, G.; Gentile, F.; Coluccio, M.L.; Perri, A.M.; Nicastri, A.; Mecarini, F.; Cojoc, G.; Candeloro, P.; Liberale, C.; De Angelis, F.; et al. Principal Component Analysis Based Methodology to Distinguish Protein SERS Spectra. J. Mol. Struct. 2011, 993, 500–505. [Google Scholar] [CrossRef]
  3. Boginskaya, I.; Nechaeva, N.; Tikhomirova, V.; Kryukova, O.; Evdokimov, V.; Bulaeva, N.; Golukhova, E.; Ryzhikov, I.; Kost, O.; Afanasev, K.; et al. Human Angiotensin I-converting Enzyme Study by Surface-enhanced Raman Spectroscopy. J. Raman Spectrosc. 2021, 52, 1529–1539. [Google Scholar] [CrossRef]
  4. Dingari, N.C.; Horowitz, G.L.; Kang, J.W.; Dasari, R.R.; Barman, I. Raman Spectroscopy Provides a Powerful Diagnostic Tool for Accurate Determination of Albumin Glycation. PLoS ONE 2012, 7, e32406. [Google Scholar] [CrossRef]
  5. Boginskaya, I.; Sedova, M.; Baburin, A.; Afanas’ev, K.; Zverev, A.; Echeistov, V.; Ryzhkov, V.; Rodionov, I.; Tonanaiskii, B.; Ryzhikov, I.; et al. SERS-Active Substrates Nanoengineering Based on e-Beam Evaporated Self-Assembled Silver Films. Appl. Sci. 2019, 9, 3988. [Google Scholar] [CrossRef]
  6. Barucci, A.; D’Andrea, C.; Farnesi, E.; Banchelli, M.; Amicucci, C.; De Angelis, M.; Hwang, B.; Matteini, P. Label-Free SERS Detection of Proteins Based on Machine Learning Classification of Chemo-Structural Determinants. Analyst 2021, 146, 674–682. [Google Scholar] [CrossRef]
  7. Fan, M.; Andrade, G.F.S.; Brolo, A.G. A Review on the Fabrication of Substrates for Surface Enhanced Raman Spectroscopy and Their Applications in Analytical Chemistry. Anal. Chim. Acta 2011, 693, 7–25. [Google Scholar] [CrossRef]
  8. Bao, Y.; Lai, C.; Zhu, Z.; Fong, H.; Jiang, C. SERS-Active Silver Nanoparticles on Electrospun Nanofibers Facilitated via Oxygen Plasma Etching. RSC Adv. 2013, 3, 8998–9004. [Google Scholar] [CrossRef]
  9. Li, Z.; Huang, X.; Lu, G. Recent Developments of Flexible and Transparent SERS Substrates. J. Mater. Chem. C 2020, 8, 3956–3969. [Google Scholar] [CrossRef]
  10. D’Acunto, M. In Situ Surface-Enhanced Raman Spectroscopy of Cellular Components: Theory and Experimental Results. Materials 2019, 12, 1564. [Google Scholar] [CrossRef]
  11. Petti, L.; Capasso, R.; Rippa, M.; Pannico, M.; La Manna, P.; Peluso, G.; Calarco, A.; Bobeico, E.; Musto, P. A Plasmonic Nanostructure Fabricated by Electron Beam Lithography as a Sensitive and Highly Homogeneous SERS Substrate for Bio-Sensing Applications. Vib. Spectrosc. 2016, 82, 22–30. [Google Scholar] [CrossRef]
  12. Suresh, V.; Ding, L.; Chew, A.B.; Yap, F.L. Fabrication of Large-Area Flexible SERS Substrates by Nanoimprint Lithography. ACS Appl. Nano Mater. 2018, 1, 886–893. [Google Scholar] [CrossRef]
  13. Zhang, P.; Yang, S.; Wang, L.; Zhao, J.; Zhu, Z.; Liu, B.; Zhong, J.; Sun, X. Large-Scale Uniform Au Nanodisk Arrays Fabricated via X-ray Interference Lithography for Reproducible and Sensitive SERS Substrate. Nanotechnology 2014, 25, 245301. [Google Scholar] [CrossRef]
  14. Theiss, J.; Pavaskar, P.; Echternach, P.M.; Muller, R.E.; Cronin, S.B. Plasmonic Nanoparticle Arrays with Nanometer Separation for High-Performance SERS Substrates. Nano Lett. 2010, 10, 2749–2754. [Google Scholar] [CrossRef]
  15. Semin, D.J.; Rowlen, K.L. Influence of Vapor Deposition Parameters on SERS Active Ag Film Morphology and Optical Properties. Anal. Chem. 1994, 66, 4324–4331. [Google Scholar] [CrossRef]
  16. Zhang, R.; Xu, B.-B.; Liu, X.-Q.; Zhang, Y.-L.; Xu, Y.; Chen, Q.-D.; Sun, H.-B. Highly Efficient SERS Test Strips. Chem. Commun. 2012, 48, 5913–5915. [Google Scholar] [CrossRef] [PubMed]
  17. Li, H.; Patel, P.H.; Cullum, B.M. Novel Multilayered SERS Substrates for Trace Chemical and Biochemical Analysis. In Proceedings of the Smart Medical and Biomedical Sensor Technology II, Philadelphia, PA, USA, 7 December 2004; pp. 87–97. [Google Scholar]
  18. Boginskaya, I.; Gainutdinova, A.; Gusev, A.; Mailyan, K.; Mikhailitsyn, A.; Sedova, M.; Vdovichenko, A.; Ryzhikov, I.; Chvalun, S.; Lagarkov, A. Detection of Organic Substances by a SERS Method Using a Special Ag-Poly(Chloro-P-Xylylene)-Ag Sandwich Substrate. Coatings 2020, 10, 799. [Google Scholar] [CrossRef]
  19. Kulikova, D.P.; Dobronosova, A.A.; Kornienko, V.V.; Nechepurenko, I.A.; Baburin, A.S.; Sergeev, E.V.; Lotkov, E.S.; Rodionov, I.A.; Baryshev, A.V.; Dorofeenko, A.V. Optical Properties of Tungsten Trioxide, Palladium, and Platinum Thin Films for Functional Nanostructures Engineering. Opt. Express 2020, 28, 32049–32060. [Google Scholar] [CrossRef] [PubMed]
  20. Lotkov, E.S.; Baburin, A.S.; Ryzhikov, I.A.; Sorokina, O.S.; Ivanov, A.I.; Zverev, A.V.; Ryzhkov, V.V.; Bykov, I.V.; Baryshev, A.V.; Panfilov, Y.V.; et al. ITO Film Stack Engineering for Low-Loss Silicon Optical Modulators. Sci. Rep. 2022, 12, 6321. [Google Scholar] [CrossRef] [PubMed]
  21. Baburin, A.S.; Ivanov, A.I.; Lotkov, E.S.; Sorokina, O.S.; Boginskaya, I.A.; Sergeev, E.V.; Buzaverov, K.A.; Konstantinova, T.G.; Moskalev, D.O.; Issabayeva, Z.; et al. Epitaxial Silver Films Morphology and Optical Properties Evolution over Two Years. Coatings 2020, 10, 911. [Google Scholar] [CrossRef]
  22. Durmanov, N.N.; Guliev, R.R.; Eremenko, A.V.; Boginskaya, I.A.; Ryzhikov, I.A.; Trifonova, E.A.; Putlyaev, E.V.; Mukhin, A.N.; Kalnov, S.L.; Balandina, M.V.; et al. Non-Labeled Selective Virus Detection with Novel SERS-Active Porous Silver Nanofilms Fabricated by Electron Beam Physical Vapor Deposition. Sens. Actuators B Chem. 2018, 257, 37–47. [Google Scholar] [CrossRef]
  23. Boginskaya, I.; Safiullin, R.; Tikhomirova, V.; Kryukova, O.; Nechaeva, N.; Bulaeva, N.; Golukhova, E.; Ryzhikov, I.; Kost, O.; Afanasev, K.; et al. Human Angiotensin I-Converting Enzyme Produced by Different Cells: Classification of the SERS Spectra with Linear Discriminant Analysis. Biomedicines 2022, 10, 1389. [Google Scholar] [CrossRef]
  24. Slipchenko, E.A.; Boginskaya, I.A.; Safiullin, R.R.; Ryzhikov, I.A.; Sedova, M.V.; Afanasev, K.N.; Nechaeva, N.L.; Kurochkin, I.N.; Merzlikin, A.M.; Lagarkov, A.N. SERS Sensor for Human Glycated Albumin Direct Assay Based on Machine Learning Methods. Chemosensors 2022, 10, 520. [Google Scholar] [CrossRef]
  25. Grigorenko, A.N.; Roberts, N.W.; Dickinson, M.R.; Zhang, Y. Nanometric Optical Tweezers Based on Nanostructured Substrates. Nat. Photonics 2008, 2, 365–370. [Google Scholar] [CrossRef]
  26. Iefuji, N.; Murai, R.; Maruyama, M.; Takahashi, Y.; Sugiyama, S.; Adachi, H.; Matsumura, H.; Murakami, S.; Inoue, T.; Mori, Y.; et al. Laser-Induced Nucleation in Protein Crystallization: Local Increase in Protein Concentration Induced by Femtosecond Laser Irradiation. J. Cryst. Growth 2011, 318, 741–744. [Google Scholar] [CrossRef]
  27. Huettmann, G.; Serbin, J.; Radt, B.; Lange, B.I.; Birngruber, R. Model System for Investigating Laser-Induced Subcellular Microeffects. In Laser-Tissue Interaction XII: Photochemical, Photothermal, and Photomechanical; Duncan, D.D., Jacques, S.L., Johnson, P.C., Eds.; SPIE: Bellingham, WA, USA, 9 July 2001; p. 398. [Google Scholar]
  28. Lee, H.; Kim, M.S.; Suh, S.W. Raman Spectroscopy of Sulphur-Containing Amino Acids and Their Derivatives Adsorbed on Silver. J. Raman Spectrosc. 1991, 22, 91–96. [Google Scholar] [CrossRef]
  29. Podstawka, E.; Ozaki, Y.; Proniewicz, L.M. Part I: Surface-Enhanced Raman Spectroscopy Investigation of Amino Acids and Their Homodipeptides Adsorbed on Colloidal Silver. Appl. Spectrosc. 2004, 58, 570–580. [Google Scholar] [CrossRef]
  30. Stewart, S.; Fredericks, P. Surface-Enhanced Raman Spectroscopy of Amino Acids Adsorbed on an Electrochemically Prepared Silver Surface. Spectrochim. Acta Part A Mol. Biomol. Spectrosc. 1999, 55, 1641–1660. [Google Scholar] [CrossRef]
  31. Stewart, S.; Fredericks, P.M. Surface-Enhanced Raman Spectroscopy of Peptides and Proteins Adsorbed on an Electrochemically Prepared Silver Surface. Spectrochim. Acta Part A Mol. Biomol. Spectrosc. 1999, 55, 1615–1640. [Google Scholar] [CrossRef]
  32. Aliaga, A.E.; Garrido, C.; Leyton, P.; Diaz, F.G.; Gomez-Jeria, J.S.; Aguayo, T.; Clavijo, E.; Campos-Vallette, M.M.; Sanchez-Cortes, S. SERS and Theoretical Studies of Arginine. Spectrochim. Acta Part A Mol. Biomol. Spectrosc. 2010, 76, 458–463. [Google Scholar] [CrossRef] [PubMed]
  33. Kitahama, Y.; Egashira, M.; Suzuki, T.; Tanabe, I.; Ozaki, Y. Sensitive Marker Bands for the Detection of Spin States of Heme in Surface-Enhanced Resonance Raman Scattering Spectra of Metmyoglobin. Analyst 2014, 139, 6421–6425. [Google Scholar] [CrossRef] [PubMed]
  34. McNay, G.; Eustace, D.; Smith, W.E.; Faulds, K.; Graham, D. Surface-Enhanced Raman Scattering (SERS) and Surface-Enhanced Resonance Raman Scattering (SERRS): A Review of Applications. Appl. Spectrosc. 2011, 65, 825–837. [Google Scholar] [CrossRef]
  35. Murshudov, G.N.; Krzywda, S.; Brzozowski, A.M.; Jaskolski, M.; Scott, E.E.; Klizas, S.A.; Gibson, Q.H.; Olson, J.S.; Wilkinson, A.J. RSCB PBD V68N MET MYOGLOBIN. V68N MET MYOGLOBIN. 1998. Available online: https://www.wwpdb.org/pdb?id=pdb_00001m6m (accessed on 24 May 2023). [CrossRef]
  36. Diao, Y.; Harada, T.; Myerson, A.S.; Hatton, T.A.; Trout, B.L. The Role of Nanopore Shape in Surface-Induced Crystallization. Nat. Mater. 2011, 10, 867–871. [Google Scholar] [CrossRef] [PubMed]
  37. Zhou, R.-B.; Cao, H.-L.; Zhang, C.-Y.; Yin, D.-C. A Review on Recent Advances for Nucleants and Nucleation in Protein Crystallization. CrystEngComm 2017, 19, 1143–1155. [Google Scholar] [CrossRef]
  38. De Yoreo, J.J. Principles of Crystal Nucleation and Growth. Rev. Mineral. Geochem. 2003, 54, 57–93. [Google Scholar] [CrossRef]
  39. Kertis, F.; Khurshid, S.; Okman, O.; Kysar, J.W.; Govada, L.; Chayen, N.; Erlebacher, J. Heterogeneous Nucleation of Protein Crystals Using Nanoporous Gold Nucleants. J. Mater. Chem. 2012, 22, 21928–21934. [Google Scholar] [CrossRef]
Figure 1. SEM images of the film surface.
Chemosensors 11 00321 g001
Figure 2. AFM and SEM images of the film surface: (a) the scan size 10 × 10 µm; (b) the morphology cross-section profile 10 × 10 µm; (c) the scan size 5 × 5 µm; (d) defect cross-section profiles for morphology size 5 × 5 µm.
Chemosensors 11 00321 g002
Figure 3. (a) Optical image of typical myoglobin precipitate formed during air drying (type I) for all concentrations; (b,c) optical images of typical myoglobin precipitates formed during laser drying of solutions at concentrations of 60 nM (type II) and 0.6 nM (type III); (d) myoglobin SERS spectra corresponding to each type; centers of orange crosses indicate areas from which spectra were taken.
Chemosensors 11 00321 g003
Figure 4. Presumed orientation of myoglobin molecules relative to Ag SERS-active substrate during air drying: (a) front view and (b) back view. Red—Met; orange—dipeptides Ala–Ala, Leu–Gly, Pro–Leu, and Ala–Gln; blue—Asp and Glu; green—Phe, Trp, and Tyr. Heme is shown as a skeleton.
Chemosensors 11 00321 g004
Figure 5. AFM images of myoglobin dried precipitates: (a) nucleus of crystal-like aggregates (types II and III) for image size of 10 × 10 µm and corresponding (b) cross-sectional profiles; (c) formed crystal-like aggregates (type III) for image size of 7 × 7 µm and corresponding (d) cross-sectional profiles; (e) amorphous type I myoglobin precipitate and corresponding (f) cross-sectional profile.
Chemosensors 11 00321 g005aChemosensors 11 00321 g005b
Figure 6. (a) Optical image of a crystal with pronounced faceting (type II spectrum) and corresponding (b) cross-sectional profiles (Cut 1–Cut 5).
Chemosensors 11 00321 g006
Figure 7. Geometry of the surface feature (Dpore = 2Rp).
Chemosensors 11 00321 g007
Figure 8. Dependence of the ratio of formation energies of critical-size nuclei in pore to planar surface G p o r e / G p l a n a r and in pore to homogeneous mechanism G p o r e / G h o m at supersaturation S = 0.7 and 0.9 for pores with depth H p of 15, 20, and 25 nm. The dependency G p o r e / G p l a n a r is also presented for pore depth for a pore with a diameter of 50 nm at supersaturation S = 0.7.
Chemosensors 11 00321 g008
Table 1. Interpretation of vibration bands in myoglobin SERS spectra for three types of sample preparation.
Myoglobin Bands, cm−1Amino AcidBand Assignment
Type IType IIType III
278 (w) [28]Skeletal def.
306 (w)
362 (w) 370 (vw) Skeletal def.
405 (s) [28]Skeletal def.
418 (m) 425 (vw)--
487 (vw) --
525 (w)524 (vs)524 (m)--
535 (vw) --
547 (w) --
603 (w)610 (m)606 (vw)--
627 (vw) 625 (vw)620–630 (m) Met [29]νs (C–S)
-653 (vw)644(vw)644–686 (m) Met [28]νs (C–S)
-663 (vw) 644–686 (m) Met [28]νs (C–S)
--721 (s)721 (s) Asp [30]δs (COO)
770 (s)765 (s)763 (w)772 (w) Val [30]
755 (m) Trp [30]
Indole symm ring
854 (w)861 (vw)-847 (m) Tyr [30]Fermi resonance between ring breath
and out-of-plane ring bend overtone
892 (m)-895 (vw)--
874 (m) Trp [30]Indole NH displ
-915 (m)
927 (w)--930 (m) Asp [30]C-COO-str
937 (w) [2]α-helix
-949 (vw)-947 (vw) Leu-Gly [31]νs (C–C)
947 (vw) Val [30]νs (C–C)
--981 (vw)978 (w) Arg [32]δs (CH2) (aliphatic fragment)
985 (vw) Asn [30]νs (C–C)
-1033 (w)1037 (w)1032 (vw) Ile [30]νs (C–N)
1034 (vw) Phe [30]δs (CH) In-plane
1052 (vs)1051 (s)1056 (vs)1050 (vw) Gln [30]νs (C–N)
1050 (w) Ala-Ala [31]νs (C–N)
PheIn-phase motion of n(Cε1-Cζ) and n(Cε2-Cζ) coupled with in-phase motion of d(Cζ-Cε1-H) and d(Cζ-Cε2-H)
1066 (s)1061 (m)-1066 (w) Gly-Glu (Glu) [31]νs (C–N)
1131 (w)1134 (vw)1134 (vw)1130 (vw) Leu [30]δs (NH3+)
-1188 (m)-1184 (m) Phe [29]Characteristic aromatic ring bands
1252 (vw)--1230–1300 Amide III [2]α-helical marker
1250 (vw) Glu [30]ω (CH2)
1299 (w)1299 (m)1300 (vw)1303 heme [33]δs (CH2)2
1301 (w) Pro-Leu (Leu) [31]δs (CH2)
1352 (vw)-1352 (w)1352 (vw) Glu [30]δs (CH2)
1357 (w) Trp [30] hemeRing
1353 (m) Met [30]δs (CH3)
1391 (vw)1392 (vw)-1373 (w) heme [28]-
-1410 (w)---
1441 (m)1448 (vw)1442 (w)1440 (m) Lys [30]δs (CH2)
1440 (m) Leu-Gly (Gly) [31]
1467 (s)1468 (s)1468 (w)1464 (w) Lys [30]δs (CH2)
-1549 (vw)-1549 (m) Met [29]-
1541 heme [33]νs (Cβ–Cβ)
1607 (vw)--1613 (m) Tyr [30]νs (C2–C3) and νs (C5–C6) in-phase
1611 heme [33]νa (Cα–Cm)
-1643 (vw)-1643 (m) Met [29]δs (NH2)
1639 heme [33]νa (Cα–Cm)
--1667 (w)1663 (w) Ala-Gln (Gln) [31]νs (C=O)
Abbreviations: νs—symmetrical stretching; νa—asymmetrical stretching; δs—in-plane symmetrical scissoring; ω—wagging; τ—twisting; s—strong; vs—very strong; m—medium; w—weak; vw—very weak.
Disclaimer/Publisher’s Note: The statements, opinions and data contained in all publications are solely those of the individual author(s) and contributor(s) and not of MDPI and/or the editor(s). MDPI and/or the editor(s) disclaim responsibility for any injury to people or property resulting from any ideas, methods, instructions or products referred to in the content.

