Article

Trimethylsilylethynyl-Substituted Pyrene Doped Materials as Improved Fluorescent Sensors towards Nitroaromatic Explosives and Related Compounds

by
Roman D. Chuvashov
1,
Ekaterina F. Zhilina
2,
Kseniya I. Lugovik
2,
Anna A. Baranova
1,
Konstantin O. Khokhlov
1,
Danil V. Belyaev
3,
Mohamad Zen Eddin
2,4,5,
Gennady L. Rusinov
2,4,
Egor V. Verbitskiy
2,4,* and
Valery N. Charushin
2,4
1
Institute of Physics and Technology, Ural Federal University, Mira Str. 19, Ekaterinburg 620002, Russia
2
I. Postovsky Institute of Organic Synthesis, Ural Branch of the Russian Academy of Sciences, S. Kovalevskaya Str. 22, Ekaterinburg 620108, Russia
3
M.N. Mikheev lnstitute of Metal Physics, Ural Branch of Russian Academy of Sciences, 18 S. Kovalevskaya Str., Ekaterinburg 620137, Russia
4
Chemical Engineering Institute, Ural Federal University, Mira Str. 19, Ekaterinburg 620002, Russia
5
College of Science, University of Aleppo, Mouhafaza Str., Aleppo 12212, Syria
*
Author to whom correspondence should be addressed.
Chemosensors 2023, 11(3), 167; https://doi.org/10.3390/chemosensors11030167
Submission received: 27 January 2023 / Revised: 16 February 2023 / Accepted: 27 February 2023 / Published: 1 March 2023
(This article belongs to the Special Issue Feature Papers on Luminescent Sensing)

Abstract

:
The well-known fluorophore, namely 1,3,6,8-tetrakis[(trimethylsilyl)ethynyl]pyrene, has been studied profoundly as a fluorescent sensor toward nitroaromatic compounds in solutions and vapor phase. Three prototypes of fluorescent materials for vapor sensing were prepared via electrospinning and drop-casting onto the melamine formaldehyde foam with the fluorophore as a pure solid or as a dopant in the polystyrene matrix. It has been shown that this fluorophore and solid fluorescent materials based on it have high detection limits toward nitroaromatic compounds within the range of 10−8 to 10−9 M in acetonitrile solution and within the up to ppb range in the vapor phase. The model, expanding on Frisch’s permeation model, was utilized to characterize the fluorescence response of materials relative to vapor concentration and duration of exposure to vapor. All prototypes can be used as sensor materials exhibiting a good sensitivity and selectivity for the original hand-made sniffer for detecting nitro-containing explosives in the vapor phase for real-time application.

1. Introduction

The development of new chemosensors and chemosensor-derived materials for trace probing of various explosives and explosive precursors is an important challenging aim for homeland security, demining, and ecological monitoring efforts worldwide [1,2]. Nitroaromatic compounds (NACs) are widely used for the preparation of explosive blends, but also NACs have applications as agrochemicals, dyes, and pharmaceuticals. In particular, 2,4,6-trinitrotoluene (TNT); 2,4-dinitrotoluene (2,4-DNT); and 2,4,6-trinitrophenol (picric acid, PA) can be used as a primary explosive in munitions, including landmines [3]. Both explosive and non-explosive NACs, such as nitrobenzene (NB), are toxic and carcinogenic compounds [4,5], with exposure limits in the air at the 8 h interval regulated down to 0.2 ppm for NB vapor, and down to 1.5 mg m−3 for 2,4-DNT and 2,4,6-TNT [6,7].
Although many precise techniques exist for NAC detection and quantification (e.g., mass spectrometry, ion mobility spectrometry, gas/liquid chromatography), they are generally expensive and feature complex devices that are time-consuming to operate and less often portable [8,9], but achieve selective and precise detection of analytes at up to sub-ppt vapor pressures [2]. On the other hand, various sensor types and devices based on methods such as surface-enhanced Raman spectrometry [10], quartz microbalances [11], electrochemical sensors [12], colorimetric and fluorescent sensors [13] have been developed that are cheaper, less complex, suitable for on-site application, and allow detection of analyte vapors in ppm to ppt concentrations range [2]. The fluorescent method is particularly interesting due to the simplicity of technical implementation, high sensitivity, low cost, and the capability of the stand-off detection of NAC vapor traces. The attenuation in fluorescence intensity, emission wavelength, anisotropy, or fluorescence lifetime could be registered, with the integral fluorescence intensity attenuation possible to register even with the naked eye [14,15,16]. Fluorescent detectors of analyte vapors most often register the emission quenching of the sensor material exposed to electron-deficient NAC molecules, and depending on the sensor material design and used fluorophores have detection limits toward NACs from sub-ppm to sub-ppt concentration range [17,18,19,20,21].
Significant efforts were put into the research of fluorescent polymers with unique optical and sensing properties [22,23,24,25]. Their high sensitivity is attributed to the “molecular wire” effect of exciton migration along the polymer chain, allowing the quenching of multiple monomers at once by a single quencher molecule [21,26]. However, the synthesis of such polymers is complicated, and their high sensitivity in solutions does not translate directly into the sensitivity toward vapor phase analytes due to the mechanics of the analyte interaction with the sensor material [27]. Recently, Ali reported that fluorescent sensing dendrimer films do not benefit from the “molecular wire” effect due to permeation into the thick of the polymer material being the dominant factor in forming fluorescent response on exposure to vapor phase quenchers [28,29]. The implication of this is that a simpler approach to synthesizing monomolecular fluorophores can be used to achieve a gas-phase sensitivity level comparable to one of the fluorescent polymers.
Though employing fluorescent polymers for gas phase sensing might not bring enhanced sensitivity, doping fluorophores into polymer matrices can be used to adjust the optical and electrochemical properties of fluorophores [30,31,32], adapt fluorophores for use in specific conditions [33], and increase the photostability of fluorophores [34]. The use of polymer matrices also allows obtaining the surface of the sensor material via conventional polymer deposition methods, such as electrospinning [35,36] and the breath figure [37,38], that can be employed to produce materials with increased surface area. For example, Sun developed pyrene-doped polystyrene (Py-PS) porous sensing film via the breath figure method that has shown enhanced optical properties and sensitivity towards 2,4-DNT vapors, compared to pure pyrene [39]. Jang attributed the enhanced sensitivity of Py-PS electrospun fibers to the decreased LUMO energy level and concluded that exciton migration along the PS chain is not the key mechanism defining the quenching efficiency by 2,4-DNT vapor [40].
The combination of a sensor material with a sorbent in a vapor sensing setup helps to achieve a higher fluorescence response. It was shown by Yu that a composite consisting of electrospun fluorophore-doped PS fibers and gelatin fibers has better sensitivity compared to fluorophore–PS fibers alone [41,42]. The increased sensitivity was attributed to the hydrogen bonding of NACs to gelatin molecules and gelatin porosity that resulted in the accumulation of the quencher close to a fluorophore. The PS itself is known for its sorption properties [43] and was previously reported to be used as an adsorbent of organic molecules [44,45,46].
Polycyclic aromatic hydrocarbons, such as pyrene and its derivatives, proved to have high quantum yields and chemical stability [47,48]. In particular, 1,3,6,8-tetrakis[(trimethylsilyl)ethynyl]pyrene was described [49] and suggested to be a NAC sensor in solution and vapor phase, as a film fabricated via drop-casting onto glass [50]. Xu reported that this fluorophore forms four kinds of aggregate types with differing optical characteristics, that can be manipulated mechanically, thermally, or by solvent vapor treatment [51]. This implies that the method of fabrication of sensor material might have an impact on the detection sensitivity towards vapor phase analytes, but no research studies of sensor properties of materials relative to the fabrication method or polymer matrices containing the fluorophore have so far been reported for 1,3,6,8-tetrakis[(trimethylsilyl)ethynyl]pyrene.
For the detection of low concentrations in solutions, the Stern–Volmer model of fluorescence quenching is widely applied to obtain quenching constants and limits of detection. A similar model and method of characterization for vapor phase analytes are lacking, though for polymer materials the relation of fluorescent signal to vapor concentration probably has a log–log form [52]. The model of fluorescent response toward analytes in vapors must reflect not only vapor concentration but also the duration of fluorescent material exposure to vapors. Researchers that put forward new fluorescent sensor compounds often limit the showcase of the gas phase sensing applicability to the exposure by saturated analyte vapor [53,54] or low vapor concentrations of the analyte [55] in static gas mixtures. However, the practical application of fluorescent materials often implies the detection of transient and diluted analyte vapor brought to the sensor material with the airflow driven by a sensing device’s pump [56,57,58].
Here, we wish to report a sensor application of pyrene derivative 1,3,6,8-tetrakis[(trimethylsilyl)ethynyl]pyrene, further abbreviated as F, toward NACs in solution and vapor phases. To adapt F for gas-phase sensing, three new fluorescent polymer materials based on F were obtained. The impact on sensor properties of polystyrene (PS) matrix, the concentration of F doped into PS, and sensor material deposition via electrospinning and drop-casting were studied. Obtained materials were used to fabricate a permeable sensor type based on a melamine formaldehyde foam. Fluorescent materials were characterized by UV–vis and photoluminescent spectroscopy, and their fluorescence quenching response on exposure to NAC and non-NAC vapors was studied. Lastly, we put forward a method to obtain calibration curves of fluorescent response relative to vapor-phase quencher concentration and duration of material exposure to vapor expanding on Frisch’s analyte permeation model. The proposed model is used to characterize the fluorescent response of the most sensitive sensor materials toward diluted NACs vapors.

2. Results

Firstly, we discuss the capability of fluorophore 1,3,6,8-tetrakis[(trimethylsilyl)ethynyl]pyrene, abbreviated as F, to detect NACs in solutions. Subsequently, we follow up with obtaining and characterizing solid sensor materials based on F and a blend of F with PS as sensors toward vapor phase analytes. The molecular structures of F and PS are shown in Figure 1.

2.1. Photophysical Studies of F in Chloroform Solution

The fluorescence spectra of F in chloroform and acetonitrile solutions are shown in Figure S1; ФF values were determined relative to quinine sulfate in 0.1Nr H2SO4 as standard (ФF = 0.54) [59]. The spectra were recorded in the concentration range of 10−6–10−5 M, and therefore the reported data correspond only to monomer emission. In chloroform, absorption peaks are at 250, 259, 291, 303, 316, 389, 412, 438 nm; maximum molar extinction coefficient at 438 nm is 160,000 M−1cm−1; emission peaks are at 444, 472 nm; quantum yield 0.49; obtained results agree with previously reported data [49,50]. In acetonitrile, absorption peaks are at 292, 308, 313, 369, 387, 408, 412, 433 nm; maximum molar extinction coefficient at 433 nm is 70,000 M−1cm−1; emission peaks at 447, 470 nm; quantum yield 0.49.

2.2. Detection of Nitroaromatic Compounds in Acetonitrile Solution

To estimate the ability of the F to detect nitroaromatic analytes in solution, the fluorescence titration was performed in acetonitrile using a method previously reported in [60]. The structures of used nitroaromatic analytes are shown in Figure 2. The mechanism of the fluorescence quenching of F by NACs was previously studied in [50] and it was attributed to the electron transfer complex formation. The efficiencies of fluorescence quenching were quantified by the Stern–Volmer constants (KSV) according to the Stern–Volmer’s fluorescence quenching model I0/I = 1 + KSV × [Q], where I0 and I are the fluorescence intensities in the absence and in the presence of a quencher in solution and [Q] represents the quencher concentration. The detection limits (DL) were determined as DL = 3σ/KSV = 3 × SNR−1 KSV−1, where σ and SNR are the standard deviations of the noise and signal-to-noise ratio of the fluorimeter used to register fluorescence attenuation, respectively. The quenching efficiencies at 447 nm, Stern–Volmer constants, and detection limits are summarized in Figure 3 and Figures S2–S5, and Table 1. The highest quenching efficiencies were observed for nitrophenols and nitrobenzene with detection limits in the 10−9 M range exceeding previously reported values for monomolecular probes [61].

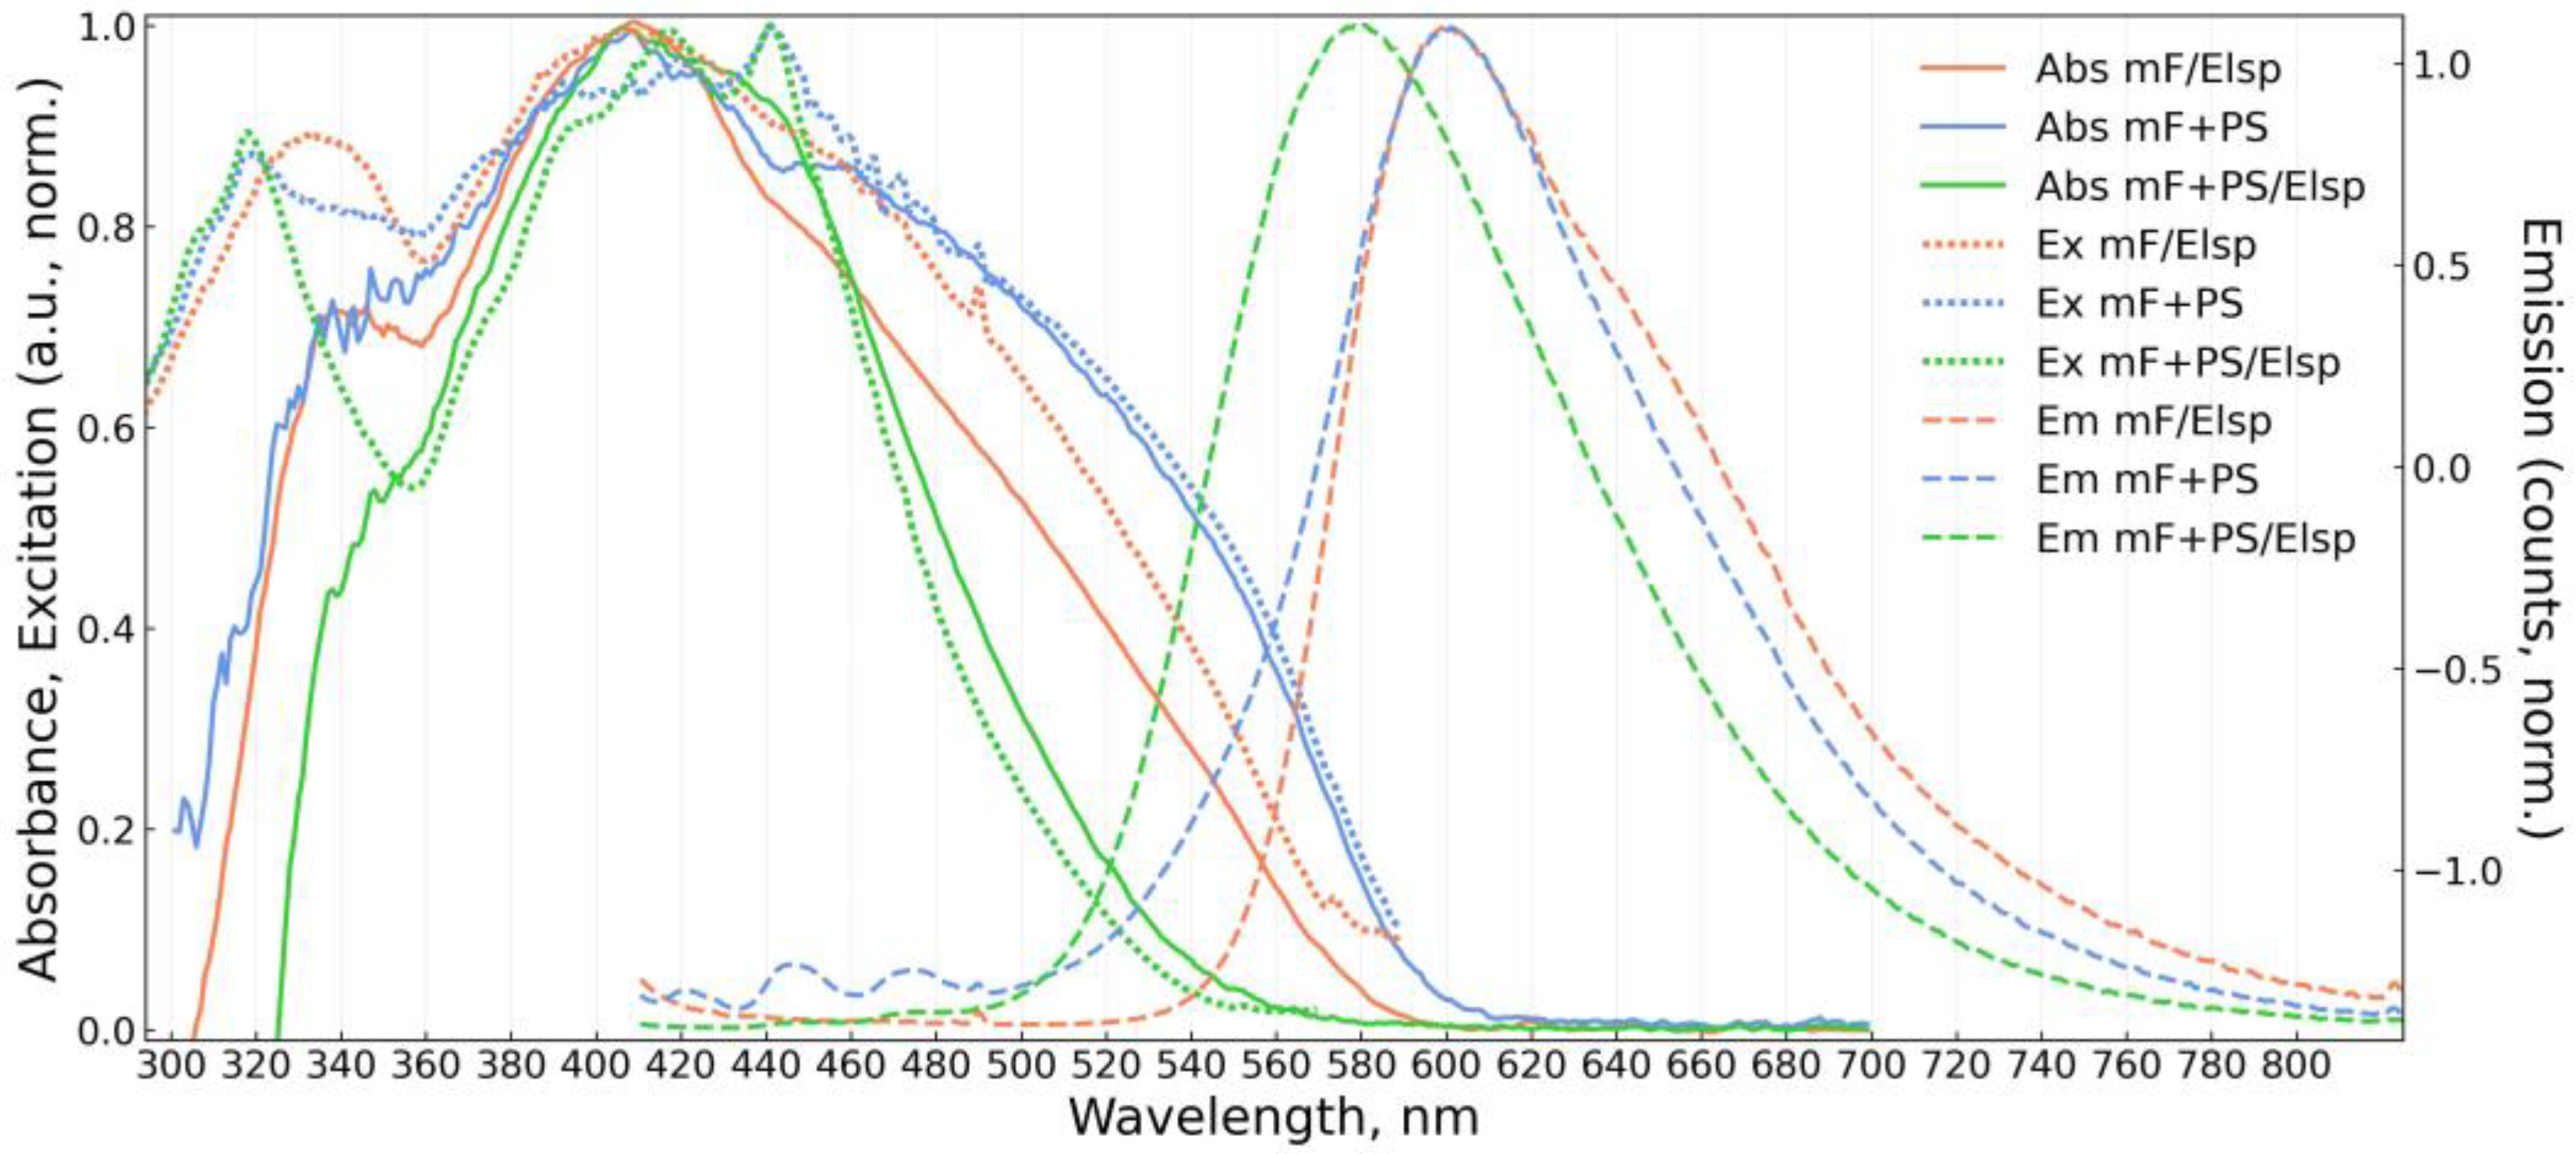
2.3. Morphology and Photophysical Studies of Obtained Solid Sensory Materials

Based on F, three sensor materials for vapor phase sampling were obtained at various concentrations of the fluorophore. The material mF/Elsp was produced via an electrospinning solution of F in tetrahydrofuran (THF) at Cfluor = 5 × 10⁻³ M. The material mF+PS was obtained via a drop-casting solution of F and PS. The material mF+PS/Elsp was obtained via electrospinning the solution of F and PS. Electrospinning parameters in both cases were selected according to the literature [63,64,65]. The melamine formaldehyde foam was selected as a deposition substrate to produce sensor materials and fabricate sensor types via the previously described method [66]. In brief, commercially available melamine formaldehyde foam was cut into sheets and works as an air-permeable inert substrate for materials deposition. A review of previously reported implementations of melamine formaldehyde foam as a substrate for sensor compounds toward vapor phase analytes is given in Table S1 [67,68,69,70,71]. Versions of materials mF+PS, mF+PS/Elsp at various concentration orders of F were prepared to study the dependence of photophysical and sensory properties on the dopant versus PS concentration ratio (1 × 10⁻², 1 × 10⁻³, and 1 × 10⁻⁴ M of F for mF+PS; 2 × 10⁻², 2 × 10⁻³, and 2 × 10⁻⁴ M of F for mF+PS/Elsp).
Figure 4 and Figures S6–S8 show images of obtained fluorescent materials captured under UV and visible illumination under magnification. The mF/Elsp deposition resulted in a foam web covered with the fluorophore. For the mF+PS/Elsp, the molecular weight of used PS was not high enough to form fibers and deposition occurred as spraying of PS beads of 13.3 ± 3.2 μm size (mean ± std) with a shape resembling the one reported in the literature used to select electrospinning parameters. For mF+PS, drop-casted solution on evaporation produced droplets of PS adjusting to the shape of the foam web with F appearing orange in the thick and blue in droplets at web connections. This is supposedly related to F concentration distribution in material regions, with blue regions containing low F concentration that is insufficient to form longer wavelength emitting F excimer aggregates.
Photophysical properties of obtained solid materials mF/Elsp and mF+PS, mF+PS/Elsp at different concentration orders of F were investigated at room temperature by using UV/vis and photoluminescence spectroscopy. The resulting steady-state absorption, emission, and excitation spectra are shown in Figure 5, Figure 6 and Figure 7. Data for mF/Elsp are repeated on graphs.
All solid materials are bathochromically shifted in emission compared to the emission of F in solutions. Spectra of PS-containing materials show a significant dependence on concentration. At 10−4 M concentration order PS-containing materials exhibit mixed emission spectra consisting of short wavelength structured components from vibrational bands of F monomer and of bathochromically shifted excimer emission in 560–600 nm band. A similar mixed monomer and excimer emission was reported in [72] where F was doped into polymethylmethacrylate (PMMA). For mF+PS/Elsp at 10−4 M of F, the vibrational structure in emission and absorption is more prominent than in mF+PS at 10−4 M of F, suggesting that the application of an electric field during deposition hinders the formation of excimers. Even at higher fluorophore concentrations and broadening absorption spectra, the structured absorption of the monomer is noticeable and more prominent for mF+PS/Elsp compared to mF+PS indicating the decrease in aggregation in the strong electric field during deposition. Broadening of absorption spectra for mF+PS and mF+PS/Elsp with increasing concentration of F can be attributed to steric hindrance of the fluorophore surroundings, increasing with the fluorophore concentration and formation of aggregates.
The same hindering of excimer formation must take place during deposition of mF/Elsp, and the broad emission at 601 nm and absorption terminus at 590 nm agree with the respective wavelengths for amorphous Oa-form of aggregates appearing as an orange powder reported in [51]. Notably, orange needle-like structures can be obtained with F drop-casted not in an electric field onto the substrate that corresponds by appearance to “rigid” Oc-form aggregates with 620 nm absorption terminus.
The shift of absorption peak for mF+PS/Elsp 10−2 M of F concentration to shorter wavelengths relative to the one of mF+PS/Elsp at 10−4 M of F concentration indicates the formation of H-aggregates that was reported to occur without a loss in quantum yield for pyrene- and perylene-based fluorophores [51].
To select the optimal fluorophore concentration from the NAC sensing perspective obtained materials were exposed for 30 s to saturated vapors of 2,4,6-TNT accumulated in a 10 mL flask, the recording is shown in Figure S11. The PS-containing materials with higher concentrations of fluorophores showed a bigger quenching response and were selected for further study; further abbreviations of obtained materials imply fluorophore concentrations of 2 × 10⁻² M for mF+PS/Elsp and 10−2 M for mF+PS. Notably, mF+PS/Elsp response was weaker than that of mF+PS, suggesting that aggregation of F is preferable for vapor phase sensing of NACs. A method to suppress monomer formation could be used to enhance the sensitivity of F in polymer matrices.
The photostability and brightness of selected materials were tested by exposing materials to UV illumination at 40 mW power in static air as shown in Figure S12. The photodecay is faster for mF/Elsp compared to PS-containing materials: 0.75%, 0.25%, and 0.18% of initial intensity was lost after UV exposure for materials mF/Elsp, mF+PS, and mF+PS/Elsp, respectively. The fluorescence of PS-containing materials appeared to be brighter than that of mF/Elsp. These effects can be attributed to the polymer matrix interfering with the access of molecular oxygen to F. Molecular oxygen is a known dynamic quencher of fluorescence and can participate in the oxygen-dependent pathway of photobleaching [34].

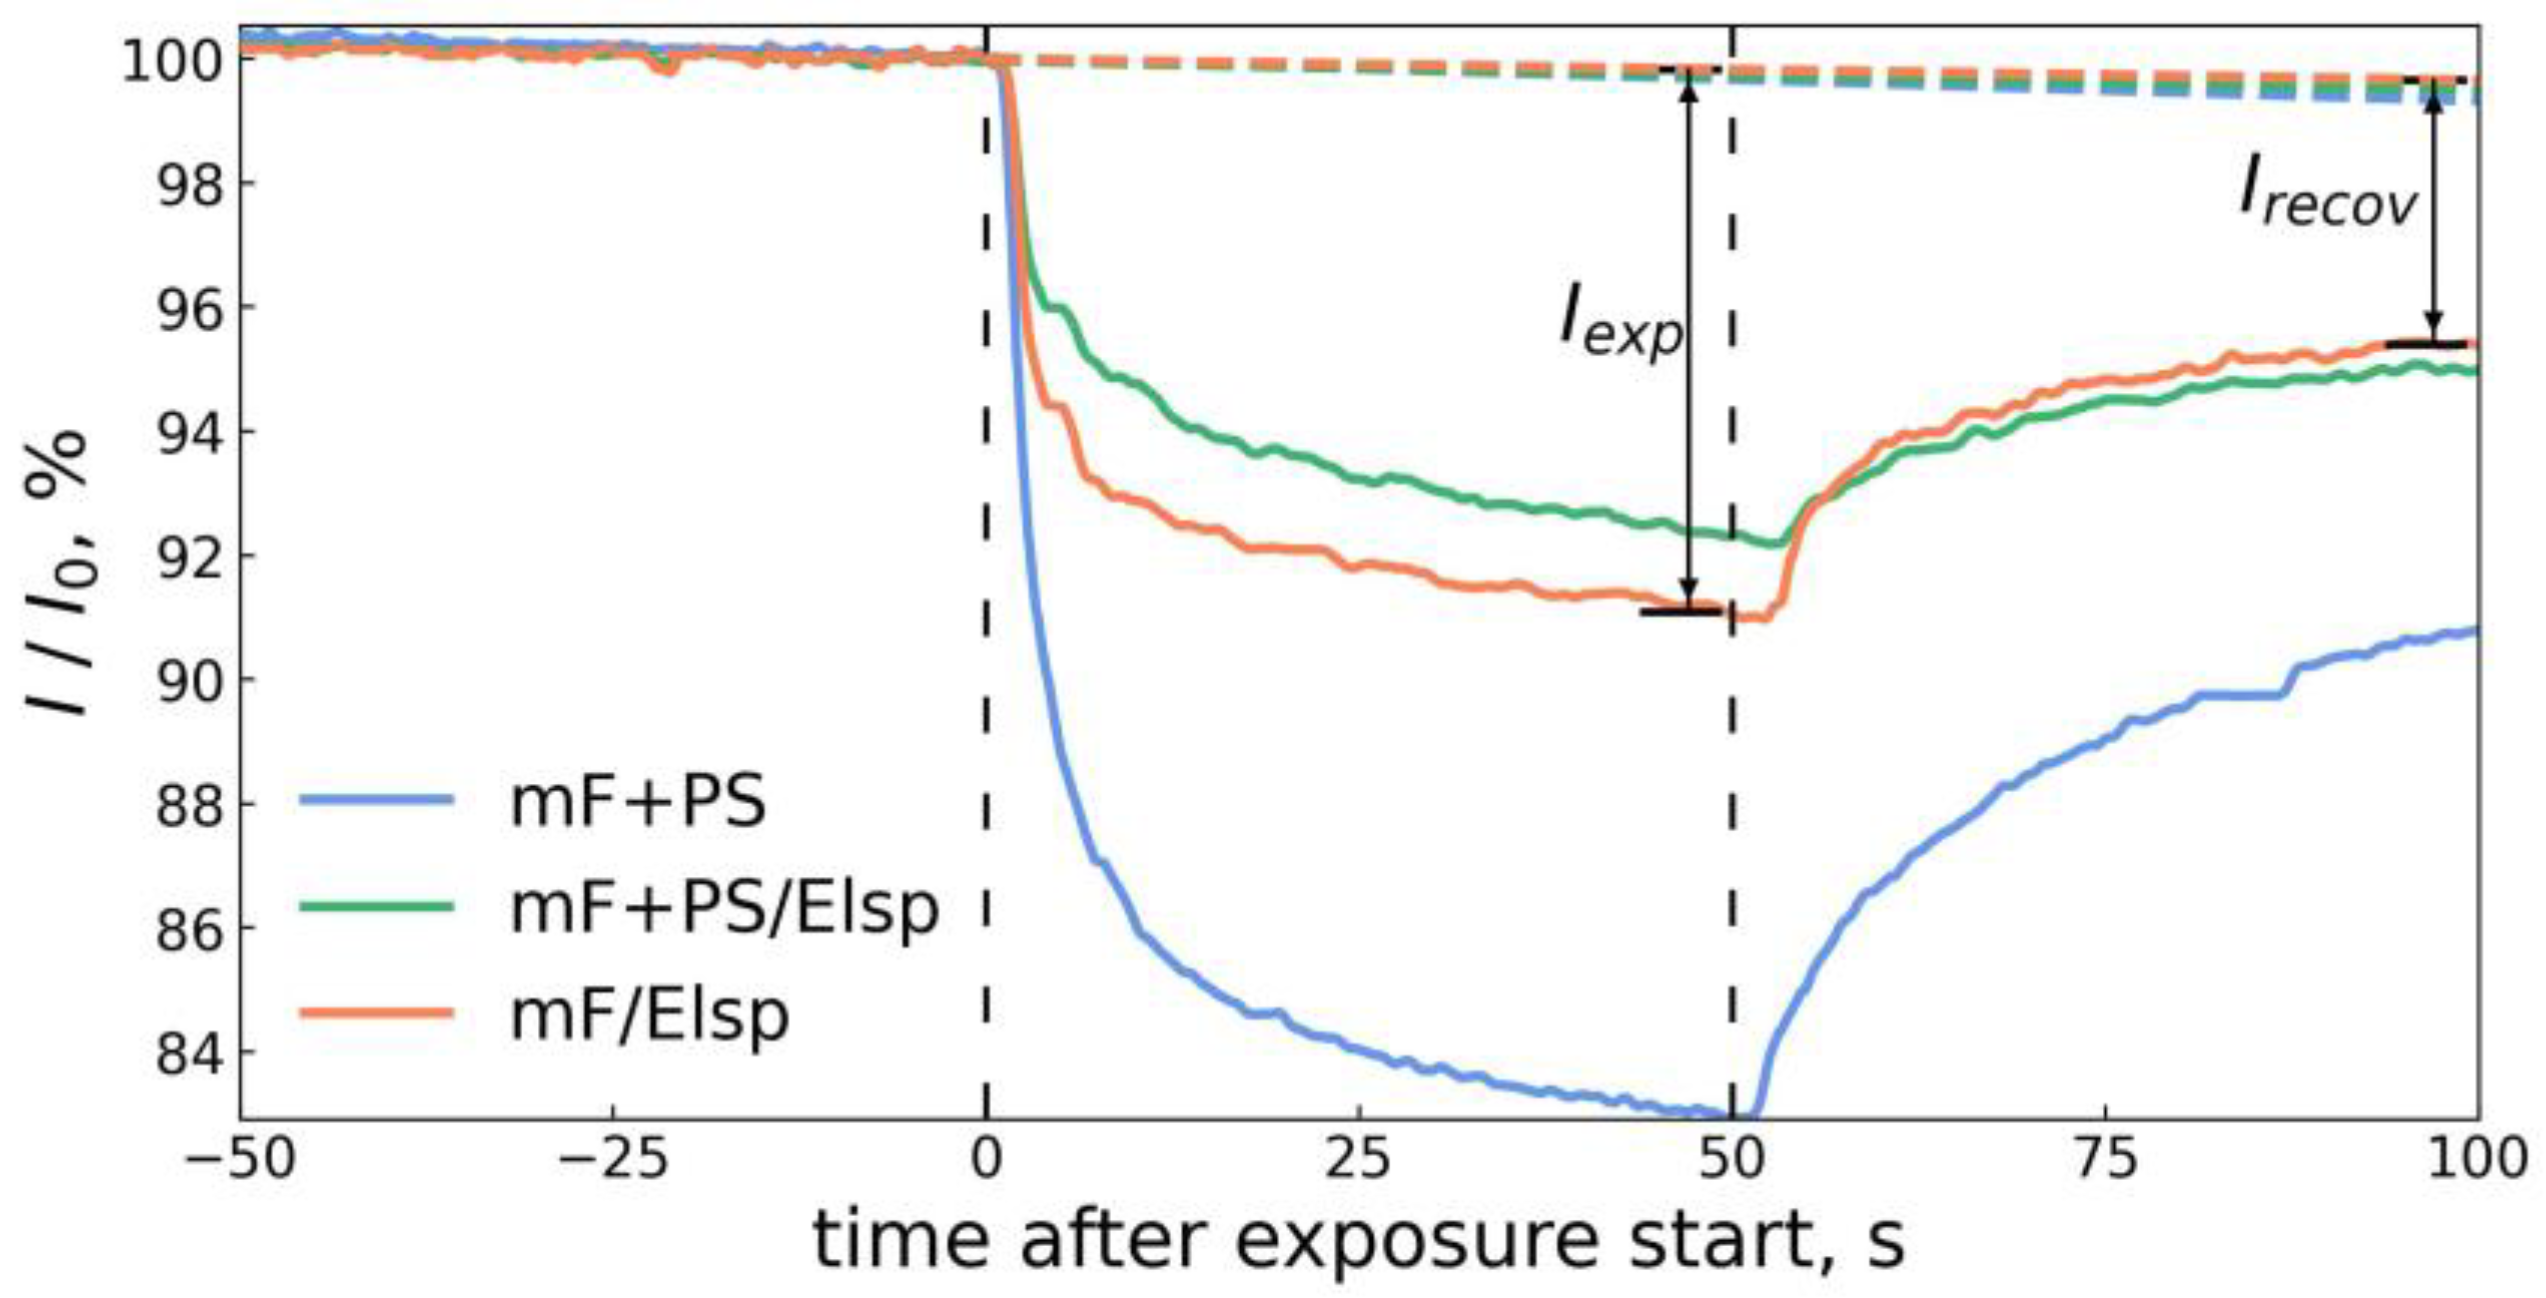
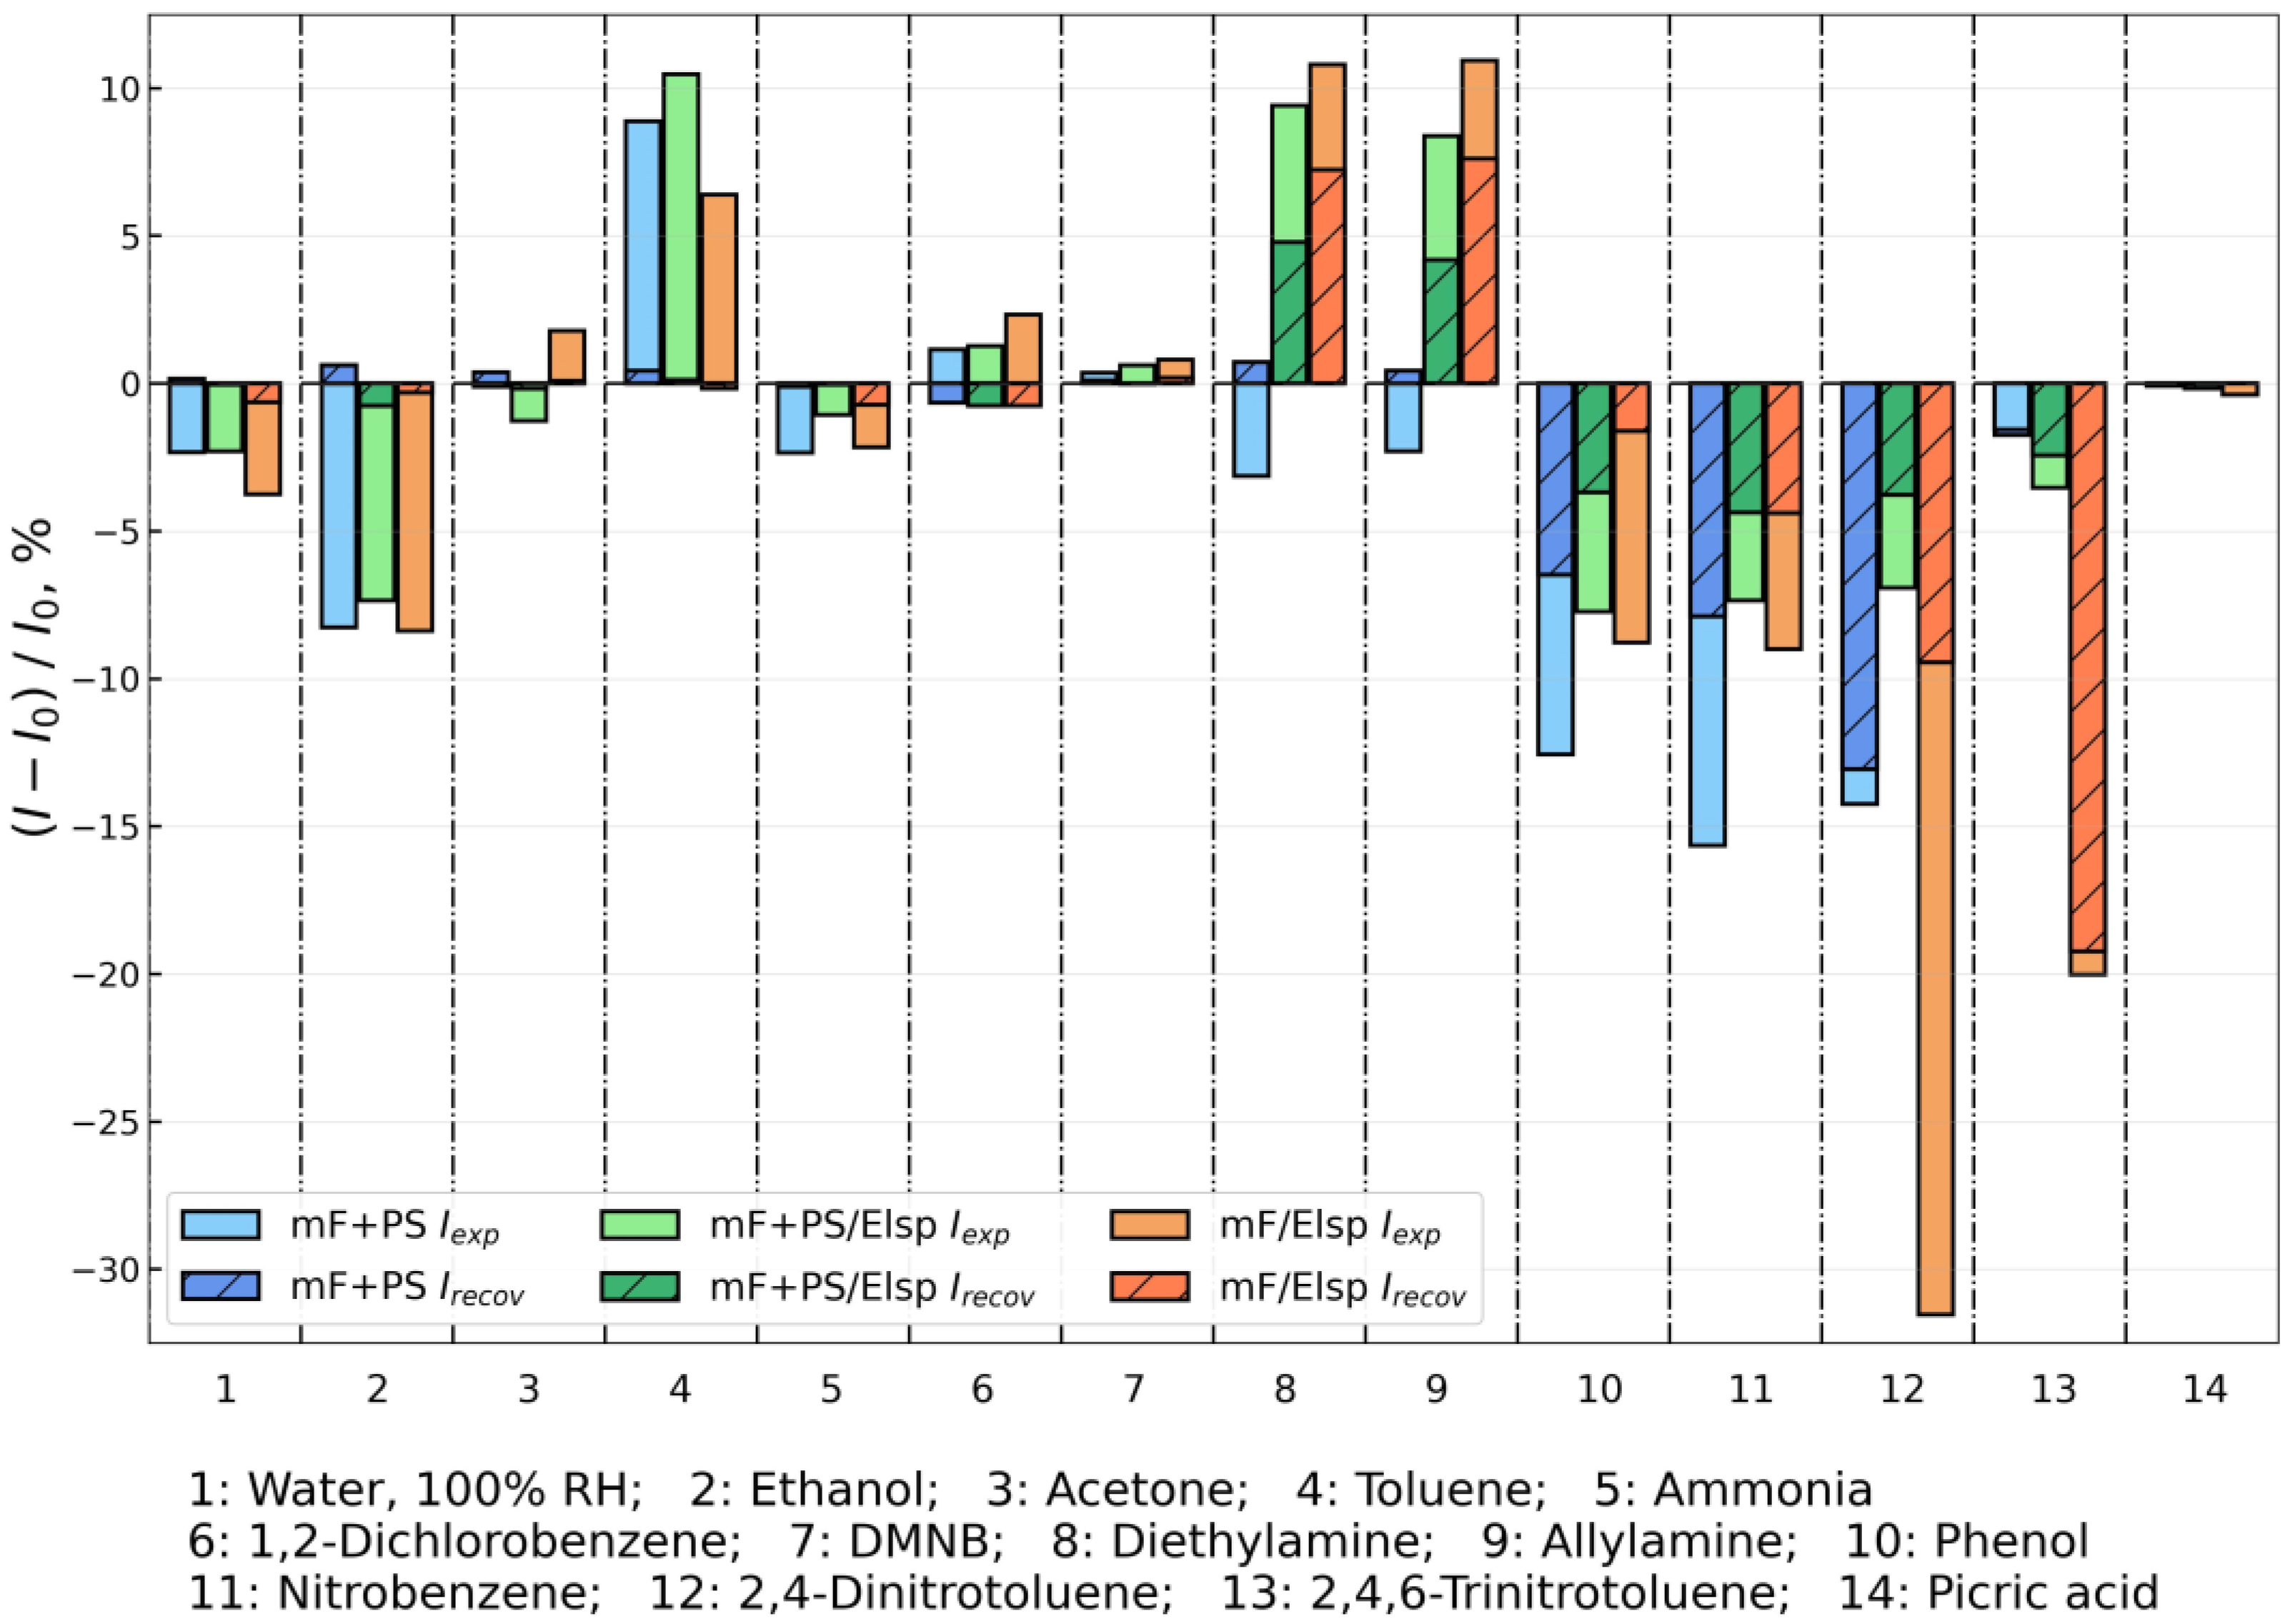
2.4. Sensing Performance towards Various Analytes in Vapor Phase

The evaluation of the fluorescent signal of materials to vapor phase analytes was performed as follows. Previously reported sensor cartridges and fluorescence recorders were used to fabricate sensor elements and record fluorescence quenching [66]. Briefly, the fluorescence recorder (Figure S9) based on a compact camera was used to register the fluorescence response of an array of sensor materials (Figure 8 and Figure S10). Foam sheets bearing sensor materials were cut into square fragments and installed into slots of the sensor element. Structures of nitroaromatic and non-nitroaromatic analytes used for gas-phase evaluation are shown in Figure 9.
The general scenario of the recording consisted of an interval of material exposure to analyte vapors preceded and followed by periods of air cleaning from analyte vapor. An example of fluorescence attenuation recording with a 50 s exposure interval is shown in Figure 10. The UV illumination intensity, pump rate, and analyte vapor concentration during exposition were kept constant. To obtain diluted concentrations of analyte vapor previously described hardware was used [66] that allowed obtaining saturated vapor and its dilutions down from 10% of saturated concentration. For further details, we refer the reader to the “General Information” section in Supplementary Materials.
Similar to the Stern–Volmer model for fluorescence quenching in solution, fluorescence intensities in absence of analyte I0 and in presence of analyte I were defined for vapor phase testing. During the exposure interval and past it, the observed fluorescence intensity was taken as I, and I0 was predicted by a linear model trained on intensity points preceding the exposure interval. By this method, the photobleaching of employed fluorescent materials was accounted for. Differences between I0 and I at the end of exposure to vapors Iexp and at the end of post-exposure material recovery under clean air Irecov were taken as metrics of the sensor response to analyte vapor as shown in Figure 10.
The fluorescence intensity responses on 50 s exposure to saturated vapors of non-nitroaromatic (see columns 1–10) and nitroaromatic (see columns 11–14) analytes are presented in Figure 11.
Reversible quenching to water, ethanol, acetone, toluene, ammonia, 1,2-dichlorobenzene, and DMNB was recorded for all materials. That can be ascribed to weak sorption by materials due to their non-aromatic nature. That allows reversible fluorescence attenuation, especially for water vapor, which is abundantly present during on-site monitoring.
Fluorescence enhancement was observed on exposure to toluene, diethylamine, and allylamine which can be attributed to the higher LUMO level of these analytes compared to the one of fluorophore F in the sensor material [73]. Notably, weak quenching was observed for mF+PS on exposure to diethylamine and allylamine, indicating a higher LUMO level of mF+PS compared to other sensor materials.
Quenching response with reduced reversibility of the signal was observed for nitroaromatic compounds NB, 2,4-DNT, 2,4,6-TNT, and for non-nitroaromatic phenol. The decrease in signal reversibility points out to the sorption of aromatic compounds by PS. The maximum quenching on exposure to NB was observed for PS-containing mF+PS, and the maximum quenching from DNT and TNT was achieved with mF/Elsp. It suggests that the sorptive property of PS enhances the signal produced by aromatic and volatile molecules by preventing their desorption. For NACs with lower vapor pressure such as 2,4-DNT, 2,4,6-TNT, PA the addition of PS matrix hinders access of NAC molecules to the fluorophore. The material mF/Elsp was the only one to produce a quenching signal toward the PA which is the least volatile NAC used in the work (saturated vapor concentration 0.97 ppb at 25 °C), showing the detection limit toward NACs for mF/Elsp at below 1 ppb level. In comparison to previously reported fluorescent polymers, obtained materials show enhanced sensitivity towards weakly volatile nitroaromatic solids such as 2,4-DNT and 2,4,6-TNT and achieve direct sensing of PA at a 50 s exposure interval, but show lesser response to NB [66].
The study of fluorescence quenching in solution showed that F is selective toward nitrophenols, however in the vapor phase the fluorescence response of NB, 2,4-DNT, 2,4,6-TNT is higher compared to the very weak response to PA vapor observed only for mF/Elsp. This difference in sensitivity in solution and vapor phases can be attributed primarily to the lower vapor pressure of PA (0.9 ppb at 25 °C) compared to the vapor pressure of NB, 2,4-DNT, and 2,4,6-TNT (371.6 ppm, 411 ppb, and 9.1 ppb at 25 °C, respectively). Due to lower volatility, the total mass of molecules sorbing from the saturated vapor is lower, resulting in a weaker fluorescent response in solid materials.
Lesser reversibility of fluorescent response for aromatic analytes and variations in Iexp and Irecov metric values suggest that a combination of materials could be used for the recognition of NACs in a vapor phase. To assess the potential of applying pattern recognition to the sensor response data, the principal component analysis (PCA) dimensionality reduction technique was utilized on Iexp and Irecov metrics for materials mF/Elsp and mF+PS. The PCA is an unsupervised clustering method that transforms given data into new orthogonal dimensions based on linear combinations of initial dimensions. The result of the transformed data from Figure 11 is shown in Figure 12. First, two principal components capture 92.6% of the initial total variance, and nitroaromatic analytes that produce the strong quenching signal such as NB, 2,4-DNT, 2,4,6-TNT can be conveniently separated from non-nitroaromatic analytes by a linear model.

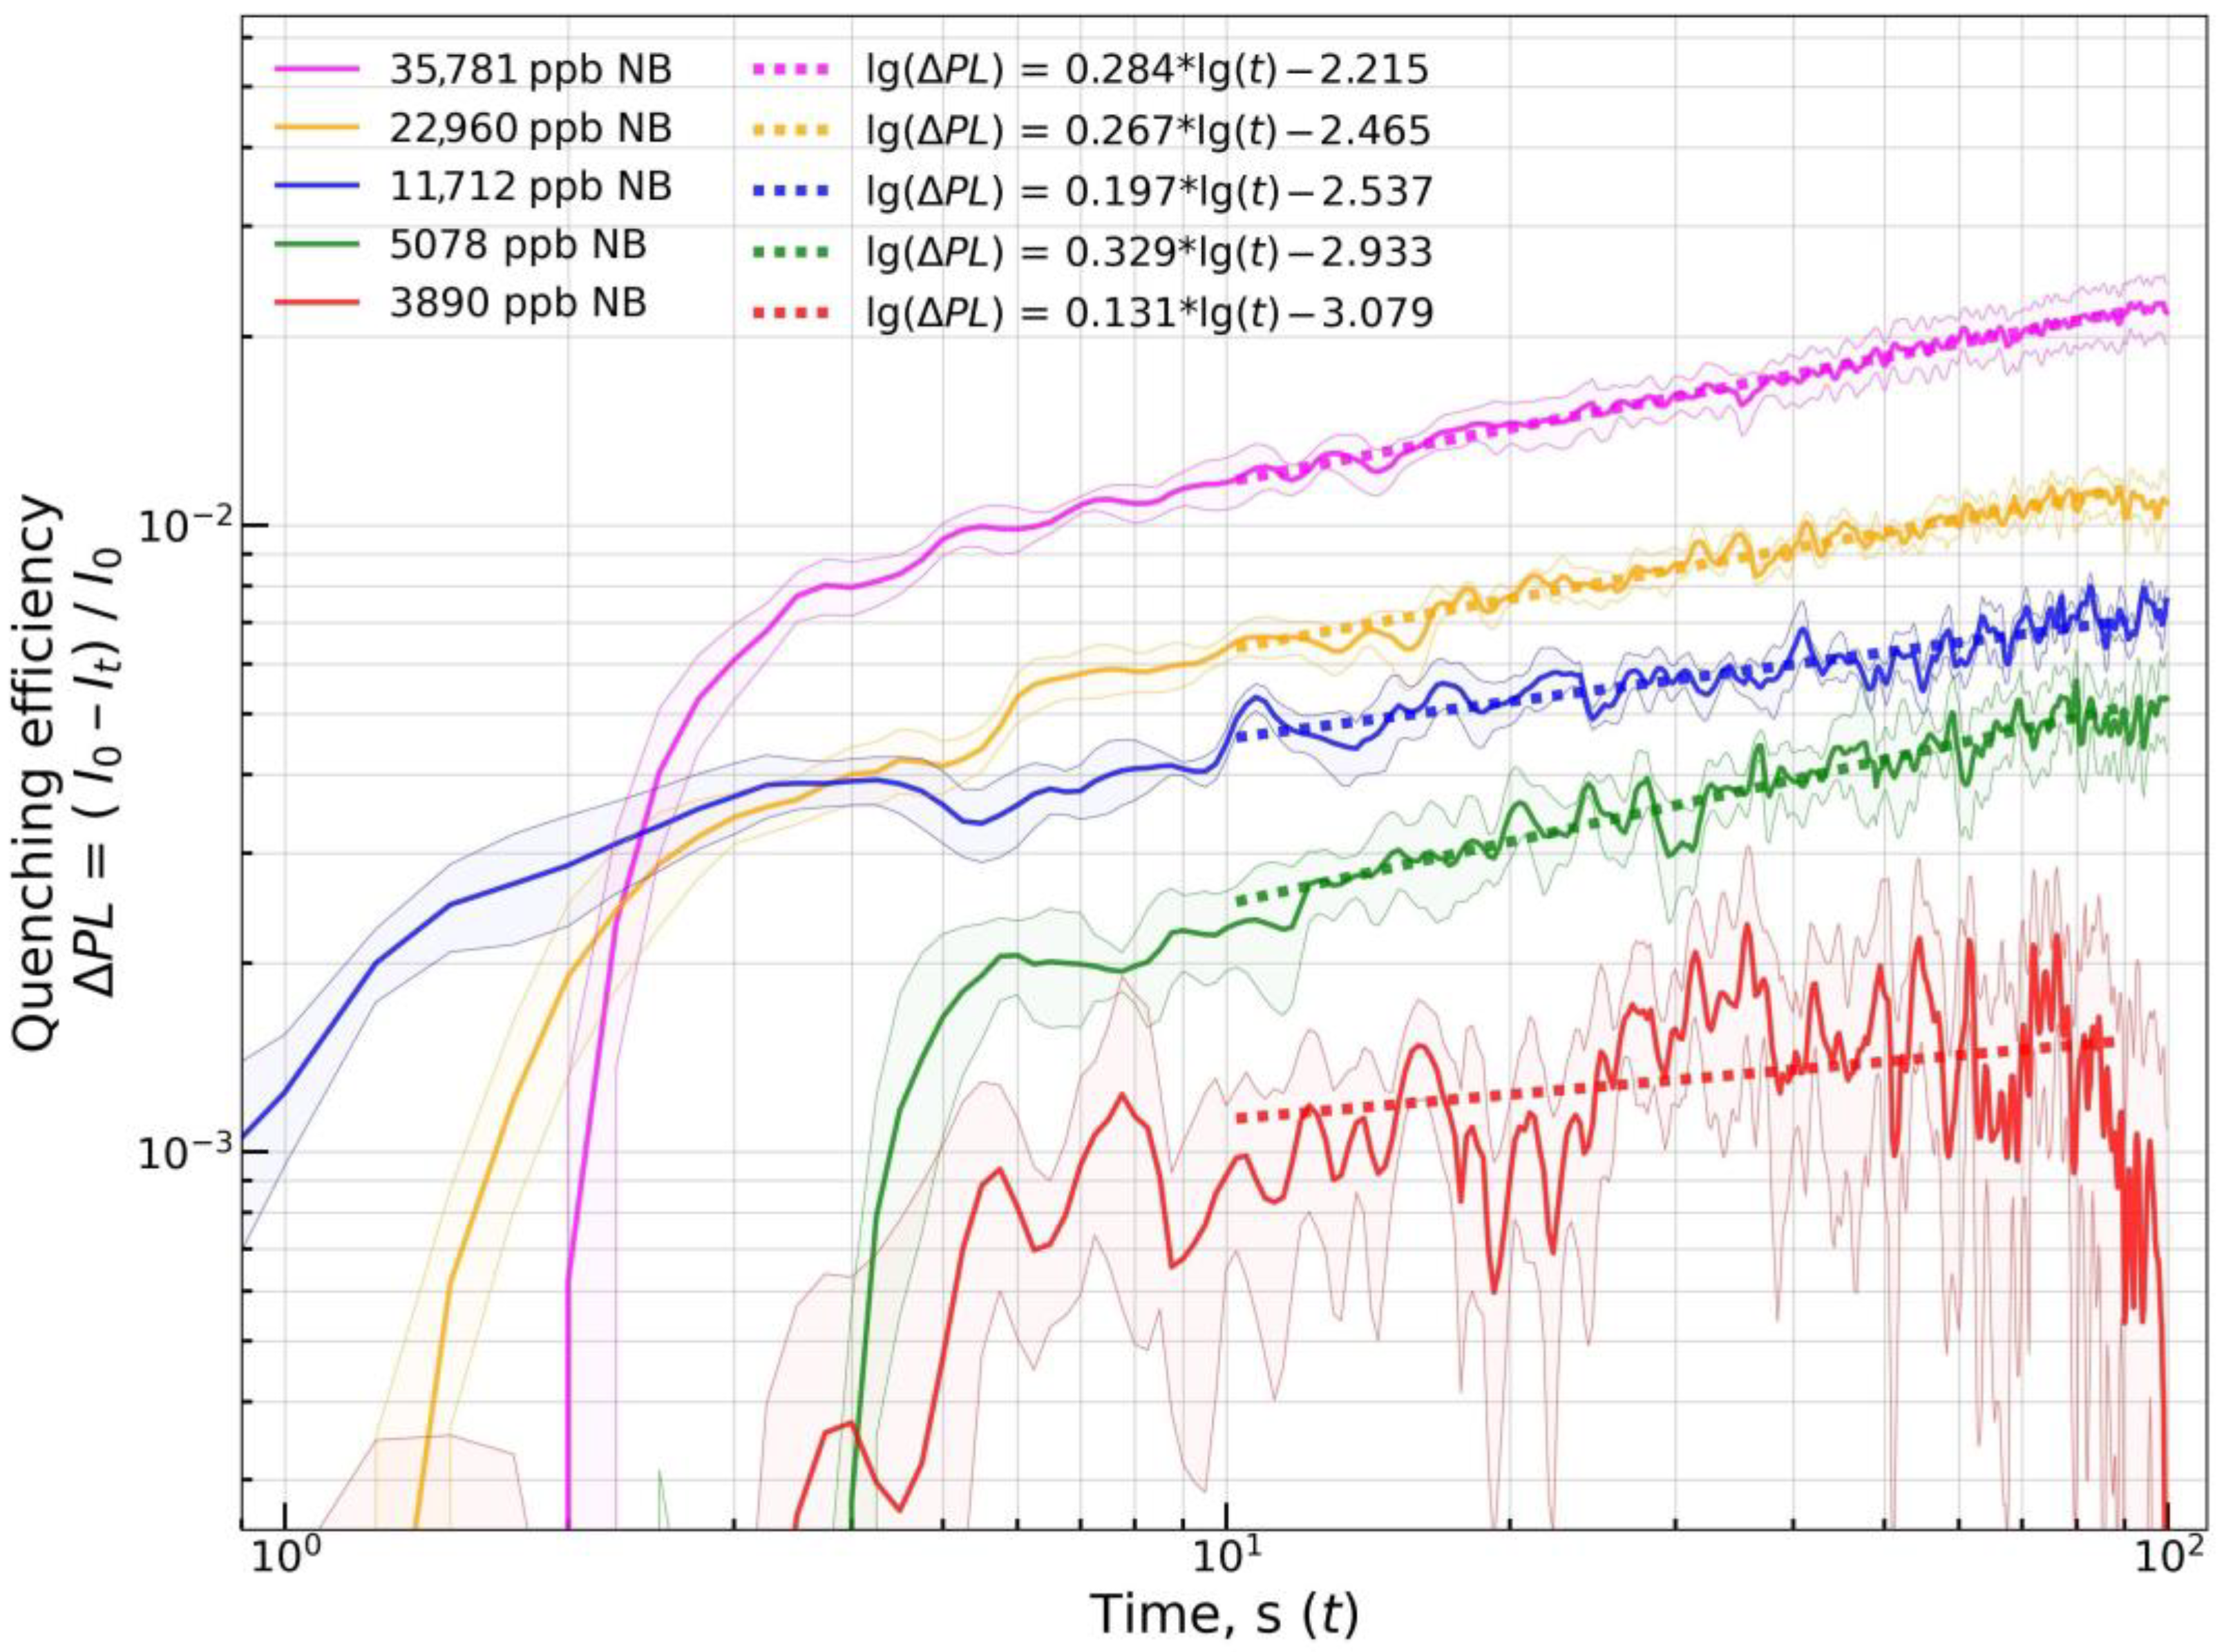
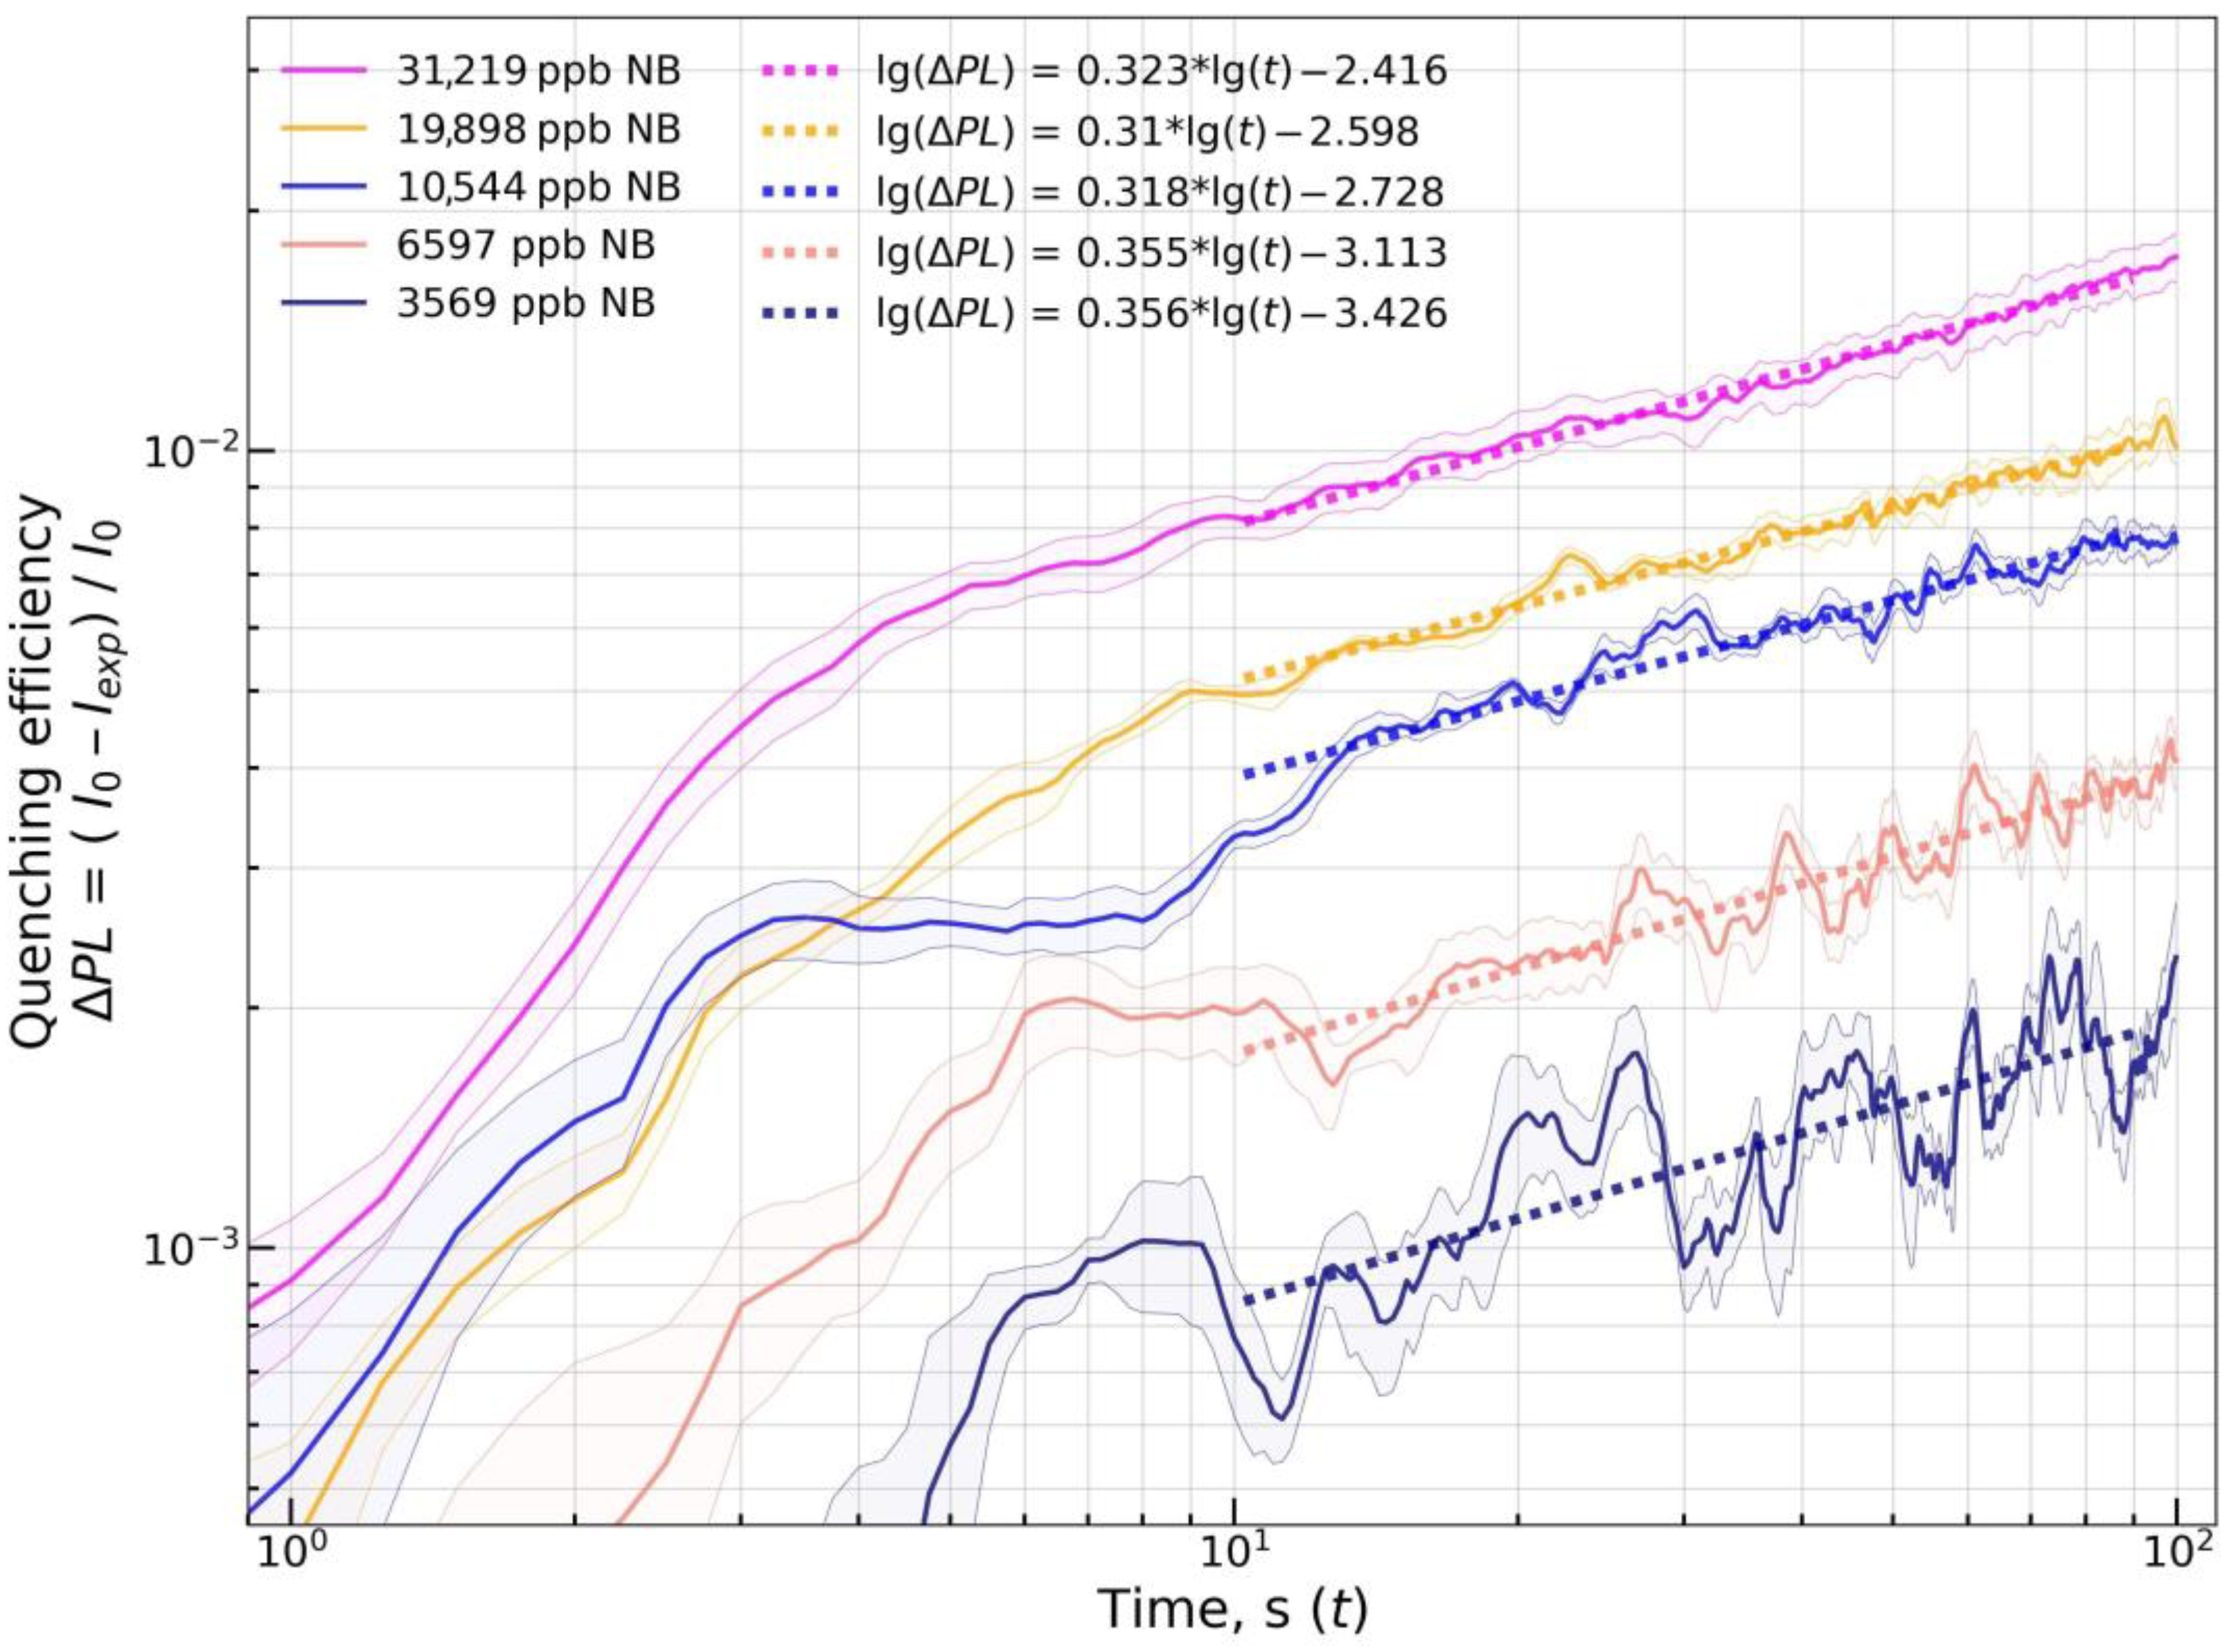
2.5. Sensing Properties Characterization Based on Diffusion Model

For glassy polymers, the sorption of analyte molecules from vapor into the polymer occurs as the formation of the diffusion front and its advance into the thick of the material [74]. The diffusion front forms due to the diffusion speed of the analyte’s molecules in the clean polymer being lesser than in the polymer saturated with the analyte. In this case, Frisch’s equation is used to formally describe mass uptake by the polymer layer:
mt = k × tn,
lg(mt) = lg(k) + lg(t) × n
where mt is the mass uptake at the t time moment, n is the transport exponent, and k is the empirical rate constant describing the scale of the mass uptake [27]. Often Equation (1) is used in the log form as in (2) with an arbitrarily selected logarithm base. Equation (1) is reasonable to use to model mass uptake by flat solids initially clean from the analyte and in which diffusion front has formed during exposure and is located far from the material’s boundaries.
From the fluorescent sensing perspective, the permeation of the quenching analyte as a saturated front into sensor material allows to link the sorbed mass with the fluorescent response via approximately linear dependency [29]. During the stable-state propagation of the saturation front, the equal degree of quenching for materials with different thickness will require sorption of different quencher masses. The parameter η describing quencher mass required per unit of fluorescent response can be used as in a following equation:
mt = η × ∆PL = η × (1 − It/I0)
where ∆PL is fluorescence attenuation of the solid material, I0 and It are registered fluorescence intensities of the material before and during exposure to analyte vapor at the time t. By substituting mt from (3) into (2) the equation for the fluorescent response of the material towards the sorption of the quencher can be derived:
lg(∆PL) = lg(k’) + lg(t) × n
where k’ is the empirical constant defining the scale of fluorescent response for a given sensor material and a quencher vapor at a constant vapor concentration. Equation (4) could be used to characterize the maximum sensing potential of the sensor material type. The assumptions of the model are the linear relation of the lg(∆PL) to lg(t) during stable-state front propagation and the parameter n being constant over a range of vapor concentrations.
To verify the validity of assumptions, fluorescent materials mF+PS and mF/Elsp were exposed to vapors of NB, 2,4-DNT, and 2,4,6-TNT at various concentrations. Based on results with saturated vapors in Section 2.3, materials mF/Elsp and mF+PS and analytes NB, 2,4-DNT, 2,4,6-TNT were selected for further study; tests with mF+PS as a sensor to 2,4,6-TNT were not conducted. Sets of at least four sensor materials at once were allocated on the sensor cartridge that was exposed to vapor at a constant concentration in a 100 s exposure interval. Quenching responses were plotted in lg(1 − It/I0) vs. lg(t) coordinates, and the results are shown in Figure 13, Figure 14 and Figures S14–S16.
The linear model was fit onto obtained quenching responses at the t interval from 10 to 90 s to obtain estimates of the permeation transport exponent parameter n ^ (mean ± std). The interval from 10 to 90 s was chosen to exclude the initial phase with saturation front formation and the final phase that might contain error in concentration due to specifics of used vapor generation hardware. For quenching by NB, n ^ values of 0.27 ± 0.05 and 0.33 ± 0.02 were obtained for mF/Elsp and mF+PS, respectively. For quenching by 2,4-DNT, n ^ values of 1.08 ± 0.14 and 1.15 ± 0.12 were obtained for mF/Elsp and mF+PS, respectively. Results show linearity of the lg(∆PL) vs. lg(t) relation, with the records obtained at the highest vapor concentrations fitted well with the linear function. Relatively low relative standard deviations of all n ^ estimates suggest that the transport character can be assumed as the same over a range of concentrations not only for polymer materials such as mF+PS but also for non-polymer crystalline solids such as mF/Elsp. For quenching by 2,4,6-TNT, the mean n value of 0.74 was obtained for mF/Elsp.
At the lowest used concentrations, the fluorescent signal of the material for mF/Elsp vs. NB and mF/Elsp vs. NB remains almost constant over the exposure period. It can be attributed to the error in I0 prediction by a linear model extrapolating the intensity point preceding the quenching interval. In addition, it could be attributed to the saturation front not forming at low penetrant vapor concentration [75] with the easily permeable surface layer of polymer being quenched [76]. Such recordings were excluded from the n ^ estimation.
With the increase in quencher concentration, the parameter lg(k’) tends to increase, and it could be used to obtain graduation curves of the fluorescent response relative to the vapor concentration of the quencher and exposure time. However, due to the error present in the n ^ estimation, it is to be chosen what value of t to take as a starting value to plot the n ^ × lg(t) relation. We used the fluorescence quenching value at t = 90 s due to its higher absolute values and calculated an estimate of lg( k ^ ) as:
lg ( k ^ ) = lg ( Δ P L t = 90 )     n ^   ×   lg ( 90 )
where ∆PLt=90 is the fluorescence signal at t = 90 s. Obtained lg( k ^ ) estimates were plotted versus lg(C) for quenchers NB and 2,4-DNT versus sensor materials mF/Elsp and mF+PS. The linear model was fit with the equation below to the data as shown in Figure 15:
lg ( k ^ ) = a   +   lg ( C )   ×   b
where a and b are coefficients of the linear fit, and lg(C) is the lg of vapor concentration in ppb. Obtained coefficients are shown in Table 2. By substituting lg( k ^ ) in (4) with the one in (6), the model of fluorescence quenching response of the sensor material on exposure to vapors of an analyte at concentration C during duration t takes a following form:
lg ( Δ P L )   =   ( a   +   b   ×   lg ( C ) )   +   n ^   ×   lg ( t )
which allows calculating detection limits toward the vapor phase analyte knowing the SNR of the fluorescence recording device (Table 3). Additionally, we refer the reader to the Supplementary Materials (see “Quenching model derivation” section).

3. Conclusions

It has been shown that 1,3,6,8-tetrakis[(trimethylsilyl)ethynyl] pyrene-doped materials can be used for the fabrication of fluorescent sensors for the on-site detection of nitroaromatic explosives and related compounds. It has been clearly demonstrated that the emission of the fluorophore and obtained polymer material was highly sensitive towards various nitroaromatic compounds, both in solution and in the vapor phase. The detection limits of 1,3,6,8-tetrakis[(trimethylsilyl)ethynyl]pyrene for nitroaromatic compounds in acetonitrile solution reached 2.03 × 10⁻⁹ M. The sensor materials for our hand-made sniffer based on this pyrene derivative, which was prepared by electrospinning and drop-casting onto the melamine formaldehyde foam with the fluorophore as a pure solid or as a dopant in the polystyrene matrix, were applied for the reliable detection of 2,4-dinitrotoluene vapors at 4.5 ppb during 100 s.

4. Materials and Methods

For the information on previously described used analytical equipment and methods, we refer the reader to the Supplementary Materials (see “General information” section).

Preparation of Sensing Materials

Commercially available melamine formaldehyde foam cut into 2 mm thick sheets was used as a substrate for deposition of solutions.
The material mF+PS has been prepared by drop-casting 25 µL of 10−2 M fluorophore and 2.5% w/v PS solution onto the substrate at 24% relative humidity (RH) and 25 °C temperature. Variants of mF+PS with lower F concentrations were prepared with fluorophore concentrations in solution equal to 10−3 M and 10−4 M.
Material mF/Elsp has been prepared via electrospinning 400–450 µL of solution containing 5 × 10⁻³ M of fluorophore onto the melamine formaldehyde foam.
Material mF+PS/Elsp has been prepared via electrospinning 400–450 µL of solution containing 2 × 10⁻² M of fluorophore and 5% w/v of PS. The concentration of F in mF+PS/Elsp was selected at higher value due to two-fold difference in PS concentration in the solution used to prepare sensor materials. Variants of mF+PS/Elsp with lower F concentrations were prepared with fluorophore concentrations in solution equal to 2 × 10⁻³ M and 2 × 10⁻⁴ M. Electrospinning parameters in both cases were selected according to the literature [63,64,65]. For the details of the materials fabrication we refer the reader to the Supplementary Materials (see “Fabrication of sensor materials”)

5. Supplementary References That Are Not Used in Main Text

Analyte concentration in the airflow is meant by its vapor pressure. To correct concentration values based on gas temperature during measurement, the Antoine equation was used for NB [77], and the Clausius–Clapeyron equation for 2,4-DNT, 2,4,6-TNT, and PA [78]. The coefficient A in the latter was adjusted per analyte to make the resulting vapor pressures match pressure data from ref. [79] at 25 °C.
Polystyrene (Mw = 25 kDa, Mn = 13 kDa, PDI = 1.90) was synthetized from styrene (99.5% stabilized with 4-tert-butylcatechol, “Alfa Aesar”, China) according to the earlier reported procedure [80].

Supplementary Materials

The following supporting information can be downloaded at: https://www.mdpi.com/article/10.3390/chemosensors11030167/s1, General Information; Fabrication of Sensor Materials; Figure S1: Absorption and fluorescence spectra of 1,3,6,8-tetrakis[(trimethylsilyl)ethynyl]pyrene in chloroform and acetonitrile solutions.Table S1: Previously reported studies utilizing melamine-formaldehyde foam for preparation of sensor materials; Quenching model derivation; Figure S2: Fluorescence quenching studies of 1,3,6,8-tetrakis[(trimethylsilyl)ethynyl]pyrene in acetonitrile solution recorded in the presence of various concentrations of NB (a), 1,3-DNB (c), 1,3,5-TNB (e), TATB (g). The Stern-Volmer plots of fluorescence quenching at 447 nm wavelength as a function of concentration for NB (b), 1,3-DNB (c), 1,3,5-TNB (e) and TATB (h); Figure S3: Fluorescence quenching studies of 1,3,6,8-tetrakis[(trimethylsilyl)ethynyl]pyrene in acetonitrile solution recorded in the presence of various concentrations of 2-NP (a), 4-NP (c), 2,4-DNP (e). The Stern-Volmer plots of fluorescence quenching at 447 nm wavelength as a function of concentration for 2-NP (b), 4-NP (d), 2,4-DNP (f); Figure S4: Fluorescence quenching studies of 1,3,6,8-tetrakis[(trimethylsilyl)ethynyl]pyrene in acetonitrile solution recorded in the presence of various concentrations of 4-NT (a), 2,4-DNT (c), 2,4,6-TNT (e), DDBu (g). The Stern-Volmer plots of fluorescence quenching at 447 nm wavelength as a function of concentration for 4-NT (b), 2,4-DNT (d), 2,4,6-TNT (f) and DDBu (h); Figure S5: Fluorescence quenching studies of 1,3,6,8-tetrakis[(trimethylsilyl)ethynyl]pyrene in acetonitrile solution recorded in the presence of various concentrations of DNAN (a), TNAN (c), PA (e), SA (g). The Stern-Volmer plots of fluorescence quenching at 447 nm wavelength as a function of concentration for DNAN (b), TNAN (d), PA (f) and SA (h); Figure S6: Microphotos of obtained fluorescent sensing material mF/Elsp under white light (a,c) and 365 nm UV illumination (b,d). Photos with same level of magnification represent the same region on the sample; Figure S7: Microphotos of obtained fluorescent sensing material mF+PS under white light (a,c) and 365 nm UV illumination (b,d). Photos with same level of magnification represent the same region on the sample; Figure S8: Microphotos of obtained fluorescent sensing material mF+PS/Elsp under white light (a,c) and 365 nm UV illumination (b,d). Photos with same level of magnification represent the same region on the sample; Figure S9: Fluorescence recorder used in measurements with vapor phase analytes; Figure S10: Photos of the typical sensor cartridge loadout used in measurements captured under 365 nm UV illumination in the dark by the phone camera (a) and by the camera of the fluorescence recorder during the measurement (b); Figure S11: Fluorescence quenching curves of a set of obtained solid polystyrene-based materials containing various concentrations of doped fluorophore on exposure to vapors saturated in a 10 mL flask containing less than 10 grams of 2,4,6-TNT. Vapor exposure interval is marked with vertical dashed lines; Figure S12: Photobleaching of obtained fluorescent sensor materials under approximately 40 mW of 365 nm UV illumination; Figure S13: Set of three mF/Elsp materials versus 50 sec exposure to saturated vapors of picric acid; Figure S14: lg(∆PL) vs lg(t) plot for material mF/Elsp at various 2,4-DNT vapor concentrations. A set of at least four sensor materials on the sensor element was used to record each quenching response. Each solid lines and shaded area around it represent the mean and the std.dev. of the quenching response at selected time point. Dashed lines are linear approximations of lg(∆PL) vs lg(t); Figure S15: lg(∆PL) vs lg(t) plot for material mF+PS at various 2-4,DNT vapor concentrations. A set of at least four sensor materials on the sensor element was used to record each quenching response. Each solid lines and shaded area around it represent the mean and the std.dev. of the quenching response at selected time point. Dashed lines are linear approximations of lg(∆PL) vs lg(t); Figure S16: lg(∆PL) vs lg(t) plot for material mF/Elsp at various 2,4,6-TNT vapor concentrations. A set of at least four sensor materials on the sensor element was used to record each quenching response. Each solid lines and shaded area around it represent the mean and the std.dev. of the quenching response at selected time point. Dashed lines are linear approximations of lg(∆PL) vs lg(t).

Author Contributions

Conceptualization, E.V.V.; data curation, A.A.B. and R.D.C.; formal analysis, E.F.Z. and R.D.C.; funding acquisition, R.D.C., G.L.R. and V.N.C.; supervision, A.A.B.; investigation, E.F.Z., R.D.C. and K.I.L.; methodology, E.F.Z., R.D.C. and K.O.K.; project administration, E.V.V.; resources, K.O.K., M.Z.E. and D.V.B.; software, R.D.C.; validation, E.V.V. and G.L.R.; visualization, R.D.C.; writing—original draft, R.D.C. and E.V.V.; writing—review and editing, E.V.V. and V.N.C. All authors have read and agreed to the published version of the manuscript.

Funding

The reported study was funded by RFBR, project number 20-37-90108. The synthetic part of this work was supported by the Ministry of Science and Higher Education of the Russian Federation within the framework of the State Assignment for Research (Project No. AAAA-A19-119011790132-7).

Institutional Review Board Statement

Not applicable.

Informed Consent Statement

Not applicable.

Data Availability Statement

The data presented in this study are available on request from the corresponding authors and co-authors.

Acknowledgments

Analytical studies were carried out using equipment from the Center for Joint Use “Spectroscopy and Analysis of Organic Compounds” at the Postovsky Institute of Organic Synthesis of the Ural Branch of the Russian Academy of Sciences. Roman D. Chuvashov acknowledges Igor I. Milman for helpful insights and supervision.

Conflicts of Interest

The authors declare no conflict of interest.

Sample Availability

Samples of fluorophore F and sensor materials mF/Elsp, mF+PS, mF+PS/Elsp are available from the authors.

References

  1. Yinon, J. (Ed.) Counterterrorist Detection Techniques of Explosives; Elsevier: Amsterdam, The Netherlands, 2007. [Google Scholar]
  2. Giannoukos, S.; Brkić, B.; Taylor, S.; Marshall, T.; Verbeck, G.F. Chemical Sniffing Instrumentation for Security Applications. Chem. Rev. 2016, 116, 8146–8172. [Google Scholar] [CrossRef]
  3. Meier, R.; Köhler, J.; Homburg, A. Explosives; Wiley-VCH: Weinheim, Germany, 2016. [Google Scholar]
  4. Lai, D.Y.; Woo, Y.-T. Hamilton & Hardy’s Industrial Toxicology; Wiley: New York, NY, USA, 2015. [Google Scholar]
  5. Sunahara, G.I.; Lotufo, G.; Kuperman, R.G.; Hawari, J. Ecotoxicology of Explosives; CRC Press: Boca Raton, FL, USA; Taylor & Francis: London, UK; New York, NY, USA, 2009. [Google Scholar]
  6. Official Journal of the European Union. Commission directive 2006/15/EC of 7 February 2006. Available online: https://web.archive.org/web/20220808200207/https://eur-lex.europa.eu/legal-content/en/TXT/?uri=CELEX:32006L0015 (accessed on 8 August 2022).
  7. Occupational Safety and Health Administration. Occupational Safety and Health Standards. Available online: https://web.archive.org/web/20221219060115/https:/www.osha.gov/laws-regs/regulations/standardnumber/1910/1910.1000TABLEZ1 (accessed on 19 December 2022).
  8. Moore, D.S. Instrumentation for trace detection of high explosives. Rev. Sci. Instum. 2004, 75, 2499–2512. [Google Scholar] [CrossRef]
  9. Moore, D.S. Recent advances in trace explosives detection instrumentation. Sens. Imaging 2007, 8, 9–38. [Google Scholar] [CrossRef]
  10. Chou, A.; Jaatinen, E.; Buividas, R.; Seniutinas, G.; Juodkazis, S. SERS substrate for detection of explosives. Nanoscale 2012, 4, 7419–7424. [Google Scholar] [CrossRef] [Green Version]
  11. Ponrathnam, T.; Cho, J.; Kurup, P.U.; Kumar, K.; Nagarajan, R. Enhancing detection of nitroaromatic vapors by utilizing polymer coatings on quartz crystal microbalances having strong dipoles. Sens. Actuators B 2015, 216, 443–452. [Google Scholar] [CrossRef] [Green Version]
  12. Alizadeh, T.; Hamedsoltani, L. Graphene/graphite/molecularly imprinted polymer nanocomposite as the highly selective gas sensor for nitrobenzene vapor recognition. J. Environ. Chem. Eng. 2014, 2, 1514–1526. [Google Scholar] [CrossRef]
  13. Salinas, Y.; Martínez-Máñez, R.; Marcos, M.D.; Sancenón, F.; Costero, A.M.; Parra, M.; Gil, S. Optical chemosensors and reagents to detect explosives. Chem. Soc. Rev. 2012, 41, 1261–1296. [Google Scholar] [CrossRef]
  14. Sun, X.; Wang, Y.; Lei, Y. Fluorescence based explosive detection: From mechanisms to sensory materials. Chem. Soc. Rev. 2015, 44, 8019. [Google Scholar] [CrossRef] [Green Version]
  15. Songrui, L.; Wenhui, X.; Zhenzhen, H.; Qiong, J. Anchoring Cu Nanoclusters on Melamine–Formaldehyde Microspheres: A New Strategy for Triggering Aggregation-Induced Emission toward Specific Enzyme-Free Methyl Parathion Sensing. J. Agric. Food Chem. 2022, 70, 14522–14530. [Google Scholar]
  16. Liu, Y.; Li, L.; Yue, M.; Yang, L.; Sun, F.; Xu, G.; Fu, Y.; Ye, F. A Switch-On fluorescent probe for detection of mesotrione based on the straightforward cleavage of carbon-nitrogen double bond of Schiff base. Chem. Engin. J. 2022, 430, 132758. [Google Scholar] [CrossRef]
  17. MIT BWSI 2017 Featuring Tim Swager. Available online: https://youtu.be/1lS6LQ_T0-E?t=1273 (accessed on 15 February 2023).
  18. Verbitskiy, E.V.; Baranova, A.A.; Lugovik, K.I.; Khokhlov, K.O.; Cheprakova, E.M.; Shafikov, M.Z.; Rusinov, G.L.; Chupakhin, O.N.; Charushin, V.N. New 4,5-di(hetero)arylpyrimidines as sensing elements for detection of nitroaromatic explosives in vapor phase. Dye. Pigment. 2017, 137, 360–371. [Google Scholar] [CrossRef]
  19. Gillanders, R.N.; Samuel, I.D.W.; Turnbull, G.A. A low-cost, portable optical explosive-vapour sensor. Sens. Actuators B Chem. 2017, 245, 334–340. [Google Scholar] [CrossRef] [Green Version]
  20. Räupke, A.; Palma-Cando, A.; Shkura, E.; Teckhausen, P.; Polywka, A.; Görrn, P.; Scherf, U.; Riedl, T. Highly sensitive gas-phase explosive detection by luminescent microporous polymer networks. Sci. Rep. 2016, 6, 29118. [Google Scholar] [CrossRef] [Green Version]
  21. Wang, Y.; La, A.; Ding, Y.; Liu, Y.; Lei, Y. Novel Signal-Amplifying Fluorescent Nanofibers for Naked-Eye-Based Ultrasensitive Detection of Buried Explosives and Explosive Vapors. Adv. Funct. Mater. 2012, 22, 3547–3555. [Google Scholar] [CrossRef]
  22. Kumar, V.; Saini, S.K.; Choudhury, N.; Kumar, A.; Maiti, B.; De, P.; Kumar, M.; Satapathi, S. Highly Sensitive Detection of Nitro Compounds Using a Fluorescent Copolymer-Based FRET System. ACS Appl. Polym. Mater. 2021, 3, 4017–4026. [Google Scholar]
  23. Li, J.; Kendig, C.E.; Nesterov, E.E. Chemosensory Performance of Molecularly Imprinted Fluorescent Conjugated Polymer Materials. J. Am. Chem. Soc. 2007, 129, 15911–15918. [Google Scholar]
  24. Nie, H.; Sun, G.; Zhang, M.; Baumgarten, M.; Müllen, K. Fluorescent conjugated polycarbazoles for explosives detection: Side chain effects on TNT sensor sensitivity. J. Mater. Chem. 2012, 22, 2129–2132. [Google Scholar] [CrossRef]
  25. Mo, W.; Zhu, Z.; Kong, F.; Li, X.; Chen, Y.; Liu, H.; Cheng, Z.; Ma, H.; Li, B. Controllable synthesis of conjugated microporous polymer films for ultrasensitive detection of chemical warfare agents. Nat. Commun. 2022, 13, 5189. [Google Scholar] [CrossRef]
  26. Zhou, Q.; Swager, T.M. Fluorescent Chemosensors Based on Energy Migration in Conjugated Polymers: The Molecular Wire Approach to Increased Sensitivity wire systems. J. Am. Chem. Soc. 1995, 117, 12593–12602. [Google Scholar] [CrossRef]
  27. Shaw, P.E.; Burn, P.L. Real-time fluorescence quenching-based detection of nitro-containing explosive vapours: What are the key processes? Phys. Chem. Chem. Phys. 2017, 19, 29714. [Google Scholar]
  28. Ali, M.A.; Geng, Y.; Cavaye, H.; Burn, P.L.; Gentle, I.R.; Meredith, P.; Shaw, P.E. Molecular versus exciton diffusion in fluorescence-based explosive vapour sensors. ChemComm 2015, 51, 17406. [Google Scholar] [CrossRef]
  29. Ali, M.A.; Shoaee, S.; Fan, S.; Burn, P.L.; Gentle, I.R.; Meredith, P.; Shaw, P.E. Detection of explosive vapors: The roles of Exciton and Molecular Diffusion in Real-Time Sensing. ChemPhysChem 2016, 17, 3350–3353. [Google Scholar] [CrossRef]
  30. Wu, W.; Shi, N.; Zhang, J.; Wu, X.; Wang, T.; Yang, L.; Yang, R.; Ou, C.; Xue, W.; Feng, X.; et al. Electrospun Fluorescent Sensors on Selective Detection of Nitro Explosive Vapors and Trace Water. J. Mater. Chem. A 2018, 6, 18543–18550. [Google Scholar] [CrossRef]
  31. Xue, W.; Zhang, Y.; Duan, J.; Liu, D.; Ma, Y.; Shi, N.; Chen, S.; Xie, L.; Qian, Y.; Huang, W. A Highly Sensitive Fluorescent Sensor Based on Small Molecule Doped in Electrospun Nanofibers: Detection of Explosives as well as Color Modulation. J. Mater. Chem. C 2015, 3, 8193–8199. [Google Scholar] [CrossRef]
  32. Yang, Y.; Wang, H.; Su, K.; Long, Y.; Peng, Z.; Li, N.; Feng, L. A facile and sensitive fluorescent sensor using electrospun nanofibrous film for nitroaromatic explosive detection. J. Mater. Chem. 2011, 21, 11895. [Google Scholar] [CrossRef]
  33. Martelo, L.M.; Pimented das Neves, T.F.; Figueiredo, J.; Marques, L.; Fedorov, A.; Charas, A.; Berberan-Santos, M.N.; Burrows, H.D. Towards the Development of a Low-Cost Device for the Detection of Explosives Vapors by Fluorescence Quenching of Conjugated Polymers in Solid Matrices. Sensors 2017, 17, 2532. [Google Scholar] [CrossRef] [Green Version]
  34. Demchenko, A.P. Photobleaching of organic fluorophores: Quantitative characterization, mechanisms, protection. Methods Appl. Fluoresc. 2020, 8, 022001. [Google Scholar] [CrossRef]
  35. Xue, J.; Wu, T.; Dai, Y.; Xia, Y. Electrospinning and Electrospun Nanofibers: Methods, Materials, and Applications. Chem. Rev. 2019, 119, 5298–5415. [Google Scholar] [CrossRef]
  36. Long, Y.; Chen, H.; Wang, H.; Peng, Z.; Yang, Y.; Zhang, G.; Li, N.; Liu, F.; Pei, J. Highly sensitive detection of nitroaromatic explosives using an electrospun nanofibrous sensor based on a novel fluorescent conjugated polymer. Anal. Chim. Acta 2012, 744, 82–91. [Google Scholar]
  37. Zhang, A.; Bai, H.; Li, L. Breath Figure: A Nature-Inspired Preparation Method for Ordered Porous Films. Chem. Rev. 2015, 115, 9801–9868. [Google Scholar] [CrossRef] [Green Version]
  38. Desai, N.K.; Mahajan, P.G.; KUmbhar, A.S.; Kolekar, G.B.; Patil, S.R. Nanoporous p-terphenyl-polystyrene films containing perylene; fabrication, characterization and remarkable fluorescence resonance energy transfer based blue emitting properties. J. Mater. Sci. Mater. Electron. 2016, 27, 1118–1129. [Google Scholar] [CrossRef]
  39. Sun, X.; Brückner, C.; Nieh, M.-P.; Lei, Y. A fluorescent polymer film with self-assembled three-dimensionally ordered nanopores: Preparation, characterization and its application for explosives detection. J. Mater. Chem. A 2014, 2, 14613. [Google Scholar] [CrossRef]
  40. Jang, H.-S.; Cho, H.-S.; Uhrig, D.; Nieh, M.-P. Insight into interactions between pyrene and polystyrene for efficient quenching nitroaromatic explosives. J. Mater. Chem. C 2017, 5, 12466–12473. [Google Scholar] [CrossRef]
  41. Wang, J.; Yu, R.; Tao, F.; Cui, Y.; Li, T. Determination of Nitroaromatics Using a Double-Layer of Gelatin Nanofibers and a Pyrene-Doped Polystyrene Membrane. Anal. Lett. 2018, 51, 2878–2894. [Google Scholar] [CrossRef]
  42. Yu, R.; Li, Y.; Tao, F.; Cui, Y.; Song, W.; Li, T. A novel double-layer electrospun nanofibrous membrane sensor for detecting nitroaromatic compounds. J. Mater. Sci. 2016, 51, 10350–10360. [Google Scholar] [CrossRef]
  43. Wang, J.; Liu, X.; Liu, G.; Zhang, Z.; Wu, H.; Cui, H.; Cui, B.; Bai, J. Size effect of polystyrene microplastics on sorption of phenanthrene and nitrobenzene. Ecotoxicol. Environ. Saf. 2019, 173, 331–338. [Google Scholar] [CrossRef]
  44. Chu, L.; Deng, S.; Zhao, R.; Zhang, Z.; Li, C.; Kang, X. Adsorption/desorption performance of volatile organic compounds on electrospun nanofibers. RCS Adv. 2015, 5, 102625. [Google Scholar] [CrossRef]
  45. Liu, F.; Song, D.; Huang, X.; Hui, X. Electrospun polystyrene nanofibers as a novel adsorbent to transfer an organic phase from an aqueous phase. J. Sep. Sci. 2016, 39, 1326–1330. [Google Scholar] [CrossRef]
  46. Zail, S.; Jalali, F.; Es-haghi, A.; Shamsipur, M. Electrospun nanostructured polystyrene as a new coating material for solid-phase microextraction: Application to separation of multipesticides from honey samples. J. Chromatogr. B 2015, 1002, 387–393. [Google Scholar] [CrossRef]
  47. Turhan, H.; Tukenmez, E.; Karagoz, B.; Bicak, N. Highly fluorescent sensing of nitroaromatic explosives in aqueous media using pyrene-linked PBEMA microspheres. Talanta 2018, 179, 107–114. [Google Scholar] [CrossRef]
  48. Verbitskiy, E.V.; Baranova, A.A.; Lugovik, K.I.; Khokhlov, K.O.; Chuvashov, R.D.; Dinastiya, E.M.; Rusinov, G.L.; Chupakhin, O.N.; Charushin, V.N. Linear and V-shaped push–pull systems on a base of pyrimidine scaffold with a pyrene–donative fragment for detection of nitroaromatic compounds. J. Iran Chem. Soc. 2018, 15, 787–797. [Google Scholar] [CrossRef]
  49. Venkataramana, G.; Sankararaman, S. Synthesis, Absorption, and Fluorescence-Emission Properties of 1,3,6,8- Tetraethynylpyrene and Its Derivatives. Eur. J. Org. Chem. 2005, 4162–4166. [Google Scholar] [CrossRef]
  50. Shanmugaraju, S.; Joshi, S.A.; Mukherjee, P.S. Fluorescence and visual sensing of nitroaromatic explosives using electron rich discrete fluorophores. J. Mater. Chem. 2011, 21, 9130. [Google Scholar] [CrossRef]
  51. Xu, F.; Nishida, T.; Shinohara, K.; Peng, L.; Takezaki, M.; Kamada, T.; Akashi, H.; Nakamura, H.; Sugiyama, K.; Ohta, K.; et al. Trimethylsilyl Group Assisted Stimuli Response: Self-Assembly of 1,3,6,8-Tetrakis((trimethysilyl)ethynyl)pyrene. Organometallics 2017, 36, 556–563. [Google Scholar] [CrossRef]
  52. Fan, S.; Burn, P.L.; Shaw, P.E. Sensitive and fast fluorescence-based indirect sensing of TATP. RCS Adv. 2019, 9, 7032. [Google Scholar] [CrossRef] [Green Version]
  53. Barata, P.D.; Prata, J.V. Fluorescent Calix[4]arene-Carbazole-Containing Polymers as Sensors for Nitroaromatic Explosives. Chemosensors 2020, 8, 128. [Google Scholar] [CrossRef]
  54. Tian, D.; Li, Y.; Chen, R.-Y.; Chang, Z.; Wang, G.-Y.; Bu, X.-H. A luminescent metal–organic framework demonstrating ideal detection ability for nitroaromatic explosives. J. Mater. Chem. A 2014, 2, 1465. [Google Scholar] [CrossRef]
  55. Cheng, Z.; Mo, W.; Chen, Y.; Liu, H.; Li, X.; Ma, H.; Zhang, S.-T. A new strategy for selective fluorescence detection of benzaldehyde and nitrobenzene. Microchem. J. 2022, 172, 106896. [Google Scholar] [CrossRef]
  56. Askim, J.R.; Suslick, K.S. Hand-Held Reader for Colorimetric Sensor Arrays. Anal. Chem. 2015, 87, 7810–7816. [Google Scholar] [CrossRef] [Green Version]
  57. Baranova, A.A.; Khokhlov, K.O.; Chuvashov, R.D.; Verbitskiy, E.V.; Cherpakova, E.M.; Rusinov, G.L.; Charushin, V.N. The portable detector of nitro-explosives in vapor phase with new sensing elements on a base of pyrimidine scaffold. J. Phys. Conf. Ser. 2017, 830, 012159. [Google Scholar] [CrossRef] [Green Version]
  58. Liu, K.; Wang, Z.; Shang, C.; Li, X.; Peng, H.; Miao, R.; Ding, L.; Liu, J.; Liu, T.; Fang, Y. Unambiguous Discrimination and Detection of Controlled Chemical Vapors by a Film-Based Fluorescent Sensor Array. Adv. Mater. Tech. 2019, 1800644. [Google Scholar] [CrossRef]
  59. Rurack, K. Standardization and Quality Assurance in Fluorescence Measurements I, 1st ed.; Springer: Berlin/Heidelberg, Germany, 2008; pp. 101–145. ISBN 978-3-540-75207-3. [Google Scholar]
  60. Verbitskiy, E.V.; Baranova, A.A.; Lugovik, K.I.; Khokhlov, K.O.; Cheprakova, E.M.; Rusinov, G.L.; Chupakhin, O.N.; Charushin, V.N. New V-shaped push-pull systems based on 4,5-di(hetero)aryl substituted pyrimidines: Their synthesis and application to the detection of nitroaromatic explosives. Arkivoc 2016, 360–373. [Google Scholar] [CrossRef] [Green Version]
  61. Verbitskiy, E.V.; Rusinov, G.L.; Chupakhin, O.N.; Charushin, V.N. Design of fluorescent sensors based on azaheterocyclic push-pull systems towards nitroaromatic explosives and related compounds: A review. Dye. Pigment. 2020, 180, 108414. [Google Scholar] [CrossRef]
  62. The FS5 Spectrofluorometer Technical Specification. Available online: https://www.edinst.com/wp-content/uploads/2015/07/FS5-Data-Sheet-1.pdf (accessed on 18 January 2023).
  63. Eda, G.; Shivkumar, S. Bead-to-fiber transition in electrospun polystyrene. J. Appl. Polym. Sci. 2007, 106, 475–487. [Google Scholar] [CrossRef]
  64. Zheng, J.; Zhang, H.; Zhao, Z.; Han, C.C. Construction of hierarchical structures by electrospinning or electrospraying. Polymer 2012, 53, 546–554. [Google Scholar] [CrossRef]
  65. Casper, C.L.; Stephens, J.S.; Tassi, N.G.; Chase, D.B.; Rabolt, J.F. Controlling Surface Morphology of Electrospun Polystyrene Fibers:  Effect of Humidity and Molecular Weight in the Electrospinning Process. Macromolecules 2004, 37, 573–578. [Google Scholar] [CrossRef]
  66. Zen Eddin, M.; Zhilina, E.F.; Chuvashov, R.D.; Dubovik, A.I.; Mekhaev, A.V.; Chistyakov, K.A.; Baranova, A.A.; Khokhlov, K.O.; Rusinov, G.L.; Verbitskiy, E.V.; et al. Random Copolymers of Styrene with Pendant Fluorophore Moieties: Synthesis and Applications as Fluorescence Sensors for Nitroaromatics. Molecules 2022, 27, 6957. [Google Scholar] [CrossRef]
  67. Li, Z.; Xu, X.; Quan, H.; Zhang, J.; Zhang, Q.; Fu, Y.; Ying, Y.; Li, Y. Adsorptive and responsive hybrid sponge of melamine foam and metal organic frameworks for rapid collection/removal and detection of mycotoxins. Chem. Eng. J. 2011, 410, 128268. [Google Scholar] [CrossRef]
  68. Han, J.; Miao, L.; Song, Y. Preparation of co-Co3O4/carbon nanotube/carbon foam for glucose sensor. J. Mol. Recognit. 2020, 33, e2820. [Google Scholar] [CrossRef]
  69. Zhang, C.; Hou, Z.-L.; Zhang, B.-X.; Fang, H.-M.; Bi, S. High sensitivity self-recovery ethanol sensor based on polyporous graphene oxide/melamine composites. Carbon 2018, 137, 467–474. [Google Scholar] [CrossRef]
  70. Kaewnu, K.; Promsuwan, K.; Phonchai, A.; Thiangchanya, A.; Somapa, D. Cost-Effective Foam-Based Colorimetric Sensor for Roadside Testing of Alcohol in Undiluted Saliva. Chemosensors 2021, 9, 334. [Google Scholar] [CrossRef]
  71. Song, Y.; Shan, B.; Feng, B.; Xu, P.; Zeng, Q.; Su, D. A novel biosensor based on ball-flower-like Cu-hemin MOF grown on elastic carbon foam for trichlorfon detection. RCS Adv. 2018, 8, 27008–27015. [Google Scholar] [CrossRef] [Green Version]
  72. Ara, A.M.; Iimori, T.; Makabayashi, T.; Maeda, H.; Mizuno, K.; Ohta, N. Electric Field Effects on Absorption and Fluorescence Spectra of Trimethylsilyl- and Trimethylsilylethynyl-Substituted Compounds of Pyrene in a PMMA Film. J. Phys. Chem. B 2007, 111, 10687–10696. [Google Scholar] [CrossRef]
  73. Verbitskiy, E.V.; Kvashnin, Y.A.; Baranova, A.A.; Khokhlov, K.O.; Chuvashov, R.D.; Schapov, I.E.; Yakovleva, Y.A.; Zhilina, E.F.; Shchepochkin, A.V.; Makarova, N.I.; et al. Synthesis and characterization of linear 1,4-diazine-triphenylamine–based selective chemosensors for recognition of nitroaromatic compounds and aliphatic amines. Dye. Pigment. 2020, 178, 108344. [Google Scholar] [CrossRef]
  74. Frisch, H.L. Sorption and transport in glassy polymers–a review. Polym. Eng. Sci. 1980, 20, 2–13. [Google Scholar] [CrossRef]
  75. Lasky, R.C.; Kramer, E.J.; Hui, C.-Y. The initial stages of Case II diffusion at low penetrant activities. Polymer 1988, 29, 673–679. [Google Scholar] [CrossRef]
  76. Ogieglo, W.; Wormeester, H.; Wessling, M.; Benes, N.E. Probing the Surface Swelling in Ultra-Thin Supported Polystyrene Films During Case II Diffusion of n-Hexane. Macromol. Chem. Phys. 2013, 214, 2480–2488. [Google Scholar]
  77. Lynch, E.J.; Wilke, C.R. Vapor Pressure of Nitrobenzene at Low Temperatures. J. Chem. Eng. Data 1960, 5, 300. [Google Scholar] [CrossRef] [Green Version]
  78. Östmark, H.; Wallin, S.; Ang, H.G. Vapor Pressure of Explosives: A Critical Review. Propellants Explos. Pyrotech. 2012, 37, 12–23. [Google Scholar] [CrossRef]
  79. Ewing, R.G.; Waltman, M.J.; Atkinson, D.A.; Grate, J.W.; Hotchkiss, P.J. The vapor pressures of explosives. Trends Anal. Chem. 2013, 42, 35–48. [Google Scholar] [CrossRef]
  80. Chung, F.-J.; Liu, H.-Y.; Jiang, B.-I.; He, G.-Y. Random Styrenic Copolymers with Pendant Pyrene Moieties: Synthesis and Applications in Organic Field-Effect Transistor Memory. J. Polym. Sci. Part A Polym. Chem. 2016, 54, 910–917. [Google Scholar] [CrossRef]
Figure 1. Structures of fluorophore F and polystyrene (PS) used to prepare fluorescent sensing materials.
Chemosensors 11 00167 g001
Figure 2. Structures of analytes used to study quenching in acetonitrile solution.
Chemosensors 11 00167 g002
Figure 3. Quenching efficiencies of nitroaromatic analytes relative to fluorophore F at mM level in acetonitrile at the spectra peak wavelength of 447 nm.
Chemosensors 11 00167 g003
Figure 4. Microphotos of clean melamine formaldehyde foam substrate under white light illumination (a) and of obtained fluorescent sensor materials mF/Elsp (b), mF+PS (c), mF+PS/Elsp (d) under UV illumination.
Chemosensors 11 00167 g004
Figure 5. Absorbance (Abs, solid), excitation (Ex, dotted), and emission (Em, dashed) spectra of obtained solid fluorescent material mF/Elsp (electrospun 5 × 10⁻³ M fluorophore solution) and materials mF+PS, mF+PS/Elsp (drop-casted and electrospun solutions containing 1 × 10⁻² M and 2 × 10⁻² M of the fluorophore, respectively).
Chemosensors 11 00167 g005
Figure 6. Absorbance (Abs, solid), excitation (Ex, dotted), and emission (Em, dashed) spectra of obtained solid fluorescent material mF/Elsp (electrospun 5 × 10⁻³ M fluorophore solution) and materials mF+PS, mF+PS/Elsp (drop-casted and electrospun solutions containing 1 × 10⁻³ M and 2 × 10⁻³ M of the fluorophore, respectively).
Chemosensors 11 00167 g006
Figure 7. Absorbance (Abs, solid), excitation (Ex, dotted), and emission (Em, dashed) spectra of obtained solid fluorescent material mF/Elsp (electrospun 5 × 10⁻³ M fluorophore solution) and materials mF+PS, mF+PS/Elsp (drop-casted and electrospun solutions containing 1 × 10⁻⁴ M and 2 × 10⁻⁴ M of the fluorophore, respectively).
Chemosensors 11 00167 g007
Figure 8. Sensor element cartridge under UV (left) and visible (right) illumination fitted with the foam substrate fragments bearing fluorescent materials mF/Elsp (a), mF+PS/Elsp (b), and mF+PS (c).
Chemosensors 11 00167 g008
Figure 9. Structures of nitroaromatic (black) and non-nitroaromatic (green) analytes used to study fluorescent response of obtained materials versus vapor phase analytes.
Chemosensors 11 00167 g009
Figure 10. The recording of fluorescence responses of obtained sensor materials towards 160 mL of saturated vapor of nitrobenzene and the example of metrics Iexp and Irecov used to quantify fluorescent response of the material.
Chemosensors 11 00167 g010
Figure 11. Fluorescence responses of obtained sensor materials towards saturated vapor of nitroaromatic compounds and interferents (average response of three materials displayed).
Chemosensors 11 00167 g011
Figure 12. Two first principal components for the data of Iexp and Irecov metrics for materials mF+PS, mF/Elsp for nitroaromatic (gray markers) and non-nitroaromatic (black markers) analytes.
Chemosensors 11 00167 g012
Figure 13. lg(∆PL) vs. lg(t) plot for material mF/Elsp at various NB vapor concentrations. A set of at least four sensor materials on the sensor element was used to record each quenching response. Each solid lines and shaded area around it represent the mean and the std.dev. of the quenching response at selected time point. Dashed lines are linear approximations of lg(∆PL) vs. lg(t).
Chemosensors 11 00167 g013
Figure 14. lg(∆PL) vs. lg(t) plot for material mF+PS at various NB vapor concentrations. A set of at least four sensor materials on the sensor element was used to record each quenching response. Each solid lines and shaded area around it represent the mean and the std.dev. of the quenching response at selected time points. Dashed lines are linear approximations of lg(∆PL) vs. lg(t).
Chemosensors 11 00167 g014
Figure 15. lg(k’) vs. lg(C) plots for materials mF/Elsp (a,c), mF+PS (b,d) with NB (a,b) and 2,4-DNT (c,d) as vapor phase quenchers.
Chemosensors 11 00167 g015
Table 1. Quenching constants (KSV) and detection limits (DL) of nitroaromatic analytes towards fluorophore F in acetonitrile solution.
NitrocompoundKSV (M−1)DL (M)
NB100,6762.97 × 10−9
1,3-DNB80613.72 × 10−8
1,3,5-TNB95973.12 × 10−8
TATB40697.37 × 10−8
2-NP92363.24 × 10−8
4-NP47166.36 × 10−8
2,4-DNP147,1932.03 × 10−9
4-NT35838.37 × 10−8
2,4-DNT67064.47 × 10−8
2,4,6-TNT58765.10 × 10−8
DDBu14,3712.08 × 10−8
DNAN13,1372.28 × 10−8
TNAN10,4722.86 × 10−8
PA123,9322.42 × 10−9
SA114,5152.61 × 10−9
DL values were calculated with the assumption of signal-to-noise ration of spectrophotometer equal to 10,000 [62].
Table 2. Transport exponent estimates n ^ and model parameters a, b for fluorescent materials mF/Elsp, mF+PS toward NB and 2,4-DNT in vapor phase.
NitrocompoundSensor Material n ^
(Mean ± Std)
a
(Mean ± Std)
b
(ppb−1, 
Mean ± Std)
NBmF/Elsp0.27 ± 0.05−5.47 ± 0.720.70 ± 0.17
NBmF+PS0.33 ± 0.02−6.95 ± 0.451.01 ± 0.11
DNTmF/Elsp1.15 ± 0.17−6.54 ± 0.551.91 ± 0.43
DNTmF+PS1.15 ± 0.12−7.02 ± 0.032.03 ± 0.02
Table 3. Detection limits (DL) of NB and DNT vapors towards sensor materials mF/Elsp and mF+PS calculated via obtained model parameters.
NitrocompoundSensor MaterialDLa, 10 s Exposure
(ppb)
DLa, 50 s Exposure
(ppb)
DLa, 100 s Exposure
(ppb)
NBmF/Elsp1389747571
NBmF+PS374122051756
DNTmF/Elsp17.96.84.5
DNTmF+PS26.110.57.1
aDL limits were calculated with the assumption that the fluorescence recorder is capable to register 0.1% intensity attenuation. Saturated vapor concentrations for NB, DNT are 371.6 ppm and 411 ppb at 25 °C, respectively.
Disclaimer/Publisher’s Note: The statements, opinions and data contained in all publications are solely those of the individual author(s) and contributor(s) and not of MDPI and/or the editor(s). MDPI and/or the editor(s) disclaim responsibility for any injury to people or property resulting from any ideas, methods, instructions or products referred to in the content.

