Article

Analyzing the Electrochemical Interaction of the Angiogenesis Inhibitor Batimastat by Surface-Enhanced Raman Spectroscopy

by
Ewa Pięta
1,
Czesława Paluszkiewicz
1,
Wojciech M. Kwiatek
1 and
María Rosa López-Ramírez
2,*
1
Institute of Nuclear Physics Polish Academy of Sciences, PL-31342 Krakow, Poland
2
Department of Physical Chemistry, Faculty of Science, University of Málaga, E-29071 Málaga, Spain
*
Author to whom correspondence should be addressed.
Chemosensors 2023, 11(2), 128; https://doi.org/10.3390/chemosensors11020128
Submission received: 28 December 2022 / Revised: 6 February 2023 / Accepted: 8 February 2023 / Published: 10 February 2023
(This article belongs to the Special Issue Recent Trends in SERS: Sensing and DFT Application)

Abstract

:
This is the first work to describe the vibrational properties of the anticancer drug batimastat (BB-94) as an inhibitor of extracellular matrix metalloproteinase with a broad spectrum of activity. In addition, the adsorption of this molecule onto a silver roughened electrode surface using surface-enhanced Raman spectroscopy (SERS) was studied. This research provides a complete account of the influence of applied electrode potential and excitation wavelengths at the molecule-metal interface. Although vibrational assignment becomes more difficult as the molecule size increases, we performed density functional theory (DFT) at the B3LYP/6-31G(d,p) level of theory to calculate molecular geometry in the equilibrium state and Raman frequencies to clarify the nature of vibrational modes. The greatest amplification of the SERS signal occurs for the electrode potential of −0.3 V for the 532 nm excitation line and shifts as moves to the near-infrared laser line at 785 nm. The conclusion is that the mercaptothiophene part and one of the amide groups interact with the metal surface. This results in a charge transfer resonant process in the SERS of this molecule, which has been found by analyzing the charge transfer SERS profiles. Finally, there is the possibility of the formation of different adsorption species or metal complexes on the surface that could contribute to the whole signal observed in the SERS spectra.

Graphical Abstract

1. Introduction

Raman spectroscopy is one of the most commonly used techniques in biological systems or biologically active compound studies. It provides valuable information about the vibrational modes in a molecule, their interactions, and indirectly about changes in the molecular structure. Raman scattering is a weak phenomenon due to the small effective Raman cross-section [1]. However, the Raman signal can be significantly improved when molecular systems are adsorbed or situated near a rough metal surface. This is known as surface-enhanced Raman spectroscopy (SERS) and allows for signal amplification of up to 1014 in a specific group of molecules, including rhodamine 6G and crystal violet [2] while maintaining ultra-high sensitivity and specificity [3,4,5]. It is assumed that there are two main contributions to such spectacular signal amplification: the electromagnetic (EM) mechanism and chemical amplification (CT). In SERS-EM, the molecule is adsorbed on or at a distance from the metal surface, and the enhancement clearly decreases with the increase of this distance, as determined by the decay of the metal dipole field [1/d]12 [6,7]. Interestingly, this amplification is especially strong in “hot spots” which are associated with the formation of local plasmon resonance on the metal surface [8]. In the case of SERS-CT, the Raman enhancement could be due to different effects, such as an electronic coupling between the molecule and the metal or the formation of a special surface-adsorbate complex that increases the Raman cross-section. This contribution to the whole signal may also be connected with a resonant Raman effect observed as a result of the shift and expansion of the electron levels of the adsorbed molecule relative to the “free” molecule or as a result of a new electronic transition into the metallic particle system [9,10].
Adsorbate studies by SERS allow the determination of their geometry after adsorption on a metal substrate [11,12,13,14,15]. Certain molecule fragments are either directly involved in this process or are close to the surface. This is particularly evident if differences in the relative intensity, bandwidth, or wavenumbers of the SERS bands in relation to the Raman spectra are analyzed.
The SERS effect was accidentally discovered in 1974 by Fleischmann’s research group during Raman measurements of pyridine adsorbed on the silver electrode surface [16]. This was a breakthrough in the broadly understood detection of biologically active compounds [17]. To date, there are only a few reports on using SERS on the metal electrode for biodetection [18], and the potential of this technique is still being developed. By manipulating the electrode potential’s value, the signal amplification’s magnitude can be maximized to obtain the appropriate sensitivity and selectivity needed to analyze the interaction of biomolecules with the surface. In addition, combining the surface signal amplification-based technique with all the advantages offered by the electrochemical method is accompanied by an even better characterization of various types of biological systems [19]. In this sense, the signal intensity strongly depends on the electrode potential. Therefore, changing the potential of the electrode may result in a change in the degree of coverage and molecule orientation on the metal surface, which leads to differences in the intensity of the SERS signal [20,21]. Even if the range or orientation of the molecule does not change, the intensity of the SERS still varies with the potential. This is because of the SERS—charge-transfer (CT) mechanism [19], and it depends on several factors, such as the electronic structure of our target molecule or the excitation wavelength.
This work investigates the molecular structure of the anti-cancer drug batimastat (BB-94) for the first time. It focuses on the interaction of this molecule on the electrochemically roughened silver electrode depending on different electrode potential values and various excitation wavelengths. BB-94 is a potent inhibitor of extracellular matrix metalloproteinase (MMPI) with a broad spectrum of activity [22,23,24]. Matrix metalloproteinases (MMPs) are a family of proteolytic enzymes involved in remodeling normal tissue through the degradation of extracellular matrix components. MMPs also play an important role in the invasion and metastasis of human neoplasms [25,26]. The drug molecule binds reversibly to the zinc-binding MMP active region and competitively inhibits the enzyme activity in vitro [25]. BB-94 has been shown to inhibit breast cancer recurrence, colon tumor growth and spread, and lung cancer in murine models and to reduce MMP-mediated dysfunction and damage to blood vessel walls [22]. This compound is one of the most advanced matrix metalloproteinase (MMPI) inhibitors in terms of preclinical and clinical development. Among the large group of MMPIs tested, BB-94 was the first to enter clinical trials, reaching phase III of the trials [27].
There are many reasons to be optimistic that the SERS on electrode technique will become a valuable tool for fundamental studies and lead to numerous applications in SERS, electrochemistry, and nanoscience.

2. Materials and Methods

2.1. Theoretical Analysis

The “Picasso” computing machine, situated in the Bio-Innovation Building of the University of Málaga at the Technological Park of Andalusia with the Gaussian 09 software product was employed to perform optimization of the ground–state geometry and generate theoretical spectral patterns for BB-94 (Figure 1). The density functional theory (DFT) with the B3LYP level of theory and the 6-31G(d,p)—the split-valence triple-ζ basis set (6-31G) (John Pople’ group) that uses a set of d polarization functions on heavy atoms and one set of p polarization functions on H atoms—was applied as the basis set [28]. The UV-Vis absorption properties of BB-94 and its metal complexes were calculated using the time-dependent (TD)-DFT method with the 6-311 + G(d,p) and LanL2DZ basis sets, respectively. No imaginary wavenumbers were indicating that the optimized structure matches energy minima at the potential energy surface of nuclear motion. The GaussView 5.0 software was used to obtain the theoretical Raman and UV-Vis spectra and visualize the optimized BB-94 structure. The generated spectrum was scaled using the freeware GaussSum 0.8 software with a scaling factor of 0.96, a full width at half maximum (fwhm) of 10 cm−1, and a 50/50% Gaussian/Lorentz band shape. As can be seen, there is good agreement between the theoretical predictions and the experimental results. There are only slight differences in the spectra, mainly manifested in the relative intensity of the bands. Nevertheless, this does not affect their interpretation. Data visualization and interpretation were performed using WiRE 5.2 and GRAMSAI 9.3 software.

2.2. Raman and SERS Measurements

Batimastat (BB-94) and other chemicals were obtained from Sigma-Aldrich and used without further purification. An aqueous solution of BB-94 with a concentration of 10−5 M was used for the tests by dissolving the appropriate amount of the powdered compound in deionized water at 18 MΩ cm−1.
In order to perform a series of SERS measurements in the electrochemical cell, it was filled with 0.1 M NaClO4 electrolyte and 10−5 M solution of the studied compound. The spectra were recorded using an inVia Qontor (Renishaw) Raman spectrometer coupled with a CCD (charge-coupled device) detector, located at the Central Research Support Services at UMA. The spectrometer was equipped with a thermoelectrically cooled charge-coupled detector (CCD) and a microscope with a macro lens of f = 30 mm. Two excitation laser lines were used: 532 nm and 785 nm. The spectral resolution was 1 cm−1, while the laser power directed at the sample was below 5 mW to prevent overheating. The SERS spectra were compared with the Raman spectra collected for an aqueous solution of BB-94 using the same instrument.

2.3. Electrode Preparation for SERS Study

The electrochemical measurements were carried out in an electrochemical cell (600 E, Ventacon, Southampton, U.K.) combined with three electrodes, i.e., a reference KCl—saturated Ag/AgCl electrode, an auxiliary platinum wire electrode, and a working Ag electrode. Preparation of the working electrode included the mechanical part and electrochemical activation. First, the electrode surface was gently cleaned with Buehler Polishing Alumina MicroPolish powder (0.30 µm and 0.05 µm) and then activated in a 0.1 M KCl solution by applying a potential of −0.5 V with a scan rate of 0.1 V/s. Electrochemical roughening was performed by applying ten cycles of 2-s pulses at an electrode potential of +0.6 V. During the measurements, it was ensured that no oxidation or reduction processes affected the experimental result.

3. Results and Discussion

3.1. Vibrational Characterization of Batimastat (BB-94)

The vibrational spectrum of BB-94 using Raman spectroscopy and the corresponding assignment supported by ab initio calculation were characterized for the first time. BB-94 is a very large molecule, and to enable the assignment, we organized it by the main functional groups: aromatic rings, thiophene rings, and amides. Figure 1 shows the experimental Raman spectra of a saturated solution of BB-94 recorded at different wavelengths. There are only negligible differences in some relative band intensities and Raman shifts between these Raman spectra. This means that the excitation wavelength does not change the Raman spectrum of this compound. The calculated Raman spectrum fits well with the experimental one. Therefore, we suggest that the solvent effect is not critical in the molecule structure in the solution state as it is not involved in the ionization processes of any of its functional groups. The product information provided by Sigma-Aldrich specifies that the maximum electronic absorption of this molecule occurs at 269 nm, which is a typical transition in the UV range of these aromatic molecules. Based on the absorption behavior, we could expect a more intense Raman spectrum at a lower wavelength. To propose the assignment of this compound, we have selected the Raman spectrum recorded at 785 nm because it has the best signal-to-noise ratio. Figure 1 depicts the BB-94 Raman spectrum prediction as well as the optimized molecule structure.
Theoretical calculations were performed based on DFT at the B3LYP/6-31G(d,p) level of theory to assign the bands to the vibrations of the appropriate functional groups. Additionally, the analysis was supported by the literature reports on phenyl and thiophene-like molecules [29,30,31,32,33]. Due to the presence of an aromatic ring in the structure of the studied compound, the description of vibration modes proposed by Wilson [34] was also used in the analysis.
In Figure 1, we observe similar Raman spectra of this compound under different excitation lines, and all of them show that one strong band recorded at 1401 cm−1 dominates the Raman spectra of BB-94, and other medium bands are recorded at 1338 cm−1 and 1002 cm−1. The former is assigned to ν(CC) in-plane vibration of the thiophene ring, and the wavenumber is lower than that of the corresponding 2-monosubstituted thiophenes because of the sulfur atom in the alkyl chain. The other two important Raman bands at 1338 cm−1 and 1002 cm−1 are assigned to ν(CC), with the contributions of δ(CH) of the thiophene ring and δ(CC) of the aromatic ring, respectively.
Other weaker Raman bands are shown in Table 1. Since BB-94 is characterized by a lack of symmetry, the assignment of bands was carried out focusing mainly on the vibration of functional groups and referring to the molecular plane of a given heterocyclic ring. Additionally, some weak spectral bands at 1606 cm−1, 1238 cm−1, 1032 cm−1, and 643 cm−1 have been recorded, which are primarily related to the ν(C=C)ring, ν(N-CO), δ(CH)ring, and ν(S-CH2), respectively. Furthermore, two weak vibrational bands due to the secondary amide ν(C=O) group, the Amide I band, are recorded at 1660 cm−1 and 1643 cm−1. The carbonyl Raman band is greatly influenced by solvents with which hydrogen bonds may be formed, as was the case with the solvent we used. Therefore, the experimental wavenumber of these bands is left-shifted compared to the calculated Raman bands. However, in general, we can observe a very good agreement between the experimental and the calculated Raman wavenumbers.

3.2. SERS Detection of BB-94 on Silver Electrode

It should be mentioned that the SERS technique is one of the few tools that allows for a highly specific analysis of molecules immobilized on a metal surface. The ability to measure aqueous solutions in situ is an indispensable advantage. Nevertheless, in some cases, it is difficult to clearly state whether the adsorbate remains bound to the metal substrate or is released from the active surface.
In order to study the adsorption behavior of BB-94, the electrode surface has been electrochemically roughened. Additionally, the SERS spectra of BB-94 from 0.0 V to −1.2 V at 532 and 785 nm laser wavelengths, respectively, have been collected and are represented in Figure 2.
Figure 2 shows that when the value of the electrode potential changes, the relative strength of the spectral signals changes significantly, especially in the band where the 8a vibrations are. During the adsorption of BB-94 on the electrochemically roughened silver electrode, the width of some bands also changes. Attention should also be paid to the differences between the series of spectra collected for two different excitation sources. In this case, it can be implied that the orbitals of the molecule and the metal overlap, which in turn contributes to the creation of a specific complex of the molecule and metal and the formation of new electronic states [35,36,37].
This molecule has a very complex adsorption behavior, and we need to simulate the Ag-adsorbate complexes to identify what kind of interaction and functional groups are involved in the adsorption process. The optimized molecular structures of BB-94 metal complexes are represented in Figure S1, along with the theoretical Raman spectra of each species.
In the general view of the SERS spectra shown in Figure 2, we can observe that the greatest amplification of the SERS signal is observed at the electrode potential of −0.3 V for both excitation lines, but it is especially enhanced when we excite at lower wavelengths, i.e., at 532 nm. In the case of SERS spectra recorded at 532 nm, the signal decay is particularly pronounced after −0.3 V (Figure 2A). We can clearly observe that not all Raman bands increase with the same intensity when we modify the electrode potential, but only some specific bands. These results reveal that the CT mechanism contributes to the entire SERS enhancement of this molecule, resulting in a selective enhancement of SERS bands [35,36,37]. In this sense, the role of the electrode potential is to tune the energy of the CT transition. We study the adsorption mechanism and the electronic properties of the complex at the molecule-metal interface by analyzing the variation of SERS band intensities.
The most prominent band in the SERS spectra collected at the 532 nm excitation source appears at 1582 cm−1 and is assigned to the aromatic ring vibrations. It should be emphasized that this band is greatly enhanced after the adsorption of BB-94 on the electrochemically roughened surface of the Ag electrode. There is also a significant shift in wavenumber compared to the conventional RS spectrum. This proves a strong interaction of the tested compound with the SERS-active substrate through the aromatic ring and a significant contribution of the charge-transfer mechanism to signal enhancement. Furthermore, the relative intensity of the 1582 cm−1 spectral feature increases as the electrode potential changes to a more negative one and reaches a maximum at a potential value of −0.3 V.
Another set of SERS bands with strong intensification is assigned to aromatic moieties of the rings as the bands recorded at 1365 cm−1, 1330 cm−1, 1080 cm−1, and 807 cm−1 in the SERS spectra recorded at 785 nm. When we record the SERS spectra at a near-infrared excitation laser, SERS bands at lower wavenumbers show high intensity, especially the bands at 1080 cm−1 and 807 cm−1. In the case of the 1080 cm−1 band, assigned mainly to C-H in-plane deformations of the thiophene ring, we observe a decay at a more negative electrode potential, particularly in the spectral series recorded at 532 nm. On the other hand, at the lower wavelength, the group of SERS bands around 1600 cm−1 plays the predominant role.
Due to the strong enhancement of the SERS bands associated with the aromatic ring, it can be concluded that BB-94 interacts with the metal surface, and the interaction occurs mainly through the oxygen and nitrogen atoms of the Amide B moiety. SERS bands assigned to the aromatic ring vibrations as 1582 cm−1 and 807 cm−1 are significantly broadened and shifted in frequency compared to that in the Raman spectra. Therefore, if we take into account the optimized structure of BB-94 shown in Figure 1 and the enhancement of thiophene stretching and deformation modes recorded at 1365 cm−1 and 1080 cm−1, respectively, we assume that the mercaptothiophene part also interacts with the silver surface. One indicator of this interaction is the blue shift in the SERS spectra of the C-C stretching mode of thiophene observed in the Raman spectra at 1401 cm−1 and detected as a broad band at 1365 cm−1 in the SERS spectra at both wavelengths. Moreover, the Raman bands observed at 1660 cm−1 and 1643 cm−1, which corresponds to the stretching vibrations of the C=O fragment in Amide I, practically disappear in the SERS spectra. The size of the side chain directly affects the appearance of the Amide I band in the Raman spectrum. Nevertheless, in the case of shorter side chains, surface plasmons determine the selective amplification of bands Nevertheless, in the case of shorter side chains, surface plasmons determine the selective amplification of bands that have vibrations other than the Amide I vibrational modes [38].
According to these SERS results, we have suggested and represented an adsorption geometry of BB-94 on roughened Ag electrode surface in Figure 3. The close interactions of this molecule through the sulfur atoms of the mercaptothiophene group and the Amide B functional group cause a significant enhancement effect on some vibrational modes of the aromatic ring, such as ν(CC); 8a.
To study in more detail the behavior of the main vibrational modes of BB-94 and to explain the adsorption mechanism of this molecule on the silver electrode, we decided to analyze the potential-dependent relative intensity of the main SERS bands of this molecule at different wavelengths.

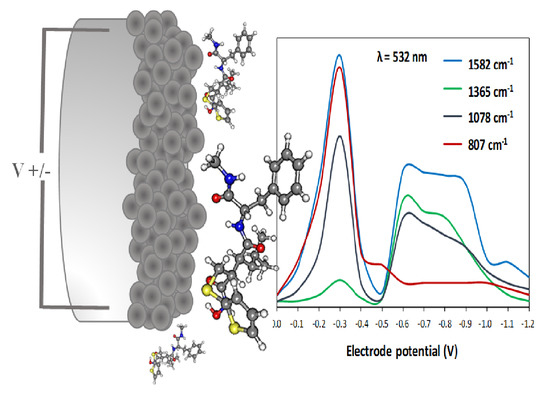
3.3. Analyzing Electrode-Potential Profiles of SERS Spectra of BB-94

Based on a series of SERS spectra (Figure 2) recorded at different electrode potential values and for two different excitation lines (532 nm and 785 nm), SERS-CT profiles were generated for crucial bands affecting the CT mechanism. In this case, the following spectral features were considered: 1582 cm−1, 1365 cm−1, 1080 cm−1, and 807 cm−1 (Figure 4). For two different excitation sources, there may have been slight shifts in the wavenumbers of individual bands, but they did not disturb the interpretation of the CT phenomenon. Briefly, based on the calculated ratios of the intensity of the SERS bands to the Raman bands, the dependence of this ratio on the applied electrode potential is displayed. We can observe that the CT profiles change strongly with the excitation source and the selected SERS bands are affected differently. In addition, in the benzene-like systems, the geometrical distortion of the aromatic ring resembles the vibrational mode 8a; ν(CC), which explains the key role of this vibration in SERS of aromatic molecules when a charge transfer mechanism is involved (SERS-CT). The ν8a band amplification can be considered an indicator of the forces acting on the molecule in the excited state, which is of particular importance in resonance conditions. The magnitude of these forces results from the differences between the equilibrium geometries of the adsorbed substance and the forming molecule-metal complexes [39]. In this sense, CT profiles are a very useful tool for detecting whether a particular vibrational mode is amplified by this CT mechanism.
Comparing both the spectra (Figure 2) and the SERS-CT profiles (Figure 4) obtained for the two excitation lines (532 nm and 785 nm), significant differences in the relative intensities of some spectral signals are noted. This may be because the CT transition energy is closely correlated with the electric potential at the adsorbate/metal surface interface. Therefore, it is not surprising that for the resonance profile generated for the wavelength of 532 nm, the maximum amplification is obtained by changing the electrode potential (up to −0.3 V), which is related to the energy of the perpendicular CT transition for a given excitation line [40]. As mentioned above, the studied molecule does not have an element of symmetry, making analyzing spectral signals somewhat difficult. Therefore, analyzing SERS-CT profiles enables the analysis of the trend of changes for several selected SERS bands simultaneously.
Differences in the SERS spectra recorded at different laser lines may be the result of various arrangements of BB-94 molecules on the surface of the Ag electrode, which in turn affects the differences in the values of the vertical and horizontal components of the local field [41]. Thus, this explains the change in the relative intensity of some SERS bands, which depends on the polarizability derivatives and the local-field magnitude at the metal substrate [42,43]. The SERS spectra recorded at 785 nm show a homogeneous enhancement among all the vibrational modes, and we suggest that the electromagnetic contribution is stronger at this excitation wavelength.
Another explanation for the variability of the SERS spectral signals as the excitation wavelength changes may be related to the formation of the CT Ag-complex with electronic absorption in the spectral area of the excitation sources [43]. The BB-94 molecule absorbs light at 269 nm, which is far from the excitation sources used in the experiment. Therefore, the use of 532 nm or 785 nm laser lines does not allow reaching resonance conditions for this molecule. However, the formation of the special metal-molecule complex may alter the resonance conditions and shift them to the ~500 nm region. This is additional evidence of the differences between the spectral features obtained for two different excitation wavelengths. In addition, the possibility of the formation of various complexes on the electrochemically roughened Ag electrode surface may explain the occurrence of double maxima on the SERS-CT profiles (Figure 4). Simultaneously, coupling with this particular excitation line, which is less energetic in the case of 785 nm, leads to the resonance condition of the corresponding species at a more negative potential of −1.1 V (Figure 4B). We have calculated the theoretical Raman spectra and optimized molecular structures of two different Ag-complexes that we have included in the supplementary information as Figure S1. We have proposed an interaction throughout the mercaptothiophene group, namely the BB-94-SAg complex (Figure S1b), and another double interaction with both the mercaptothiophene and Amide B groups, i.e., the BB-94-SAg-OAg complex (Figure S1c). The existence of several species on the metal interface could give rise to a final SERS signal from more than one complex.
The CT profile at 532 nm shown in Figure 4a exhibits a clear maximum of the vibrational mode 8a at −0.3 V, but in order to achieve the resonance condition with a less energetic excitation laser at 785 nm, we need to go further to the more negative potential at −1.1 V. This is the band with the strongest SERS enhancement at 532 nm, and the same behavior is observed in the aromatic ring deformation mode, δ(CC), recorded at 807 cm−1. In addition, thiophene stretching and deformation modes recorded at 1365 cm−1 and 1078 cm−1 have parallel SERS-CT behaviors. The former, ν(CC), has a CT maximum centered at −0.6 V with the 532 nm excitation line, and, consequently, when excited with 785 nm, it moves to a very high electrode potential out of our recorded potential range. The latter, δ(CH), exhibits similar SERS activity to mode 8a but is much less enhanced at both wavelengths. This may be related to the existence of a directly proportional relationship between the number of excited oscillations and the signal amplification in the SERS spectrum [44]. The authors proved that at the excitation line of 532 nm, more plasmonic modes coexist for the band appearing at ~1582 cm−1 than for the band at ~1078 cm−1. This translates into a much greater intensity of the first spectral feature compared to the second [44].
Finally, the intensity ratio of the ν8a band in the SERS spectrum for the RS spectrum is much higher for the 532 nm excitation wavelength. This is directly related to the CT effect that occurs for the metal-molecule complex. This is further supported by the greater intensity of 1365 cm−1 and 1078 cm−1 bands in the SERS spectrum collected at the 532 nm laser line. To support this idea, we have plotted the frontier molecular orbitals, HOMO and LUMO energy levels, for BB-94 and two silver complexes in Table S1 that are useful to characterize the local and global chemical reactivity of molecules. It should be mentioned that the HOMO and LUMO energy levels also define the ionization potential and electron affinity of the tested compound.
Table S1 illustrates the optimized structures and HOMO and LUMO energy levels for BB-94 and corresponding metal complexes. As can be seen, a good agreement was obtained between them. On the contrary, when the adsorbate is linked to the metal surface throughout the Amide B group, there are noticeable differences in the LUMO, implying that a CT process from the metal to the molecule is possible, given rise to the enhancement of the aromatic ring vibrational modes as the characteristic ν(CC); 8a. Table S1 shows also the HOMO-LUMO energy gaps and we observe that the gap decreases as the number of interactions with the metal increases. In addition, the UV-Vis absorption properties of the BB-94 and its metal complexes were simulated by TD-DFT calculations. Figure S2 shows the computed UV-Vis absorption spectra of the simulated adsorbates. As can be seen, the spectrum of metal complexes involves more absorption bands, indicating that conformational differences between these molecules cause changes to the vertical excitation energies. This is directly related to resonance effects during the excitation process with different laser lines together with the modulation of the voltage in the metal-molecule interface, which gives rise to the observed SERS spectra at each excited laser line.

4. Conclusions

This paper describes a novel approach to determining the physicochemical interactions between the anti-cancer drug BB-94 and an electrochemically roughened silver electrode using surface-enhance Raman spectroscopy (SERS). Firstly, we have determined the molecular structure of the studied compound based on the DFT calculations, and we have proposed the corresponding vibrational assignments. Our Raman results have a very good agreement with the theoretical wavenumber of BB-94, despite the large size of this molecule. The initial part of our study enables us to identify characteristic vibrational modes of this pharmacologically active compound.
Additionally, a detailed analysis of the changes occurring after the adsorption of BB-94 on the Ag electrode surface proved a strong interaction of the mercaptothiophene moiety with the metal surface. Moreover, the interaction of the amide group with the metal surface allows the aromatic ring to move slightly away from the surface. Based on our results, it is possible to conclude that the BB-94 molecule chemically binds to the silver substrate, which influences the participation of the CT mechanism in the enhancement of selected spectral features. A strong relationship between the electrode potential and the intensity of SERS vibration modes was also demonstrated. The obtained data also implied the formation of more than one complex at the metal/biomolecule interface. The existence of these effects for the discussed specific vibrations indicates a strong relationship between the resonance condition and the excitation wavelength.
Based on the foundations of chemical physics, this work may turn out to be crucial in supporting other fields of science, including medicine, pharmacotherapy, and chemo-immunotherapy for cancer. This becomes possible thanks to the unique properties offered by the ultra-sensitive SERS technique.

Supplementary Materials

The following supporting information can be downloaded at: https://www.mdpi.com/article/10.3390/chemosensors11020128/s1. Figure S1. Theoretical Raman spectra (inset: molecular optimized structure of each species) calculated at the B3LYP/6-31G(d,p) level of theory of (a) BB-94 and at the B3LYP/LanL2DZ level of theory of (b) BB-94-SAg and (c) BB-94-SAg-OAg. Table S1. Plot showing the optimized structures and HOMO and LUMO energy levels for BB-94 and corresponding metal complexes. The orbital energies are in atomic units (a. u.), and the GAP is in electron volts (eV). Figure S2. Computed UV-Vis absorption spectra were calculated using DFT-TD at the B3LYP/6-31G(d,p) level of theory for BB-94 and the B3LYP/LanL2DZ level of theory for BB-94-SAg and BB-94-SAg-OAg.

Author Contributions

E.P.: Conceptualization; Methodology; Investigation; Writing—Original Draft Preparation; Visualization; Formal analysis; Reviewing and Editing. M.R.L.-R.: Methodology; Investigation; Writing—Original Draft Preparation; Formal analysis; Validation; Reviewing and Editing. C.P.: Supervision; Reviewing and Editing. W.M.K.: Supervision; Reviewing and Editing. All authors have read and agreed to the published version of the manuscript.

Funding

The study was partially performed using equipment purchased in the frame of the project co–funded by the Małopolska Regional Operational Program Measure 5.1 Krakow Metropolitan Area as an important hub of the European Research Area for 2007–2013, project No. MRPO.05.01.00–12–013/15.

Institutional Review Board Statement

Not applicable.

Informed Consent Statement

Not applicable.

Data Availability Statement

The data presented in this study are available upon request from the corresponding author.

Acknowledgments

The authors thank the facilities of the laboratory of AFM and Raman Microscopy, at the SCAI (Central Services Research Support) of the University of Málaga (Spain) and Rafael Larrosa (University of Málaga) for computational facilities.

Conflicts of Interest

The authors declare no conflict of interest.

References

  1. Panneerselvam, R.; Liu, G.K.; Wang, Y.H.; Liu, J.Y.; Ding, S.Y.; Li, J.F.; Wu, D.Y.; Tian, Z.Q. Surface-enhanced Raman spectroscopy: Bottlenecks and future direction. Chem. Comm. 2018, 54, 10–25. [Google Scholar] [CrossRef]
  2. Ko, H.; Chang, S.; Tsukruk, V.V. Porous substrates for label-free molecular level detection of nonresonant organic molecules. ACS Nano 2009, 3, 181–188. [Google Scholar] [CrossRef] [PubMed]
  3. Zong, C.; Xu, M.; Xu, L.-J.; Wei, T.; Ma, X.; Zheng, X.-S.; Hu, R.; Ren, B. Surface-enhanced Raman spectroscopy for bioanalysis: Reliability and challenges. Chem. Rev. 2018, 118, 4946–4980. [Google Scholar] [CrossRef] [PubMed]
  4. Kneipp, K.; Kneipp, H.; Itzkan, I.; Dasari, R.R.; Feld, M.S. Surface-enhanced Raman scattering and biophysics. J. Phys. Condens. Matter 2002, 14, R597–R624. [Google Scholar] [CrossRef]
  5. Aroca, R. Surface-Enhanced Vibrational Spectroscopy; John Wiley & Sons, Ltd.: West Sussex, England, 2006. [Google Scholar]
  6. Masango, S.S.; Hackler, R.A.; Large, N.; Henry, A.I.; McAnally, M.O.; Schatz, G.C.; Stair, P.C.; Van Duyne, R.P. High-resolution distance dependence study of surface-enhanced Raman scattering enabled by atomic layer deposition. Nano Lett. 2016, 16, 4251–4259. [Google Scholar] [CrossRef] [PubMed]
  7. Dieringer, J.A.; McFarland, A.D.; Shah, N.C.; Stuart, D.A.; Whitney, A.V.; Yonzon, C.R.; Young, M.A.; Zhang, X.Y.; Van Duyne, R.P. Surface enhanced Raman spectroscopy: New materials, concepts, characterization tools, and applications. Faraday Discuss 2006, 132, 9–26. [Google Scholar] [CrossRef]
  8. Willets, K.A. Super-resolution imaging of SERS hot spots. Chem. Soc. Rev. 2014, 43, 3854–3864. [Google Scholar] [CrossRef]
  9. Cong, S.; Liu, X.; Jiang, Y.; Zhang, W.; Zhao, Z. Surface enhanced Raman scattering revealed by interfacial charge-transfer transitions. Innovation 2020, 1, 100051. [Google Scholar] [CrossRef]
  10. Lombardi, J.R.; Birke, R.L. A unified approach to surface-enhanced Raman spectroscopy. J. Phys. Chem. C 2008, 112, 5605–5617. [Google Scholar] [CrossRef]
  11. Pięta, E.; Proniewicz, E.; Boduszek, B.; Olszewski, T.K.; Nattich-Rak, M.; Kim, Y. Probing the Ag, Au, and Cu electrode/pyridine-α-hydroxymethyl biphenyl phosphine oxide isomer interface with SERS. Appl. Surf. Sci. 2015, 335, 167–183. [Google Scholar] [CrossRef]
  12. Pięta, E.; Paluszkiewicz, C.; Oćwieja, M.; Kwiatek, W.M. Potential drug—Nanosensor conjugates: Raman, infrared absorption, surface—Enhanced Raman, and density functional theory investigations of indolic molecules. Appl. Surf. Sci. 2017, 404, 168–179. [Google Scholar] [CrossRef]
  13. Pięta, E.; Piergies, N.; Oćwieja, M.; Domin, H.; Paluszkiewicz, C.; Bielańska, E.; Kwiatek, W.M. Monitoring the interfacial behavior of selective Y5 receptor antagonist on colloidal gold nanoparticle surfaces: Surface-enhanced vibrational spectroscopy studies. J. Phys. Chem. C 2017, 121, 17276–17288. [Google Scholar] [CrossRef]
  14. Pięta, E.; López-Ramirez, M.R.; Paluszkiewicz, C.; Kwiatek, W.M. Insights into the binding interactions at the nano-bio interface: Electrode potential and wavelength dependence study. Appl. Surf. Sci. 2021, 562, 150228. [Google Scholar] [CrossRef]
  15. Pięta, E.; Paluszkiewicz, C.; Kwiatek, W.M. Multianalytical approach for surface- and tip-enhanced infrared spectroscopy study of a molecule–metal conjugate: Deducing its adsorption geometry. Phys. Chem. Chem. Phys. 2018, 20, 27992–28000. [Google Scholar] [CrossRef]
  16. Fleischmann, M.; Hendra, P.J.; McQuillan, A.J. Raman spectra of pyridine adsorbed at a silver electrode. Chem. Phys. Lett. 1974, 26, 163–166. [Google Scholar] [CrossRef]
  17. Cotton, T.M. Advances in Spectroscopy. In Spectroscopy of Surfaces; Clark, R.J.H., Hester, R.E., Eds.; Wiley: New York, NY, USA, 1988; Volume 16, pp. 91–146. [Google Scholar]
  18. Qian, X.; Peng, X.H.; Ansari, D.O.; Yin-Goen, Q.; Chen, G.Z.; Shin, D.M.; Yang, L.; Young, A.N.; Wang, M.D.; Nie, S. In vivo tumor targeting and spectroscopic detection with surface-enhanced Raman nanoparticle tags. Nat. Biotechnol. 2008, 26, 83–90. [Google Scholar] [CrossRef] [PubMed]
  19. Wu, D.Y.; Li, J.F.; Ren, B.; Tian, Z.Q. Electrochemical surface-enhanced Raman spectroscopy of nanostructures. Chem. Soc. Rev. 2008, 37, 1025–1041. [Google Scholar] [CrossRef]
  20. Tian, Z.Q.; Ren, B.; Wu, D.Y. Surface-Enhanced Raman Scattering:  From noble to transition metals and from rough surfaces to ordered nanostructures. J. Phys. Chem. B 2002, 106, 9463–9483. [Google Scholar] [CrossRef]
  21. Birke, R.L.; Lombardi, J.R. Surface-enhanced Raman scattering. In Spectroelectrochemistry—Theory and Practice; Gale, R.J., Ed.; Plenum: New York, NY, USA, 1988; pp. 263–344. [Google Scholar]
  22. Krüger, A.; Soeltl, R.; Sopov, I.; Kopitz, C.; Arlt, M.; Magdolen, V.; Harbeck, N.; Gänsbacher, B.; Schmitt, M. Hydroxamate-type matrix metalloproteinase inhibitor batimastat promotes liver metastasis. Cancer Res. 2001, 61, 1272–1275. [Google Scholar]
  23. Deryugina, E.I.; Ratnikov, B.I.; Strongin, A.Y. Prinomastat, a hydroxamate inhibitor of matrix metalloproteinases, has a complex effect on migration of breast carcinoma cells. Int. J. Cancer 2003, 104, 533–541. [Google Scholar] [CrossRef] [PubMed]
  24. Low, J.A.; Johnson, M.D.; Bone, E.A.; Dickson, R.B. The matrix metalloproteinase inhibitor batimastat (BB-94) retards human breast cancer solid tumor growth but not ascites formation in nude mice. Clin. Cancer Res. 1996, 2, 1207–1214. [Google Scholar] [PubMed]
  25. Sledge, G.W., Jr.; Qulali, M.; Goulet, R.; Bone, E.A.; Fife, R. Effect of matrix metalloproteinase inhibitor batimastat on breast cancer Rregrowth and metastasis in athymic mice. J. Natl. Cancer Inst. 1995, 87, 1546–1550. [Google Scholar] [CrossRef] [PubMed]
  26. Rasmussen, H.S.; McCann, P.P. Matrix metalloproteinase inhibition as a novel anticancer strategy: A review with special focus on batimastat and marimastat. Pharmacol. Ther. 1997, 75, 69–75. [Google Scholar] [CrossRef] [PubMed]
  27. Rothenberg, M.L.; Nelson, A.R.; Hande, K.R. New drugs on the horizon: Matrix metalloproteinase inhibitors. Stem Cells 1999, 17, 237–240. [Google Scholar] [CrossRef]
  28. Frisch, M.J.; Trucks, G.W.; Schlegel, H.B.; Scuseria, G.E.; Robb, M.A.; Cheeseman, J.R.; Scalmani, G.; Barone, V.; Mennucci, B.; Petersson, G.A.; et al. Gaussian 09; Revision C.01; Gaussian, Inc.: Wallingford, CT, USA, 2009. [Google Scholar]
  29. Burcl, R.; Handy, N.C.; Carter, S. Vibrational spectra of furan, pyrrole, and thiophene from a density functional theory anharmonic force field. Spectrochim. Acta Part A Mol. Biomol. Spectrosc. 2003, 59, 1881–1893. [Google Scholar] [CrossRef]
  30. Zhu, H.L.; Liu, J.; Zheng, X.; Phillips, D.L. Resonance Raman study of the A-band short-time photodissociation dynamics of 2-iodothiophene. J. Chem. Phys. 2006, 125, 054510-1–054510-9. [Google Scholar] [CrossRef]
  31. Magdaline, J.D.; Chithambarathanu, T. Vibrational spectra (FT-IR, FT-Raman), NBO and HOMO, LUMO studies of 2-thiophene carboxylic acid based on density functional method. IOSR J. Appl. Chem 2015, 8, 6–14. [Google Scholar]
  32. Balachandran, V.; Janaki, A.; Nataraj, A. Theoretical investigations on molecular structure, vibrational spectra, HOMO, LUMO, NBO analysis and hyperpolarizability calculations of thiophene-2-carbohydrazide. Spectrochim. Acta Part A Mol. Biomol. Spectrosc. 2014, 118, 321–330. [Google Scholar] [CrossRef]
  33. Ye, J.; Hutchison, J.A.; Uji-i, H.; Hofkens, J.; Lagae, L.; Maes, G.; Borghsa, G.; Van Dorpe, P. Excitation wavelength dependent surface enhanced Raman scattering of 4-aminothiophenol on gold nanorings. Nanoscale 2012, 4, 1606–1611. [Google Scholar] [CrossRef]
  34. Wilson, E.B., Jr. The normal modes and frequencies of vibration of the regular plane hexagon model of the benzene molecule. Phys. Rev. 1934, 45, 706–714. [Google Scholar] [CrossRef]
  35. Lopez-Ramirez, M.R.; Aranda Ruiz, D.; Avila Ferrer, F.J.; Centeno, S.P.; Arenas, J.F.; Otero, J.C.; Soto, J. Analysis of the potential dependent surface-enhanced Raman scattering of p-aminothiophenol on the basis of MS-CASPT2 calculations. J. Phys. Chem. C 2016, 120, 19322–19328. [Google Scholar] [CrossRef]
  36. Arenas, J.F.; Fernandez, D.J.; Soto, J.; Lopez-Tocon, I.; Otero, J.C. Role of the electrode potential in the charge-transfer mechanism of surface-enhanced Raman scattering. J. Phys. Chem. B 2003, 107, 13143–13149. [Google Scholar] [CrossRef]
  37. Arenas, J.F.; Soto, J.; Pelaez, D.; Fernandez, D.J.; Otero, J.C. Understanding complex surface-enhanced Raman scattering, using quantum chemical calculations. Int. J. Quantum Chem. 2005, 104, 681–694. [Google Scholar] [CrossRef]
  38. Kurouski, D.; Postiglione, T.; Deckert-Gaudig, T.; Deckert, V.; Lednev, I.K. Amide I vibrational mode suppression in surface (SERS) and tip (TERS) enhanced Raman spectra of protein specimens. Analyst 2013, 138, 1665–1673. [Google Scholar] [CrossRef] [PubMed]
  39. Lopez-Ramirez, M.R.; Ruano, C.; Castro, J.L.; Arenas, J.F.; Soto, J.; Otero, J.C. Surface-enhanced Raman scattering of benzoate anion adsorbed on silver nanoclusters: Evidence of the transient formation of the radical dianion. J. Phys. Chem. C 2010, 114, 7666–7672. [Google Scholar] [CrossRef]
  40. Arenas, J.F.; López-Tocón, I.; Castro, J.L.; Centeno, S.P.; López-Ramírez, M.R.; Otero, J.C. Resonant charge transfer on the nanoscale: Studying doublet states of adsorbates by surface-enhanced Raman scattering. J. Raman Spect. 2005, 36, 515–521. [Google Scholar] [CrossRef]
  41. Moskovits, M. Surface-Enhanced Spectroscopy. Rev. Mod. Phys. 1985, 57, 783–826. [Google Scholar] [CrossRef]
  42. Felidj, M.; Aubard, J.; Levi, G.; Krenn, J.R.; Salerno, M.; Schider, G.; Lamprecht, B.; Leitner, A.; Aussenegg, F.R. Controlling the optical response of regular arrays of gold particles for surface-enhanced Raman scattering. Phys. Rev. B 2002, 65, 075419. [Google Scholar] [CrossRef]
  43. Alvarez-Puebla, R.A. Effects of the excitation wavelength on the SERS spectrum. J. Phys. Chem. Lett. 2012, 3, 857–866. [Google Scholar] [CrossRef] [PubMed]
  44. Safar, W.; Lequeux, M.; Solard, J.; Fischer, A.P.A.; Felidj, N.; Gucciardi, P.G.; Edely, M.; de la Chapelle, M.L. Gold nanocylinders on gold film as a multi-spectral SERS substrate. Nanomater 2020, 10, 927. [Google Scholar] [CrossRef] [PubMed]
Figure 1. Experimental Raman spectra of BB-94 recorded at different wavelengths and theoretical Raman spectra at B3LYP/6-31G(d,p) (A); optimized structure of BB-94 at B3LYP/6-31G(d,p) level of theory, indicating some functional groups discussed in this work (B).
Chemosensors 11 00128 g001
Figure 2. The potential-dependent SERS spectra of BB-94 adsorbed onto an electrochemically roughened Ag electrode at 0.0 V, −0.1 V, −0.2 V, −0.3 V, −0.4 V, −0.5 V, −0.6 V, −0.7 V, −0.8 V, −0.9 V, −1.0 V, −1.1 V, and −1.2 V electrode potential values were registered at 532 nm (A) and 785 nm (B) excitation lines.
Chemosensors 11 00128 g002
Figure 3. Optimized structure of BB-94 at B3LYP/6-31G(d,p) level of theory and suggested adsorption geometry of BB-94 on roughened Ag electrode surface.
Chemosensors 11 00128 g003
Figure 4. SERS excitation CT profiles of selected bands vs. the electrode potential generated for 532 nm (A) and 785 nm (B) excitation lines.
Chemosensors 11 00128 g004
Table 1. Wavenumbers (cm−1) of the main experimental and calculated Raman bands of BB-94 and proposed assignments.
νexp
λ = 785 nm
νcalc
B3LYP/6-31G
Assignment 1
1660 vw1702ν(C=O)Ab, Amide I
1643 vw1681ν(C=O)Aa, Amide I
1606 w15968a; ν(CC)ring
1585 vw15758b; ν(CC)ring
1445 vw1468δ(CH3)
1401 vs1407ν(CC)Thp
1338 m1328ν(CC)Thp, δ(CH)Thp
1298 w1277δ(NH), δ(CH2)
1238 w1219ν(N-CO), δ(NH)
1218 w1180ν(CX)ring, δ(NH)
1158 w1146δ(CH2), δ(CH)ring
1083 w1078δ(CH)Thp
1032 w1017δ(CH)ring
1002 m1001δ(CC)ring
946 w942ν(CS)Thp
845 w820δ(CSC)Thp
825 vw807δ(CC)ring
739 w738γ(CH)ring
643 w689ν(S-CH2), γ(CH)Thp
620 w610δ(CC)ring
1 Abbreviations: w—weak; vw—very weak; m—medium; s—strong; vs—very strong; ν—stretching; δ—bending; γ—out of plane; Thp—thiophene; Ring—aromatic ring; Aa—Amide A; Ab—Amide B.
Disclaimer/Publisher’s Note: The statements, opinions and data contained in all publications are solely those of the individual author(s) and contributor(s) and not of MDPI and/or the editor(s). MDPI and/or the editor(s) disclaim responsibility for any injury to people or property resulting from any ideas, methods, instructions or products referred to in the content.

