Article

An Alternative Approach for the Synthesis of Zinc Aluminate Nanoparticles for CO and Propane Sensing Applications

by
Lorenzo Gildo-Ortiz
1,*,
Verónica-María Rodríguez-Betancourtt
1,
Jorge Alberto Ramírez Ortega
1,2 and
Oscar Blanco-Alonso
1
1
CUCEI, Universidad de Guadalajara, M. García Barragán 1421, Guadalajara 44410, Jalisco, Mexico
2
Campus Guadalajara—UNITEC MÉXICO—Universidad Tecnológica de México, Calz. Lázaro Cárdenas 405, San Pedro Tlaquepaque 45559, Jalisco, Mexico
*
Author to whom correspondence should be addressed.
Chemosensors 2023, 11(2), 105; https://doi.org/10.3390/chemosensors11020105
Submission received: 27 December 2022 / Revised: 24 January 2023 / Accepted: 28 January 2023 / Published: 2 February 2023
(This article belongs to the Special Issue Recent Advances in Metal Oxide-Based Gas Sensors)

Abstract

:
We implemented a simple and inexpensive aqueous sol-gel process to synthesize ZnAl2O4 nanoparticles to study its potential application as a gas sensor. Compared to traditional ceramic methods, the synthesis was conducted at lower temperatures and reaction times (5 h from 200 °C). The crystalline evolution of the oxide was investigated. The effect of the calcination temperature (200–1000 °C) on the crystallites’ size (16–29 nm) and the ZnAl2O4 powder’s surface morphology was also analyzed. Measurements confirmed the formation of bar-shaped granules (~0.35 μm) made up of nanoparticles (~23 nm). The surface area of the powders was 60 m2/g. Pellets were made from the powders and tested in sensing carbon monoxide and propane gases, showing a high sensitivity to such gases. The sensor’s response increased with increasing temperature (25–300 °C) and gas concentration (0–300 ppm). The oxide showed a higher response in propane than in carbon monoxide. We concluded that the ZnAl2O4 is a good candidate for gas sensing applications.

1. Introduction

Gas sensors are widely used for different advanced engineering applications, such as medical diagnosis, environmental care, hazard-monitoring, agriculture, and automotive. Gas sensor technologies include infrared sensors, photoionization detectors, and solid-state sensors. There is increasing interest in developing resistive chemical sensors to be used in technological advances, for example, in IoT (Internet-of-Things) integration. Some materials employed to fabricate these sensors include metal oxide semi-conductors, conductive polymers, 2D materials, and carbon nanostructures [1]. Semiconductor metal oxides are widely studied for their application as the sensitive layer in portable gas detection systems [2]. These oxides have advantages, such as low cost, easy production, compact size, simple measurement electronics, high sensitivity, and a wide variety of gases they can sense [3,4,5]. The sensing process involves an electron exchange between the test gas and the surface of the sensitive material, whereby the transduction function is correlated with the microstructure of the semiconductor oxide [6]. Sensors’ performance is significantly affected by the chemical composition of the sensitive layer and its microstructural features, mainly the morphology and particle size [7]. When the particle size is reduced to a nanometric scale, the surface–volume ratio increases, thus exposing many surface sites and favoring the adsorption of gases [8]. For this reason, sensors based on nanostructured materials allow improving sensing properties such as sensitivity and selectivity.
Spinel-type compounds are ceramics with the general formula AB2O4, which have a wide range of applications due to their interesting physical and chemical properties [9]. Such properties are determined by the nature of the cations that compose them. Their thermal, electrical, magnetic, optical, and mechanical properties stand out. Different spinels exhibit electrical responses when exposed to oxidizing and reducing gases. Thus, spinels are widely investigated as gas sensors for their thermal stability and semiconductor behavior. For example, it has been reported that ZnMn2O4 nanoparticles are sensitive to carbon monoxide, propane, and isopropanol; NiGa2O4 and CoGa2O4 compounds are selective for triethylenediamine; the MnCo2O4 spinel has been studied as a hydrogen sensor at room temperature; the Zn1−xCoxAl2O4 nanostructured system is highly sensitive to ethanol, and ZnFe2O4 spheres are also highly sensitive to ethanol and toluene [10,11,12,13,14]. Among this family of compounds, zinc aluminate (ZnAl2O4) stands out due to the peculiar arrangement of cations in its structure, which leads to better mobility of charge carriers [9,15]. Zinc aluminate is a naturally available mineral that adopts a standard spinel structure (space group Fd-3m) [16]. This oxide has been extensively studied as a catalyst, catalyst support, ceramic, optical, and electronic material [16,17,18,19]. It has been recently reported that the ZnAl2O4 is very sensitive to gases (mainly ethanol vapor, hydrogen, H2S, NH4) and humidity, being, therefore, a potential candidate for gas sensors [9,20,21,22].
By improving the oxide synthesis processes, the production of materials with controlled morphology and structure, and a better purity level, will rise soon. In this sense, different routes have been developed to synthesize the ZnAl2O4. Zinc aluminate nanobars have been prepared by employing a homogeneous co-precipitation process followed by a heat treatment at 900 °C [20]. It has also been synthesized by ball-milling techniques, calcined at 900 °C, and sintered at 1200 and 1400 °C [23,24]. Likewise, it has been synthesized through a metal–chitosan complexation process from 500 to 900 °C [25]. In previous studies, we reported that using different types and concentrations of chelating agents is an adequate strategy for synthesizing mixed oxides—mainly perovskites—and trirutiles, which allows for controlling the size and shape of the particles [26,27,28]. Microwave radiation gave us attractive advantages in synthesizing these materials because secondary reactions (and reaction times) reduced significantly, and the reaction yield increased, which favored the production of nanoparticles [29]. All this improved the chance of the synthesized materials being applied as gas sensors. Therefore, it is of scientific and technological interest to continue investigating the synthesis of ZnAl2O4 and its potential application as a gas sensor. In this work, we propose a microwave-assisted aqueous sol-gel process to produce ZnAl2O4 spinel powders. One of the goals is to explore the synthesis of the material by analyzing the effect of temperature on crystalline evolution, crystal size, surface morphology, structural characteristics, and composition. Another goal is to investigate the possible use of ZnAl2O4 as a gas sensor, analyzing the effect of operating temperature, gas concentration, and gas type on the material’s sensitive response. An outstanding aspect of this work is that nanostructured powders of the material were produced at relatively low temperatures and with defined surface morphology. Furthermore, the synthesized material was sensitive to different gas concentrations at several temperatures.

2. Materials and Methods

2.1. Synthesis of ZnAl2O4

To synthesize the ZnAl2O4 oxide with a spinel-like structure, a sol-gel chemical method assisted with microwave radiation was used. For this process, three solutions were prepared using 0.010 mol of Al(NO3)3 9H2O (Sigma-Aldrich, St. Louis, MO, USA), 0.005 mol of Zn(NO3)2 6H2O (Jalmek, San Nicolás de los Garza, Mexico), and 2 mL of ethylenediamine (Sigma), respectively. For the three solutions, 5 mL of distilled water was used. These precursor solutions were left under constant stirring at 375 rpm for 10 min at 25 °C. Immediately afterward, the solutions were mixed and left under continuous stirring for 24 h at 25 °C. After the stirring, the residual alcohol was evaporated using a domestic oven (LG, model MS1147 X). In this case, a radiation of ~290 W was applied during time intervals of 180 s until a paste was formed by maintaining the colloidal solution at a temperature below 90 °C to avoid material loss due to splashes. Temperature control was done with an Extech IR 403255 thermometer. After the evaporation stage, the next step was drying at 200 °C. The obtained powders were grouped for calcinations at 300, 400, 500, 600, 700, 800, 900, and 1000 °C. The drying and calcining processes were done using an oven-type muffle (Vulcan 5–550) at a heating ramp of 100 °C/h. Figure 1 shows a schematic of the ZnAl2O4 synthesis process.

2.2. Physical Characterization

The crystalline evolution of the powders was analyzed by X-ray diffraction (XRD, Panalytical Empire). To perform the analysis, Cu-Kα radiation was used in a 2θ range from 20 to 70° with a step size of 0.02°/30 s. The morphological characterization of the calcined powders used the secondary electron signal by scanning electron microscopy (SEM, Jeol model JSM-6390LV) in high vacuum mode. X-ray energy dispersive spec-troscopy (EDS-SEM, BRUKER 127 eV XFlash Detector 5010) was employed to discern the chemical composition of the powders’ surface. The size and shape of the particles were estimated using a transmission electron microscope (TEM, Jeol model JEM-2010) with an acceleration voltage of 200 kV. In this case, it was necessary to disperse the powders in isopropanol for 5 min using ultrasound. A drop of the dispersed solution was placed in the microgrid of the TEM, which was covered with carbon. The microgrid was then dried and set in the TEM equipment for the analysis. To know the value of the specific surface area of the material, an N2 physisorption analysis was performed (BET method, BEL Japan Minisorp II). For the analysis, it was necessary to degas the sample and keep it in a vacuum for 24 h at 25 °C. The value of the bandgap was estimated using a UV-vis spectrometer (Agilent Technologies, model Cary-300), which contained an integrating sphere of polytetrafluoroethylene (PTFE).

2.3. Sensing Response

Samples’ responses were analyzed in carbon monoxide and propane atmospheres at concentrations of 0, 5, 50, 100, 200, and 300 ppm. Working temperatures of 25, 100, 200, and 300 °C were employed to obtain a profile of the material’s sensing behavior. The measurements were performed in a vacuum chamber where gas concentration and sensor temperature were electronically controlled [26,27,28,30]. ZnAl2O4 pellets (12 mm in diameter 0.5 mm in thickness) were formed by compressing the synthesized powders with a manual press (Simplex Ital Equipment-25 Tons), applying 10 tons for 3 min. For this, approximately 0.4 g of the material were used. Two ohmic contacts were placed on the pellets’ surface using colloidal silver paint (Alfa Aesar, >99%) for contacting the electrodes. The variations of the electrical resistance were monitored using a Keithley 2001 digital multimeter. Figure 2 shows the equipment employed to perform the sensitivity tests. In this case, the sensitivity S was calculated using the following equation [3,7,26]:
S = G G G 0 G 0
where GG and G0 are the material’s electrical conductance measured in the test gas (CO or propane) and air, respectively.

3. Results

3.1. Diffraction Analysis

To study the formation of the material’s crystalline phase, XRD analyzes were performed. Figure 3 shows the diffraction patterns of the powders calcined at 200–1000 °C. Diffraction peaks, identified from 1 to 7 in Figure 3, were observed in the 2θ angular positions 31.4°, 36.8°, 44.8°, 49.2°, 55.7°, 59.6°, and 65.3°, corresponding to the cubic phase of the spinel-like ZnAl2O4.
Peak indexing was performed using the following equation:
s e n 2 h 2 + k 2 + l 2 = λ 2 4 a 2
where the left-hand side varied for each peak, while the right-hand term was constant. θ is the Bragg angle, hkl are the Miller indices, λ is the wavelength of the radiation employed (1.5406 Å), and a is the lattice parameter. λ2/4a2 term was ~0.0091 for each peak, assigning the indices (220), (311), (400), (331), (422), (511), and (440), respectively, to the peaks 1 to 7, corresponding to a face-centered cubic structure. The calculated lattice parameter was 8.06 Å with a standard deviation of 0.005 Å. Table 1 shows the 2θ angular positions, interplanar distances ( d ), crystallographic planes, and lattice parameter ( a ) estimated by XRD from the sample obtained at 700 °C.
It is worth noting that from 700 °C, the peaks were better defined and more intense, with a low noise level, indicating an improvement in crystallinity. However, it has been reported in the literature that an increase in the calcination temperature favors the growth of the particles and, consequently, a low sensing response. For this study, we desired to obtain the material’s crystalline phase at an adequate temperature for better performance. For the sample obtained at 700 °C, the peaks’ diffraction intensity remained almost constant. A slight narrowing of the peaks with the increasing calcination temperature was further observed. The crystallite size was a factor that contributed to the broadening of the diffraction peaks. The average crystal size D was estimated using Scherrer’s equation:
D = 0.9 λ B c o s
where B is the peak’s width measured at half its maximum intensity (FWHM) [31]. The crystallites’ size rose with increasing calcination temperature. This effect can be observed in Figure 4. From 200 to 600 °C, the crystals had an estimated size of less than 20 nm; at 700 °C, ~20 nm; from 800 °C, their size was greater than 20 nm.
A comparison of several synthesis methods and temperatures to obtain zinc aluminate reported in the literature is presented next. For example, samples of Ce-doped ZnAl2O4 were synthesized via a solution combustion process at 500 and 800 °C for 2 h, obtaining platelet-like microparticles [16]. ZnAl2O4 micrograins were synthesized by the sol-gel method calcining at 750 °C for 3 h, obtaining consolidated samples by hot pressing at 1600 °C for 1 h [17]. ZnAl2O4 nanorods were also synthesized using a coprecipitation approach followed by heat treatment at 900 °C for 3 h [20]. A series of spinel-like compounds were synthesized by the citrate sol-gel method, where ZnAl2O4 was obtained after calcination at 700 °C for 5 h [21]. ZnO/ZnAl2O4 composite oxides were prepared by calcining hydroxides and the products at 600–1000 °C for 5 h [22]. On the other hand, ZnAl2O4 ceramic powders were obtained by means of sol-gel synthesis from acetates and metal alkoxides and calcining at 700, 800, and 900 °C for 2 h. The material consisted of particles with a size smaller than 5 μm [23]. Samarium-doped zinc aluminate was prepared by a grinding process, where several sintering stages were performed at temperatures of up to 1200 °C [24]. In addition, ZnAl2O4 nanocrystals were prepared by metal-chitosan complexation methods and calcining at 500–900 °C for 4 h [25]. Table 2 summarizes the main methods used to synthesize the zinc aluminate spinel. Our results show that our synthesis method is a suitable and straightforward way to synthesize nanocrystalline ZnAl2O4 at relatively low temperatures and without secondary phases.

3.2. SEM Analysis

Scanning electron microscopy (SEM) was used to analyze the powders’ microstructure. Figure 5 shows SEM images of the samples obtained at temperatures 200–1000 °C. In the micrographs of the powders synthesized from 200 to 700 °C (Figure 5a–f), it is observed that a large quantity of bar-shaped granules grew in all directions on localized areas of microplates, which acted as a substrate. For the powders calcined at 800 and 900 °C (Figure 5g,h), laminar-shaped microstructures like flakes (diameter ~1.5 μm) were observed, and no microbars were identified like those obtained at 200–700 °C. These changes in surface morphology are attributed to the temperature effect that causes particle growth and surface densification [32], which was observed more clearly in the sample obtained at 1000 °C (Figure 5i).
Figure 6 shows a more detailed SEM analysis of the ZnAl2O4 powders obtained at 700 °C, where bar-shaped microstructures, a defined XRD pattern, and a crystal size of ~20 nm were still observed (see Section 3.1). SEM images are depicted at three magnifications: (a) 2300×, (b) 11,000×, and (c) 23,000×. The bar-shaped granules’ size was estimated to be 0.23–0.52 μm, with an average size of ~0.35 μm and a standard deviation of ~0.09 μm. Figure 6d shows the size distribution.
The use of ethylenediamine, a potent coordination agent, has been favored in recent years to synthesize inorganic materials [27,28]. Zn and Al ions form translucent whitish suspensions with this chelating agent. Rod, tube, and wire-shaped structures have been documented using this amine [33]. Ethylenediamine facilitates the formation of crystalline phases at relatively low temperatures [34]. It acts as a template that, as a first step, is incorporated into the inorganic network to subsequently escape from it, forming the desired nanocrystals and morphologies [35]. The presence of this amine determines the geometric features of the formed nuclei. The morphologies thus obtained follow the crystallization principles described by LaMer and Dinegar [36].
Figure 7 shows a typical EDS-SEM spectrum of the ZnAl2O4, where Zn, Al, and O characteristic lines are observed according to the material’s chemical composition. For zinc, the peaks corresponded to lines Ll, Lα, Kα, and Kβ located at 0.88, 1.01, 8.63, and 9.57 keV, respectively. Aluminum’s peak corresponded to the characteristic Kα line, whose energy was 1.48 keV. For oxygen, the line was Kα with an energy of 0.53 keV. The low-intensity line near the 0.28 keV corresponded to carbon, possibly due to the tape used to hold the sample during the analysis. The EDS-SEM analysis determined that there were no impurities or extraneous elements in the material, supporting the results obtained by XRD.

3.3. TEM Analysis

Transmission electron microscopy (TEM) was used for a more detailed study of the ZnAl2O4 microstructures. Figure 8 shows a TEM image of the powders synthesized at 700 °C. Figure 8a,b show sets of nanoparticles in close contact. Through the analysis, we estimated a particle size of 11–35 nm, with an average of 23 nm and a standard deviation of 6 nm (Figure 8c). The particle size was close to that estimated by XRD applying Scherrer’s equation. Some mesopores (2–6 nm in diameter) on the particles can also be observed, which is one of the oxide’s important features for its application as a gas sensor. Figure 8e is a high-resolution TEM image (HRTEM) of an area of the sample shown in Figure 8d. In the HRTEM image, rows of atoms can be distinguished, with an interplanar distance of ~0.29 nm corresponding to the (220) planes of the ZnAl2O4 structure. Figure 8f shows an electron diffraction pattern in a selected area (SAED) of the nanoparticles. The SAED pattern shows the characteristic rings of nanometric polycrystalline materials. The first six rings of the electron diffraction pattern were indexed, for this the following equation was used:
r d = λ L
where r is the radius of the diffraction ring, d is the interplanar distance, λ is the wavelength associated with the electron beam (0.0025 nm at 200 kV), and L is the chamber length (8 cm). The calculated interplanar distances were 2.8, 2.4, 2.0, 1.9, 1.7, and 1.6 Å for the analyzed rings, respectively. These distances corresponded closely with those calculated by XRX. The cell parameter calculated by electron diffraction analysis was 8.08 Å, coinciding with the value obtained by XRD and the theoretical value for ZnAl2O4, confirming the phase obtained.

3.4. Nitrogen Adsorption

Figure 9 shows a nitrogen adsorption–desorption isotherm of the ZnAl2O4 powders. The isotherm’s shape was of type II with a type III hysteresis curve, characteristic of macroporous or non-porous adsorbents. The powders’ surface area was 60 m2/g. Particle size was estimated based on the BET surface area with the formula following formula [19]:
D B E T = 6000 ρ S B E T
where DBET is the particle size (nm), ρ is ZnAl2O4′s theoretical density (4.62 m2/g), and SBET is the BET surface area. The particle size (BET) was estimated at 22 nm, which closely coincides with the value obtained by TEM (23 nm) and has good correspondence with the crystallite size estimated by XRD (20 nm) using the Scherrer formula.

3.5. UV-Vis Analysis

The optical absorption of the ZnAl2O4 was studied by UV-Vis spectroscopy. The spectrum is presented in Figure 10. The inset of Figure 10 shows a graph of (αhv)2 versus the photon energy E in the absorption region. The forbidden bandwidth Eg for the ZnAl2O4 was calculated using Tauc’s formula [37,38,39]:
( E ) = A ( E E g ) 1 2 E
where E is the energy of the incident photon, α the optical absorption coefficient, Eg the width of the forbidden band, and A the constant of proportionality. Eg (=3.16 eV) was the intercept of the experimental data’s linear correlation assuming a direct transition.

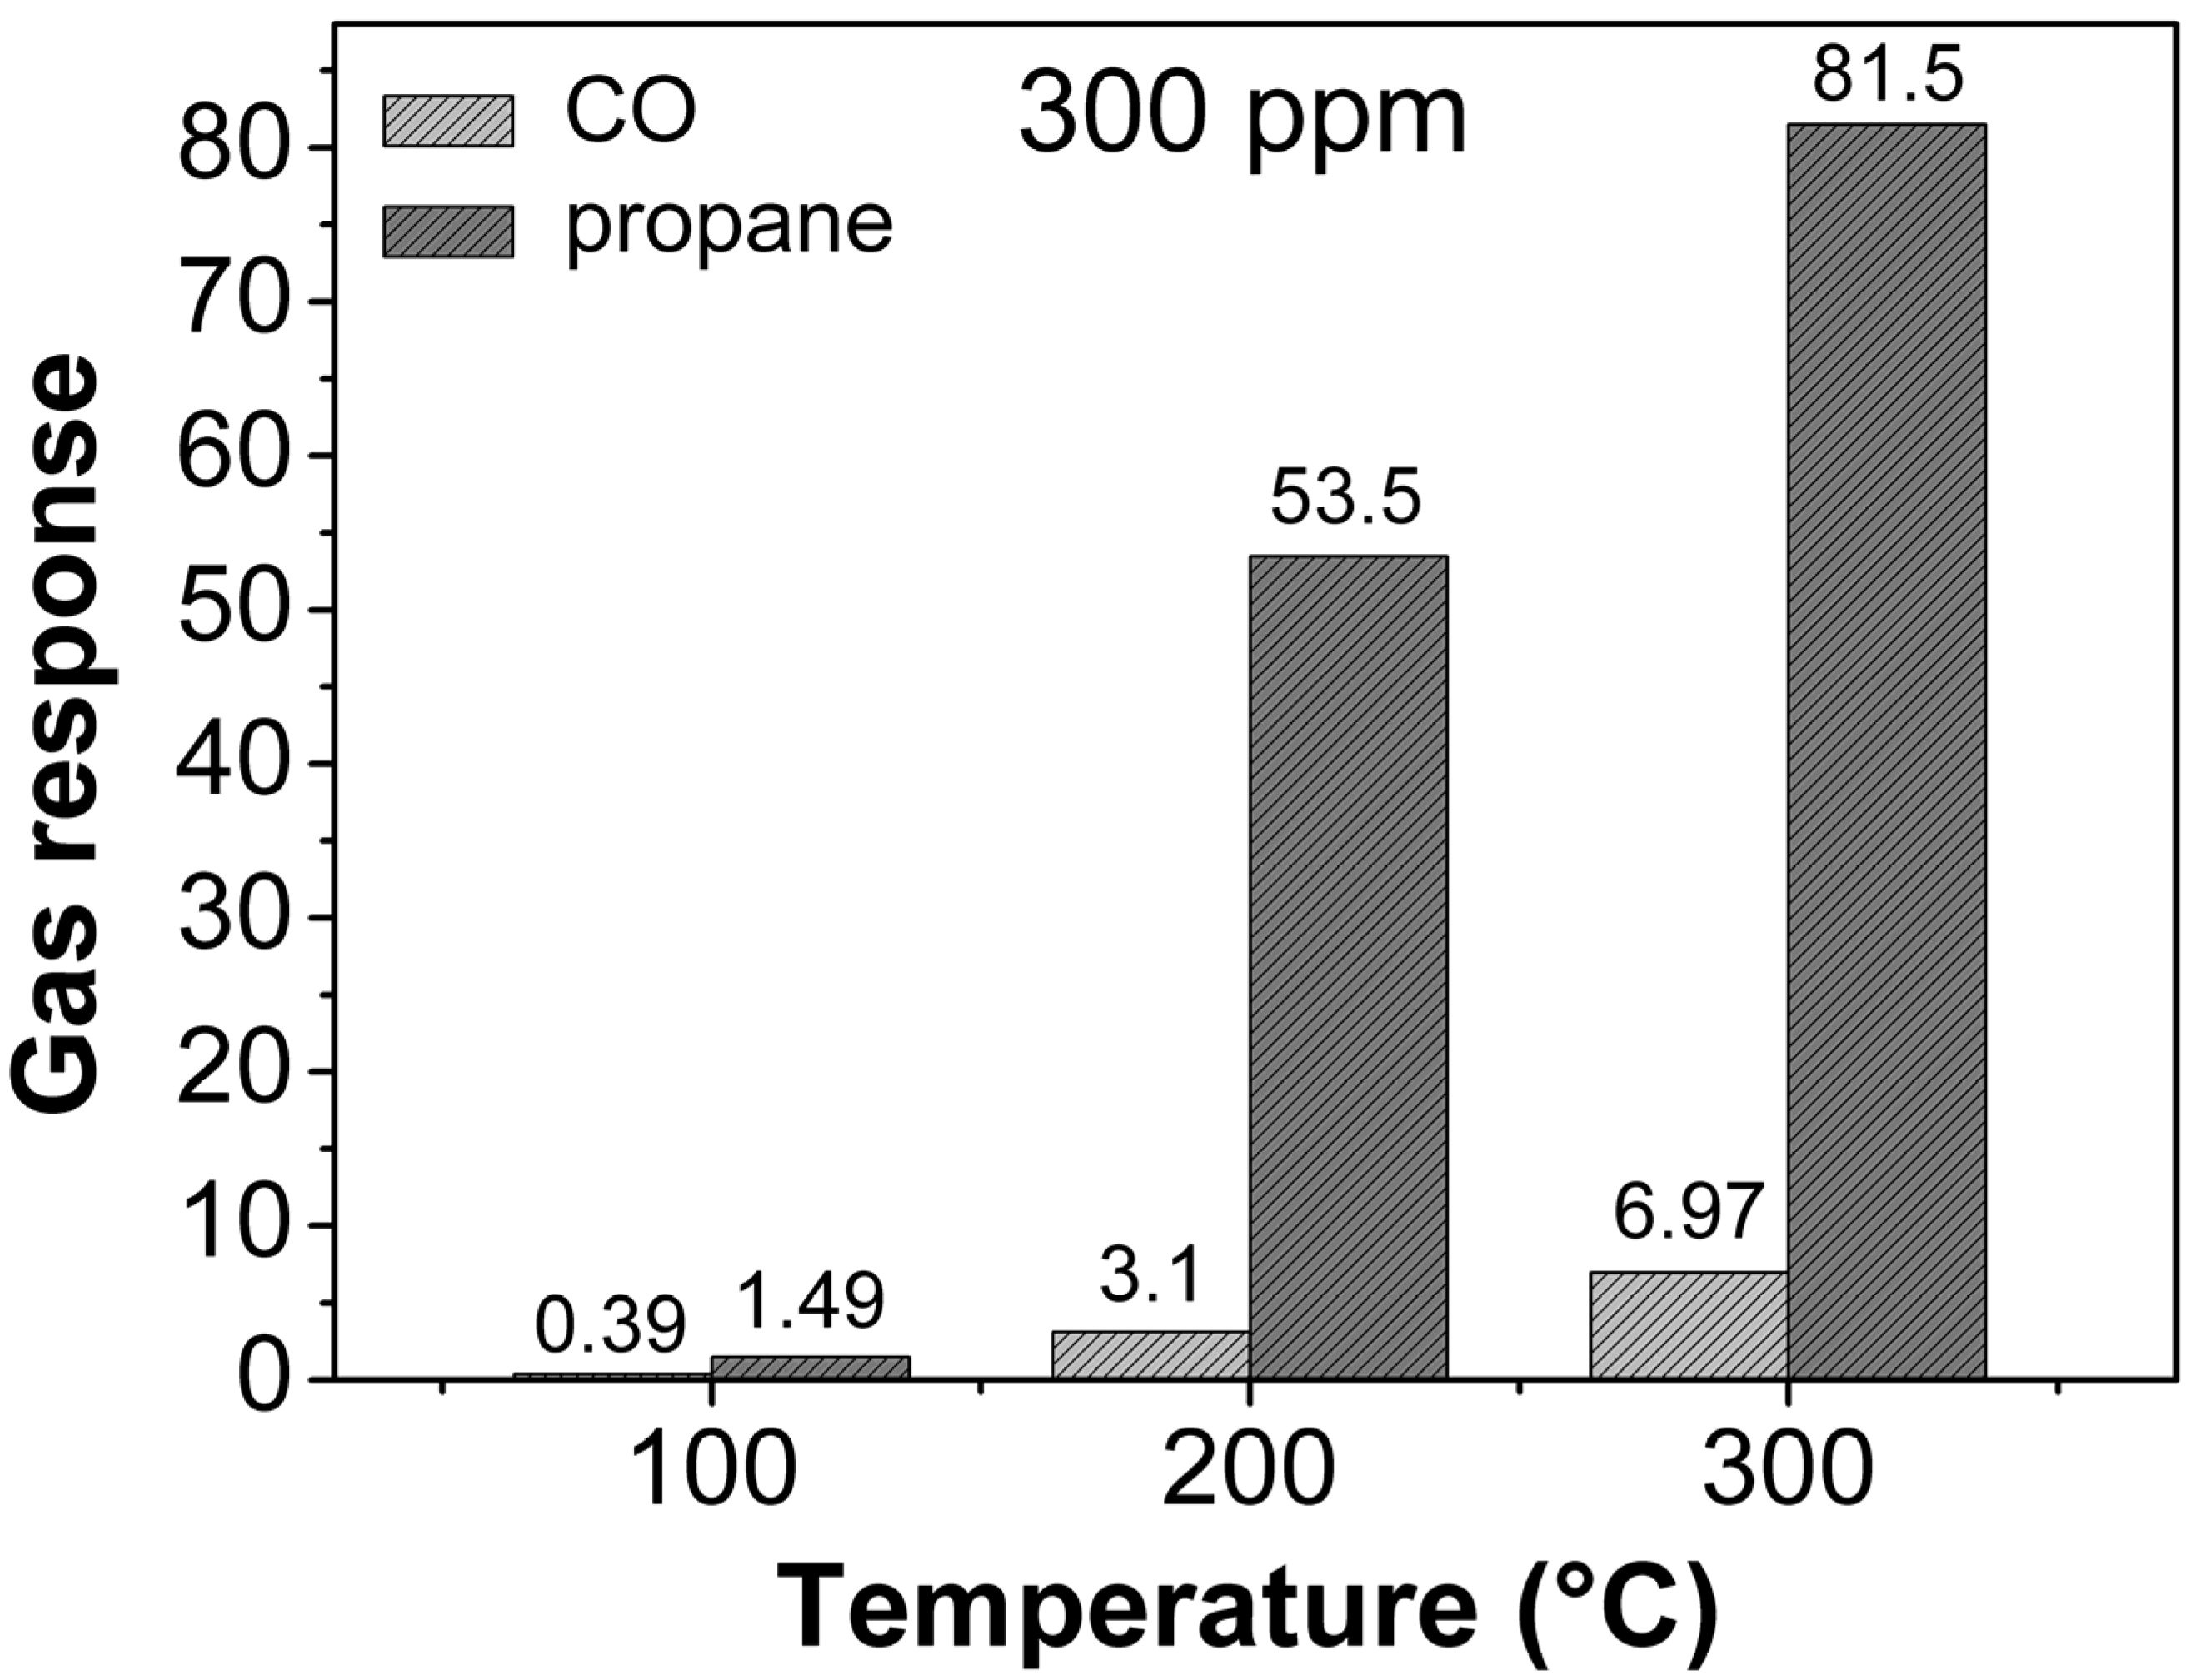
3.6. Gas Response Measurements

Figure 11 show ZnAl2O4′s response in the carbon monoxide and propane atmospheres, respectively, at temperatures 25, 100, 200, and 300 °C. The material did not react to the gases at room temperature since the thermal energy was not enough to cause desorption reactions. The material exhibited a response from 100 °C, increasing with the rising temperature at different concentrations of the gases. In CO, the response at 100 °C was 0.02, 0.06, 0.18, 0.29, and 0.39 to the respective gas concentrations of 5, 50, 100, 200, and 300 ppm; at 200 °C: 0.12, 0.26, 0.60, 1.57, and 3.1 to the same concentrations; at 300 °C: 0.04, 0.40, 1.02, 1.99, and 6.97. In propane, respectively, at 100 °C, 0.03, 0.11, 0.20, 0.47, and 1.49 to the given concentrations; at 200 °C: 0.07, 0.61, 1.93, 6.78, and 53.5; at 300 °C the response increased significantly: 0.26, 1.30, 4.23, 21.8, and 81.5.
ZnAl2O4′s response to the test gases depended on the complex interaction at the gas-solid interface. Oxygen played a crucial role in the sensor’s response since it adsorbed on the material and acted as an intermediary between the gas phase and the sensitive layer, capturing electrons and forming chemisorbed oxygen species [40]. The formed species depended on the operating temperature. At temperatures below 147 °C, the O2− species predominated. With the increase in temperature, the O2− species transformed into the more reactive O and O2− ionic species [41]. In summary, the temperature was a crucial factor in the material’s response (as seen in Figure 11) since increasing the temperature increased the desorption reactions.
Figure 12 shows the curve fitting of the ZnAl2O4‘s response as a function of the operating temperature (Figure 12a,b) and as a function of CO and propane concentration (Figure 12c,d). An ascending linear correlation is observed for CO (Figure 12a) and propane (Figure 12b) with a correlation coefficient R2 greater than 0.9 in the temperature range of 100–300 °C. This behavior is mainly attributed to the fact that the increase in the operating temperature favors the reaction kinetics between the ZnAl2O4 surface and the CO and propane gas. On the other hand, a nonlinear behavior is observed as the concentrations of CO (Figure 12c) and propane (Figure 12d) increase with an R2 coefficient greater than 0.9. Thus, as the gas concentration increased, there was a noticeable increase in the material’s response.
Selectivity refers to a characteristic that determines whether a sensor selectively responds to a specific gas or group of analytes. According to Figure 13, the ZnAl2O4 tended to show higher selectivity in propane than in CO atmospheres. The great ability to detect propane concentrations of 300 ppm at 300 °C was mainly because the gas molecules were oxidized by the oxygen (O) [41] present in the pellets’ surface, causing a greater electron release on the surface and, therefore, a greater change in electrical resistance of the ZnAl2O4. Furthermore, when the gas concentration rose, the number of gas-phase molecules increased and reacted with the oxygen (O) [7,41], provoking a higher material’s response. It is reported in the literature that the O is normally more dominant at temperatures between 300–450 °C [7,42], like in our case, at 300 °C. The presence of O favored the ZnAl2O4 pellets to show greater ability and selectivity to detect propane concentrations. This is corroborated by comparing the maximum responses recorded in propane (~82) and in CO (~7) at 300 °C.
The most accepted mechanism for explaining the sensing of n–type semiconductors (like the one studied here) refers to a band bending and the formation of a zone of electron depletion (space charge layer) due to the oxygen adsorption, forming Schottky barriers on the intergranular surface that electrons must overcome for the conduction process to occur [42]. When the sensor is exposed to a reducing gas such as CO, it reacts with the adsorbed oxygen, forming CO2 and releasing electrons (Figure 14). The band bending is then reversed, decreasing the zone of electron depletion and the material’s resistance. A similar reaction occurred with propane gas. That has been described in a general manner by the following equations [42,43,44]:
2 C O + O 2     2 C O 2 + e
C O + O     C O 2 + e
C 3 H 8 + 10 O     3 C O 2 + 4 H 2 O + 10 e
where O2− and O are surface oxygen ions and e are bulk electrons.
According to Equations (7)–(9), the high selectivity towards propane gas can be attributed to the fact that 10 electrons are released to the material‘s surface when a propane molecule is adsorbed (Equation (9)), which generates a change in the material‘s response. In contrast, in the CO detection tests, 1 electron is released to the surface (Equations (7) and (8). As a result, the chemical reaction that takes place between the propane and oxygen molecules (as O2−, O, or O2−) on the material’s surface is increased, giving rise to a high electrical response (i.e., changes in the electrical resistance).
An essential parameter for applying a semiconductor as a gas sensor is the change in electrical resistivity ( ρ ) when exposed to gaseous atmospheres. In this work, the ZnAl2O4’s resistivity variations were estimated as a function of the test gases’ concentrations and the operating temperature (100–300 °C). For this, we took into account the pellets’ dimensions (thickness = 0.1 mm, diameter = 12 mm) and the formula [28]: ρ = RA/t, where R is the pellets’ electrical resistance in concentrations of CO and C3H8 in air, A is the cross-sectional area, and t is the pellets’ thickness. The results are shown in Figure 15.
As expected, tests at 100 °C showed small resistivity changes in CO atmospheres (Figure 15a). The variations were more significant (151.42 kΩ–m) when the test was carried out at 300 ppm of CO. In contrast, in propane atmospheres, a more pronounced drop in electrical resistivity was recorded as the gas concentration increased (Figure 15b). The most representative values were at 200 and 300 ppm of propane, which corresponded to 96.32 and 56.80 kΩ–m. These resistivity changes are associated with the oxidation of the test gases, which increases when injected into the measurement chamber in the presence of air [28,44]. Experimentally, the oxygen species that reacted on the pellets’ surface due to the applied temperature (100 °C) were O 2 ,   O ,   or   O 2 [7,32,44]. The temperature was sufficient to mobilize the material’s charge carriers (electrons), causing the drop in resistivity. This was confirmed when the operating temperature was increased to 200 and 300 °C (Figure 15a,b). The electrical resistivities at these temperatures at 300 ppm of CO were 16.07 and 2.47 kΩ–m, respectively. In contrast, at 300 ppm of propane, the resistivities were 1.37 and 0.203 kΩ–m, respectively. The decrease in electrical resistivity with a rising temperature is associated with increased mobility of charge carriers on the pellets’ surface [28,42]. This increase in the charge carriers’ kinetic energy was because the temperature made the test gases react more strongly with the oxygen species of type O and   O 2 (-ionic form) in the pellets’ surface [45], causing a decrease in electrical resistivity and with it an increase in the material’s response [28]. This is reflected in the fact that during the detection tests, the pellets showed an inflection point at 200 °C in CO and propane (Figure 15c,d), thus corroborating that the oxygen’s ionic forms O and   O 2 are more reactive and the most available above 200 °C [28,42,45]. In addition, with the rise in the operating temperature, the gas diffusion on the sensor’s surface was favored, achieving adequate adsorption and desorption of the gases [7,28,42] and thereby causing the ZnAl2O4 pellets to show better response, stability, and ability to detect CO and propane at such temperatures (Figure 11 and Figure 15a–d). The trend shown in Figure 15a–d is commonly reported in the literature for a semiconductor used as a sensor of toxic atmospheres [7,26,28,29,30,43,44,46], as the one studied in this work.
Our results reveal that the ZnAl2O4′s performance is comparable to, or even better than, for other mixed oxides: a maximum response of ~7 was reported for CoSb2O6 [45], ZnSb2O6 [46], NdCoO3 [47], and MnSb2O6 [48]; and ~3 for GdCoO3 [49] at CO concentrations of 200–300 ppm at ~300 °C. Such responses were for particle sizes between 70 and 150 nm for trirutile-type CoSb2O6 and microrods for trirtile-type ZnSb2O6, 17 to 151 nm for perovskite-type NdCoO3, 10 to 60 nm for trirutile-type MnSb2O6, and 85 to 130 nm for perovskite-type GdCoO3. In propane at the same conditions, maximum responses of ~31.4 for LaFeO3 [26], ~30 for La-CoO3 [34], ~5 for CoSb2O6 [45], ~1.3 for ZnSb2O6 [46], and ~14.6 for GdCoO3 [49] were reported. Particle sizes of 9 to 54 nm for perovskite-type LaFeO3 and 18 to 150 nm for perovskite-type LaCoO3 were also reported. The spinel-type ZnAl2O4 synthesized in this work, with a particle size between 11 and 35 nm, showed maximum responses of 7 and 82 in CO and propane, respectively, at the same conditions. Table 3 compares the response to carbon monoxide and propane of several mixed oxides.
In summary, our synthesized ZnAl2O4 showed high sensitivity to carbon monoxide and propane gases, even at low concentrations and from 100 °C. We know that a direct relationship does exist between the sensor’s microstructural features and its response. The thickness of the space charge layer Ls is a function of the charge carrier concentration. If the thickness is less than 2Ls (Ls is on the order of nanometers), the entire crystal may be involved in the space charge layer [50]. The gas-sensing reactions occurred at superficial active sites through gas adsorption, charge transfer, and subsequent desorption. In this sense, the large surface area achieved was associated with more active sites, which favored adsorption. This achievement is related to the synthesis method employed.

4. Conclusions

ZnAl2O4 was successfully synthesized by an aqueous sol-gel method using ethylenediamine as a chelating agent, microwave radiation, and subsequent calcination. The synthesis route allowed the formation of the pure crystalline phase using temperatures from 200 °C and calcination times shorter (5 h) than those employed by traditional ceramic methods. The rise in the calcination temperature (200–1000 °C) caused a slight increase in the crystal size (16–29 nm). Material’s topography consisted of a large number of bar-shaped granules (average size ~0.35 μm) made up of nano-sized particles (average size ~23 nm) and mesopores (~2–6 nm), covering a surface area of 60 m2/g. By optical response analysis, a bandgap of 3.16 eV was estimated. Electrical measurements revealed that the synthesized ZnAl2O4 is a great candidate for the sensitive layer in gas sensors. Pellets made from the material showed a high response to carbon monoxide and propane. The material’s sensitive response as a function of temperature increased homogeneously, tending to an ascending linear correlation. In contrast, as the gas concentration increased, the response increased significantly with non-linear behavior. Our material showed a more significant response (i.e., higher selectivity) to propane gas than to CO. The material’s performance was comparable or, in many cases, better than for other mixed oxides recently reported in the literature.

Author Contributions

Conceptualization, L.G.-O.; Formal analysis, L.G.-O. and O.B.-A.; Investigation, L.G.-O., V.-M.R.-B., J.A.R.O. and O.B.-A.; Methodology, L.G.-O., V.-M.R.-B. and J.A.R.O.; Resources, V.-M.R.-B. and O.B.-A.; Writing—review & editing, L.G.-O., V.-M.R.-B. and J.A.R.O. All authors have read and agreed to the published version of the manuscript.

Funding

This research received no external funding.

Institutional Review Board Statement

Not applicable.

Informed Consent Statement

Not applicable.

Data Availability Statement

The data supporting this study’s findings are available from the corresponding authors upon request.

Acknowledgments

The authors thank Mexico’s National Council of Science and Technology (CONACyT) and the University of Guadalajara for the support. Likewise, we thank Jaime Santoyo Salazar, Héctor Guillén Bonilla, Maria de la Luz Olvera Amador, Issis Claudette Romero Ibarra, Juan Reyes Gómez, and Miguel-Ángel Luna Arias for their technical assistance. This investigation was carried out following the lines of research “Nanostructured Semiconductor Oxides” of the academic group UDG-CA-895 “Nanostructured Semiconductors” of CUCEI, University of Guadalajara.

Conflicts of Interest

The authors declare no conflict of interest.

References

  1. Hee-Tae, J. The present and future or gas sensors. ACS Sens. 2022, 7, 912–913. [Google Scholar]
  2. Sun, Y.-F.; Liu, S.-B.; Meng, F.-L.; Liu, J.-Y.; Jin, Z.; Kong, L.-T.; Liu, J.-H. Metal Oxide Nanostructures and Their Gas Sensing Properties: A Review. Sensors 2012, 12, 2610–2631. [Google Scholar] [CrossRef] [PubMed]
  3. Korotcenkov, G. Metal oxides for solid-state gas sensors: What determines our choice? Mater. Sci. Eng. B 2007, 139, 1–23. [Google Scholar] [CrossRef]
  4. Kanan, S.M.; El-Kadri, O.M.; Abu-Yousef, I.A.; Kanan, M.C. Semiconducting Metal Oxide Based Sensors for Selective Gas Pollutant Detection. Sensors 2009, 9, 8158–8196. [Google Scholar] [CrossRef]
  5. Liu, X.; Cheng, S.; Liu, H.; Hu, S.; Zhang, D.; Ning, H. A Survey on Gas Sensing Technology. Sensors 2012, 12, 9635–9665. [Google Scholar] [CrossRef]
  6. Ramgir, N.S.; Yang, Y.; Zacharias, M. Nanowire-Based Sensors. Small 2010, 6, 1705–1722. [Google Scholar] [CrossRef]
  7. Wang, C.; Yin, L.; Zhang, L.; Xiang, D.; Gao, R. Metal Oxide Gas Sensors: Sensitivity and Influencing Factors. Sensors 2010, 10, 2088–2106. [Google Scholar] [CrossRef]
  8. Huang, J.; Wan, Q. Gas Sensors Based on Semiconducting Metal Oxide One-Dimensional Nanostructures. Sensors 2009, 9, 9903–9924. [Google Scholar] [CrossRef]
  9. Hoppe, M.; Lupan, O.; Postica, V.; Wolff, N.; Duppel, V.; Kienle, L.; Tiginyanu, I.; Adelung, R. ZnAl2O4-Functionalized Zinc Oxide Microstructures for Highly Selective Hydrogen Gas Sensing Applications. Phys. Status Solidi A 2018, 215, 1700772. [Google Scholar] [CrossRef]
  10. Morán-Lázaro, J.-P.; Guillén-López, E.S.; López-Urias, F.; Muñoz-Sandoval, E.; Blanco-Alonso, O.; Guillén-Bonilla, H.; Guillén-Bonilla, A.; Rodríguez-Betancourt, V.-M.; Sánchez-Tizapa, M.; Olvera-Amador, M. Synthesis of ZnMn2O4 nanoparticles by a microwave-assisted colloidal method and their evaluation as a gas sensor of propane and carbon monoxide. Sensors 2018, 18, 701. [Google Scholar] [CrossRef]
  11. Ma, P.; Li, X.; Zhang, Y.; Han, L.; Xu, Y. Hierarchical spinel-type corn-like MGa2O4 (M = Ni, Co) architectures for selective triethylamine gas sensors. Mater. Sci. Semicond. Process. 2021, 133, 105993. [Google Scholar] [CrossRef]
  12. Kapse, S.-D.; Raghuwanshi, F.-C.; Kapse, V.-D.; Patil, D.-R. Characteristics of high sensitivity ethanol gas sensors based on nanostructured spinel Zn1−xCoxAl2O4. Curr. Appl. Phys. 2012, 12, 307–312. [Google Scholar] [CrossRef]
  13. Zhang, H.; Hu, J.; Li, M.; Li, Z.; Yuan, Y.; Yang, X.; Guo, L. Highly efficient toluene gas sensor based on spinel structured hollow urchin-like core-shell ZnFe2O4 spheres. Sens. Actuators B Chem. 2021, 349, 130734. [Google Scholar] [CrossRef]
  14. Zhao, H.; Li, J.; Wang, Y.; Zhang, R.; Zou, C.; Zhou, Y. Black phosphorus nanosheets decorated multiscale zinc ferrite spheres towards swift and humidity-tolerant breath acetone sensing. IEEE Sens. J. 2022; early access. [Google Scholar] [CrossRef]
  15. Dixit, H.; Tandon, N.; Cottenier, S.; Saniz, R.; Lamoen, D.; Partoens, B. First-principles study of possible shallow donors in ZnAl2O4 spinel. Phys. Rev. B 2013, 87, 174101. [Google Scholar] [CrossRef]
  16. Singh, V.; Singh, N.; Pathak, M.S.; Dubey, V.; Singh, P.K. Annealing effects on the luminescence properties of Ce doped ZnAl2O4 produced by combustion synthesis. Optik 2018, 155, 285–291. [Google Scholar] [CrossRef]
  17. Belyaev, A.V.; Evdokimov, I.I.; Drobotenko, V.V.; Sorokin, A.A. A new approach to producing transparent ZnAl2O4 ceramics. J. Eur. Ceram. Soc. 2017, 37, 2747–2751. [Google Scholar] [CrossRef]
  18. Grabowska, H.; Mista, W.; Trawczynski, J.; Wrzyszcz, J.; Zawadzki, M. Thermal stability of platinum supported zinc aluminate combustion catalysts. J. Chem. 2001, 75, 1561–1568. [Google Scholar]
  19. Ianos, R.; Borcanescu, S.; Lazau, R. Large surface area ZnAl2O4 powders prepared by a modified combustion technique. Chem. Eng. J. 2014, 240, 260–263. [Google Scholar] [CrossRef]
  20. Cheng, B.; Ouyang, Z.; Tian, B.; Xiao, Y.; Lei, S. Porous ZnAl2O4 spinel nanorods: High sensitivity humidity sensors. Ceram. Int. 2013, 39, 7379–7386. [Google Scholar] [CrossRef]
  21. Kapse, V.D. Preparation of Nanocrystalline Spinel-type oxide Materials for Gas sensing applications. Res. J. Chem. Sci. 2015, 5, 7–12. [Google Scholar]
  22. Guan, M.Y.; Xu, D.M.; Song, Y.F.; Guo, Y. ZnO/ZnAl2O4 Prepared by Calcination of ZnAl Layered Double Hydroxides for Ethanol Sensing. Sens. Actuators B 2013, 188, 1148–1154. [Google Scholar] [CrossRef]
  23. Belyaev, A.V.; Lelet, M.I.; Kirillova, N.I.; Khamaletdinova, N.M.; Boldin, M.S.; Murashov, A.A.; Balabanov, S.S. Sol-gel synthesis and characterization of ZnAl2O4 powders for transparent ceramics. Ceram. Int. 2019, 45, 4835–4839. [Google Scholar] [CrossRef]
  24. Mekprasart, W.; Boonyarattanakalin, K.; Pecharapa, W.; Ishihara, K.N. Optical characteristics of samarium doped ZnAl2O4 nanomaterials synthesized by vibrational milling process. Mater. Today-Proc. 2018, 5, 14126–14130. [Google Scholar] [CrossRef]
  25. Stringhini, F.M.; Foletto, E.L.; Sallet, D.; Bertuol, D.A.; Chiavone-Filho, O.; do Nascimento, C.A.O. Synthesis of porous zinc aluminate spinel (ZnAl2O4) by metal-chitosan complexation method. J. Alloy Comp. 2014, 588, 305–309. [Google Scholar] [CrossRef]
  26. Gildo-Ortiz, L.; Reyes-Gómez, J.; Flores-Álvarez, J.M.; Guillén-Bonilla, H.; Olvera, M.L.; Rodríguez-Betancourtt, V.M.; Verde-Gómez, Y.; Guillén-Cervantes, A.; Santoyo-Salazar, J. Synthesis, characterization and sensitivity tests of perovskite-type LaFeO3 nanoparticles in CO and propane atmospheres. Ceram. Int. 2016, 42, 18821–18827. [Google Scholar] [CrossRef]
  27. Guillén-Bonilla, H.; Reyes-Gómez, J.; Guillén-Bonilla, A.; Pozas-Zepeda, D.; Guillén-Bonilla, J.T.; Gildo-Ortiz, L.; Flores-Martínez, M. Synthesis and characterization of MgSb2O6 trirutile-type in low presence concentrations of ethylenediamine. J. Chem. Chem. Eng. 2013, 7, 395–401. [Google Scholar]
  28. Guillén-Bonilla, A.; Rodríguez-Betancourtt, V.M.; Guillén-Bonilla, J.T.; Sánchez-Martínez, A.; Gildo-Ortiz, L.; Santoyo-Salazar, J.; Morán-Lázaro, J.P.; Guillén-Bonilla, H.; Blanco-Alonso, O. A novel CO and C3H8 sensor made of CuSb2O6 nanoparticles. Ceram. Int. 2017, 43, 13635–13644. [Google Scholar] [CrossRef]
  29. Mirzaei, A.; Neri, G. Microwave-assisted synthesis of metal oxide nanostructures for gas sensing application: A review. Sens. Actuators B Chem. 2016, 237, 749–775. [Google Scholar] [CrossRef]
  30. Regmi, G.; Rohini, M.; Reyes Figueroa, P.; Maldonado, A.; Olvera, M.L.; Velumani, S. Deposition and characterization of ultrathin intrinsic zinc oxide (i-ZnO) films by radio frequency (RF) sputtering for propane gas sensing application. J. Mater. Sci.-Mater. 2018, 29, 15682–15692. [Google Scholar] [CrossRef]
  31. Holzwarth, U.; Gibson, N. The Scherrer equation versus the ‘Debye-Scherrer equation’. Nat. Nanotechnol. 2011, 6, 534. [Google Scholar] [CrossRef] [PubMed]
  32. Ruiz-Trejo, J.E.; Santoyo-Salazar, R.; Vilchis-Morales, A.; Benítez-Rico, F.; Gómez-García, C.; Flores-Morales, J.; Chávez-Carvayar, G. Tavizón, Microstructure and electrical transport in nano-grain sized Ce0.9Gd0.1O2−δ ceramics. J. Solid. State Chem. 2007, 180, 3093–3100. [Google Scholar] [CrossRef]
  33. Wang, X.; Li, Y. Solution-based synthetic strategies for 1-D nanostructures. Inorg. Chem. 2006, 45, 7522–7534. [Google Scholar] [CrossRef]
  34. Gildo-Ortiz, L.; Guillén-Bonilla, H.; Rodríguez-Betancourtt, V.M.; Blanco-Alonso, O.; Guillén-Bonilla, A.; Santoyo-Salazar, J.; Romero-Ibarra, I.C.; Reyes-Gómez, J. Key processing of porous and fibrous LaCoO3 nanostructures for successful CO and propane sensing. Ceram. Int. 2018, 44, 15402–15410. [Google Scholar] [CrossRef]
  35. Deng, Z.X.; Wang, C.; Sun, X.M.; Li, Y.D. Structure-directing coordination template effect of ethylenediamine in formations of ZnS and ZnSe nanocrystallites via solvothermal route. Inorg. Chem. 2002, 41, 869–873. [Google Scholar] [CrossRef] [PubMed]
  36. LaMer, V.K.; Dinegar, R.H. heory, Production and Mechanism of Formation of Monodispersed Hydrosols. J. Am. Chem. Soc. 1950, 72, 4847–4854. [Google Scholar] [CrossRef]
  37. Gharibshahi, L.; Saion, E.; Gharibshahi, E.; Shaari, A.H.; Matori, K.A. Structural and Optical Properties of Ag Nanoparticles Synthesized by Thermal Treatment Method. Materials 2017, 10, 402. [Google Scholar] [CrossRef]
  38. Bystrov, V.S.; Piccirillo, C.; Tobaldi, D.M.; Castro, P.M.L.; Coutinho, J.; Kopyl, S.; Pullar, R.C. Oxygen vacancies, the optical band gap (Eg) and photocatalysis of hydroxyapatite: Comparing modelling with measured data. Appl. Catal. B Environ. 2016, 196, 100–107. [Google Scholar] [CrossRef]
  39. Wang, S.-F.; Sun, G.-Z.; Fang, L.-M.; Lei, L.; Xiang, X.; Zu, X.-T. A comparative study of ZnAl2O4 nanoparticles synthesized from different aluminum salts for use as fluorescence materials. Sci. Rep. 2015, 5, 12849. [Google Scholar] [CrossRef] [PubMed]
  40. Yuan, Z.; Li, R.; Meng, F.; Zhang, J.; Zuo, K.; Han, E. Approaches to Enhancing Gas Sensing Properties: A Review. Sensors 2019, 19, 1495. [Google Scholar] [CrossRef]
  41. Wu, K.; Li, J.; Zhang, C. Zinc ferrite based gas sensors: A review. Ceram. Int. 2019, 45, 11143–11157. [Google Scholar] [CrossRef]
  42. Dey, A. Semiconductor metal oxide gas sensors: A review. Mater. Sci. Eng. B 2018, 229, 206–217. [Google Scholar] [CrossRef]
  43. Eranna, G.; Joshi, B.C.; Runthala, D.P.; Gupta, R.P. Oxide Materials for Development of Integrated Gas Sensors—A Comprehensive Review. Crit. Rev. Solid State 2004, 29, 111–188. [Google Scholar] [CrossRef]
  44. Jayaraman, V.K.; Maldonado, A.; Olvera, M.L. A simple and cost-effective zinc oxide thin film sensor for propane gas detection. Mater. Lett. 2015, 157, 169–171. [Google Scholar] [CrossRef]
  45. Guillén-Bonilla, H.; Gildo-Ortiz, L.; Olvera-Amador, M.L.; Santoyo-Salazar, J.; Rodríguez-Betancourtt, V.M.; Guillén-Bonilla, A.; Reyes-Gómez, J. Sensitivity of mesoporous CoSb2O6 nanoparticles to gaseous CO and C3H8 at low temperatures. J. Nanomater. 2015, 2015, 308465. [Google Scholar] [CrossRef]
  46. Guillén-Bonilla, H.; Rodríguez-Betancourtt, V.M.; Guillén Bonilla, J.T.; Reyes-Gómez, J.; Gildo-Ortiz, L.; Flores-Martínez, M.; Olvera-Amador, M.L.; Santoyo-Salazar, J. CO and C3H8 sensitivity behavior of zinc antimonate prepared by a microwave-assisted solution method. J. Nanomater. 2015, 2015, 979543. [Google Scholar] [CrossRef]
  47. Gildo-Ortiz, L.; Guillén-Bonilla, H.; Reyes-Gómez, J.; Rodríguez-Betancourtt, V.M.; Olvera-Amador, M.L.; Eguía-Eguía, S.I.; Guillén-Bonilla, A.; Santoyo-Salazar, J. Facile synthesis, microstructure, and gas sensing properties of NdCoO3 nanoparticles. J. Nanomater. 2017, 2017, 8174987. [Google Scholar] [CrossRef]
  48. Guillén-Bonilla, H.; Rodríguez-Betancourtt, V.M.; Guillen-Bonilla, J.T.; Gildo-Ortiz, L.; Guillen-Bonilla, A.; Casallas-Moreno, Y.L.; Blanco-Alonso, O.; Reyes-Gómez, J. Sensitivity Tests of Pellets Made from Manganese Antimonate Nanoparticles in Carbon Monoxide and Propane Atmospheres. Sensors 2018, 18, 2299. [Google Scholar] [CrossRef]
  49. Gildo-Ortiz, L.; Rodríguez-Betancourtt, V.M.; Blanco-Alonso, O.; Guillén-Bonilla, A.; Guillén-Bonilla, J.T.; Guillén-Cervantes, A.; Santoyo-Salazar, J.; Guillén-Bonilla, H. A simple route for the preparation of nanostructured GdCoO3 via the solution method, as well as its characterization and its response to certain gases. Results Phys. 2019, 12, 475–483. [Google Scholar] [CrossRef]
  50. Bochenkov, V.E.; Sergeev, G.B. Preparation and chemiresistive properties of nanostructured materials. Adv. Colloid Interface Sci. 2005, 116, 245–254. [Google Scholar] [CrossRef]
Figure 1. Schematic of the nanostructured ZnAl2O4′s synthesis through the aqueous sol-gel route for gas sensing applications.
Chemosensors 11 00105 g001
Figure 2. Experimental set-up for sensitivity tests in controlled atmospheres and temperatures. An illustration of the ZnAl2O4 pellets fabrication is depicted in the right corner.
Chemosensors 11 00105 g002
Figure 3. X-ray diffraction patterns of ZnAl2O4 powders synthesized at 200–1000 °C.
Chemosensors 11 00105 g003
Figure 4. Crystallite size as a function of the ZnAl2O4 powders’ calcination temperature.
Chemosensors 11 00105 g004
Figure 5. Typical SEM micrographs of ZnAl2O4 powders obtained at temperatures: (a) 200, (b) 300, (c) 400, (d) 500, (e) 600, (f) 700, (g) 800, (h) 900, and (i) 1000 °C.
Chemosensors 11 00105 g005
Figure 6. SEM micrographs of the ZnAl2O4 synthesized at 700 °C at different magnifications: (a) 2300×, (b) 11,000×, and (c) 23,000×; the granule size distribution is shown in (d).
Chemosensors 11 00105 g006
Figure 7. Typical EDS-SEM spectrum of the ZnAl2O4 powders synthesized at 700 °C.
Chemosensors 11 00105 g007
Figure 8. TEM analysis of the ZnAl2O4 synthesized at 700 °C: (a,b) nanoparticles with mesopores, (c) particle size distribution, (d,e) HRTEM images, (f) electron diffraction pattern and its correspondence with XRD.
Chemosensors 11 00105 g008
Figure 9. Nitrogen adsorption–desorption isotherm from the ZnAl2O4 powders synthesized at 700 °C.
Chemosensors 11 00105 g009
Figure 10. Optical absorption spectrum of the ZnAl2O4 powders synthesized at 700 °C. The inset shows the curve (αhv)2 versus hv.
Chemosensors 11 00105 g010
Figure 11. Response of ZnAl2O4 pellets as a function of operating temperature and concentration: (a,b) CO, (c,d) propane.
Chemosensors 11 00105 g011
Figure 12. Curve fitting using linear and nonlinear regression of ZnAl2O4’s response in propane and CO as a function of: (a,b) temperature, (c,d) gas concentration.
Chemosensors 11 00105 g012
Figure 13. Comparison of the response to 300 ppm of CO and 300 ppm of propane at 100, 200, and 300 °C.
Chemosensors 11 00105 g013
Figure 14. Simple structural model of the reaction mechanism upon exposure to gas.
Chemosensors 11 00105 g014
Figure 15. Variation in electrical resistivity (ρ) of the ZnAl2O4 pellets as a function of (a) CO concentration, (b) propane concentration, (c) CO temperature, and (d) propane temperature.
Chemosensors 11 00105 g015
Table 1. Structural data of ZnAl2O4 with a cubic crystal structure.
Peak2 (°)d (Å)λ2/4a2Plane (hkl)a (Å)
131.42.90.009152208.05
236.82.40.009153118.05
344.82.00.009134008.06
449.21.90.009123318.06
555.71.70.009124228.06
659.61.60.009125118.06
765.31.40.009124408.06
Table 2. Comparison of synthesis methods for the ZnAl2O4 spinel.
MaterialMethodT (°C)Time (h)MicrostructureReference
Ce:ZnAl2O4Solution combustion8002Microparticles[16]
ZnAl2O4Sol–gel and pressing750–16001–3Micrograins[17]
ZnAl2O4Co-precipitation9003Nanorods[20]
ZnAl2O4Citrated sol-gel7005Not reported[21]
ZnO/ZnAl2O4Calcinations600–10005Microblocks[22]
ZnAl2O4Sol–gel700–9002Microparticles[23]
Sm:ZnAl2O4Ball milling12006Not reported[24]
ZnAl2O4Complexation500–9004Nanocrystals[25]
ZnAl2O4Aqueous sol-gelFrom 2005NanocrystalsThis work
Table 3. Gas sensitivity (S) of several materials.
MaterialParticle SizeCarbon MonoxidePropaneReference
SC (ppm)T (°C)SC (ppm)T (°C)
LaFeO39–54 nm1720035031.4300350[26]
LaCoO318–150 nm5.520035029.2300350[34]
CoSb2O670–150 nm72003504.8300350[45]
ZnSb2O6Microrods6.73002501.3300250[46]
NdCoO317–151 nm7.230030094.1300300[47]
MnSb2O610–60 nm93003000.5500300[48]
GdCoO385–130 nm330030014.6300300[49]
ZnAl2O411–35 nm730030082300300This work
Disclaimer/Publisher’s Note: The statements, opinions and data contained in all publications are solely those of the individual author(s) and contributor(s) and not of MDPI and/or the editor(s). MDPI and/or the editor(s) disclaim responsibility for any injury to people or property resulting from any ideas, methods, instructions or products referred to in the content.

