1. Introduction
In recent years, the assessment of global water quality, namely, the heavy metal pollution of water, has been the subject of intense research [
1]. Metal ions are some of the most abundant water contaminants, which can cause several risks to human health. A high intake of metal ions such as iron, nickel, cobalt, copper, and manganese can cause some adverse health effects [
2]. In the case of iron, high levels are associated with an increased risk of cancer, heart disease, and other illnesses (endocrine problems, diabetes, and liver diseases) [
3]. Additionally, an excess of iron in the environment also produces negative effects that damage aquatic ecosystems [
4].
Water monitoring is predominantly based on manual sampling, followed by laboratory analysis. The iron content in water samples is usually determined by analytical techniques such as atomic absorption spectrometry (AAS), inductively coupled plasma (ICP), liquid chromatography, electrochemistry, and spectrofluorometric and flow-based techniques. These techniques not only offer a high analytical performance, namely, high sensitivity, accuracy, and precision but also present several limitations, such as the expensive maintenance costs, the amount of time consumed, the need for sophisticated instrumentation, and the requirement of trained operators [
5]. All these limitations represent a significant cost for analysis and laboratory dependency. To overcome these limitations, according to the World Health Organization (WHO), new devices are needed to ensure certain characteristics, namely, “affordable, performing fast and robust analysis, easy to use and using non-specific equipment” [
6]. Thus, the development of microflow analysis systems has grown, and research has focused on employing these techniques as an alternative to some conventional analytical approaches, to improve bioanalysis and environmental analysis [
7].
In this scenario, microfluidic paper-based analytical devices (μPAD) were recently introduced as an alternative approach for monitoring metal ions in the environment [
8]. These paper devices present advantages such as providing a simple and low-cost analysis, and, because of their portability, these paper devices allow for in situ analysis [
9,
10,
11]. Moreover, the μPAD approach also represents a downscaling of the analytical procedure, which enables lower reagent consumption and minimised waste production, since the paper devices can be disposed of by incineration [
12,
13,
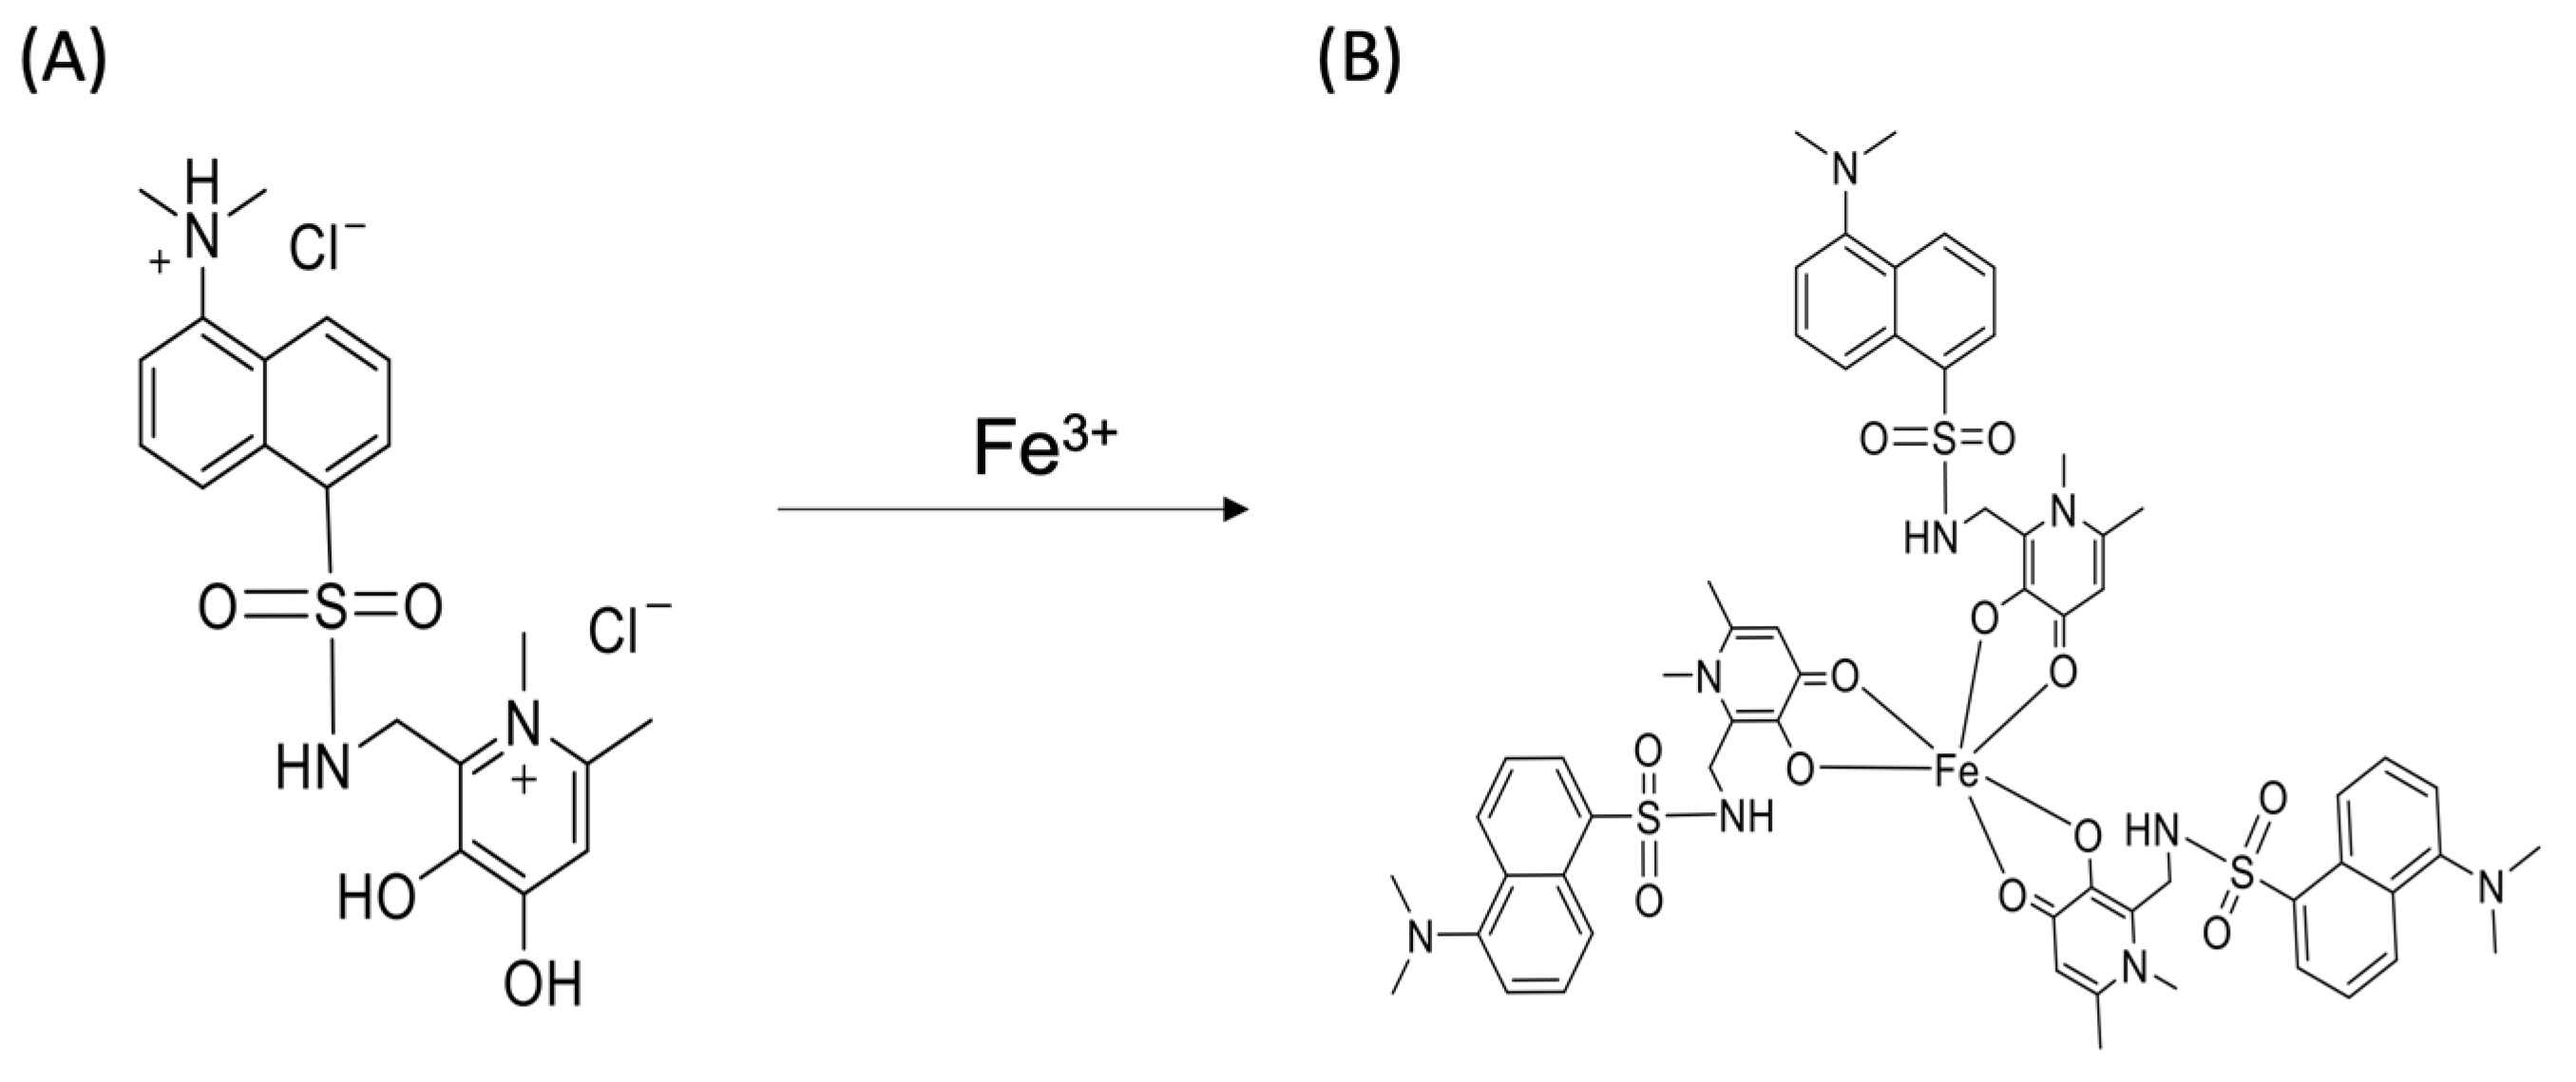
14]. The new analytical devices should also provide an environmentally friendly analysis and contribute to green chemistry, by using reagents that have a lower toxicity. So, in this work, a recently described low-toxicity iron ligand was used, the D-3,4-HPO ligand (
Figure 1A) [
15]. In recent years, 3-hydroxy-4-pyridinone chelators (3,4-HPO) have been used, due to their versatile chemistry, for potential biomedical and environmental applications [
16,
17,
18]. The chosen naphthalene-3-hydroxy-4-pyridione (D-3,4-HPO) ligand was specially designed to be water-soluble and to have a high affinity for complexing iron with a stoichiometric ligand:metal ratio of 3:1 (
Figure 1B).
In this work, the development of a μPAD for on-hand, in situ iron determination in natural water samples is described. This μPAD uses the compound D-3,4-HPO as a colour reagent, to form strongly coloured complexes with iron, and a digital scanner for imaging acquisition. The proposed method proved to be highly effective when applied to natural waters, considering that the results were statistically comparable to reference values and the results of ICP analysis.
2. Materials and Methods
2.1. Reagents and Solutions
All solutions were prepared with analytical grade chemicals and Milli-Q water (resistivity > 18 MΩ cm, Millipore, Bedford, MA, USA).
The reagent solution of D-3,4-HPO ligand was prepared daily by dissolving approximately 4 mg of the solid in 2 mL of water, to a final concentration of 2 g/L.
The hydrogen carbonate buffer solution at pH 9 was prepared by dissolving 3.4 g of sodium hydrogen carbonate (Merck, Darmstadt, Germany) in 50 mL of water, to obtain a final concentration of 0.82 mol/L.
An iron standard stock solution of 100 mg/L was prepared from dilution of the atomic absorption commercial standard of 1000 mg/L (Iron Standard for AAS, Fluka, Switzerland). From this solution, an intermediate standard solution of 10 mg/L was made, in 0.01 M of nitric acid, to prepare the working standards within the range of 0.25–2.00 mg/L. Two sets of standards were used one set prepared in water and one set prepared in artificial seawater.
Artificial seawater was prepared according to Kester et al. (1967) [
1]. This artificial seawater solution was composed of 23.9 g/kg of NaCl (Merck, Darmstadt, Germany), 4.01 g/kg of Na
2SO
4 (Merck, Darmstadt, Germany), 0.677 g/kg of KCl (Merck, Darmstadt, Germany), 0.196 g/kg of NaHCO
3 (Merck, Darmstadt, Germany), 98.0 mg/kg of KBr (Merck, Darmstadt, Germany), 26.0 mg/kg of H
3BO
3 (Aldrich, Polk County, MO, USA), 3.00 mg/kg of NaF (Merck, Darmstadt, Germany), 53.3 mmol/kg of MgCl
2.6 H
2O (Merck, Darmstadt, Germany), 10.2 mmol/kg of CaCl
2.2H
2O (Merck, Darmstadt, Germany), and 0.010 mmol/kg of SrCl
2 (Sigma-Aldrich, St. Louis, MO, USA).
2.2. μPAD Assembly
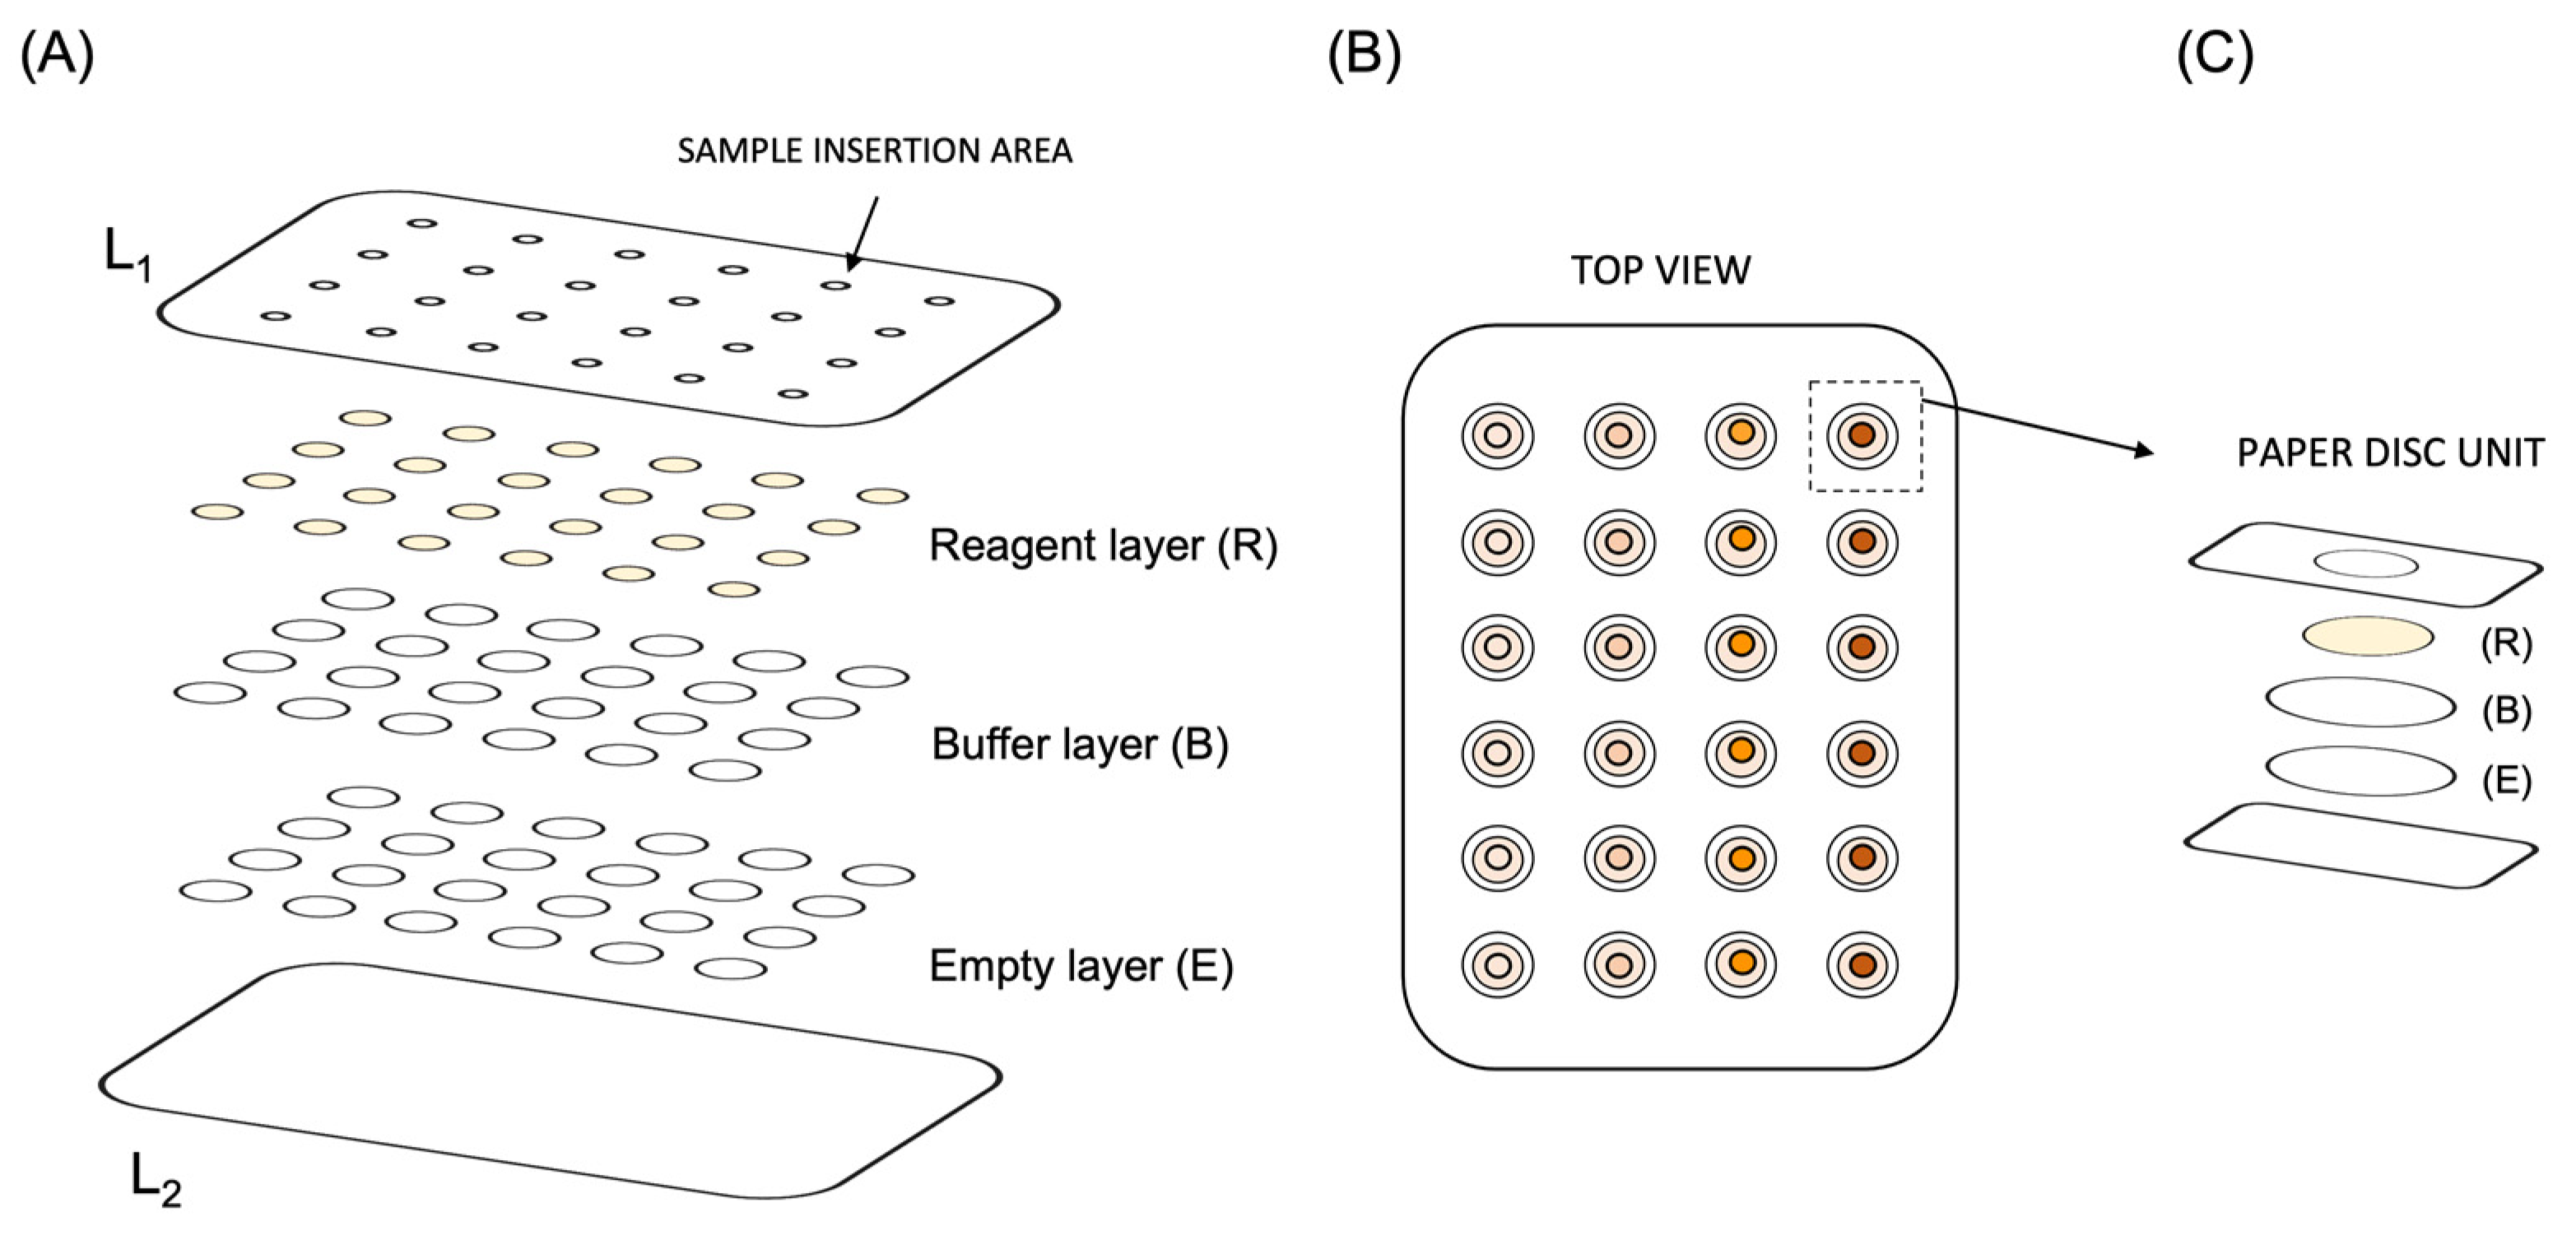
The developed μPAD was composed of three layers of filter paper discs aligned in 24 paper discs units (
Figure 2A). The paper units corresponding to the hydrophilic zone of the μPAD were distributed in a 6-column and 4-row arrangement, inside a plastic laminating pouch (Q-connect, 75 × 110 nm, glossy, 125 micron) that, after lamination, established the hydrophobic zone (
Figure 2B).
Each paper unit of the μPAD consisted of the top layer (R), a 6.35 mm diameter filter paper disc (Whatman 4) containing the reagent solution; the middle layer (B) a 9.5 mm diameter filter paper (Whatman 1) containing the buffer solution; and a bottom layer (E) a 9.5 mm diameter empty filter paper (Whatman 3).
The three paper discs comprising each layer were stacked to ensure layer overlap (
Figure 2C). Then, the 24 paper units were manually placed between the two sheets of the laminating pouch, aligned with the sample hole (3 mm) of the top laminating pouch (L1).
The μPAD assembly was completed with a lamination process (United Office–ULG 300 B1), creating physical separation between the hydrophilic area (paper units) and the hydrophobic zone (laminating pouches, L1 and L2).
The reagent paper discs were prepared by loading 12 μL of ligand solution and were placed to dry in the oven at 50 °C for 20 min. The buffer paper discs were prepared by loading 10 μL of hydrogen carbonate solution in each disc and were placed in the oven for 10 min at 50 °C.
2.3. Iron Measurement Procedure
After μPAD assembly, 25 μL of standard/sample was loaded into the sampling hole, which took approximately 5 min to absorb. The reaction between the D-3,4-HPO ligand and iron forms an orange complex in the top layer (R), which becomes the detection zone. The colour of the reaction became more intense with increasing iron concentration, with a linear correlation.
Ten minutes after loading the standard/sample, the μPAD detection zone (top view) was scanned using a flatbed scanner (Canon LIDE 120) for imaging acquisition. These images were processed using ImageJ software to acquire the intensity readings. As the coloured product that formed was orange, the highest intensity of the μPAD detection area was obtained using a blue filter from the RGB format. For each paper unit, the measurement area was set to the μPAD sample hole (3 mm = 90 × 90 pixels), and the intensity values were converted into absorbance values using Equation (1)
, where
I0 is the intensity of the blank signal, and
Is is the intensity of the standard/sample signal. The calculated absorbance values for each iron standard concentration (corresponding to an average of 4 readings) correlated to a linear regression, establishing a calibration curve that was used to interpolate the readings from water samples.
2.4. Sample Collection
The water samples (tap water, well water, river water, and seawater) were collected in plastic bottles with 500 mL capacity, acidified with 0.01 M nitric acid (pH = 2), and kept refrigerated until used. The samples were directly applied in the developed µPAD, with no other treatments.
The physical–chemical parameters of the water samples used in the accuracy assessment studies were listed, namely, pH, salinity, and conductivity (
Table S1).
2.5. Reference Procedure–µPAD Validation
To assess the accuracy of the developed device for iron determination, five river water samples were analysed with the developed μPAD method and by using inductively coupled plasma (ICP) as the reference procedure for metal ions’ determination in water samples [
2].
3. Results and Discussion
The studies performed to optimise the µPAD method were made by comparing the slope of the calibration curves obtained using iron standard solutions within the concentration range of 0.25–2.00 mg/L.
3.1. Preliminary Studies
The developed work aimed to quantify the iron in water samples using the reaction between the 3-hydroxy-pyridinone ligand with iron (III). Since this was the first time that the D-3,4-HPO ligand was used as a colour reagent, several physical and chemical parameters were studied. All the studies were carried out by establishing calibration curves and comparing the calibration curve slopes, an indicator of the method’s sensitivity. Leite et al. [
15] described the synthesis and characterisation of the D-3,4-HPO ligand, and the ligand is in its neutral form when in the pH range between 4 and 9. Since the water samples were acidified (to pH ≈ 2, [
19]), the influence of pH on the calibration curve slope was assessed at different pH values (between pH < 2 to 9) (
Figure S1). It was possible to conclude that the sensitivity (calibration curve slope) was higher when the standard solutions were at pH > 4, as expected from the previous reported studies [
15]. Thus, two buffer solutions composition were tested, namely, borate and hydrogen carbonate buffer solution (at pH 9) (
Figure S2). The results showed that the hydrogen carbonate buffer resulted in an increase in sensitivity (the calibration curve slope was 71% higher), so it was set as the buffer solution.
The absorption spectra of the complex formation between the D-3,4-HPO ligand and iron(III) showed that, at 460 nm, the ligand:metal ion ratio is 3:1 (
Figure S3) and forms an orange complex. The interaction between D-3,4-HPO and the two iron oxidation states was also evaluated; iron (II) and iron (III) standard solutions were prepared within the same concentration range, and the calibration curves were established (
Figure S4). It was possible to conclude that the ligand reacts with both iron forms (slope deviation < 10%).
Paper Approach
Having established the need for a buffer solution, the first paper-based approach for the reaction was performed by using two layers of paper: one layer for the coloured reagent and one for the buffer solution. Both layers were composed of Whatman 1 filter paper discs with a 9.5 mm diameter. Two alternatives for the μPAD assembly were studied: the reagent in the top layer and the reagent in the bottom layer. The calibration curve slope of both alternatives was compared, and the μPAD with the reagent in the top layer showed approximately twice the sensitivity.
The following studies were carried out with a basic structure of the μPAD (two layers of paper discs): the D-3,4-HPO solution in the top layer and the buffer solution in the bottom layer.
3.2. μPAD Physical Parameters
3.2.1. Filter Paper Disc Size
The first physical parameter to be studied was the size of the reagent paper discs. The idea was to increase the colour intensity in the detection zone by reducing the area of the paper discs. To carry out this study, two filter paper discs diameters were tested: 9.5 and 6.35 mm. By having different sizes, the paper discs also presented different loading volume capacities. So 15 and 10 μL of the reagent (corresponding to the maximum capacity of each paper disc) were used for the 9.5 and 6.35 mm diameter paper discs, respectively. The paper disc with the 6.35 mm diameter was chosen because it resulted in a 52% increase in sensitivity. Consequently, by using the smallest paper disc diameter, the developed device enabled a lower reagent consumption.
3.2.2. Filter Paper Type
The type of filter paper, different paper treatments, and paper porosity of the reagent layer (R in
Figure 2A) were tested to obtain the highest sensitivity.
Different types of filter paper were used: qualitative (Whatman 5), ashless (Whatman 42), hardened low ash (Whatman 50), and hardened ashless (Whatman 542). The results proved that the more complete treatment (Whatman 542) resulted in the highest sensitivity for the calibration curve slope (
Figure 3A).
As for the porosity study, filter papers with different pore sizes of 2.5 µm (Whatman 5), 11 µm (Whatman 1), and 20–25 µm (Whatman 4) were tested (
Figure 3B). By comparing the calibration curve slopes, the paper with the highest porosity (Whatman 4) showed the highest sensitivity. Overall, the results showed that the sensitivity was higher when the paper discs had more treatment and a higher porosity, so a filter paper combining the two (hardened ashless paper with 20–25 µm: Whatman 541) was also tested (
Figure S5). Surprisingly, the calibration curve slope obtained did not show a significant difference in sensitivity compared to the Whatman 4 filter paper (slope deviation < 10%). So, the Whatman 4 filter paper was chosen as a more economical choice.
For the buffer layer (B layer in
Figure 2), different filter paper types and porosities were not tested, since this layer was after the reaction layer. So the Whatman 1 qualitative filter paper with an 11 µm pore size was used as the most economical choice.
All the filter papers used in this work and their main characteristics, namely, type, particle retention, and thickness, are presented in
Table S2.
3.2.3. μPAD Sample Hole
Another physical parameter that was studied was the influence of the sample hole diameter on the top layer laminating pouch, which can affect the standard/sample absorption flow rate and consequently the coloured product’s formation. For this study, different hole diameters were tested, namely, 2, 3, and 4 mm. As expected, the wider the hole size was, the less time it took to absorb the loaded standard/sample volume, 25, 20, and 15 min, respectively. According to the obtained results, there were no significant differences between the hole sizes of 3 and 4 mm (slope deviation < 10%).
For the sample hole with a 2 mm diameter, a slope decrease of 33% was observed. So to minimise the potential contamination of the sample area after sample loading, the diameter that was chosen was 3 mm.
3.3. Ligand (D-3,4-HPO) Concentration
The concentration of the D-3,4-HPO ligand was studied within the range 0.2–2.5 g/L to ensure there was reagent excess, by considering a ligand:metal ratio of 3:1 (
Figure 4A). The calibration curves obtained showed that by increasing the ligand concentration, the sensitivity also increased. However, from 2.0 g/L to 2.5 g/L, the increase was not significant (slope deviation < 10%). So 2 g/L was the concentration that was chosen, as a compromise between sensitivity increase and reagent consumption.
3.4. Sample Volume
Since water samples are expected to have a low content of iron, it was important to study the maximum sample volume to be loaded, aiming for the lowest limit of detection possible. However, for the μPAD that was designed with two layers of paper discs, a maximum of 25 μL for the standard/sample volume was possible to load into the μPAD, which still took approximately 40 min to be absorb. In this context, it was not possible to increase the sample volume, as the drying time was already higher than intended for an “at-the-moment” analytical device. So to test higher sample volumes, a new layer of paper discs was added after the buffer layer.
3.5. Stability Assessment
Some of the main advantages of paper-based devices are the portability and the possibility of an in situ analysis. So stability studies were also performed, not only to evaluate the stability of the coloured product formed after the sample loading (the stability of the reaction’s colour product) but also to assess the storage stability of the µPAD before it was used (the stability of the µPAD).
3.5.1. Stability of the Reaction Colour Product
It is important to assess the time interval between the sample loading and μPAD scanning as, in a field application, the sample scanning time can be different from what is recommended. A calibration curve was prepared, and the μPAD detection zone (the coloured product that formed) was scanned at different time intervals, from 10 min to 5 h (
Figure 5A). The calibration curve slopes obtained from the different scanning times were compared, and no significant differences were observed up to 60 min (slope deviation < 10%). Therefore, the sensitivity of the iron determination was stable if the detection zone reading took up to 60 min.
3.5.2. μPAD Stability
To test the stability of the developed μPAD, several μPADs were prepared and stored at room temperature (≈21 °C), protected from light (covered with aluminium foil), and in a vacuum atmospheric condition (closed in sealed plastic bags). Different time periods were tested, ranging from 24 h to 2 months. For each storage period, the stored μPAD was used to perform a calibration curve and compared to the calibration curve of a freshly assembled device prepared with the same set of iron standards (
Figure 5B).
The calibration curve slopes (sensitivity) obtained from different storage periods were compared, and it was possible to conclude that a similar sensitivity was observed for up to 1 month (slope deviation < 10%). Although there were no significant differences in sensitivity for up to 2 months of storage, it was not possible to maintain the linearity (R2 < 0.99) for the tested concentration range. In fact, to maintain linearity, the concentration range was from 0.50 to 1.50 mg/L.
3.6. Interference Assessment
According to previous studies [
3], the D-3,4-HPO ligand used in this work can also react with other metal ions at a minor extension. Therefore, it was important to assess the potential interference of some bivalent cations that can be present in the water samples. For this study, several iron standard solutions were prepared with 0.75 mg/L of iron and different concentrations of the potentially interfering metal ion. The tested concentrations were based on legislation limits from the United Nations Food and Agriculture Organization (UNFAO) [
4], and the solutions of the tested cations were obtained from the dilution of the atomic absorption standards. The absorbance values of the standard with (A
Fe&Interf) and without (A
Fe) the potential interfering metal ion were used to calculate the interference percentage (I%): I% = [(A
Fe&Interf − A
Fe)/(A
Fe)] (
Table 1).
No significant interferences (I% < 5%) were observed for almost all the tested metal ions at the expected concentrations in the water samples. An exception was observed for magnesium, for which a 5.0 mg/L concentration resulted in an interference percentage of −35%. To assess the maximum magnesium concentration that could be present in the water samples without interfering in the iron determination, several standard solutions with 0.75 mg/L of iron and different magnesium concentrations in the range of 0–5 mg/L were prepared, and the interference percentages were calculated (
Figure S6). The results showed that 1 mg/L of magnesium did not interfere in iron quantification (I% < 5%), which corresponded to the maximum concentration without interference.
3.7. Accuracy Assessment
3.7.1. Certified Samples and Reference Method Measurements
For the accuracy assessment, several (#5) certified water samples were analysed with the developed μPAD, and the obtained iron concentration was compared to the certified value (
Table 2). Additionally, the μPAD was also used to quantify the total iron in the different types of water samples (#5), and the obtained results were compared with the ones obtained by the reference procedure and the ICP measurements (
Table 2).
A linear relationship was established (
Figure S7) between the proposed μPAD ([Fe]
μPAD) and the reference water samples and ICP results ([Fe]
CV/ICP), and the following equation was obtained: [Fe]
μPAD = 1.02 (± 0.06) × [Fe]
CV/ICP − 0.014 (± 0.056), where the values in parentheses represent the 95% interval. The linear correlation proved that there were no statistical differences between the two methods, as the slope and the intercept were not statistically different from 1 and 0, respectively. So it was possible to conclude that the two sets of results were not statistically different, and the proposed paper-based device can be considered accurate.
3.7.2. Recovery Studies
One of the main objectives of this work was to develop an analysis method that would allow for testing different types of water samples: not only tap water and river water but also seawater. By considering the observed magnesium interference for values above 1 mg/L for the analysis of seawater, the calibration curve was obtained using the iron standards prepared in synthetic seawater. Then, recovery studies were performed for different types of water (tap water, well water, and seawater). The water samples were spiked with the atomic absorption iron standard (100 mg/L), to final concentrations of 0.33, 0.75 and 1.33 mg/L, respectively. The recovery percentages were calculated according to the International Union of Pure and Applied Chemistry (IUPAC) recommendations [
20], and the results are shown in
Table 3.
The overall average was 100.3%, with a relative standard deviation of 4.2%, and a statistical test (t-test) was used to evaluate if the mean recovery value was significantly different from 100%. With a 95% significant level, the calculated t-value was 0.236, with a correspondent critical value of 2.752. Therefore, the statistical t-test indicated the absence of multiplicative matrix interferences, and the applicability of the developed device to different types of water samples was proven.
3.8. Analytical Features of the Developed μPAD
The analytical performance of the newly developed paper-based device for iron quantification in water under optimal conditions is presented in
Table 4.
The minimum detectable value (MDV) and the limit of quantification (LOQ) were calculated, according to the IUPAC recommendations [
21], as 3 and 10 times, respectively, the standard deviation of the intercept (n = 4) divided by the calibration curve slope average. The μPAD reproducibility was assessed by calculating the relative standard deviation (RSD) of the two standards with 12 measurements for each, on 2 different days and from 2 different devices on each day (
Table 4).
Within the same device, the RSD was below 5%, as calculated from the standard deviations shown for the iron standards in
Figure S8.
Additionally, the RSD of the slope was also calculated, as obtained from four calibration curves on the same day (intraday RSD) and from four calibration curves on consecutive days (interday RSD), which were 2% and 4%, respectively. The reagent consumption was calculated based upon the total volume of all reagent solutions in the 24 paper discs of one μPAD: 0.058 mg of D-3,4-HPO and 1.20 mg of hydrogen carbonate. The sample consumption was calculated per determination as 100 μL, by considering four paper units per determination and 25 μL of the sample per paper unit.
4. Conclusions
In this work, a new paper-based device was successfully developed for iron determination in several types of water samples, namely tap water, river water, and seawater. This μPAD was shown to be effective, disposable, and portable and provided rapid on-hand measurements. The described method enables iron quantification using a water-soluble 3-hydroxy-4-pyridinone (D-3,4-HPO) as a chromogenic colour reagent. The D-3,4-HPO ligand proved to have a high affinity and specificity for iron, as no significant interferences were observed in the presence of the other ions commonly present in fresh water (<5%), except for the presence of magnesium (above 1 mg/L). However, an alternative was found to avoid the Mg interference and allow the developed method to be applied to seawater samples (the presence of magnesium). The developed μPAD enabled a dynamic concentration range of 0.25 to 2.00 mg/L for iron, with a minimum detectable value of 0.07 mg/L, and was stable (after being assembled) for 1 month, if stored in vacuum conditions. After loading the sample, the coloured product formed can be scanned for up to 60 min. Furthermore, the μPAD was shown to be suitable for on-site analysis and point-of-care testing (POCT) due to its simplicity, and it does not require trained operators or specialised laboratory equipment. For these reasons, the developed device can be an excellent alternative for monitoring water quality, especially for less-industrialised areas or developing countries where the analytical infrastructures are limited. The image acquisition of the μPAD was attained with a conventional (computer-connected) scanner and with a hand-sized battery-powered scanner. Since no significant differences in sensitivity (the calibration curve slope) were observed (slope deviation < 10%), it is possible to conclude that the scanner does not interfere in the determination. As far as we know, this is the first article describing a POCT test for iron determination in natural water, including seawater samples, with a minimum detectable value of below 10 ug/L.

 ,
, 


