

New Applications of Gas Chromatography and Gas Chromatography-Mass Spectrometry for Novel Sample Matrices in the Forensic Sciences: A Literature Review

Abstract
:1. Introduction
2. Methods
3. Alternative Sample Matrixes
3.1. Sweat and Skin
3.2. Cerumen
3.3. Meconium
3.4. Breast Milk
3.5. Larvae, Pupae and Insects
3.6. Vitreous Humour
3.7. Drug Paraphernalia
3.8. Detection of Cosmetics and Fragrances for Forensic Applications
3.9. Air, Gases and Vapours
3.10. Cannabis Smoke
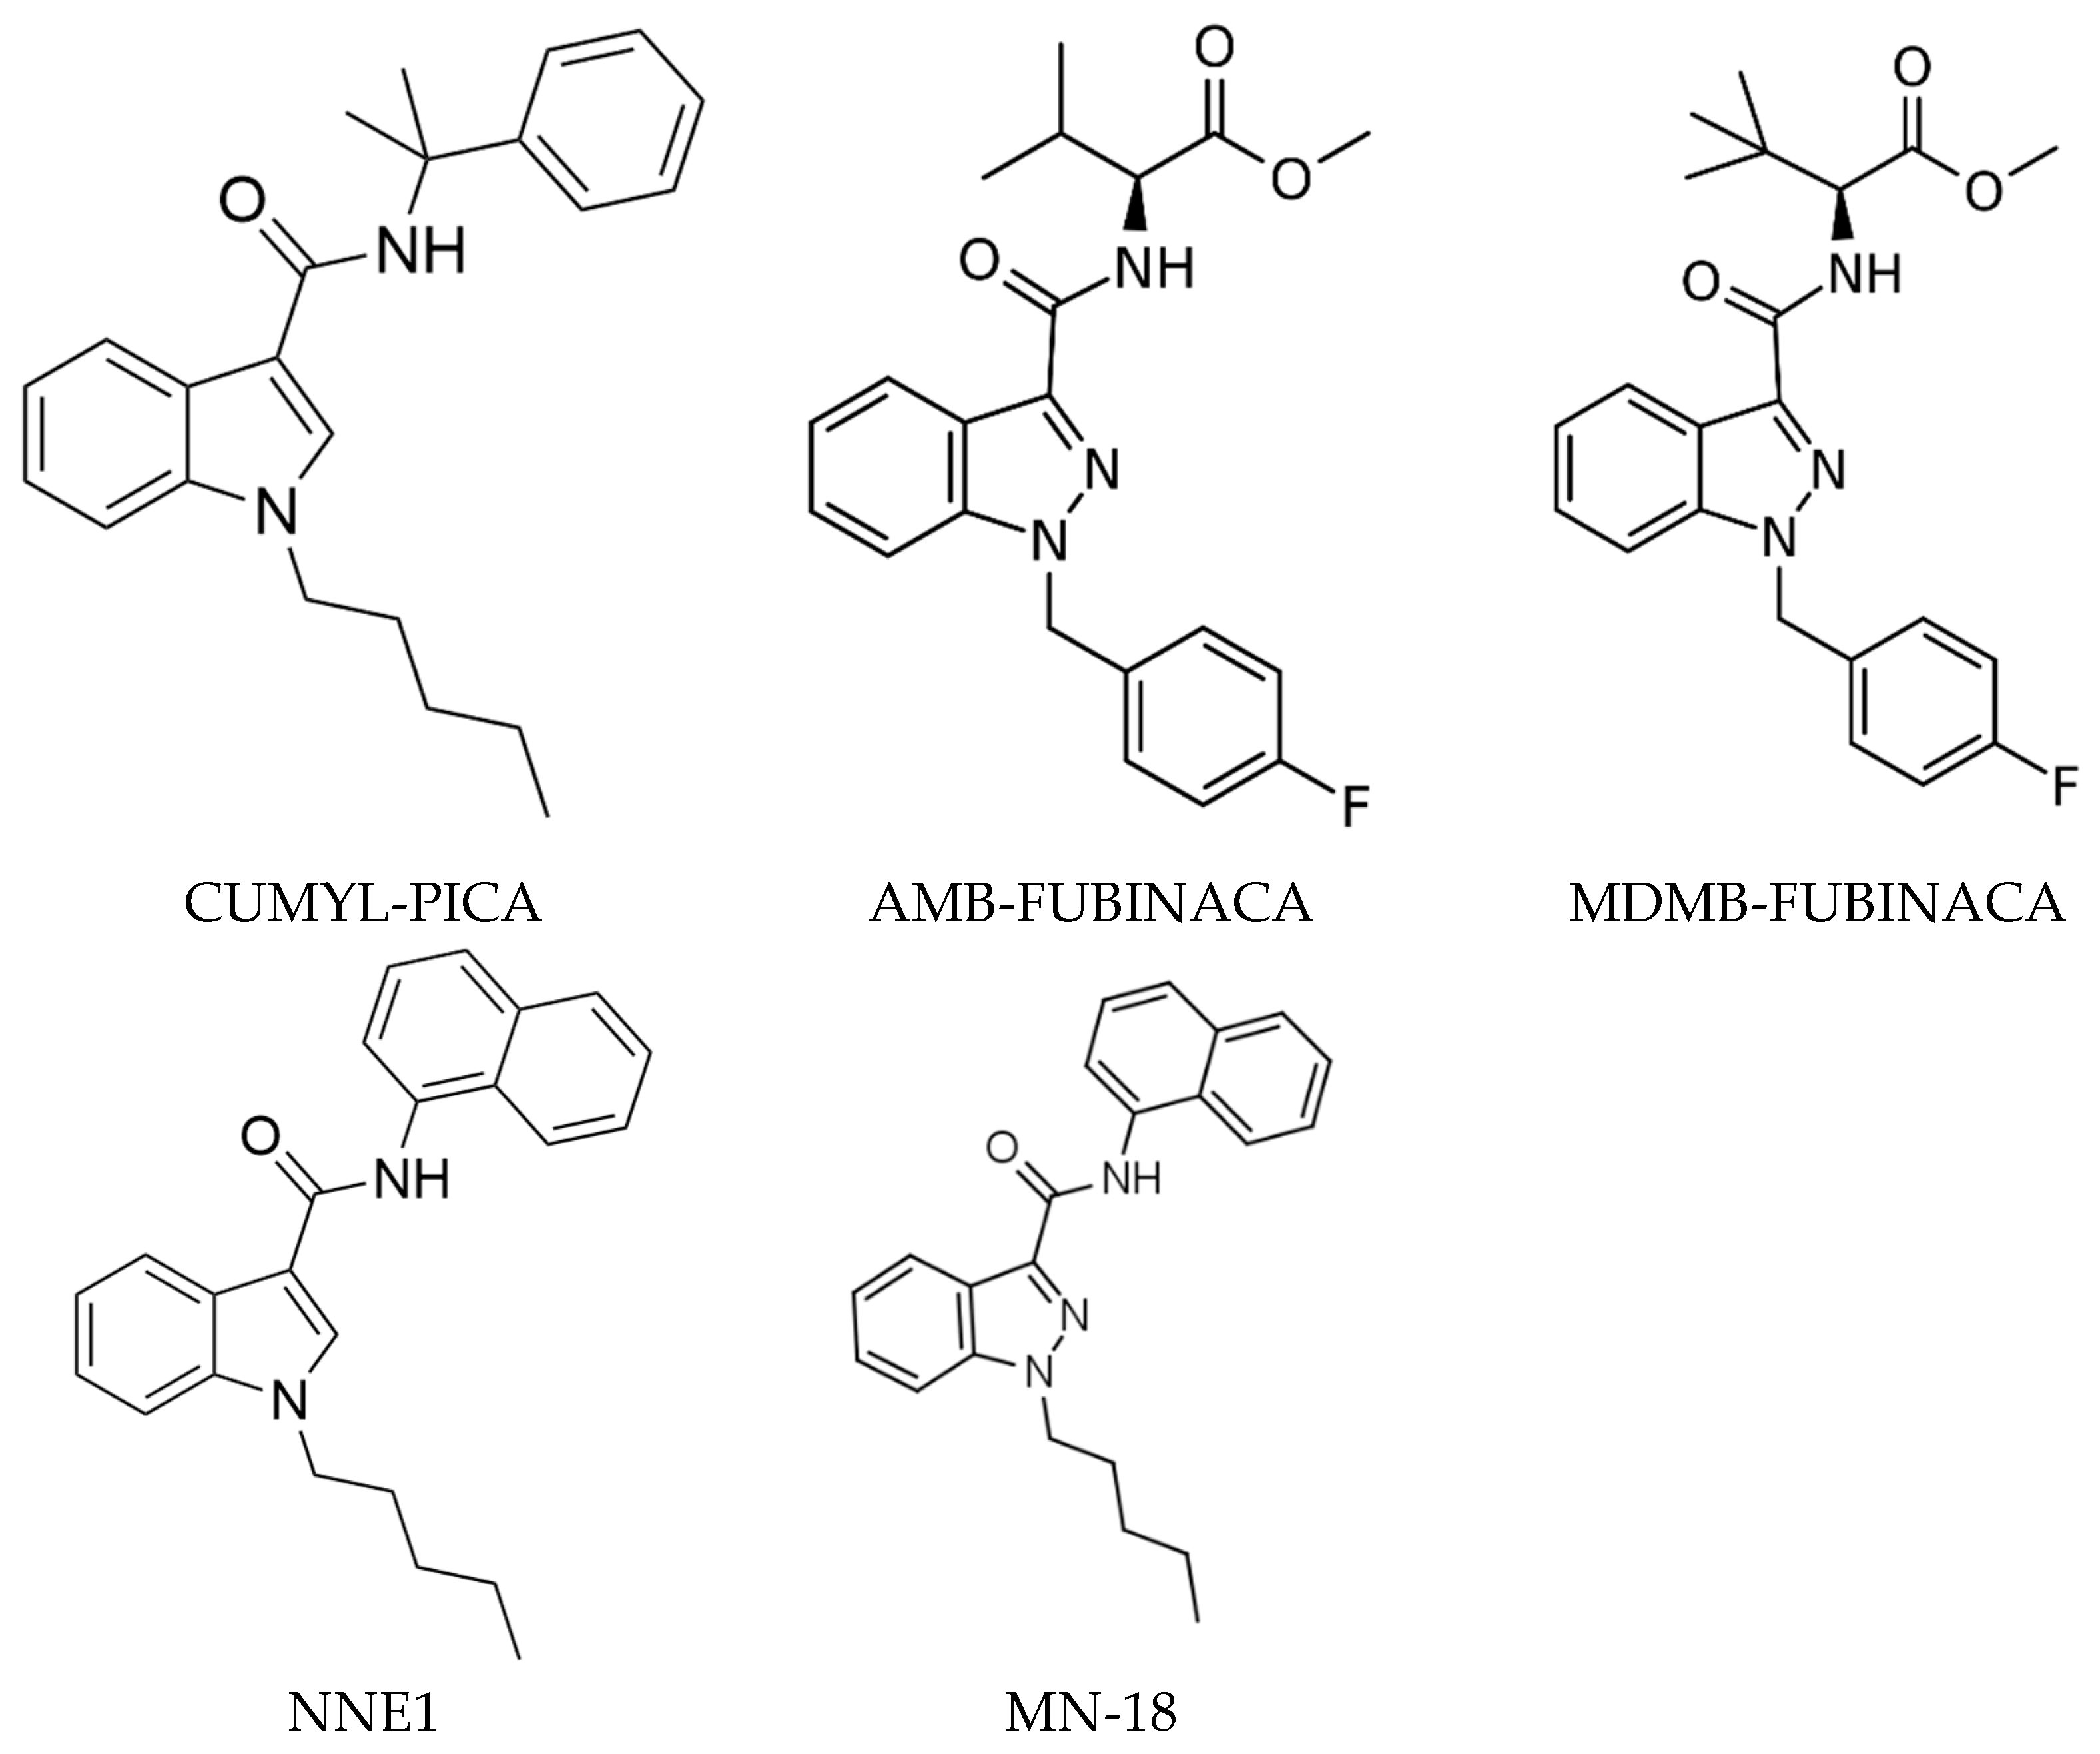
3.11. Synthetic Cannabinoids
3.12. Anaesthetic Gases Exposure
4. Pyrolysis Gas Chromatography for the Investigation of Drugs
5. Conclusions
Author Contributions
Funding
Institutional Review Board Statement
Informed Consent Statement
Data Availability Statement
Acknowledgments
Conflicts of Interest
References
- Stafford, D.T.; Brettell, T.A. Forensic Gas Chromatography; CRC Press: Boca Raton, FL, USA, 2019; ISBN 9780203016411/0203016416. [Google Scholar]
- Phillips, D.J.; Caparella, M.; El Fallah, Z.; Neue, U.D. Small particle columns for faster high performance liquid chromatography. Waters Column 1996, 6, 1–7. Available online: https://www.waters.com/webassets/cms/library/docs/wc6-2-1.pdf (accessed on 20 August 2023).
- Holm, T. Aspects of the mechanism of the flame ionization detector. J. Chromatogr. A 1999, 842, 221–227. [Google Scholar] [CrossRef]
- Pellizzari, E.D. Electron capture detection in gas chromatography. J. Chromatogr. A 1974, 98, 323–361. [Google Scholar] [CrossRef]
- Burgett, C.A.; Smith, D.H.; Bente, H.B. The nitrogen-phosphorus detector and its applications in gas chromatography. J. Chromatogr. A 1977, 134, 57–64. [Google Scholar] [CrossRef]
- Holmes, J.C.; Morrell, F.A. Oscillographic mass spectrometric monitoring of gas chromatography. Appl. Spectrosc. 1957, 11, 86–87. [Google Scholar] [CrossRef]
- Gohlke, R.S. Time-of-flight mass spectrometry and gas-liquid partition chromatography. Anal. Chem. 1959, 31, 535–541. [Google Scholar] [CrossRef]
- Vaye, O.; Ngumbu, R.S.; Xia, D. A review of the application of comprehensive two-dimensional gas chromatography MS-based techniques for the analysis of persistent organic pollutants and ultra-trace level of organic pollutants in environmental samples. Rev. Anal. Chem. 2022, 41, 63–73. [Google Scholar] [CrossRef]
- Janák, J. Identification of the structure of non-volatile organic substances by gas chromatography of pyrolytic products. Nature 1960, 185, 684–686. [Google Scholar] [CrossRef]
- Dhont, J.H. Pyrolysis and gas chromatography for the detection of the benzene ring in organic compounds. Nature 1961, 192, 747–748. [Google Scholar] [CrossRef]
- Hewitt, G.C.; Whitham, B.T. The identification of substances of low volatility by pyrolysis/gas-liquid chromatography. Analyst 1961, 86, 643–652. [Google Scholar] [CrossRef]
- Jones, C.R.; Moyles, A.F. Pyrolysis and gas-liquid chromatography on the microgram scale. Nature 1961, 191, 663–665. [Google Scholar] [CrossRef]
- Oro, J.; Han, J.; Zlatkis, A. Application of high-resolution gas chromatography-mass spectrometry to the analysis of the pyrolysis products of isoprene. Anal. Chem. 1967, 39, 27–32. [Google Scholar] [CrossRef]
- Merritt, C., Jr.; Robertson, D.H. The analysis of proteins, peptides and amino acids by pyrolysis-gas chromatography and mass spectrometry. J. Chromatogr. Sci. 1967, 5, 96–98. [Google Scholar] [CrossRef]
- Biemann, K.; Oro, J.; Toulmin III, P.; Orgel, L.E.; Nier, A.O.; Anderson, D.M.; Simmonds, P.G.; Flory, D.; Diaz, A.V.; Rushneck, D.R.; et al. Search for organic and volatile inorganic compounds in two surface samples from the Chryse Planitia region of Mars. Science 1976, 194, 72–76. [Google Scholar] [CrossRef] [PubMed]
- Reinhardt, M.; Goetz, W.; Thiel, V. Testing flight-like pyrolysis gas chromatography–mass spectrometry as performed by the Mars Organic Molecule Analyzer onboard the ExoMars 2020 rover on Oxia Planum analog samples. Astrobiology 2020, 20, 415–428. [Google Scholar] [CrossRef] [PubMed]
- Murat, P.; Harohalli Puttaswamy, S.; Ferret, P.J.; Coslédan, S.; Simon, V. Identification of Potential Extractables and Leachables in Cosmetic Plastic Packaging by Microchambers-Thermal Extraction and Pyrolysis-Gas Chromatography-Mass Spectrometry. Molecules 2020, 25, 2115. [Google Scholar] [CrossRef] [PubMed]
- Sullivan, G.L.; Gallardo, J.D.; Jones, E.W.; Hollliman, P.J.; Watson, T.M.; Sarp, S. Detection of trace sub-micron (nano) plastics in water samples using pyrolysis-gas chromatography time of flight mass spectrometry (PY-GCToF). Chemosphere 2020, 249, 126179. [Google Scholar] [CrossRef]
- Fischer, M.; Scholz-Böttcher, B.M. Simultaneous trace identification and quantification of common types of microplastics in environmental samples by pyrolysis-gas chromatography–mass spectrometry. Environ. Sci. Technol. 2017, 51, 5052–5060. [Google Scholar] [CrossRef]
- Cersoy, S.; Daheur, G.; Zazzo, A.; Zirah, S.; Sablier, M. Pyrolysis comprehensive gas chromatography and mass spectrometry: A new tool to assess the purity of ancient collagen prior to radiocarbon dating. Anal. Chim. Acta 2018, 1041, 131–145. [Google Scholar] [CrossRef]
- Decq, L.; Abatih, E.; Van Keulen, H.; Leyman, V.; Cattersel, V.; Steyaert, D.; Van Binnebeke, E.; Fremout, W.; Saverwyns, S.; Lynen, F. Nontargeted pattern recognition in the search for pyrolysis gas chromatography/mass spectrometry resin markers in historic lacquered objects. Anal. Chem. 2019, 91, 7131–7138. [Google Scholar] [CrossRef]
- Correia, L.P.; Procópio, J.V.V.; de Santana, C.P.; Santos, A.F.O.; de Medeiros Cavalcante, H.M.; Macêdo, R.O. Characterization of herbal medicine with different particle sizes using pyrolysis GC/MS, SEM, and thermal techniques. J. Therm. Anal. Calorim. 2013, 111, 1691–1698. [Google Scholar] [CrossRef]
- Smith, C.S.; Morgan, S.L.; Parks, C.D.; Fox, A.; Pritchard, D.G. Chemical marker for the differentiation of group A and group B streptococci by pyrolysis-gas chromatography-mass spectrometry. Anal. Chem. 1987, 59, 1410–1413. [Google Scholar] [CrossRef]
- Campbell, G.P.; Gordon, A.L. Analysis of condom lubricants for forensic casework. J. Forensic Sci. 2007, 52, 630–642. [Google Scholar] [CrossRef]
- Zimmerman, J.; Kimmett, M.J.; Mooney, D. Preliminary examination of machine copier toners by infrared spectrophotometry and pyrolysis gas chromatography. J. Forensic Sci. 1986, 31, 489–493. [Google Scholar] [CrossRef]
- Munson, T.O. The classification of photocopies by pyrolysis gas chromatography-mass spectrometry. J. Forensic Sci. 1989, 34, 352–365. [Google Scholar] [CrossRef]
- Sakayanagi, M.; Watanabe, K.; Konda, Y.; Harigaya, Y. Identification of pressure-sensitive adhesive polypropylene tape. J. Forensic Sci. 2003, 48, JFS2002245. [Google Scholar] [CrossRef]
- Huttunen, J.; Austin, C.; Dawson, M.; Roux, C.; Robertson, J. Physical evidence in drug intelligence, Part 1: Rationale based on hierarchic distribution of drugs using pyrolysis gas chromatography–mass spectrometry as an example. Aust. J. Forensic Sci. 2007, 39, 93–106. [Google Scholar] [CrossRef]
- Kochanowski, B.K.; Morgan, S.L. Forensic discrimination of automotive paint samples using pyrolysis-gas chromatography–mass spectrometry with multivariate statistics. J. Chromatogr. Sci. 2000, 38, 100–108. [Google Scholar] [CrossRef]
- Schütz, H.; Paine, A.; Erdmann, F.; Weiler, G.; Verhoff, M.A. Immunoassays for drug screening in urine: Chances, challenges, and pitfalls. Forensic Sci. Med. Pathol. 2006, 2, 75–83. [Google Scholar] [CrossRef]
- Gallardo, E.; Barroso, M.; Queiroz, J.A. LC-MS: A powerful tool in workplace drug testing. Drug Test. Anal. 2009, 1, 109–115. [Google Scholar] [CrossRef]
- Centre for Substance Abuse Treatment. Appendix B. Urine Collection and Testing Procedures and Alternative Methods for Monitoring Drug Use. In Substance Abuse: Clinical Issues in Intensive Outpatient Treatment; Treatment Improvement Protocol (TIP) Series; Substance Abuse and Mental Health Services Administration (US): Rockville, MD, USA, 2006; No. 47; pp. 237–245. [Google Scholar]
- Xu, D.; Ji, J.; Xiang, P.; Yan, H.; Shen, M. Two DFSA cases involving midazolam clarified by the micro-segmental hair analyses. Forensic Toxicol. 2022, 40, 374–382. [Google Scholar] [CrossRef] [PubMed]
- Usman, M.; Naseer, A.; Baig, Y.; Jamshaid, T.; Shahwar, M.; Khurshuid, S. Forensic toxicological analysis of hair: A review. Egypt. J. Forensic Sci. 2019, 9, 17. [Google Scholar] [CrossRef]
- Lendoiro, E.; Quintela, O.; de Castro, A.; Cruz, A.; Lopez-Rivadulla, M.; Concheiro, M. Target screening and confirmation of 35 licit and illicit drugs and metabolites in hair by LC–MSMS. Forensic Sci. Int. 2012, 217, 207–215. [Google Scholar] [CrossRef] [PubMed]
- Ettlinger, J.; Yegles, M. Influence of thermal hair straightening on cannabis and cocaine content in hair. Forensic Sci. Int. 2016, 265, 13–16. [Google Scholar] [CrossRef] [PubMed]
- Gambelunghe, C.; Rossi, R.; Aroni, K.; Bacci, M.; Lazzarini, A.; De Giovanni, N.; Carletti, P.; Fucci, N. Sweat testing to monitor drug exposure. Ann. Clin. Lab. Sci. 2013, 43, 22–30. [Google Scholar]
- Liberty, H.J.; Johnson, B.D.; Fortner, N. Detecting cocaine use through sweat testing: Multilevel modeling of sweat patch length-of-wear data. J. Anal. Toxicol. 2004, 28, 667–673. [Google Scholar] [CrossRef]
- Tracqui, A.; Kintz, P.; Ludes, B.; Jamey, C.; Mangin, P. The detection of opiate drugs in nontraditional specimens (clothing): A report of ten cases. J. Forensic Sci. 1995, 40, 263–265. [Google Scholar] [CrossRef]
- Baker, L.B. Physiology of sweat gland function: The roles of sweating and sweat composition in human health. Temperature 2019, 6, 211–259. [Google Scholar] [CrossRef]
- Jadoon, S.; Karim, S.; Akram, M.R.; Kalsoom Khan, A.; Zia, M.A.; Siddiqi, A.R.; Murtaza, G. Recent developments in sweat analysis and its applications. Int. J. Anal. Chem. 2015, 2015, 164974. [Google Scholar] [CrossRef]
- Caplan, Y.H.; Goldberger, B.A. Alternative specimens for workplace drug testing. J. Anal. Toxicol. 2001, 25, 396–399. [Google Scholar] [CrossRef]
- Concheiro, M.; Shakleya, D.M.; Huestis, M.A. Simultaneous analysis of buprenorphine, methadone, cocaine, opiates and nicotine metabolites in sweat by liquid chromatography tandem mass spectrometry. Anal. Bioanal. Chem. 2011, 400, 69–78. [Google Scholar] [CrossRef] [PubMed]
- Cone, E.J.; Hillsgrove, M.J.; Jenkins, A.J.; Keenan, R.M.; Darwin, W.D. Sweat testing for heroin, cocaine, and metabolites. J. Anal. Toxicol. 1994, 18, 298–305. [Google Scholar] [CrossRef] [PubMed]
- Barnes, A.J.; Smith, M.L.; Kacinko, S.L.; Schwilke, E.W.; Cone, E.J.; Moolchan, E.T.; Huestis, M.A. Excretion of methampheta-mine and amphetamine in human sweat following controlled oral methamphetamine administration. Clin. Chem. 2008, 54, 172–180. [Google Scholar] [CrossRef] [PubMed]
- De Martinis, B.S.; Barnes, A.J.; Scheidweiler, K.B.; Huestis, M.A. Development and validation of a disk solid phase extraction and gas chromatography–mass spectrometry method for MDMA, MDA, HMMA, HMA, MDEA, methamphetamine and amphetamine in sweat. J. Chromatogr. B Biomed. Appl. 2007, 852, 450–458. [Google Scholar] [CrossRef] [PubMed]
- Preston, K.L.; Huestis, M.A.; Wong, C.J.; Umbricht, A.; Goldberger, B.A.; Cone, E.J. Monitoring cocaine use in sub-stance-abuse-treatment patients by sweat and urine testing. J. Anal. Toxicol. 1999, 23, 313–322. [Google Scholar] [CrossRef] [PubMed]
- Huestis, M.A.; Scheidweiler, K.B.; Saito, T.; Fortner, N.; Abraham, T.; Gustafson, R.A.; Smith, M.L. Excretion of Δ9-tetrahydrocannabinol in sweat. Forensic Sci. Int. 2008, 174, 173–177. [Google Scholar] [CrossRef] [PubMed]
- Kintz, P.; Tracqui, A.; Mangin, P.; Edel, Y. Sweat Testing in Opioid Users with a Sweat Patch. J. Anal. Toxicol. 1996, 20, 393–397. [Google Scholar] [CrossRef] [PubMed]
- Uemura, N.; Nath, R.P.; Harkey, M.R.; Henderson, G.L.; Mendelson, J.; Jones, R.T. Cocaine levels in sweat collection patches vary by location of patch placement and decline over time. J. Anal. Toxicol. 2004, 28, 253–259. [Google Scholar] [CrossRef]
- Huestis, M.A.; Cone, E.J.; Wong, C.J.; Umbricht, A.; Preston, K.L. Monitoring opiate use in substance abuse treatment patients with sweat and urine drug testing. J. Anal. Toxicol. 2000, 24, 509–521. [Google Scholar] [CrossRef]
- Choi, M.J.; Oh, C.H. 2nd dimensional GC-MS analysis of sweat volatile organic compounds prepared by solid phase microextraction. Technol. Health Care 2014, 22, 481–488. [Google Scholar] [CrossRef]
- Shokry, E.; Marques, J.G.; Ragazzo, P.C.; Pereira, N.Z.; Filho, N.R.A. Earwax as an alternative specimen for forensic analysis. Forensic Toxicol. 2017, 35, 348–358. [Google Scholar] [CrossRef] [PubMed]
- Shokry, E.; de Oliveira, A.E.; Avelino, M.A.G.; de Deus, M.M.; Pereira, N.Z.; Filho, N.R.A. Earwax: An innovative tool for assessment of tobacco use or exposure. A pilot study in young adults. Forensic Toxicol. 2017, 35, 389–398. [Google Scholar] [CrossRef]
- Meier, S.I.; Koelzer, S.C.; Schubert-Zsilavecz, M.; Toennes, S.W. Analysis of drugs of abuse in Cerumen—Correlation of postmortem analysis results with those for blood, urine and hair. Drug Test Anal. 2017, 9, 1572–1585. [Google Scholar] [CrossRef] [PubMed]
- Gonçalves Barbosa, J.M.; Machado Botelho, A.F.; Santana da Silva, R.H.; Ferreira de Almeida, S.S.; Ferreira, E.R.; Caetano David, L.; Alves Fortuna Lima, D.; Cavalcante ESilva, T.; Jorge da Cunha, P.H.; Roberto Antoniosi Filho, N. Identification of cattle poisoning by Bifenthrin via earwax analysis by HS/GC–MS. Biomed. Chromatogr. 2021, 35, e5017. [Google Scholar] [CrossRef] [PubMed]
- Mozaner Bordin, D.C.; Alves, M.N.; Cabrices, O.G.; de Campos, E.G.; De Martinis, B.S. A rapid assay for the simultaneous determination of nicotine, cocaine and metabolites in meconium using disposable pipette extraction and gas chromatography–mass spectrometry (GC–MS). J. Anal. Toxicol. 2014, 38, 31–38. [Google Scholar] [CrossRef] [PubMed]
- Onchoi, C.; Kongtip, P.; Nankongnab, N.; Chantanakul, S.; Sujirarat, D.; Woskie, S. Organophosphates in meconium of new-born babies whose mothers resided in agricultural areas of Thailand. Southeast Asian J. Trop. Med. Public Health 2020, 51, 77. [Google Scholar]
- Drabińska, N.; Flynn, C.; Ratcliffe, N.; Belluomo, I.; Myridakis, A.; Gould, O.; Fois, M.; Smart, A.; Devine, T.; Costello, B.D.L. A literature survey of all volatiles from healthy human breath and bodily fluids: The human volatilome. J. Breath Res. 2021, 15, 034001. [Google Scholar] [CrossRef]
- Fan, J.C.; Ren, R.; He, H.L.; Jin, Q.; Wang, S.T. Determination of phthalate esters in breast milk before and after frozen storage in milk storage bags. Food Addit. Contam. Part A Chem. 2020, 37, 1897–1905. [Google Scholar] [CrossRef]
- Witczak, A.; Pohoryło, A.; Abdel-Gawad, H. Endocrine-disrupting organochlorine pesticides in human breast milk: Changes during lactation. Nutrients 2021, 13, 229. [Google Scholar] [CrossRef]
- Ishak, N.; Ahmad, A.H.; Mohamad Noor, S.A.; Ahmad, A. Detection of heroin metabolites at different developmental stages of Lucilia cuprina (Diptera: Calliphoridae) reared in heroin-treated meat: A preliminary analysis. Egypt. J. Forensic Sci. 2019, 9, 65. [Google Scholar] [CrossRef]
- Magni, P.A.; Pacini, T.; Pazzi, M.; Vincenti, M.; Dadour, I.R. Development of a GC–MS method for methamphetamine detection in Calliphora vomitoria L.(Diptera: Calliphoridae). Forensic Sci. Int. 2014, 241, 96–101. [Google Scholar] [CrossRef] [PubMed]
- Campobasso, C.P.; Gherardi, M.; Caligara, M.; Sironi, L.; Introna, F. Drug analysis in blowfly larvae and in human tissues: A comparative study. Int. J. Legal Med. 2004, 118, 210–214. [Google Scholar] [CrossRef] [PubMed]
- Metushi, I.G.; Fitzgerald, R.L.; McIntyre, I.M. Assessment and comparison of vitreous humor as an alternative matrix for forensic toxicology screening by GC–MS. J. Anal. Toxicol. 2016, 40, 243–247. [Google Scholar] [CrossRef]
- Jenkins, A.J.; Oblock, J. Phencyclidine and cannabinoids in vitreous humor. Leg Med. (Tokyo) 2008, 10, 201–203. [Google Scholar] [CrossRef]
- Lin, D.L.; Lin, R.L. Distribution of 11-nor-9-carboxy-Δ9-tetrahydrocannabinol in traffic fatality cases. J. Anal. Toxicol. 2005, 29, 58–61. [Google Scholar] [CrossRef] [PubMed]
- Bévalot, F.; Cartiser, N.; Bottinelli, C.; Fanton, L.; Guitton, J. Correlation of bile and vitreous humor concentrations with blood drug concentrations for forensic interpretation: A comparative study between animal experimental and human postmortem data. Forensic Toxicol. 2015, 33, 131–140. [Google Scholar] [CrossRef]
- Gould, O.; Drabińska, N.; Ratcliffe, N.; de Lacy Costello, B. Hyphenated mass spectrometry versus real-time mass spectrometry techniques for the detection of volatile compounds from the human body. Molecules 2021, 26, 7185. [Google Scholar] [CrossRef]
- Ntoupa, P.S.A.; Armaos, K.P.; Athanaselis, S.A.; Spiliopoulou, C.A.; Papoutsis, I.I. Study of the distribution of antidepressant drugs in vitreous humor using a validated GC/MS method. Forensic Sci. Int. 2020, 317, 110547. [Google Scholar] [CrossRef]
- Russell, E. Rapid Analysis of Drugs: A Pilot Surveillance System to Detect Changes in the Illicit Drug Supply to Guide Timely Harm Reduction Responses—Eight Syringe Services Programs, Maryland, November 2021–August 2022. MMWR Morb. Mortal Wkly Rep. 2023, 72, 458–462. [Google Scholar] [CrossRef]
- Gherghel, S.; Morgan, R.M.; Arrebola-Liébanas, J.F.; Blackman, C.S.; Parkin, I.P. Fragrance transfer between fabrics for forensic reconstruction applications. Sci. Justice 2019, 59, 256–267. [Google Scholar] [CrossRef] [PubMed]
- Ferrari Júnior, E.; Salum, L.B.; Damasceno, R.R.; Alves, B.E.P.; Caldas, E.D. Formaldehyde analysis of seized cosmetic products by HS-GC-MS of methylal, ethoxymethoxymethane, and ethylal derivatives. Braz. J. Pharm. Sci. 2022, 58, e20253. [Google Scholar] [CrossRef]
- Nguyen, L.; Evans, A.; Frank, G.; Levitas, M.; Mennella, A.; Short, L.C. Genuine and counterfeit prescription pill surveillance in Washington, DC. Forensic Sci. Int. 2022, 339, 111414. [Google Scholar] [CrossRef] [PubMed]
- Raynor, I.; Coulson, S.A.; Curran, J.M.; Nair, M.V.; Miskelly, G.M.; Rindelaub, J.D. The persistence of moisturizer products on human skin in relation to sexual assault investigations. Forensic Chem. 2021, 25, 100348. [Google Scholar] [CrossRef]
- Schettino, L.; Benedé, J.L.; Chisvert, A. Determination of nine prohibited N-nitrosamines in cosmetic products by vor-tex-assisted dispersive liquid–liquid microextraction prior to gas chromatography-mass spectrometry. RSC Adv. 2023, 13, 2963–2971. [Google Scholar] [CrossRef] [PubMed]
- Paul, R.; Williams, R.; Hodson, V.; Peake, C. Detection of cannabinoids in hair after cosmetic application of hemp oil. Sci. Rep. 2019, 9, 2582. [Google Scholar] [CrossRef]
- Gładysz, M.; Król, M.; Karoly, A.; Szalai, R.; Kościelniak, P. A multitechnique approach for discrimination and identification of lipsticks for forensic purposes. J. Forensic Sci. 2022, 67, 494–504. [Google Scholar] [CrossRef] [PubMed]
- Zambas-Adams, P.; Honeychurch, K.C. Analytical approaches and trends in the determination of psychoactive drugs in air. Sci 2022, 4, 1. [Google Scholar] [CrossRef]
- Cone, E.J.; Johnson, R.E.; Darwin, W.D.; Yousefnejad, D.; Mell, L.D.; Paul, B.D.; Mitchell, J. Passive inhalation of marijuana smoke: Urinalysis and room air levels of delta-9-tetrahydrocannabinol. J. Anal. Toxicol. 1987, 11, 89–96. [Google Scholar] [CrossRef]
- Paul, R.; Smith, S.; Gent, L.; Sutherill, R. Air monitoring for synthetic cannabinoids in a UK prison: Application of personal air sampling and fixed sequential sampling with thermal desorption two-dimensional gas chromatography coupled to time-of-flight mass spectrometry. Drug Test. Anal. 2021, 13, 1678–1685. [Google Scholar] [CrossRef]
- Henderson, K.A.; Matthews, I.P.; Adisesh, A.; Hutchings, A.D. Occupational exposure of midwives to nitrous oxide on delivery suites. Occup. Environ. Med. 2003, 60, 958–961. [Google Scholar] [CrossRef]
- Giuliani, N.; Beyer, J.; Augsburger, M.; Varlet, V. Validation of an analytical method for nitrous oxide (N2O) laughing gas by headspace gas chromatography coupled to mass spectrometry (HS-GC–MS): Forensic application to a lethal intoxication. J. Chromatogr. B Biomed. Appl. 2015, 983, 90–93. [Google Scholar] [CrossRef] [PubMed]
- Sumnall, H. Recreational use of nitrous oxide. BMJ 2022, 378, o2297. [Google Scholar] [CrossRef] [PubMed]
- Tsuchihashi, H.; Tatsuno, M.; Nishikawa, M. The analysis of quaternary ammonium compounds by pyrolysis gas chroma-tography/mass spectrometry and thin-layer chromatography. Eisei Kagaku 1990, 36, 28–35. [Google Scholar] [CrossRef]
- Nishikawa, M.; Tatsuno, M.; Suzuki, S.; Tsuchihashi, H. Analysis of methylbenactyzium bromide in human urine by thin-layer chromatography and pyrolysis gas chromatography. Forensic Sci. Int. 1991, 49, 197–203. [Google Scholar] [CrossRef] [PubMed]
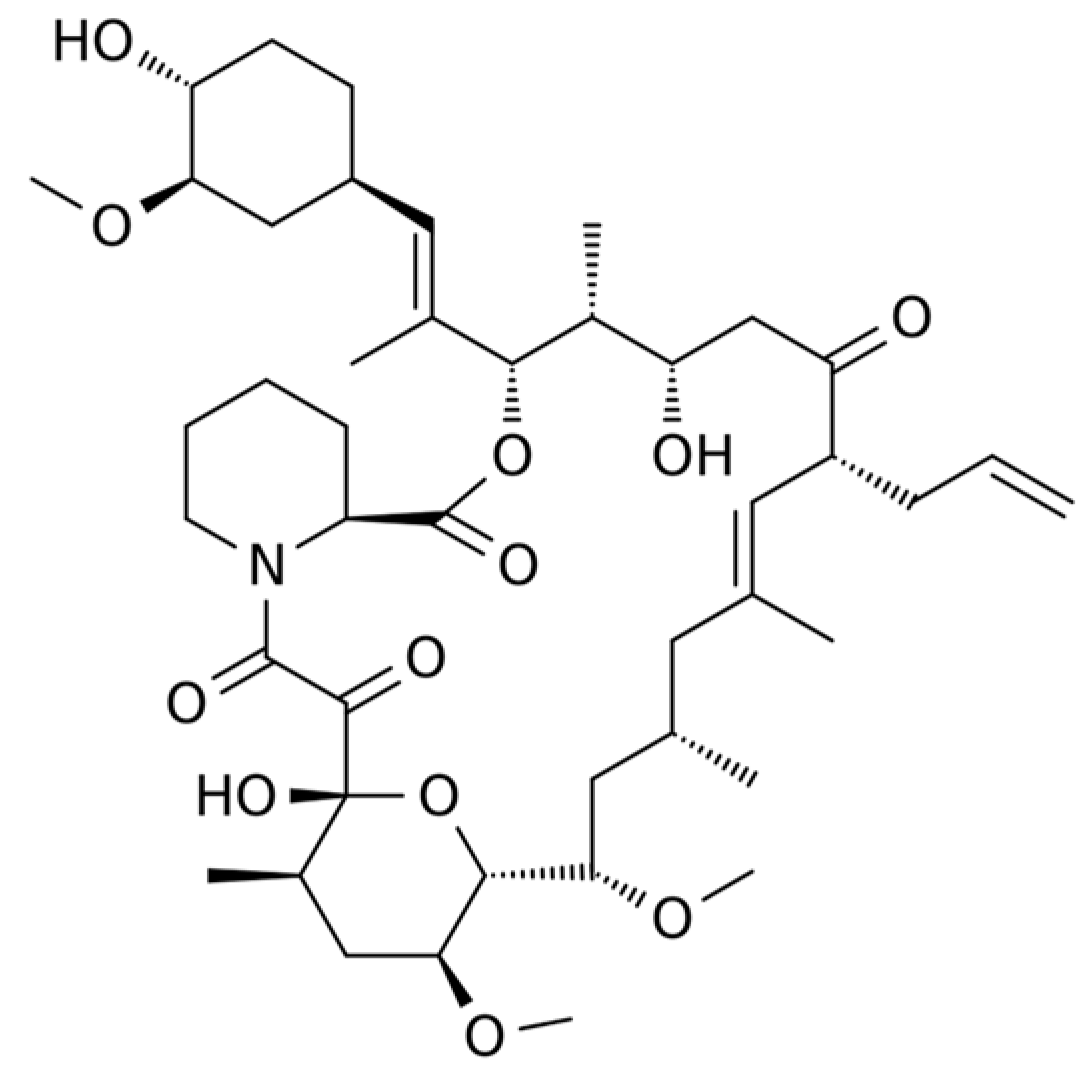
- Böer, T.M.; Procópio, J.V.V.; do Nascimento, T.G.; Macêdo, R.O. Correlation of thermal analysis and pyrolysis coupled to GC–MS in the characterization of tacrolimus. J. Pharm. Biomed. Anal. 2013, 73, 18–23. [Google Scholar] [CrossRef] [PubMed]
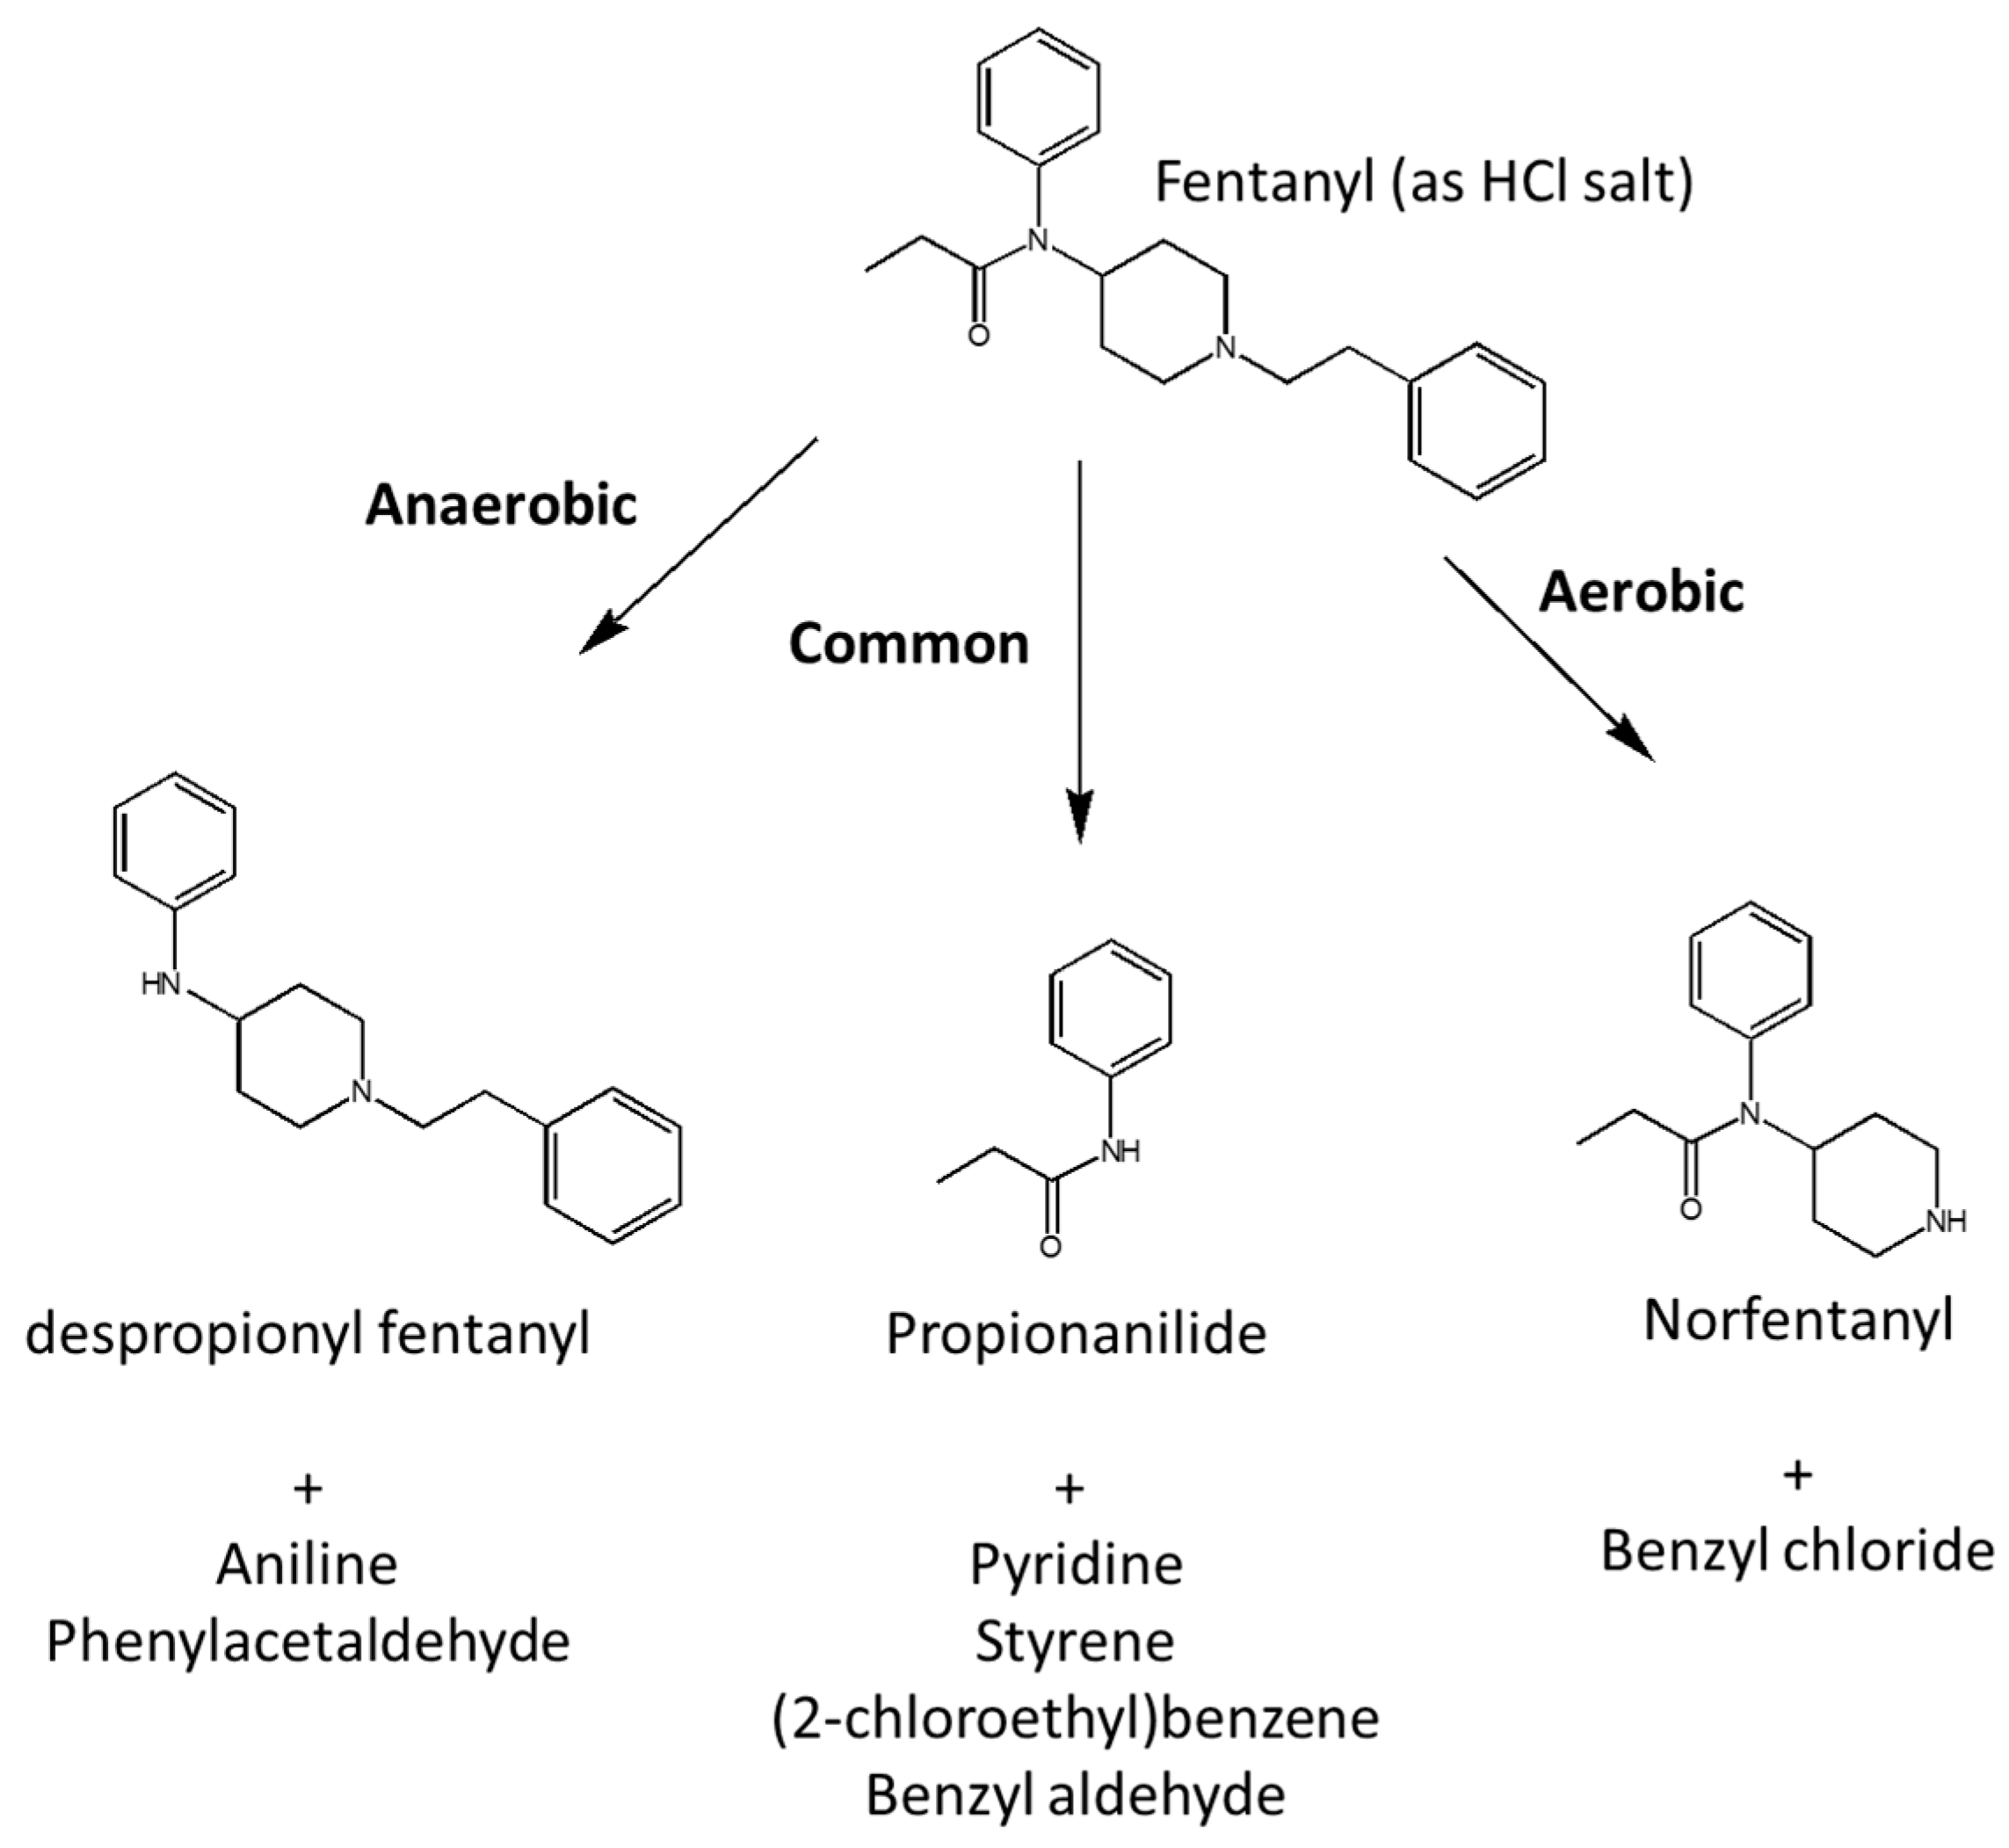
- Nishikawa, R.K.; Bell, S.C.; Kraner, J.C.; Callery, P.S. Potential biomarkers of smoked fentanyl utilizing pyrolysis gas chroma-tographymass spectrometry. J. Anal. Toxicol. 2009, 33, 418–422. [Google Scholar] [CrossRef] [PubMed]
- Sato, M.; Hida, M.; Nagase, H. Analysis of pyrolysis products of methamphetamine. J. Anal. Toxicol. 2004, 28, 638–643. [Google Scholar] [CrossRef] [PubMed]
- Mitsui, T.; Hida, M.; Fujimura, Y. Determination of alkaloidal narcotics by pyrolysis-gas chromatography. J. Anal. Appl. Pyroly-sis 1989, 17, 83–89. [Google Scholar] [CrossRef]
- Thomas, B.F.; Lefever, T.W.; Cortes, R.A.; Grabenauer, M.; Kovach, A.L.; Cox, A.O.; Patel, P.R.; Pollard, G.T.; Marusich, J.A.; Kevin, R.C.; et al. Thermolytic degradation of synthetic cannabinoids: Chemical exposures and pharmacological consequences. J. Pharmacol. Exp. Ther. 2017, 361, 162–171. [Google Scholar] [CrossRef]
- Kevin, R.C.; Kovach, A.L.; Lefever, T.W.; Gamage, T.F.; Wiley, J.L.; McGregor, I.S.; Thomas, B.F. Toxic by design? Formation of thermal degradants and cyanide from carboxamide-type synthetic cannabinoids CUMYL-PICA, 5F-CUMYL-PICA, AMB-FUBINACA, MDMB-FUBINACA, NNEI, and MN-18 during exposure to high temperatures. Forensic Toxicol. 2019, 37, 17–26. [Google Scholar] [CrossRef]
- Baker, R.R. Temperature distribution inside a burning cigarette. Nature 1974, 247, 405–406. [Google Scholar] [CrossRef]
- Freye, E.; Levy, J.V. Pharmacology and abuse of cocaine, amphetamines, ecstasy and related designer drugs. In Pharmacology of Cocaine; Springer: Berlin/Heidelberg, Germany, 2010; pp. 49–60. [Google Scholar] [CrossRef]
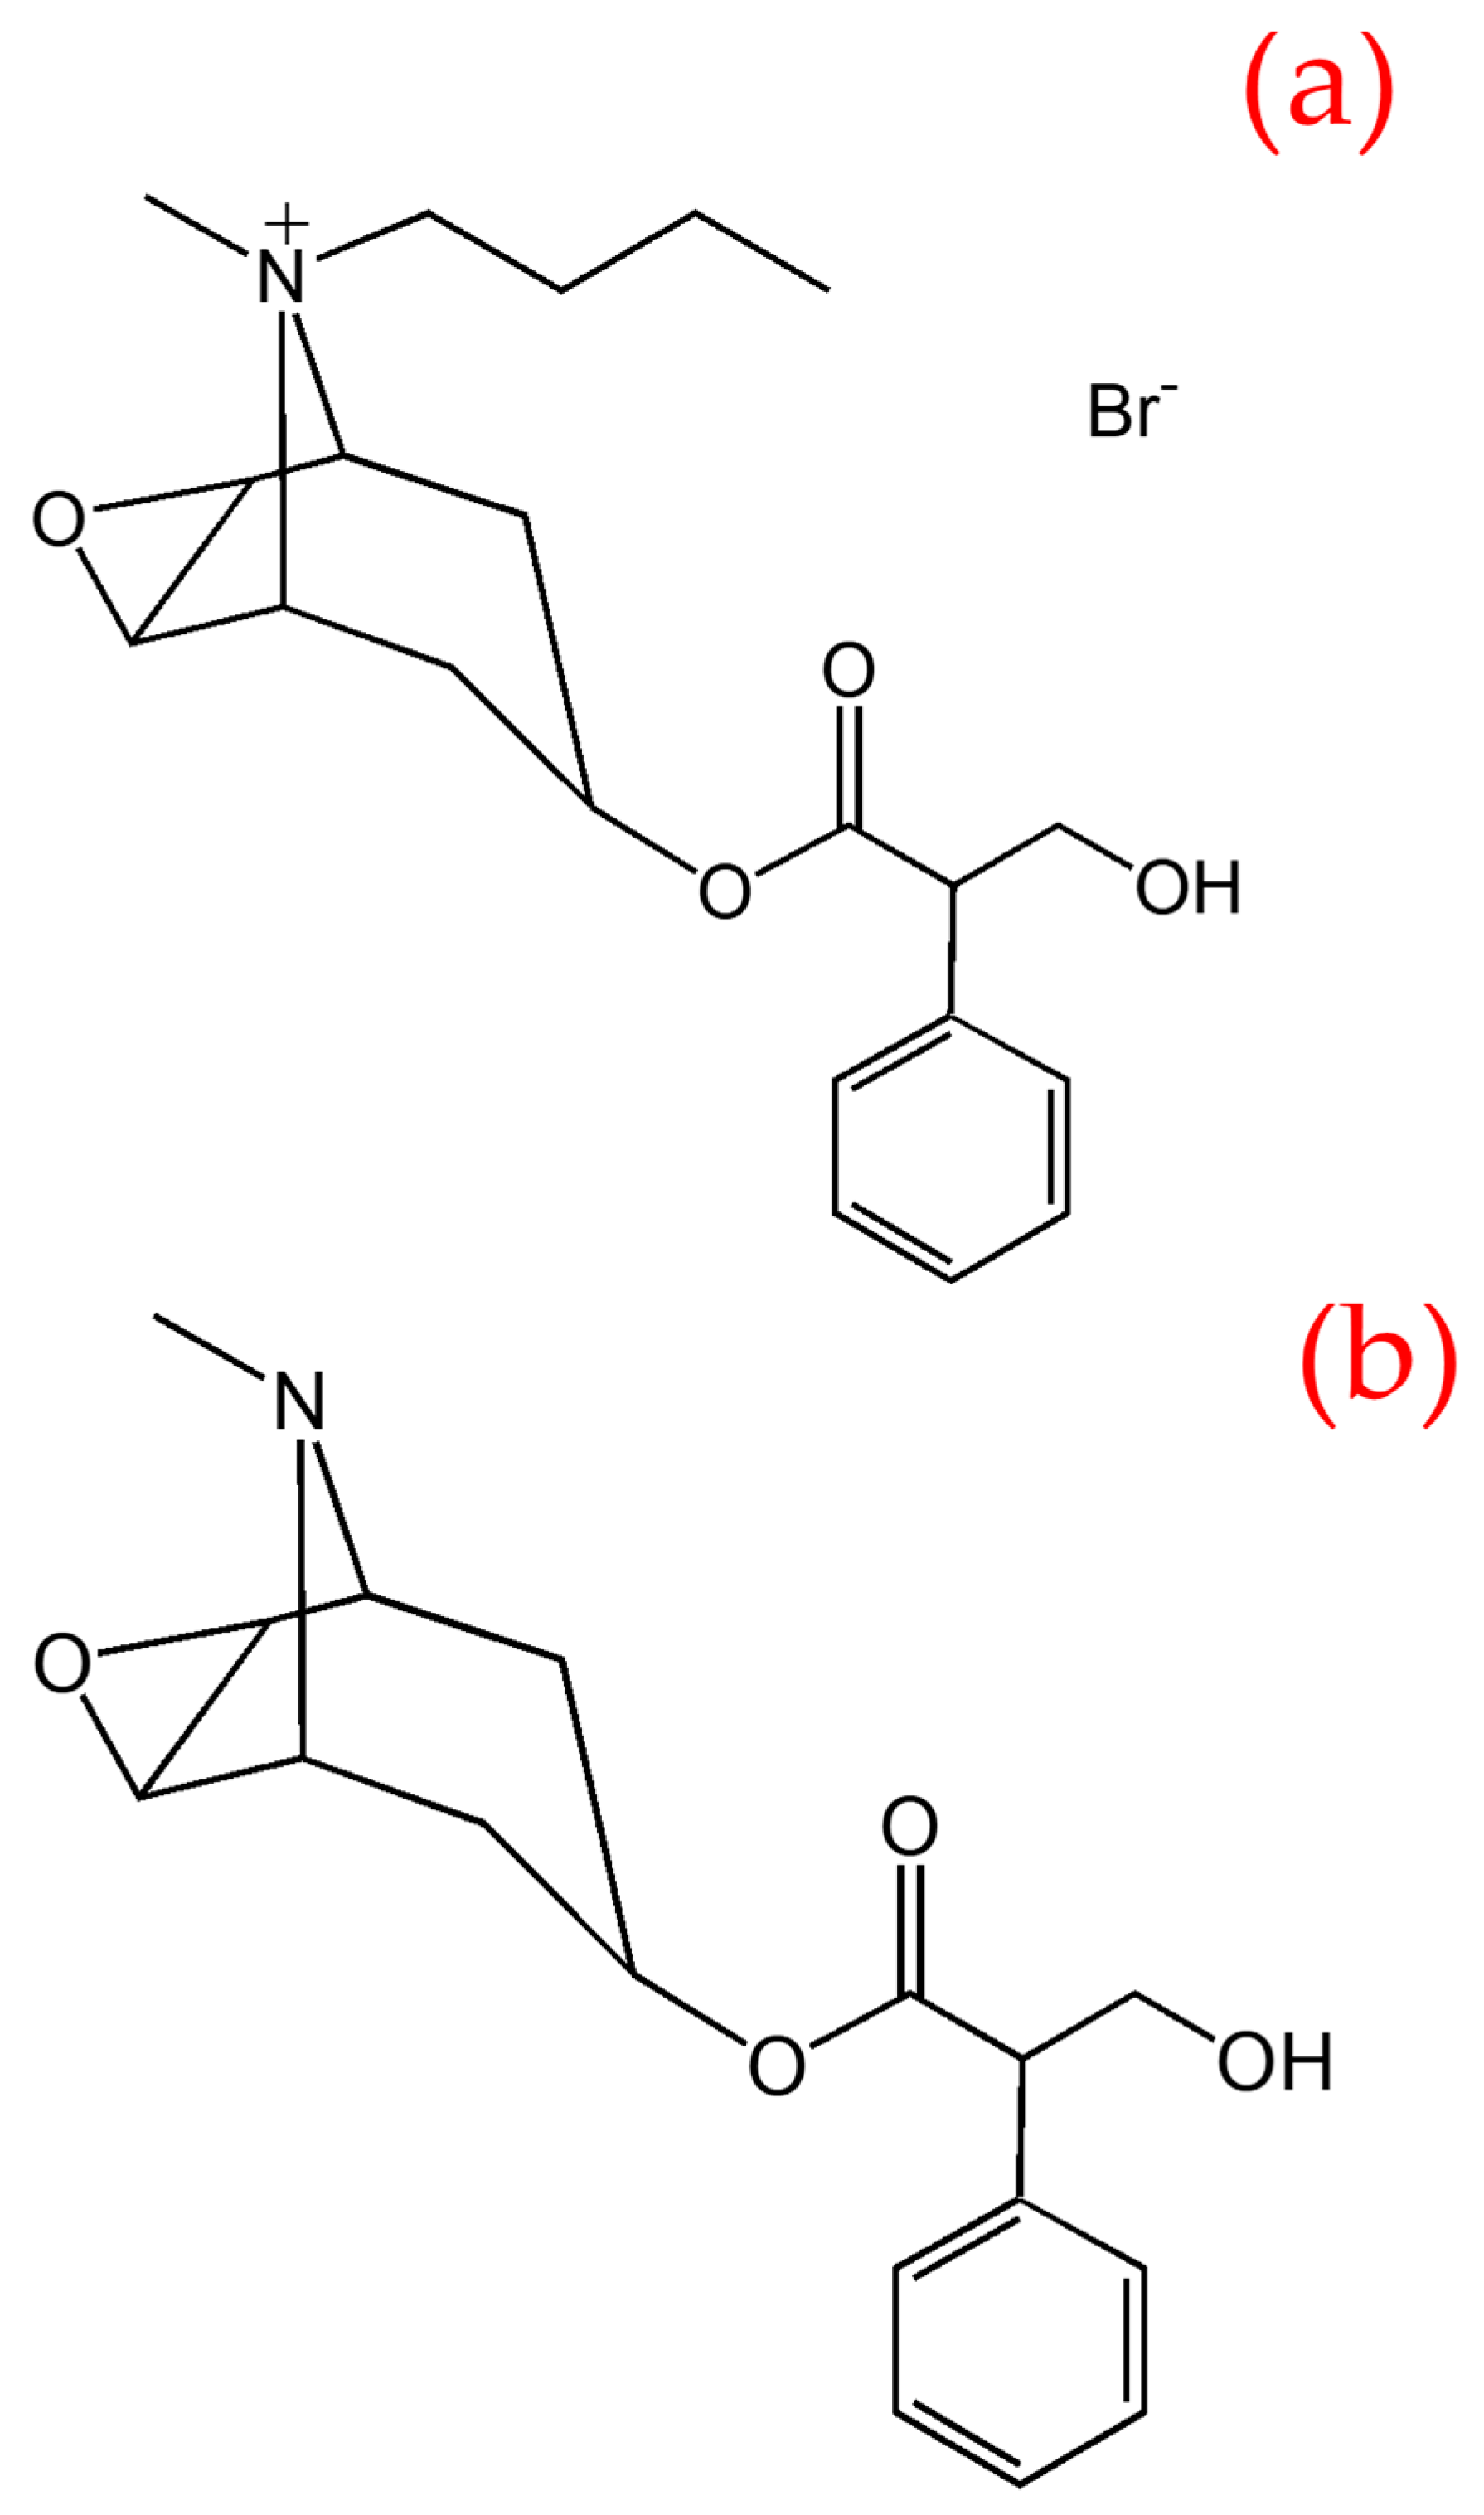
- Strano-Rossi, S.; Mestria, S.; Bolino, G.; Polacco, M.; Grassi, S.; Oliva, A. Scopolamine fatal outcome in an inmate after Buscopan® smoking. Int. J. Legal Med. 2021, 135, 1455–1460. [Google Scholar] [CrossRef]
- Jalali, F.; Afshari, R.; Babaei, A. Smoking crushed hyoscine/scopolamine tablets as drug abuse. Subst. Use Misuse 2014, 49, 793–797. [Google Scholar] [CrossRef]
- Deutsch, J.; Hegedus, L.; Greig, N.H.; Rapoport, S.I.; Soncrant, T.T. Evidence of Transacylation of Scopolamine in the Gas-Chromatograph Inlet. Anal. Lett. 1994, 27, 671–679. [Google Scholar] [CrossRef]
- Brenneisen, R.; Hasler, F. GC/MS determination of pyrolysis products from diacetylmorphine and adulterants of street heroin samples. J. Forensic Sci. 2002, 47, JFS15456J. [Google Scholar] [CrossRef]
- Fernandez-Lopez, L.; Mancini, R.; Pellegrini, M.; Rotolo, M.C.; Luna, A.; Falcon, M. Postmortem analysis of quetiapine and pregabalin in human bone. Leg. Med. 2020, 46, 101717. [Google Scholar] [CrossRef]
- Aly, S.M.; Gish, A.; Hakim, F.; Guelmi, D.; Mesli, V.; Hédouin, V.; Allorge, D.; Gaulier, J.M. In the case of extensively putrefied bodies, the analysis of entomological samples may support and complement the toxicological results obtained with other al-ternative matrices. Leg. Med. 2023, 63, 102261. [Google Scholar] [CrossRef]
- Sadler, D.W.; Fuke, C.; Court, F.; Pounder, D.J. Drug accumulation and elimination in Calliphora vicina larvae. Forensic Sci. Int. 1995, 71, 191–197. [Google Scholar] [CrossRef]
- Chophi, R.; Sharma, S.; Sharma, S.; Singh, R. Trends in the forensic analysis of cosmetic evidence. Forensic Chem. 2019, 14, 100165. [Google Scholar] [CrossRef]


| Analytes | Matrix | Derivatization | Sample Pre-Treatment | Type of GC | LOD | Comments | Ref |
|---|---|---|---|---|---|---|---|
| Cocaine and heroin, morphine, 6-acetylmorphine, ecgonine methyl ester, ecgonine ethyl ester, cocaethylene, benzoylecgonine, norcocaine, norcocaethylene, and benzoylnorecgonine | Sweat | BSTFA with 1% TMCS, N-Methyl-bis-trifluoroacetamide | Sweat patch extracted with internal standard by shaking, centrifuged and filtered, and then purified by SPE, evaporated, and derivatized. | GC-MS/EI | Cocaine, heroin, and metabolites 1.0 ng/patch. | Sweat patch worn for a period of several days to several weeks at a time. | [44] |
| MAMP and AMP | Sweat | MTBSTFA with 1% TBDMCS and BSTFA with 1% TMCS. | Patches (PharmChek™) were folded and placed in acetate buffer (pH 4.0) for 30 min at room temperature. The solution was then purified by SPE. Analytes eluted and evaporated to dryness under N2 and derivatized. | GC-MS/EI | Limit of quantification of 2.5 ng/patch. | Weekly sweat patches were applied to participants, one on the back and one on the abdomen, and removed after a week. | [45] |
| MDMA, MDA, HMMA, HMA, MDEA, methamphetamine and AMP | Sweat | Triethylamine in heptane and HFAA. | Drugs were eluted from PharmChek™ sweat patches with sodium acetate buffer, extracted with disk SPE. | GC-MS/EI | Limits of quantification for MDMA, MDEA, MAMP and AMP were 2.5 ng/patch, and 5 ng/patch for MDA, HMA and HMMA. | A sweat patch was applied for various periods prior to, during, and after MDMA administration. A 1.0 mg/kg of MDMA was administered orally to a participant | [46] |
| Cocaine, benzoylecgonine, and ecgonine methyl ester. | Sweat and urine | -- | The absorbent sweat pad was extracted with 75% methanol/25% 0.2 M sodium acetate, pH 5.0 by shaking for 30 min; eluent was then analysed by ELISA and confirmed by GC-MS by SIM. | GC-MS/EI in SIM | 3 ng/mL for cocaine and 2 ng/mL for benzoylecgonine and ecgonine methyl ester. Limits of quantitation were 4 ng/mL for cocaine and 2 ng/mL for benzoylecgonine and ecgonine methyl ester. | Sweat and urine specimens collected from 44 methadone-maintenance patients. ELISA immunoassay compared. | [47] |
| Δ9-tetrahydrocannabinol | Sweat | Derivatized with trifluoroacetic anhydride | Patches were extracted with methanol/sodium acetate buffer pH 5, by shaking and isolated by SPE. | GC/MS negative ion CI. | Limit of quantification, 0.4 ng/patch. | In total, 11 daily cannabis users after cessation of drug use. PharmChek® Sweat patches worn for 7 days. Percent recovery from patches was 44–46%. | [48] |
| Heroin, 6-monoacetylmorphine, morphine, codeine, cocaine, benzoylecgonine, ecgonine methyl ester, Δ9-tetrahydrocannabinol, nordiazepam, oxazepam, AMP, methamphetamine, methylenedioxyamphetamine, metbylenedioxymethamphetamine, metbylenedioxyethylamphetamine and buprenorphine. | Sweat | AMP and related compounds with heptafluorobutyric anhydride. Other drugs by silylation with BSTFA and trimethylchlorosilane. | Sweat pads extracted in methanol containing deuterated internal standards by shaking. Methanol solution was divided into 3 for buprenorphine testing, amphetamines testing, and the remainder for the other compounds. Evaporated to dryness. Amphetamine and related compounds were identified after derivatization with heptafluorobutyric anhydride; other drugs were derivatized by sialylation. | GC-MS/EI | From 0.01 to 2.0 ng/patch | Buprenorphine was identified and quantitated by LC/MS. | [49] |
| Heroin, 6-acetylmorphine, morphine, and codeine | Sweat | --- | The absorbent pad was removed and extracted with buffer, 75% methanol/25% 0.2 M sodium acetate (pH 5.0), by shaking. The eluent was then analysed according to package directions by ELISA. | ELISA and GC-MS | GC-MS, 3 ng/mL | The percentage cross-reactivity at 10 ng/mL for each analyte was 100% for morphine, 28% for heroin, 30% for 6-acetylmorphine, 588% for codeine, 143% for hydrocodone, 16% for hydromorphone, and 30% for oxymorphone | [51] |
| Cotinine, a major metabolite of nicotine, o-nicotine, and anabasine. | Earwax | --- | Earwax samples (20 mg) transferred to GC vials, and 3-methyl cyclohexanone was added as internal standard. | HS/GC–MS by SIM. | --- | The monitored ions for quantification were m/z 84 for nicotine, o-nicotine and anabasine, m/z 98 for cotinine, and at m/z 69 for 3-methyl cyclohexanone (IS). | [54] |
| Bifenthrin | Earwax in cattle | --- | Samples were weighed into GC headspace vials, and IS, 3-methylcyclohexanone added. | HS/GC–MS by SIM. | --- | m/z ratios of 181 (base peak of bifenthrin) and 112 and 69 (molecular ion and base peak of IS). | [56] |
| Quetiapine and pregabalin | Human bone | Soft tissues were removed from the bone. Samples were cut in small fragments, dried and pulverized using a ball mill. An aliquot of bone powder and internal standard solution and methanol were vortexed and incubated and sonicated and centrifuged. The supernatants were recovered and evaporated. PBS; 0.1 M, pH 6 was added and samples were subjected to a SPE and eluted with dichloromethane:isopropanol:ammonia and then evaporated. Samples were reconstituted with 100 μL of ethyl acetate, vortexed before introduction to the GC-MS. | GC–MS by SIM | 0.1 ng/mg for both. | Pregabalin, m/z; 41-43-55-69-84-141. Quetiapine m/z 144-210-239-321. Sertraline (IS) m/z; 159-262-274-304 | [99] | |
| Fatty acid ethyl esters. MeconiumGC-FIDCocaine, benzoylecgonine, anhydroecgonine methyl ester (metabolite of crack cocaine), nicotine, and cotinine | Meconium | 60 μL acetonitrile, 20μL MSTFA, vortexed then heated 60 °C for 20 min. | 0.3 g Meconium added to a 10 mL glass tube spiked with ISTD 200 ng/g and methanol added for extraction. An amount of 0.1 M HCL was added prior to the pipette SPE process. | GC-MS in SIM mode, multi-step temperature ramp | 2.5 ng/g cocaine, 6 ng/g anhydroecgonine methyl ester, 8 ng/g cocaethylene, 10 ng/g benzoylecgonine, 15 ng/g nicotine, 5 ng/g cotinine | Meconium samples were spiked, there were no non-spiked samples tested. | [58] |
| Organophosphates: chlorpyrifos, dichlorvos, dimethoate, demeton-smethyl, ethion, malathion, omethoate, pirimiphos-methyl, pyrazophos, and tolclofos-methyl | Meconium | Liquid extraction with acetonitrile and internal standards. Dry residue reconstituted with toluene. | GC-MS, SIM mode | Range from 0.21 to 320.43 μg/g | [59] | ||
| 20 target analytes, only DMP, DEP, DIBP, DBP, and DEHP detected. | Breast Milk | Liquid/liquid extraction with acetonitrile saturated in n-hexane. | GC-MS/MS | Range from 0.5 to 211.2 μg/kg | A very simple extraction method was used, which has the benefit of being easily reproducible, no dangerous levels were found. | [61] | |
| Organochlorine Pesticides (aldrin, dieldrin, endrin, alpha-endosulfan, beta-endosulfan, endosulfan sulphate, heptachlor, heptachlor epoxide isomer B, methoxychlor, endrin ketone, endrin, pp’-DDE, pp’-DDD, pp’-DDT, α−HCH, β−HCH, γ−HCH and δ−HCH) | Breast Milk | Soxhlet extraction | GC-MS | All organopesticides LOD 0.01 ng/mL | A 60 m column with a 54.9 min sample analysis time. | [101] | |
| Heroin and associated metabolites | Flies and larvae | Alkali–acid base extraction method | GC-MS | [63] | |||
| Methamphetamine | Larvae, pupae, spent pupae and adult Calliphora vomitoria L. | Trifluoroacetic anhydride. | Washed with DCM, crystalized with liquid nitrogen, homogenised, and extracted with methanol before derivatisation. | GC-MS SIM mode | 5 ng/mg | Negative in adult Calliphora vomitoria L. | [64] |
| Opiates, cocaine, barbituates, and antidepressents | Blowfly larvae reared on liver samples which tested positive for the drugs | BSTFA at 70 °C for 15 min for the detection of morphine-2TMS and benzoylecgonine-TMS | Centrifuged homogenate of the larvae and or liver has the supernatant removed prior to derivatisation. SPE or liquid-liquid extraction flash-alkylation with MethElute. | GC-MS SIM mode | Not reported | Methods are difficult to follow. | [65] |
| Drug and metabolite screening | Vitreous Humour | Internal standards and ascorbic acid are mixed and precipitated with zinc sulphate, then centrifuged. The supernatant is treated with sodium acetate. This is then filtered through an SPE column. Sample extracts are reconstituted with ethyl acetate. | GC-MS Full scan m/z 43–550 | Not reported | [66] | ||
| 11-Nor-9-carboxy-∆9 tetrahydrocannabinol | Vitreous Humour | MSTFA heated at 90 °C for 30 min | THC-COOH-d3 was added to the biological sample. Hydrolysis was performed with sodium hydroxide and hexane, the aqueous layer was transferred, acidified with HCL and extracted with hexane/ethyl acetate. | GC-MS | 1 ng/mL | [68] | |
| Meprobamate, morphine, cyamemazine, caffeine, diazepam, and citalopram | Bile, Vitreous Humour, Whole blood | BSTFA/TMCS morphine analysed as TMS derivitive | Samples mixed with phosphate buffer 0.25 M pH 8.4 along with deuterated analogues of each analyte. For morphine, meprobamate, cyamemazine, and caffeine an automated SPE method was used before phosphate buffer was added. | GC-MS/MS | Not reported | [69] | |
| Antidepressant drugs; amitriptyline, nortriptyline, citalopram, clomipramine, fluoxetine, maprotiline, mirtazapine, sertraline and venlafaxine, and 4 of their metabolites, desmethylmaprotiline, desmethylmirtazapine, desmethylsertraline, O-desmethylvenlafaxine, | Vitreous Humour, Whole Blood | Dry residues were derivatized with HFBA in ethyl acetate at 50 °C 30 min. | SPE using a non-polar C8 sorbent and phosphate buffer 0.1 M pH 6.0, columns are then acidified with acetic acid and washed with methanol. Then, derivatized, and evaporated, dry samples were reconstituted with ethyl acetate. | GC-MS SIM mode | 1.5 ng/mL for all analytes | Dynamic range 5-500 ng/mL r2= 0.99. %RSD less than 10.9% for all analytes. | [71] |
| Analytes | Matrix | Derivatization | Sample Pre-Treatment | Type of GC | LOD | Comments | Ref |
|---|---|---|---|---|---|---|---|
| Formaldehyde | Cosmetics | Methanol, ethanol, and hydrochloric acid incubated for 4 h at 60 °C | None. Direct headspace analysis | Headspace GC-MS | 0.0015% formaldehyde starting concentration | RSD less than 12% | [74] |
| Screening of pills, fentanyl main substance | Pharmecutical pills | None | The method used is not given. | GC-MS full scan and GC-FID | No quantitative analysis | [72] | |
| Screening of perfume | Fabrics | None | 60 min SPME extraction at 58 °C. | GC-MS full scan | Qualitative | SPME analysis testing the persistence of perfumes on fabrics. | [75] |
| Moisturiser components: petrolatum, glycerol, cetyl alcohol, isopropyl palmitate, ethylparaben, and methylparaben | Swabs from skin | Swabs were extracted into 400 μL of methanol. | GC-MS direct injection full scan | Qualitative | Cetyl alcohol was still detectable from human skin after 23.5 h. | [76] | |
| N-nitrosamines | Costmetic products | None | Some 0.05 g of cosmetic samples were spiked with target analytes. A total of 120 μL of chloroform was used for the extraction, the solution was vortexed and centrifuged. The collected extract was directly injected. | GC-MS both in full scan and SIM mode. | 0.2 ng/L | N-nitrosodibutylamine. | [77] |
| ∆9-tetrahydrocannabiol and associated metabolites | Human hair | 20 μL BSTFA (no other details given) | Overnight extraction with methanol dried in a centrifugal concentrator. Hair was then digested in sodium hydroxide and liquid–liquid extraction with chloroform and propan-2-ol. SPE was used to clean up the sample. | GC-MS/MS in multiple reaction monitoring mode | 0.12 THC; 0.91 CBD; 0.09 CBN; 0.07 THC-COOH; 0.01 THC-OH (all pg/mg) | [78] |
| Analyte | Pyrolysis Conditions | Comments | Ref |
|---|---|---|---|
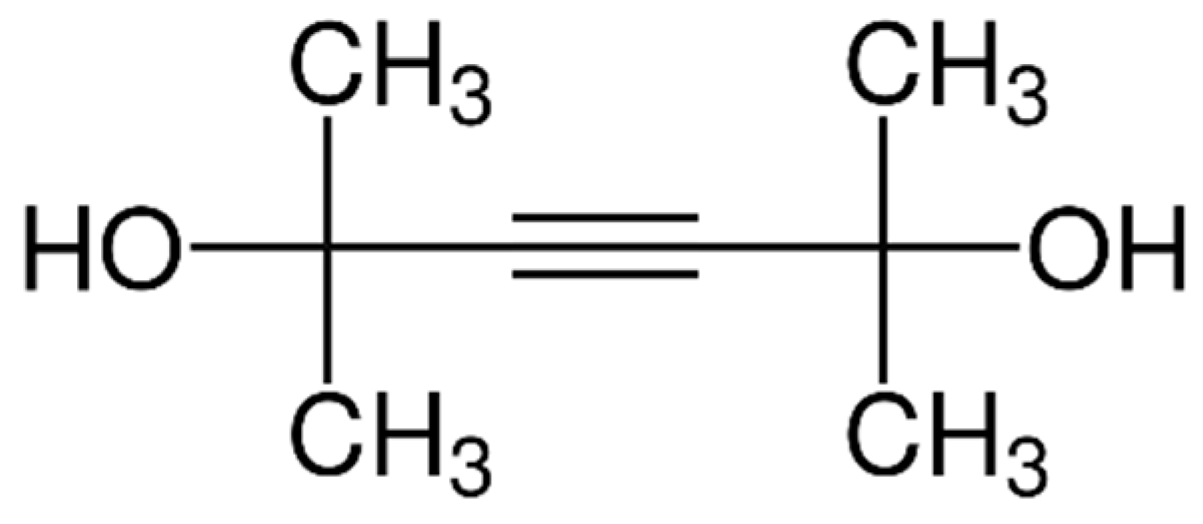
| Tacrolimus | Platinum crucible using isothermal temperatures of 300 and 400 °C. Pyrolysis analysis was undertaken using isothermal conditions of 300 °C and 400 °C coupled to GC–MS, in full scan mode (m/z 25–900). | Pyrogram obtained at 300 °C predominated by 2,5-dimethyl-3-hexine-2-5-diol. | [87] |
| Fentanyl | Investigations made under both anaerobic and aerobic conditions coupled to a GC-MS for the modelling of the illicit smoking of fentanyl in transdermal patches. | Propionanilide; pyridine, norfentanyl and despropionyl fentanyl formed along with Cl containing compounds, due to the HCl salt of fentanyl. | [88] |
| Methamphetamine | Pyrolysis of d-methamphetamine made to identify the products sealed in a glass tube, wrapped in pyrolysis-foil; heated at 200–500 °C. Resulting products extracted in methanol. | Amphetamine and dimethylamphetamine formed. Phenylacetone was reported as an oxidative degradation product. Above 415 °C toluene, styrene, and ethylbenzene were predominated. | [89] |
| Codeine and morphine | Drugs were pyrolyzed as alkaloid salts. The effect of metal ions on the pyrolysis reactions were investigated. A mixture of metal powder and Na2CO3 was added to a piece of pyrolysis foil containing the drug and heated (590 °C). The resulting products were identified by GC-MS. | Morphine, codeine phosphate and dihydrocodeine phosphate, 3,4-dimethyl-1,2-dihydroxybenzene. Based on this compound it was possible to quantify morphine HCl in urine. | [90] |
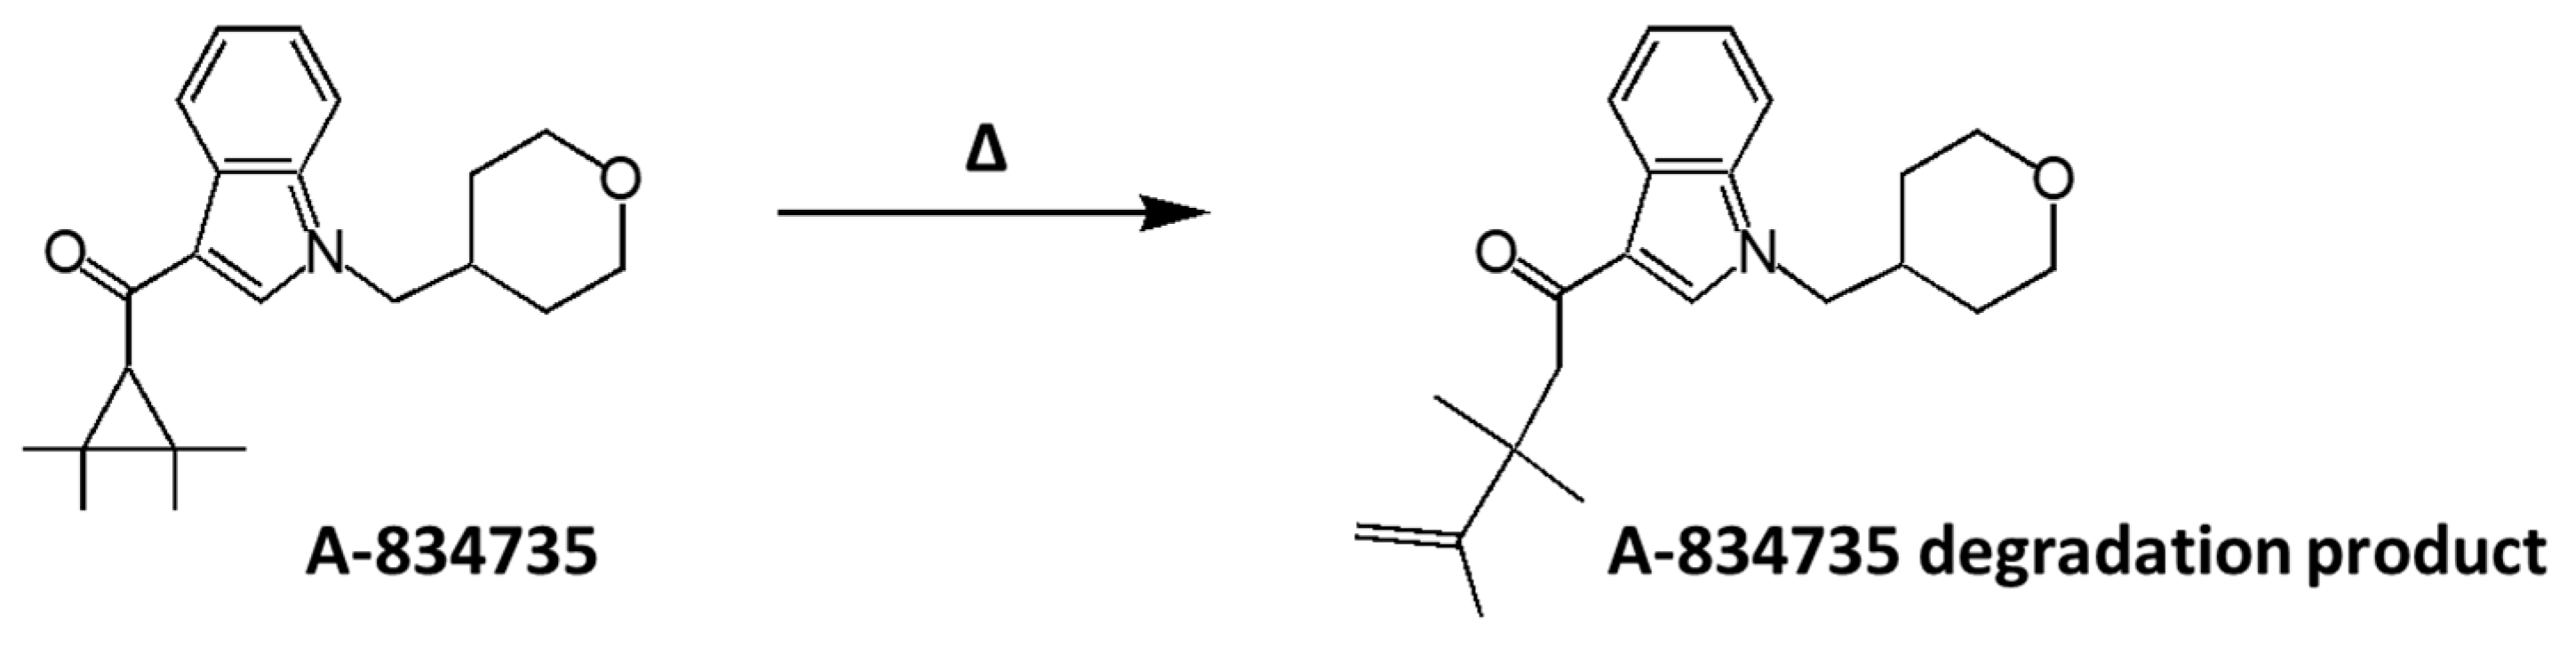
| Synthetic cannabinoids (XLR-11, UR-144, A-834735, and PB-22) | Individual drugs were rapidly heated to 800 °C in quartz capillary tubes under an ambient airflow to approximate the burning end of a cigarette whilst being smoked. Products were trapped on a charcoal and passed to the GC-MS. | Analysis of thermolysis products was undertaken by full-GC-MS (m/z 50–550). | [91] |
| Synthetic cannabinoids (CUMYL-PICA, 5F-CUMYL-PICA, AMB- FUBINACA, MDMB- FUBINACA, NNEI, and MN-18) | Investigations made to simulate the smoking of drugs. | Above 400 °C, toluene, naphthalene, and 1-naphthalamine were formed. A degradative pathway for the liberation of cyanide was shown. | [92] |
Disclaimer/Publisher’s Note: The statements, opinions and data contained in all publications are solely those of the individual author(s) and contributor(s) and not of MDPI and/or the editor(s). MDPI and/or the editor(s) disclaim responsibility for any injury to people or property resulting from any ideas, methods, instructions or products referred to in the content. |
© 2023 by the authors. Licensee MDPI, Basel, Switzerland. This article is an open access article distributed under the terms and conditions of the Creative Commons Attribution (CC BY) license (https://creativecommons.org/licenses/by/4.0/).
Share and Cite
Gould, O.; Nguyen, N.; Honeychurch, K.C. New Applications of Gas Chromatography and Gas Chromatography-Mass Spectrometry for Novel Sample Matrices in the Forensic Sciences: A Literature Review. Chemosensors 2023, 11, 527. https://doi.org/10.3390/chemosensors11100527
Gould O, Nguyen N, Honeychurch KC. New Applications of Gas Chromatography and Gas Chromatography-Mass Spectrometry for Novel Sample Matrices in the Forensic Sciences: A Literature Review. Chemosensors. 2023; 11(10):527. https://doi.org/10.3390/chemosensors11100527
Chicago/Turabian StyleGould, Oliver, Ngoc Nguyen, and Kevin C. Honeychurch. 2023. "New Applications of Gas Chromatography and Gas Chromatography-Mass Spectrometry for Novel Sample Matrices in the Forensic Sciences: A Literature Review" Chemosensors 11, no. 10: 527. https://doi.org/10.3390/chemosensors11100527