Review

Fiber-Optic Nanosensors for Chemical Detection

Institute of Photonics and Electronics, The Czech Academy of Sciences, Chaberská 1014/57, 182 51 Prague, Czech Republic
*
Author to whom correspondence should be addressed.
Chemosensors 2023, 11(10), 521; https://doi.org/10.3390/chemosensors11100521
Submission received: 22 August 2023 / Revised: 20 September 2023 / Accepted: 27 September 2023 / Published: 4 October 2023
(This article belongs to the Special Issue Low-Cost Chemo/Bio-Sensors Based on Nanomaterials)

Abstract

:
Recently, rapid progress has been achieved in the field of nanomaterial preparation and investigation. Many nanomaterials have been employed in optical chemical sensors and biosensors. This review is focused on fiber-optic nanosensors for chemical sensing based on silica and plastic optical fibers. Four types of fiber-optic chemical nanosensors, namely fiber nanotip sensors, fiber nanoarray sensors, fiber-optic surface plasmon resonance sensors, and fiber-optic nanomaterial-based sensors, are discussed in the paper. The preparation, materials, and sensing characteristics of the selected fiber-optic nanosensors are employed to show the performance of such nanosensors for chemical sensing. Examples of fiber-optic nanobiosensors are also included in the paper to document the broad sensing performance of fiber-optic nanosensors. The employment of fiber-nanotips and nanoarrays for surface-enhanced Raman scattering and nanosensors employing both electrical and optical principles and “Lab-on-fiber” sensors are also included in the paper. The paper deals with fiber-optic nanosensors based on quantum dots, nanotubes, nanorods, and nanosheets of graphene materials, MoS2, and MXenes.

1. Introduction

In the last forty years, sensors based on optical fibers have been broadly investigated for chemical sensing and biosensing. The progress achieved in the development of such sensors can be understood from several extensive reviews [1,2,3,4,5,6,7]. Such sensors employ electromagnetic (EM) radiation and light in a wavelength range of 0.2–10 µm. However, visible light is frequently used. Generally, a fiber-optic (FO) sensor consists of several parts. The most important sensor part is a fiber-optic detection element with a detection site (see Figure 1a) in which physical characteristics of EM radiation (amplitude, phase, and polarization) change due to the element’s interaction with analytes. The radiation source and radiation detector are also indispensable parts of optical sensors. An output signal from the detector, usually electrical voltage or current, is treated in data-acquisition electronics.
In the detection site, parameters of EM radiation are changed due to changes in optical properties caused by analytes present there. Optical properties such as the refractive index, absorption and emission spectra, and birefringence are usually used in FO chemical sensors. In direct FO sensors, intrinsic optical properties of analytes are employed. However, many analytes have no suitable intrinsic optical properties for detection, and thus, so-called chemical transducers or biotransducers are used in indirect FO chemical sensors or biosensors. Such transducers interact with analytes in detection sites, and this interaction causes changes in optical properties in the site. These changes can be related to changes in the optical properties of the transducer (e.g., in FO pH sensors) or to optical properties of reactants caused by reactions of the transducer and analyte (immunosensors and enzymatic sensors). Examples of chemical transducers include absorption and luminescence dyes for pH or ion sensors [1,2,3,4,5,6,7]. Antibodies, enzymes, DNA chains, cells, etc., are examples of biotransducers used in optical biosensors [1,2,3,4,5,6,7,8].
The access of analytes into detection sites can be controlled using detection membranes [1,2,3,4,5,6,7,9,10,11]. Such membranes control the amount and concentration of analytes in detection sites through their partitioning characteristics [9]. These characteristics are determined by the membrane morphology, chemical composition, and structure, which influence the access of analytes into the membrane. FO sensors provided with porous xerogel membranes have been used for the detection of gaseous aromatic hydrocarbons in mixtures with nitrogen [9] as well as for sensing toluene dissolved in water [10]. Moreover, such detection membranes can be used for the immobilization of opto-chemical transducers in detection sites. Detection membranes also change the refractive index in detection sites and, consequently, the transmission of EM radiation through them. Detection membranes can be fabricated of polymers [11] or dried gels [9,10].
In FO sensors, optical fibers are employed as detection elements. In optical fibers used in telecommunications, EM radiation is guided in special EM waves and guided optical modes, mainly in fiber cores (see Figure 1b) [12]. However, these EM waves also penetrate fiber claddings at distances of 500–1000 nm. The part of the guided mode in the cladding is called an evanescent wave. The electrical intensity of the evanescent wave exponentially decreases with the distance from the core/cladding boundary. In addition to the guided modes, there are cladding modes propagating in the cladding, usually on short lengths.
The same guiding mechanism as in standard optical fibers occurs in microstructure fibers, i.e., fibers fabricated from one material (e.g., silica) but with air holes in the cladding [13,14]. These holes decrease the average refractive index of the cladding bellow that of the solid core. On the other hand, the photonic band gap guiding mechanism can be found in hollow-core crystal fibers (HCPCF) [13]. Such fibers consist of a large air core surrounded by the cladding of a periodic grid of air holes or a grid of periodically alternating high- and low-index thin layers. Such grids exhibit the photonic band gap at certain wavelengths, due to which radiation in the fiber is confined to the air cores.
Detection sites in fiber-optic detection elements can be found in their optical claddings, as in evanescent-wave sensors, or at distal ends of fibers in contact with their optical cores, as in reflection sensors (see Figure 1a). HCPCFs can employ their air cores for detection. FO sensors with detection sites in the core or cladding can be called intrinsic FO sensors. There are also extrinsic FO sensors in which optical fibers are used for guiding light to and from detection sites.
In the development of FO chemical sensors and biosensors, researchers have mainly employed telecommunication types of optical fibers, such as polymer-clad silica (PCS) fibers and multimode and single-mode silica fibers [1,2,3,4,5,6,7,8,9,10,15,16,17]. Plastic optical fibers (POFs) have also been used [1,2,3,4,5,6,7,15,16,17]. All these fibers are commercially available at reasonable prices. Sensors based on them can profit from easily available light sources, detectors, connectors, couplers, etc. It is worth mentioning that in addition to these silica and plastic optical fibers, chalcogenide optical fibers have also been broadly investigated for chemical sensing and biosensing recently [18,19]. These fibers have an important advantage over silica fibers, and they can be used for sensing in mid-infrared spectral regions where strong and characteristic infrared spectral bands exist. However, special light sources and detectors are used with these fibers, and they are available only from several specialized producers. Thus, a special review would be more suitable for demonstrating the sensing performance of such fibers, as they are not included in this review.
In telecommunication fibers, the ratio of power transmitted in evanescent waves is below 1% [12,20]. It means that analytes in the cladding can change a relatively low optical power, and consequently, the response of the fibers caused by analytes is low. Different approaches have been developed for increasing the ratio of optical power transmitted in the cladding. The approaches based on bending PCS or POF fibers to U-shapes, tapering PCS, single-mode (SM), and multimode fibers (MMF) into fiber tapers and tips, exciting only some optical modes in fiber cores, etc., have been employed [1,2,3,4,5,6,7,11,15,16,17,20]. Moreover, fiber gratings such as long-period gratings (LPG) or tilted fiber Bragg gratings (TFBG) are inscribed into SM fibers (see Figure 2) [15,16,17]. Such gratings are based on the coupling of guided modes into cladding modes, which are sensitive to refractive-index changes in the fiber surroundings. All these approaches enable us to increase the effects of external optical changes on the intensity, phase, and polarization of optical modes transmitted in such modified fibers. These optical changes are provided by absorbance, luminescence, and refractive-index changes caused by analytes.
It is necessary to note that refractometric FO sensors based on silica and plastic fibers can be employed for the detection of refractive indices higher than approximately 1.4. Thus, they are not suitable for refractive-index sensing in aqueous solutions, which is important for biology and medicine. This refractive-index limitation can be overcome using a sensing fiber with a nanometer-scaled metallic layer applied onto the core/cladding boundary. Such layers can be found in FO sensors employing surface plasmon resonance (SPR) [15,16]. The SPR phenomenon is related to the excitation of surface plasmons (SPs) in free electrons moving at the layer surface by evanescent waves of optical modes propagating in the fiber core. Excitation conditions depend on the refractive indices of materials in contact with the metallic layer. A similar effect, called localized surface plasmon resonance (LSPR), takes place at the surface of metallic nanoparticles. It has also been used in FO chemical sensors and biosensors [16]. More about FOSPR sensors can be found in Section 4 of this paper.
A fiber-optic SPR sensor represents a nanosensor in that a novel sensing principle, surface plasmon resonance, is related to the use of nanometer-scale metallic layers applied on the core/cladding boundary. In addition to FOSPR sensors, different approaches for the development of FO chemical nanosensors and nanobiosensors have been investigated in the last thirty years. Such nanosensors are based on fiber-optic tips with apex diameters below 100 nm, nanomaterials such as quantum dots [17,21,22,23], nanoparticles [16,17], nanotubes [17,24,25], nanorods [25], nanolayers [16,17], nanosheets [16,17,26,27,28,29,30,31] etc., applied to fiber-optic cores. Due to nanometric dimensions in a range of 1–100 nm under the definition, nanomaterials exhibit unique physical and chemical characteristics [32]. Nanostructured sensing optical fibers have enabled us to observe novel physical phenomena, such as SPR and LSPR, surface-enhanced Raman scattering (SERS), near-field light effects, etc. Moreover, they offer us the performance for sensing in single cells or very small volumes of analytes, typically femtoliters.
This review deals with fiber-optic nanosensors for chemical sensing based on silica and plastic optical fibers. It is focused on four types of FO nanosensors, namely fiber-optic nanotips, nanostructured optical fiber arrays, FOSPR sensors with metallic nanolayers or nanoparticles, and fiber sensors employing quantum dots, nanotubes, nanorods, and nanosheets applied in their claddings. In fact, a reader can find several extensive reviews dealing with fiber-tip nanosensors [33], arrays of fiber nanotips or nanowells [34], SPR sensors [16], and fiber-optic nanomaterial-based sensors [17]. However, these reviews deal more with biosensors, although some chemical sensors are also mentioned in them. This review deals with all four types of fiber-optic nanosensors and is more focused on FO chemical nanosensors and fabrication techniques of sensing fibers. FO nanobiosensors are cited in this review to document the broad sensing performance of the discussed fiber-optic nanosensors. This review also includes some novel references showing approaches not mentioned in the previous reviews.

2. Fiber-Optic Nanotip Sensors

Optical, chemical nanosensors and nanobiosensors based on fiber-optic (FO) nanotips can provide us with reliable methods for monitoring chemicals in microscopic samples and detecting chemicals within single cells [33]. FO nanotip sensors offer us significant improvements over methods of cellular analysis, such as direct loading of cells with fluorescent indicators. These nanosensors exhibit several useful characteristics for cellular analysis. They are biocompatible and can protect the intracellular environment from the effects of dyes injected during direct loading. Their nanometer sizes minimize physical perturbation of the cell, and their small size can provide a fast response time for the sensor. Opto-chemical transducers are immobilized on nanosensor surfaces and do not suffer from diffusion in the cell. The first papers on FO nanotips and nanotip sensors were published around 1990 [35,36,37]. Papers on the development of such sensors can be found approximately until 2010. Since then, the number of articles has decreased. This decrease may be related to the broad use of luminescence nanoparticles (probes embedded in localized environment, PEBBLEs) [38,39,40]. Such nanoparticles have been employed intensively for intercellular chemical analysis [38,39,40]. They can be fabricated by well-elaborated chemical methods, which are probably less complicated than techniques used for the fabrication of FO nanotips. However, their insertion into cells is more complicated than that of FO nanotips. They can also require sophisticated optical instruments for their interrogations.
A fiber-optic nanotip is represented by an optical fiber element with one end elongated into a sharp tip with an apex. In this paper, fiber tips with apex diameters in a range of 20–100 nm are considered nanotips. However, in some papers, this term is also used for fiber tips with apex diameters below one micrometer. The term submicrometer tips used in some papers seems more suitable for tips with apex diameters from 100 to 1000 nm. In some papers, published results are not related to precise information on the tip apex diameters.
Transducers are usually immobilized in detection sites on the tip apex. Nanometer dimensions of the apex mean that all optical changes in the site take place in the near- field of EM waves transmitted through the site. In fact, FO nanotips have successfully been employed for scanning near-field optical microscopy (SNOM) [41].

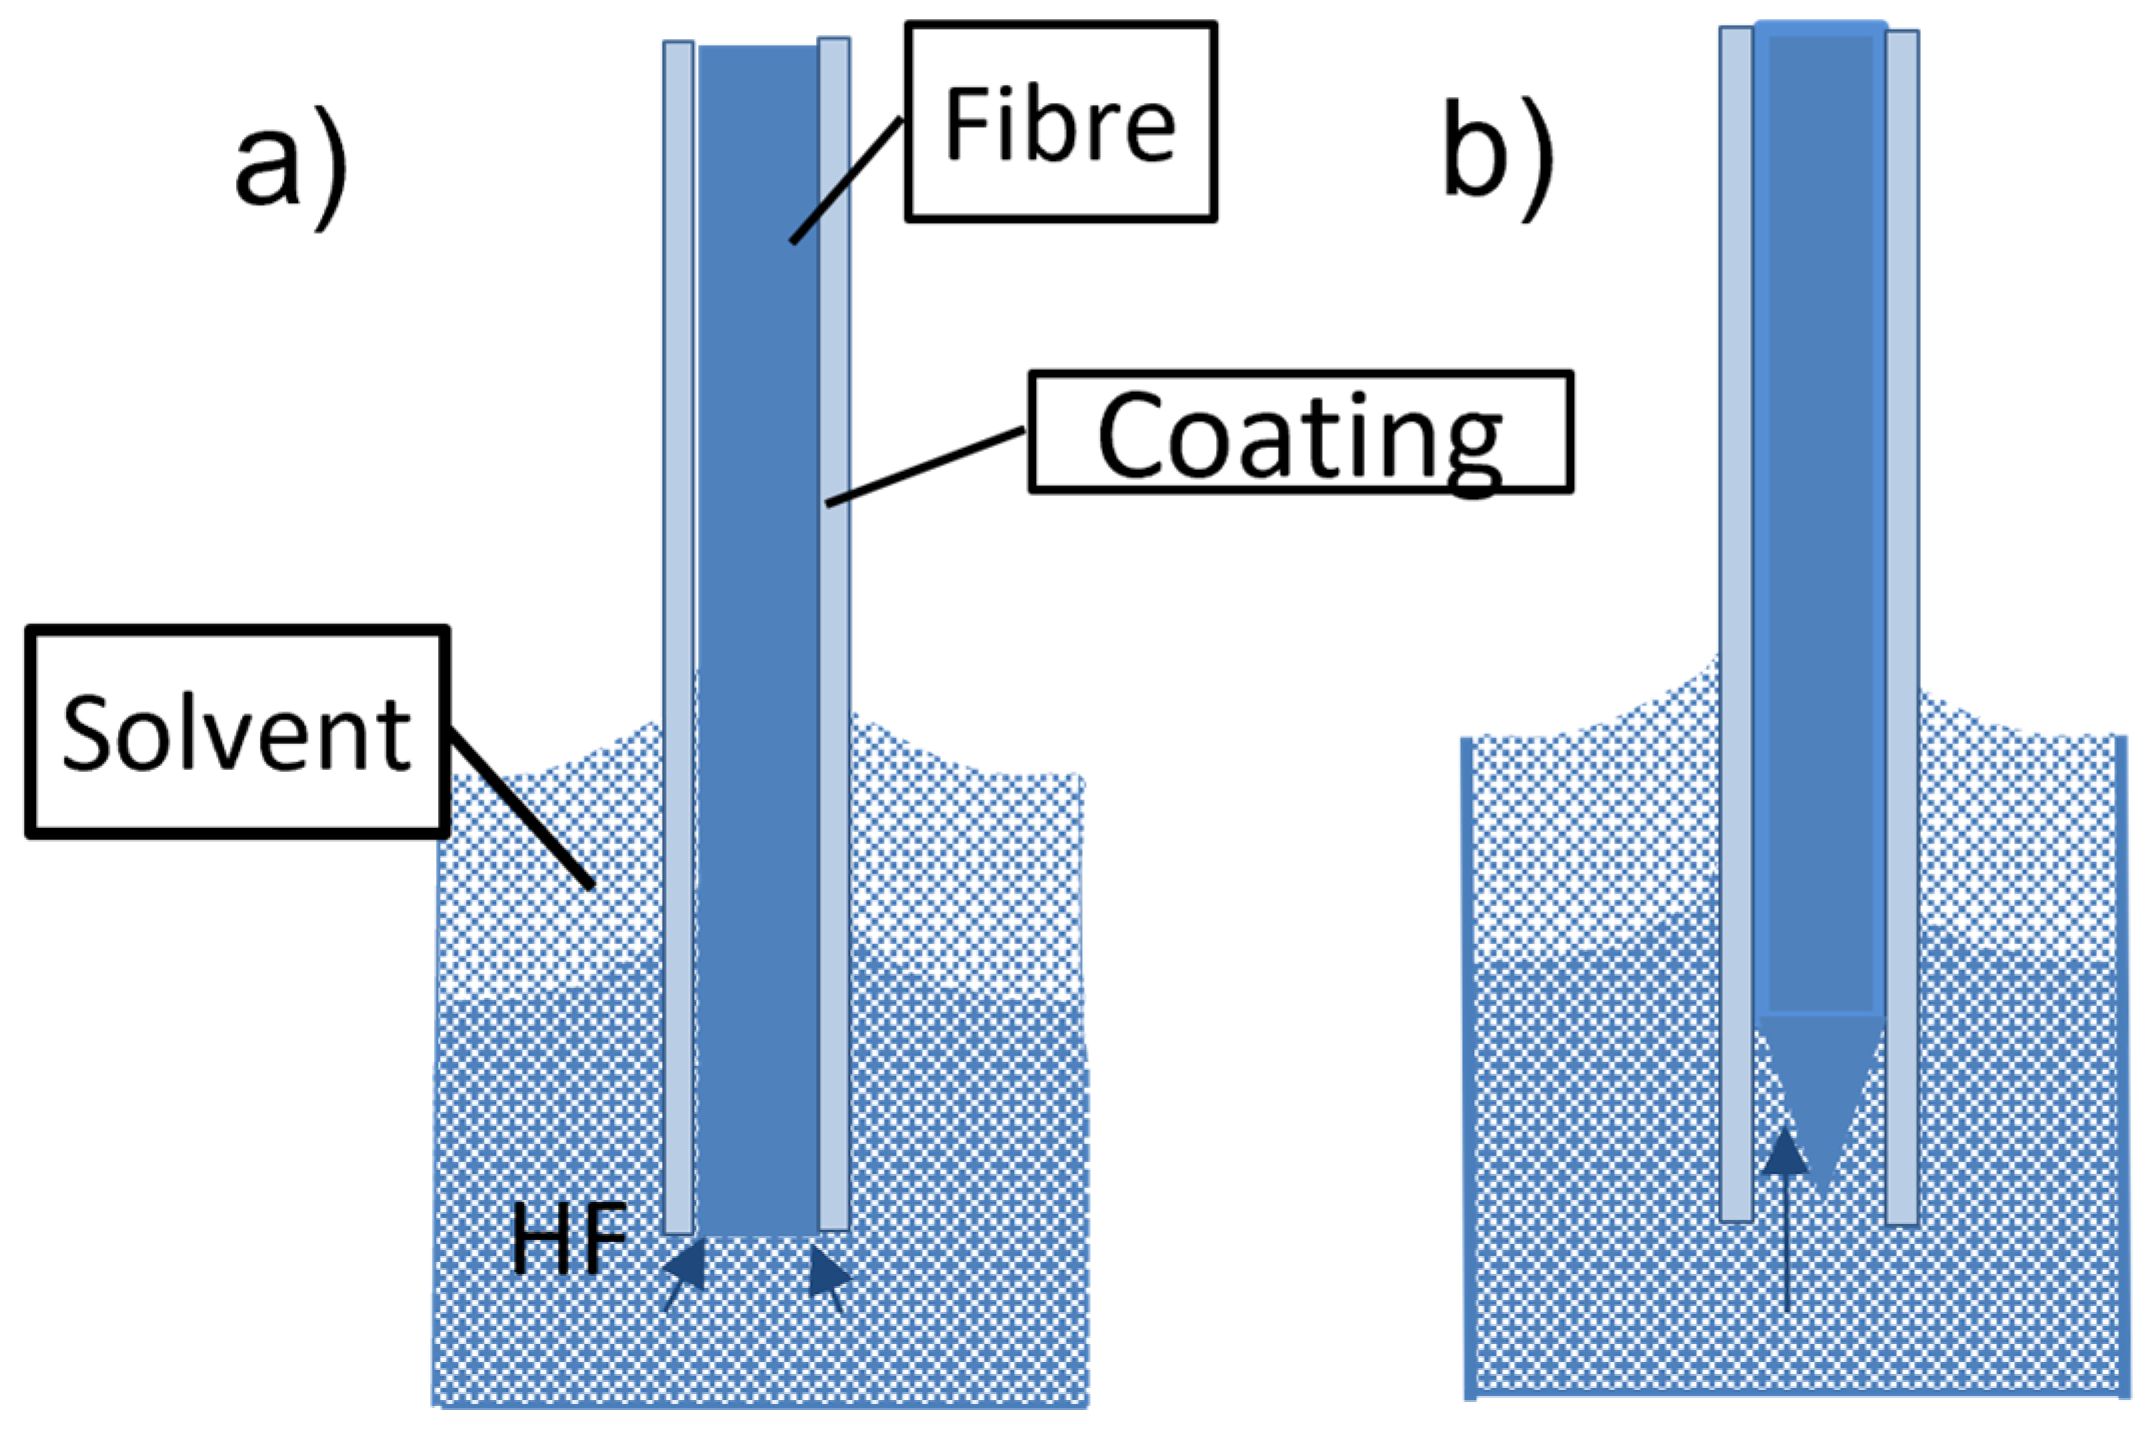
2.1. Fiber Nanotip Preparation

To prepare fiber-optic nanotips, different methods have been employed. They include high-resolution micromachining, focused ion beam milling (FIB), femtosecond laser machining, lithography, photopolymerization, thermal pulling, and chemical etching. The principles and performance of such techniques have been reviewed elsewhere [33,42]. FIB, lithography, femtosecond laser machining, and high-resolution micromachining require complex and costly devices. The technique based on grinding and polishing is simple and low-cost. However, it is more suitable for the preparation of fiber microtips [42]. High-resolution micromachining has been used only for the fabrication of nanoarrays on the end of a single fiber and not for the preparation of fiber nanotips [42]. Photopolymerization has been employed for the application of sensing nanomembranes on fiber tips but not for tip preparation. Thus, thermal pulling and chemical etching are discussed in detail in this paper.
The thermal pulling technique is schematically described in Figure 3. The technique uses a heat source, gas torch, or CO2 laser that heats a bare part of a fiber element while tension is applied along the major axis of the element. The fiber is fixed in clamps so the applied tension can be controlled. By heating silica glass fibers at temperatures above 1600 °C, viscous flows in glass are induced. These flows and the glass surface tension, together with the applied external tensions, cause a decrease in the diameter of the bare fiber part and fiber elongation. A biconical taper is produced at first (see Figure 3b). This taper has a short central part, the waist, with a constant diameter. By continuing the heating, the taper is broken, and two fiber tips are produced (see Figure 3c). By controlling the heating temperature, the tensions applied to the element, and the heating duration, fiber tips with minimum apex diameters of approximately 20 nm can be fabricated by this technique [43]. The thermal pulling process is rapid (~3 s) and produces smooth tips. It is not very reproducible with respect to tip apex diameters and taper cones. It can be realized on a commercially available micropipette puller, which is relatively expensive. An example of a fiber tip produced by the thermal pulling of a silica fiber with an outer diameter of 125 µm to a microtip taper of 0.6 µm in diameter is shown in Figure 4. Such tapers have been fabricated at the author’s laboratories on a laboratory thermal-pulling device.
The following method for the fabrication of fiber nanotips on the ends of optical fibers is chemical etching, which is an inexpensive and effective alternative to thermal fiber pulling. Chemical etching of silica glass materials is based on chemical reactions of silicon and/or germanium dioxides with hydrofluoric acid described by Equations (1) and (2).
SiO2 + 6HF ⇒ H2SiF6 +H2O,
GeO2 + 6HF ⇒ H2GeF6 + H2O.
The formed silicon and germanium hexafluoro acids are adsorbed on the fiber surface. Due to differences in the etching rates of the oxides and solubility of the acids in etching solutions, there are differences in the etching rates of fiber core and cladding.
Two different types of the chemical etching method have been reported. The first one is Turner etching [44,45]. This etching is schematically illustrated in Figure 5. It uses an etchant, i.e., an aqueous solution of hydrofluoric acid (HF), and a protective organic solvent that is immiscible with the HF solution (e.g., oil and toluene). These liquids form two phases in a container (see Figure 5). When a bare fiber is dipped into the container, the etchant forms a meniscus with an initial height due to capillary elevation (Figure 5a). As etching proceeds, the meniscus height decreases progressively due to the reduction in the fiber diameter (Figure 5b). This decrease leaves the etched part in contact with the organic solvent. The etching process stops when the fiber part below the solvent is completely etched, forming the tip (Figure 5c). This technique can produce fiber tapers with large taper angles, which increases the radiation power reaching the tip apex. Tip diameters are comparable with those of thermal pulling. Tips exhibit smooth surfaces. However, due to temperature fluctuations and fiber vibrations, the reproducibility of this technique is not high, and tip dimensions can vary from batch to batch.
In the Turner etching described above, the fiber does not move. However, there is a dynamic etching method [46,47,48] in which the etched fiber moves vertically, either up or down at a certain speed. This speed determines the final tip shape. The dynamic etching method can also use an etchant and a protective organic solvent, as in the Turner method [47,48], or only an etchant solution can be employed [46]. Using the dynamic etching method, tips with short tapers and nanometer apexes can be successfully fabricated. Moreover, multiple tapered tips can be prepared using different dynamic regimes [46].
There is another variant of the dynamic etching method that employs the independent rotations of a container with an etchant, protective solvent, and etched fiber [49,50]. Both the container and fiber rotate around the same axis. Using different dynamic regimes of rotation during this process, it is possible to vary the cone angle, the shape, and the roughness of the nanotips. Hydrodynamic flows during the process are analyzed theoretically [50].
Another type of chemical etching method is called tube etching [51,52]. This technique has less susceptibility to external parameters than the Turner method. Tube etching is schematically described in Figure 6. In this technique, a silica fiber with a polymeric protective jacket is immersed in an aqueous HF solution (see Figure 6a). In the process, HF etches the fiber, not the polymeric jacket. Protective solvents can also be used to prevent HF evaporation. However, it does not contribute to the etching mechanism. During the beginning of the process, HF starts to etch the flat fiber end (see Figure 6a). Outer parts of the fiber end close to the jacket/fiber boundary are etched slightly faster than its central part (see arrows in Figure 6a). This effect can be explained by accelerated diffusion of HF in these parts [52]. When the fiber near the fiber/jacket boundary is etched away, an initial cone is formed, and the jacket acts as a wall. Due to HF concentration gradients around the cone, convective microflows in the etchant are formed (see an arrow in Figure 6b), which causes the fiber to be etched into a tip with a smooth surface. To stop the etching process, the fiber has to be withdrawn from the etching solution. The tip is rinsed with water. The tube etching process is very reproducible.
It is worth mentioning that in addition to etching solutions containing HF (usually approximately 50% wgt.), buffered etching aqueous solutions employing HF and NH4F have also been used for the preparation of fiber nanotips [53]. Chemical reactions during etching with such etching solutions can be generally described by Equations (1) and (2) and by Equations (3) and (4) as well.
H2SiF6 + 2NH4F = (NH4)2SiF6 + 2HF,
H2GeF6 + 2NH4F = (NH4)2GeF6 + 2HF.
It was found that tip dimensions are influenced by a volume ratio of HF and NH4F in etching solutions and by etching time [53].
These types of chemical etching take approximately 1–2 h, which is a longer process than thermal pulling. However, they can be realized using the equipment of a standard chemical laboratory. Caution should be expended when working with a rather dangerous HF.
Fabricated fiber nanotips are usually coated with a layer of silver, aluminum, gold, carbon, or ceramics in order to ensure the mechanical strength of the taper and support the confining of transmitted radiation in the taper cone. The thickness of such a layer is approximately 50–200 nm. During its deposition onto the tip, it is important to keep the tip apex free of the coated material that allows us to bind chemical and biological transducers on the tip apex. However, fiber tips with apex diameters larger than 200 nm have also been employed for the development of fiber tip sensors without any metallic or ceramic layer [54,55,56].

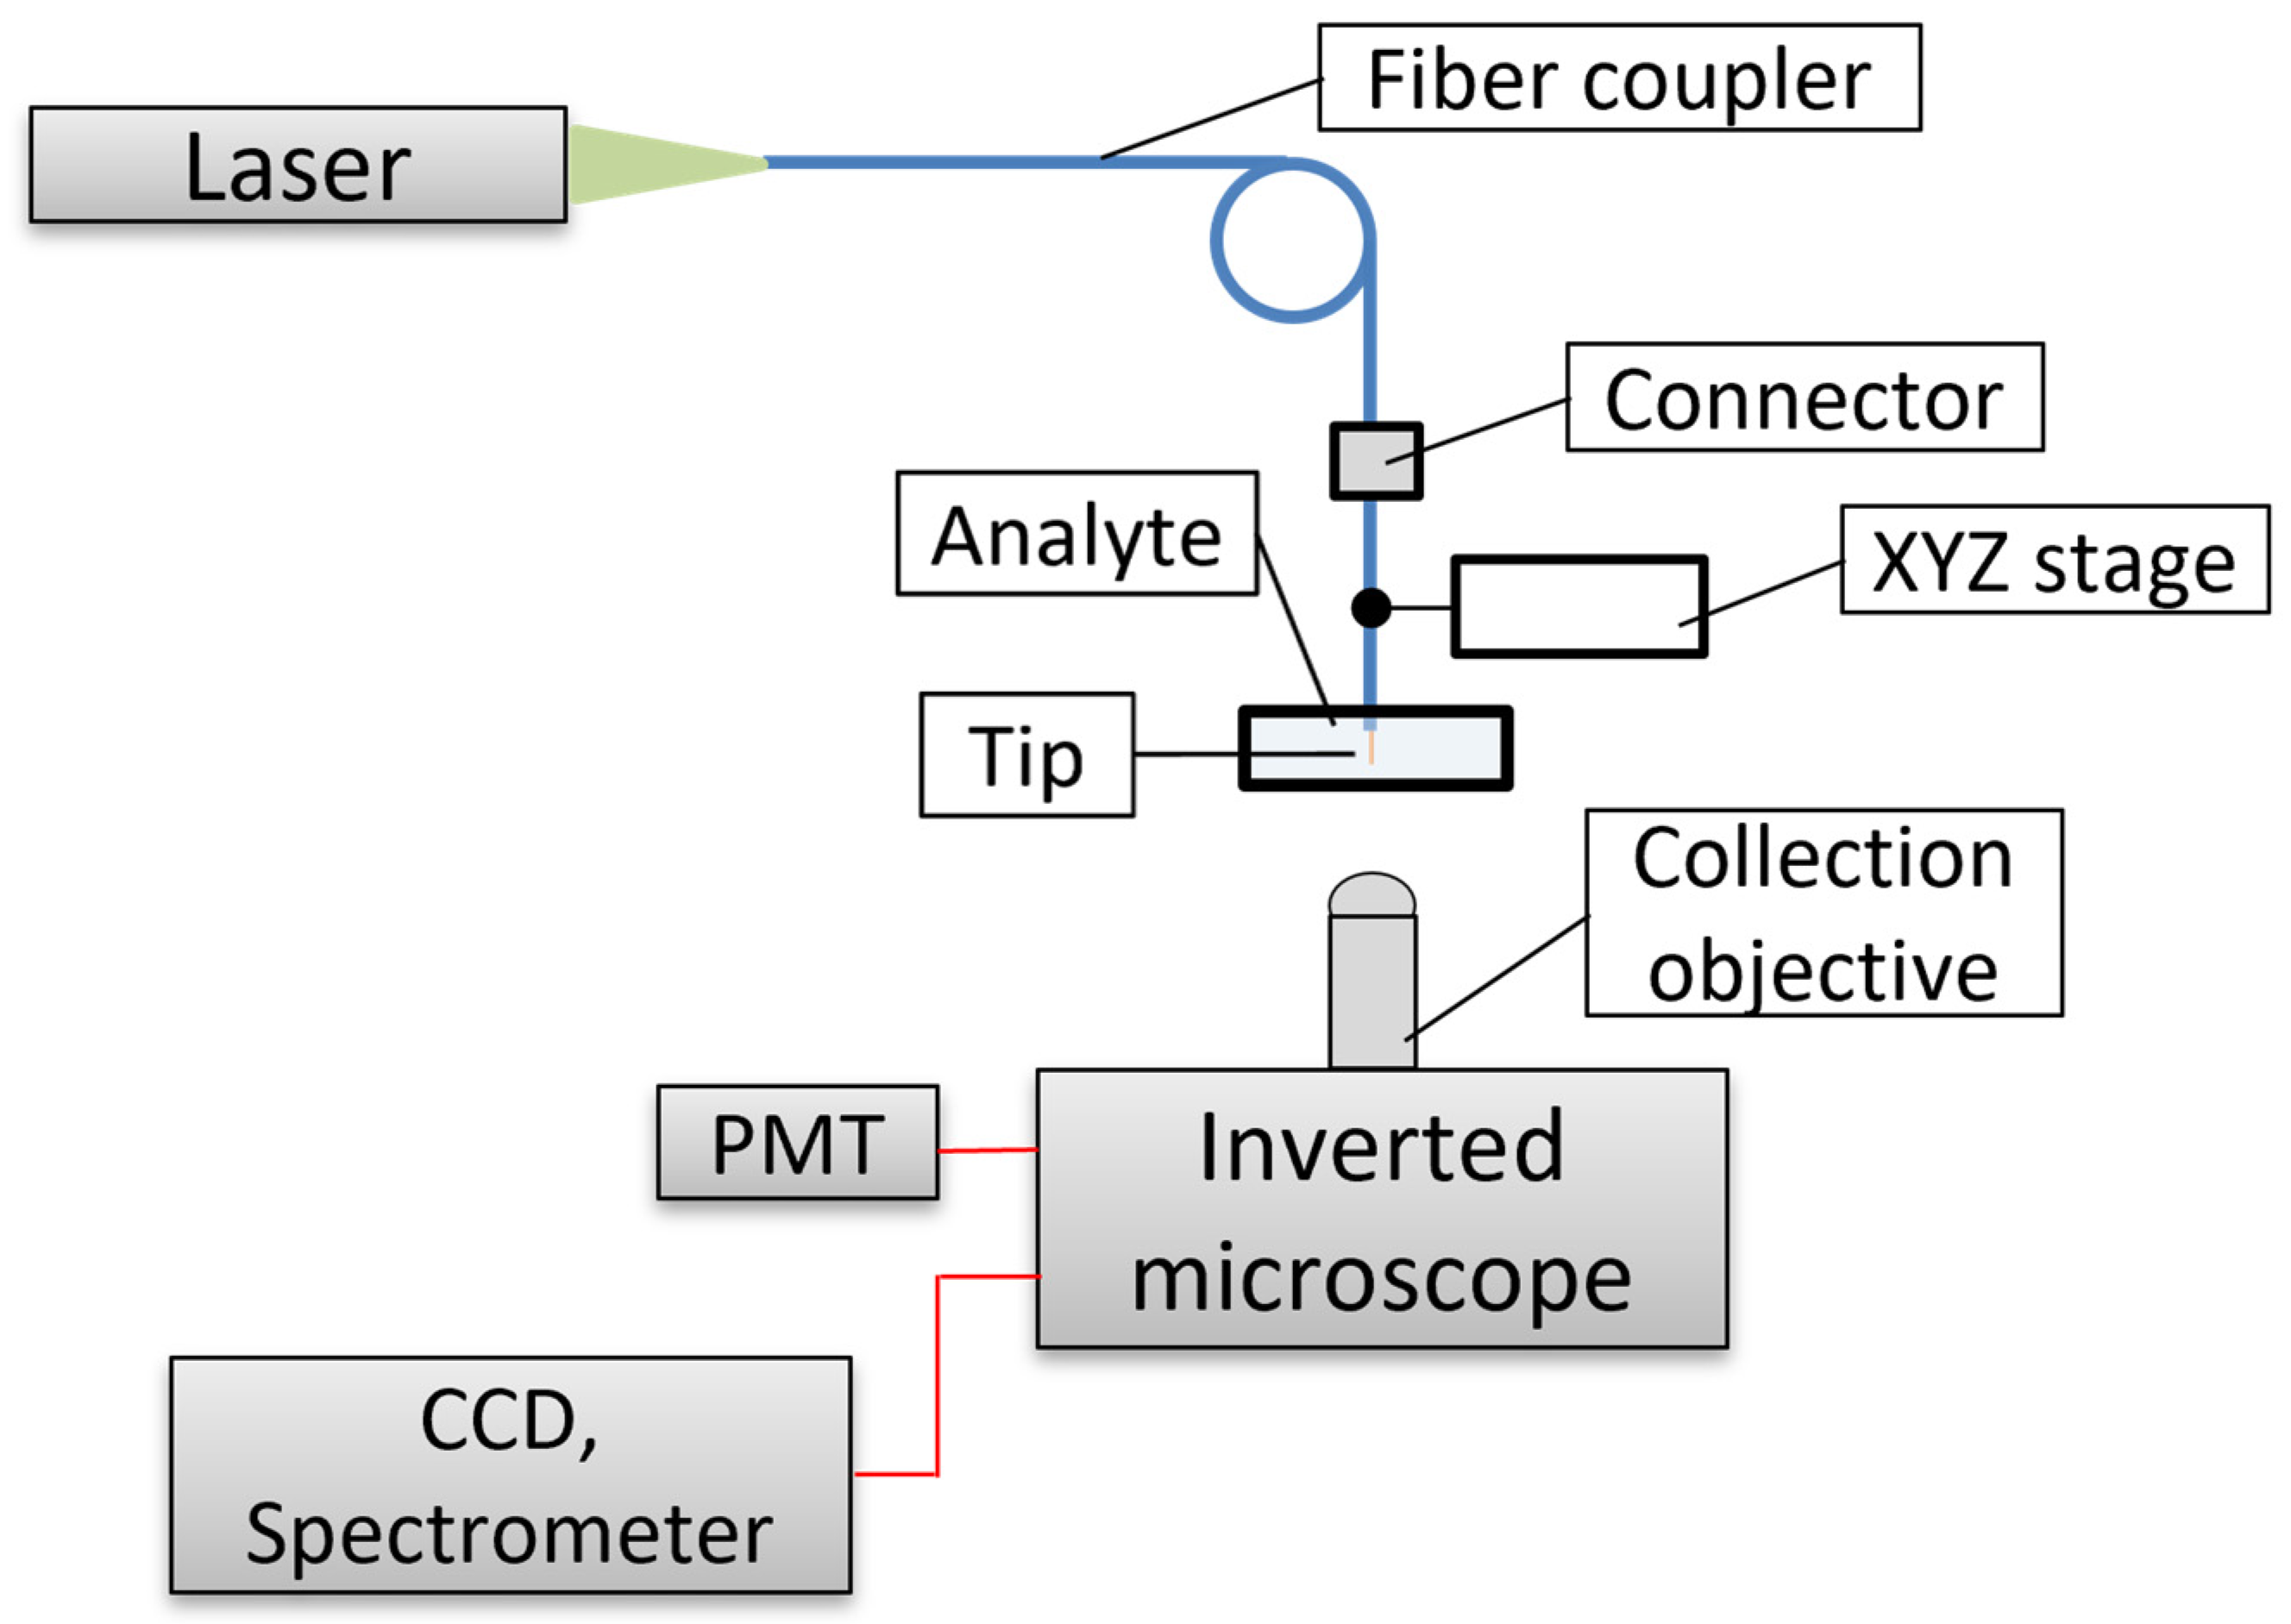
2.2. Fiber Nanotip Sensor Functionalization and Interrogation

The research of fiber nanotip–chemical sensors and biosensors was mainly developed from 1992 to roughly 2010. After the first paper on fiber nanotip pH sensors was published in 1992 [36], a series of papers on chemical sensors and biosensors based on fiber nanotips followed. Fiber nanotips prepared from telecommunication types of optical fiber by thermal pulling or chemical etching can be employed, as well as commercially available SNOM fibers which are provided by metal coatings [41]. In order to employ fiber nanotips for chemical sensing and biosensing, they must be modified with proper sensing membranes and/or opto-chemical transducers or biotransducers. For such modifications, fiber nanotip surfaces are functionalized by silanization. Silanization provides us with chemical groups, making strong bonding of membranes and transducers onto tip surfaces possible. Other functionalization approaches, such as surface-assembled monolayers (SAM) [8], have not been applied to the development of fiber nanotip sensors. As sensing membranes for fiber nanotip chemical sensors, photocurable or thermally curable polymers were employed [36,57]. Such membranes immobilize chemical transducers onto fiber tips. Biotransducers are immobilized onto fiber tips by interacting with the silanized tip surface.
When using photocuring, a silanized fiber nanotip is dipped into the proper monomer, and curing radiation (e.g., from a 488 nm-Ar laser) is launched into the proximal fiber face. Radiation is guided in the fiber core to the nanotip apex, where photopolymerization occurs near the optical field. A small cone with dimensions comparable to the apex diameter is formed on the apex [58]. Polymers such as acrylates, poly vinyl chloride, and dextran can be used for the fabrication of sensing membranes on fiber nanotips. In the case of thermal curing, a fiber nanotip is immersed in a proper monomer that is subsequently thermally cured. However, this thermal curing usually requires a catalyst and the control of the thickness of the sensing membrane is difficult. It is produced anywhere on the immersed fiber.
Changes in luminescence, usually fluorescence, taking place when a fiber nanotip sensor is in contact with detected chemicals, are usually used in fiber nanotip sensors. Because of small sample volumes in contact with sensing nanotips on the order of femtoliters [36], the number of analyte molecules in the excitation volume is also small on the order of several thousands of molecules. Therefore, sensitive devices capable of measuring weak fluorescence signals must be used for analysis.
A principal set-up used for measuring with fiber nanotip sensors is schematically shown in Figure 7. A more specific description of such a set-up can be found elsewhere [59]. The main part of the set-up is an inverted fluorescence microscope with a detector such as a photomultiplier tube (PMT) or avalanche photodiode for intensity measurements, a spectrometer for spectra measurements, and/or a CCD camera for target imaging. Dichroic mirrors, filters, and objectives are other parts of the microscope. A fiber nanotip sensor is fixed on a three-way X,Y,Z translational stage, making its precise insertion into a sample possible. Radiation from a laser is launched into the sensor using a fiber coupler. It excites the fluorescence of a transducer immobilized on the sensor nanotip. The emitted fluorescence signal and remaining excitation radiation are collected by the microscope collection objective. The rest of the excitation radiation is filtered out by a notch filter, and fluorescence is detected by PMT or by spectrometer. In this set-up, fluorescence signals emitted in the direction of the tip axis are detected. One can also find another experimental set up used for sensing with fiber-optic nanotip sensors [49]. In the set-up, fluorescence emitted from the sensor nanotip is registered in the direction perpendicular to the tip axis. The fluorescence is collected by a GRIN lens coupled with a multimode optical fiber. The excitation radiation scattered from the tip apex is also filtered out in this set-up.

2.3. Fiber Nanotip Chemical Sensors

Fiber nanotip chemical sensors have been tested for the detection of pH, different ions, nitric oxide, etc. Selected examples of such sensors are reported in Table 1. They were developed using fiber-optic tips with apex diameters of 50–700 nm. These tips were fabricated from multimode [54,55,60] and single-mode optical fibers [55,61] using thermal pulling methods or the tube etching technique [55]. Commercially available nanotip fibers (SNOM) were also used [54,55]. Only some of these nanotip fibers were provided with metal layers of aluminum [54,55,61] or silver [60]. Some fiber tips were used without any metal coating [54,55,56].
Fiber nanotip chemical sensors have employed different chemical transducers (see examples in Table 1). In pH, oxygen, and Ca2+ FO nanosensors, simple fluorescence transducers, acryloylfluorescein, Ru(II) phenanthroline complexes, and calcium green-1dextran dye, respectively, were employed. Other dextran-immobilized transducers, such as 2′,7′-bis-(carboxyethyl)-5(6′)-carboxyfluorescein (BCECF) pH transducer, were also employed in fiber nanotip chemical sensors [62].
Table 1. Examples of fiber nanotip and submicrometer-tip chemical sensors.
TransducerTip Apex Diameter [nm]PolymerReference
pHFluoresceinamine derivative100polyacrylamide[36,57]
Ca2+Calcium green-dextran100-[60]
OxygenRu complex 1100polyacrylamide[63]
pHBTB-Ru complex 150 and 300polyHEMA[54]
ClCl carrier-CTAB and
Chromoionophore 1
50 and 300PVC[54]
ClIndium porphyrine and
chromoionophore 2
300–700PVC[61]
NO2vitamin B12 derivative and
chromoionophore 3
300–700PVC[61]
K+Valinomycin and chromoionophore 4 50 and 300PVC copolymer[55]
RI-50-[56]
In Table 1, the fluoresceinamine derivative is acryloylfluorescein, and calcium green-dextran is calcium green dye immobilized on dextran polymer. BTB—bromothymol blue, Ru complex 1-Ru(II)-tris(1,10-phenanthroline), polyHEMA—poly(2-hydroxyethyl methacrylate), chromoionophore 1—ion pair BTB and Ru(II)-tris(4,40-diphenyl-2,20-bipyridyl)2+, chromoionophore 2-9-(diethylamino)-5-[(2-octyldecyl)imino]benzo[a]phenoxazine, chromoionophore 3-9-dimethylamino-5-[4-(16-butyl-2,14-dioxo-3,15-dioxaeicosyl)-phenylimino]-5H-benzo[a]phenoazine, chromoionophore 4 4′,5′-dibromfluorescein octadecyl ester, PVC copolymer–copolymer of vinyl chloride, vinyl acetate, and vinyl alcohol. RI abbreviates the refractive index.
Fiber nanotip chemical ion sensors based on the ion-exchange concept have also been employed in fiber nanotip ion sensors [54,55,61]. Such a sensor employs a PVC membrane containing ionophore (ion carrier) and chromoionophore together with some additives. Fluorescence pH indicators are used as chromoinophores [54,55]. In some experiments, the reference fluorescence dye, Nile red, was immobilized in the membrane. It enabled ratiometric fluorescence measurements [55]. The ion pair of BTB and Ru complex 1 was also employed as a chromoionophore [54]. In this case, fluorescence resonance energy transfer (FRET) occurred from the complex to BTB. As the absorbance of the BTB basic form overlapped the Ru(II) complex emission, the fluorescence decay time of this complex was reduced. This reduction is related to the concentration of protons in the membrane that is correlated with the concentration of the detected ion. A commercially available fluorescence dye, Calcium green, immobilized on dextran, was tested for selective Ca2+ detection [60] and in pH sensors [54]. A pH sensor based on two fluorescence dyes immobilized in photocurable polymer on a fiber nanotip was also reported [62].
A fiber nanotip sensor has already been tested for refractive index detection [56]. In such a sensor, neither the sensing membrane nor the transducer was applied on the sensor nanotip. The intensity of light transmitted from the tip apex through a sample to a detector was registered. It was found that the sensor was capable of measuring refractive-index changes in aqueous solutions. A high detection sensitivity of 8000%/RIU was determined from a calibration curve. Moreover, the pH dependence of the transmitted intensity was determined from measurements with aqueous solutions of acetic acid.
Developed fiber nanotip chemical sensors were characterized on bulk samples. It was found that a pH nanotip sensor based on a fluoresceinamine derivative was capable of measuring pH changes when inserted in 10 µm-diameter pores of polycarbonate membrane [57]. The response time of such a nanosensor was 300 ms. The sensor was reversible and stable concerning pH changes.
Fiber nanotip chemical sensors have been successfully tested for sensing inside biological samples. The first paper on such an application was reported in 1992 and dealt with pH sensing in blood cells, frog cells, and rat embryos [36]. In experiments with rat embryos, the nanotip pH sensor was inserted into the extraembryonic space of a rat embryo and used for measurements of pH values there. Results were successfully compared with pH values obtained by measuring microscopic samples containing approximately 1000 such embryos. Fiber nanotip chemical sensors have also been employed for measurements of nitrite and chloride ion levels in rat conceptuses [61]. A four-time increase in the chloride activity due to exposing the cells to pure nitrogen was determined.
Another paper reported on fiber nanotip chemical sensors for measurements of pH and sodium ion concentrations inside a single mouse oocyte [64]. Effects of stimulating the cells with kainic acid on relative Na concentrations were observed. Measurements of Ca2+ concentrations have also been performed in single, living smooth muscle cells and single, living cardiomyocytes using a nanosensor based on Calcium green dye [60]. Effects of the cell stimulations with potassium buffer on the measured fluorescence intensity were observed. Submicrometer fiber tip chemical sensors were also tested for pH sensing in live neural colonies and mouse brain slices [65]. In the paper, fiber sensors of pH, Ca2+, and oxygen H2S are reported without details regarding the transducers used. The tips with apex diameters from 200 to 800 nm were used for the preparation of the sensors. In another paper, a fiber nanotip without any chemical modification was employed for monitoring concentration changes in Ca2+ in differentiated mouse neuroblastoma X rat glioma hybrid cells and vascular smooth muscle cells using fiber nanotips with apex diameters in the range of 50–500 nm [66]. The cells were loaded with fluorescence dye sensitive to changes in Ca2+ concentration. In experiments, a fiber nanotip was inserted into the cells and used for local fluorescence excitation. The fluorescence intensity was measured by an avalanche photodiode. By moving the tip inside the cell, an image of the fluorescence intensity was registered. Temporal effects of the stimulations of the cells with drugs, such as ionomycin and bradykinin, on the fluorescence intensity were also monitored with fiber nanotips 50–100 nm in diameter.

2.4. Fiber Nanotip Biosensors

Fiber-optic nanotips have been successfully employed in optical biosensors. The reader can find reviews on such nanobiosensors elsewhere [33,67]. Several examples of nanobiosensors discussed below can illustrate the performance of fiber-optic nanotips for biosensing, particularly in cells. A fiber nanotip biosensor was reported for the detection of benzo[a]pyrene tetrol (BPT) [68,69]. It is known that BPT is one of the metabolites of benzo[a]pyrene in cells. It can form adducts with DNA which can be related to its carcinogenic effects. BPT has an intrinsic fluorescence that can be employed for its detection. Fiber-optic tips with apex diameters of 25–40 nm were used for sensor fabrications. In the sensor, the tip was functionalized with BPT antibody by covalent binding on the silanized tip. This antibody allows us to selectively bind BPT due to immunoreaction. The sensor was excited by a HeCd laser at 325 nm and emitted BPT fluorescence was detected by a detector (PMT). The sensor was characterized on mammary carcinoma cells and rat liver epithelial cells incubated with BPT. These cells are spherical with diameters of approximately 10 µm. A dynamic range of 0.006–1.6 nM and a limit of detection of 0.006 nM were determined from calibration curves [70]. From these curves, an average detection sensitivity of approximately 7000 nM−1 can be estimated.
Several other fiber nanotip biosensors have been developed, as can be found in review articles [33,67]. These biosensors include those for the detection of nitric oxide [71], caspase-9 [70], glutamate [72], cytochrome c’ [73], DNA [49], etc. Biotransducers for some fiber nanotip biosensors are shown in Table 2. Caspase-9 was detected using a modified enzymatic assay based on leucine–glutamic acid–histidine–aspartic acid ↔ 7-amino-4-methylcoumarin (LEDH ↔ AMC) that is immobilized on the fiber nanotip [70]. Caspase-9 cleaves nonfluorescent LEDH ↔ AMC and the fluorescence of free AMC is detected in the sensor. Anti-cytochrome c’–biotin immobilized on the sensor nanotip is used to bind cytochrome c’ to the tip [73]. An enzyme-linked immunoassay sorbent is used for the detection of cytochrome c’ bound on this antibody.

2.5. Fiber-Optic Nanotip Sensors for Raman Spectroscopy

The sensing performance of fiber nanotip chemical sensors and biosensors can be further enhanced by coating them with metallic nanoparticles or metal islands. Such fiber-optic structures enable us to employ surface-enhanced Raman scattering (SERS) for detection. It is well known that Raman spectroscopy allows us to investigate molecules, cells, viruses, etc., at molecular, nanoscopic, and microscopic levels [74]. This spectroscopy employs inelastic Raman scattering. Both qualitative and quantitative information can be obtained from Raman spectra. While the qualitative information can be directly determined from the wavelength position of vibrational spectral bands, the quantitative information can be limited by low Raman scattering cross-sections. This limitation can be overcome, and the cross-sections can be highly increased using nano-textured surfaces in SERS sensors. In addition to common nanostructured substrates, electrodes, sols, metal films, and nanomaterial-modified fiber nanotips have also been employed in SERS sensors. Such sensors were fabricated by applying silver and gold nanoparticles or nanoislands on surfaces of tips obtained by chemical etching. For such applications, fiber nanotips were silanized to enhance the binding of metal nano-objects on the surface. Electron beam evaporation [75] and wet chemical synthesis [76,77,78] were employed for the fabrication of such nano-objects. It is known that metal nano-objects (nanoparticles, nanorods, and nanoislands) support the excitation and propagation of localized surface plasmons (LSPs) [16,74]. If an absorption spectrum of LSP overlaps with excitation and emission SERS wavelengths, Raman scattering is highly enhanced. Confocal microscopes [74], inverted fluorescence microscopes [78], and Raman spectrometers were used to measure Raman spectra.
A pH sensor based on SERS was developed [75]. The sensor used a tip with an apex diameter below 100 nm that was coated with a silver layer of 6 nm in thickness using electron beam evaporation. The layer with such a small thickness was not continuous, but it was formed of silver islands. As a pH transducer, p-mercaptobenzoic acid (MBA) was bound to these islands. The nanotips were interrogated by confocal microscopy. A spectral band of 1425 cm−1, shifting due to pH changes, was employed in this pH sensor. The sensor was also used for pH measurements in cells.
In another paper [76], gold nanoparticles with diameters in the range of 50–60 nm prepared by chemical wet synthesis were applied onto a fiber nanotip with an apex diameter of 40 nm. Such fibers were successfully employed for measuring Raman spectra of Rhodamine 6G in aqueous solutions. The excitation radiation from a 633 nm laser was launched into the proximal fiber face. The excited SERS radiation was detected at the proximal face, too. A remote interrogation scheme was also used for measurements with a fiber nanotip SERS sensor employing silver nanoparticles coated on the tip [77]. A double-tapered fiber tip was prepared by the Turner method. However, there is no specific information regarding the tip dimensions in the current literature. The sensor was used for measuring Raman spectra of solutions of crystal violet at concentrations higher than 1 nM.
Silver nanoparticles modified with 4-mercaptopyridine (Mpy) were also used for the development of a SERS fiber nanotip sensor [78]. The modified nanoparticles were coated on a fiber nanotip using laser-induced Ag deposition from silver nitrate and Mpy solution. Nanoparticles with diameters of approximately 100 nm were applied. Such fiber nanotip SERS sensors were used for pH detection. An inverted microscope was used to register SERS radiation from samples that were excited by the tips.
Results of theoretical modeling of fiber nanotip SERS sensors based on Au nanoparticles and MBA were reported [79]. It was found that the nanoparticle diameter has a high effect on the electrical-field enhancement between nanoparticles. On the other hand, tip dimensions do not exhibit significant effects on MBA spectra. Based on this modeling, fiber nanotips with an apex diameter of 50 nm coated with gold nanoparticles of 60 nm in diameter were experimentally realized

2.6. Fiber-Optic Nanotips for Electro-Optical Detection

It is worth mentioning that metal-coated fiber nanotips have been investigated for electro-optical nanosensing [80]. Such nanoprobes allow us to detect both electrical and optical signals in real-time with high spatial resolution. The approach was employed in living cells for detecting hydrogen peroxide using amperometry. The intrinsic fluorescence was detected optically to evaluate the intracellular redox state. Effects of cell stresses were detected in such experiments. Fiber nanotips used in experiments had an apex diameter of 100 nm. They were coated with a gold layer of 100 nm in thickness. A copper nanowire was connected with the gold layer that enabled electrical contact with a reference Ag/AgCl electrode.

3. Fiber-Optic Sensing Nanoarrays

Approaches developed for the fabrication of fiber nanotip sensors have been employed for the preparation of fiber-optic sensing nanoarrays and microarrays. This subject has been already discussed in some reviews [34,81]. The development of such nanoarrays is closely related to the need for analyses of complex biological samples and for detecting multiple analytes simultaneously. One can find applications of these nanoarrays in diagnostics, medical monitoring, genomics, environmental chemistry, etc. Many papers on this topic were published in the years preceding 2015.
Generally, an optical array is an analytical device that contains a large number of sensing units that are interrogated simultaneously using optical approaches (see the scheme in Figure 8). Each sensing unit (e.g., a chemical sensor, functionalized bead, etc.) is spatially addressed and located in a discrete area. Dimensions of such sensing units extend from several nanometers to micrometers. Particularly, nanometer-scale sensing units allow us to detect optical changes induced by analytes with approaches that overcome the optical diffraction limit. Thus, very localized information can be obtained. Nanostructured optical fiber arrays are very useful for this purpose.

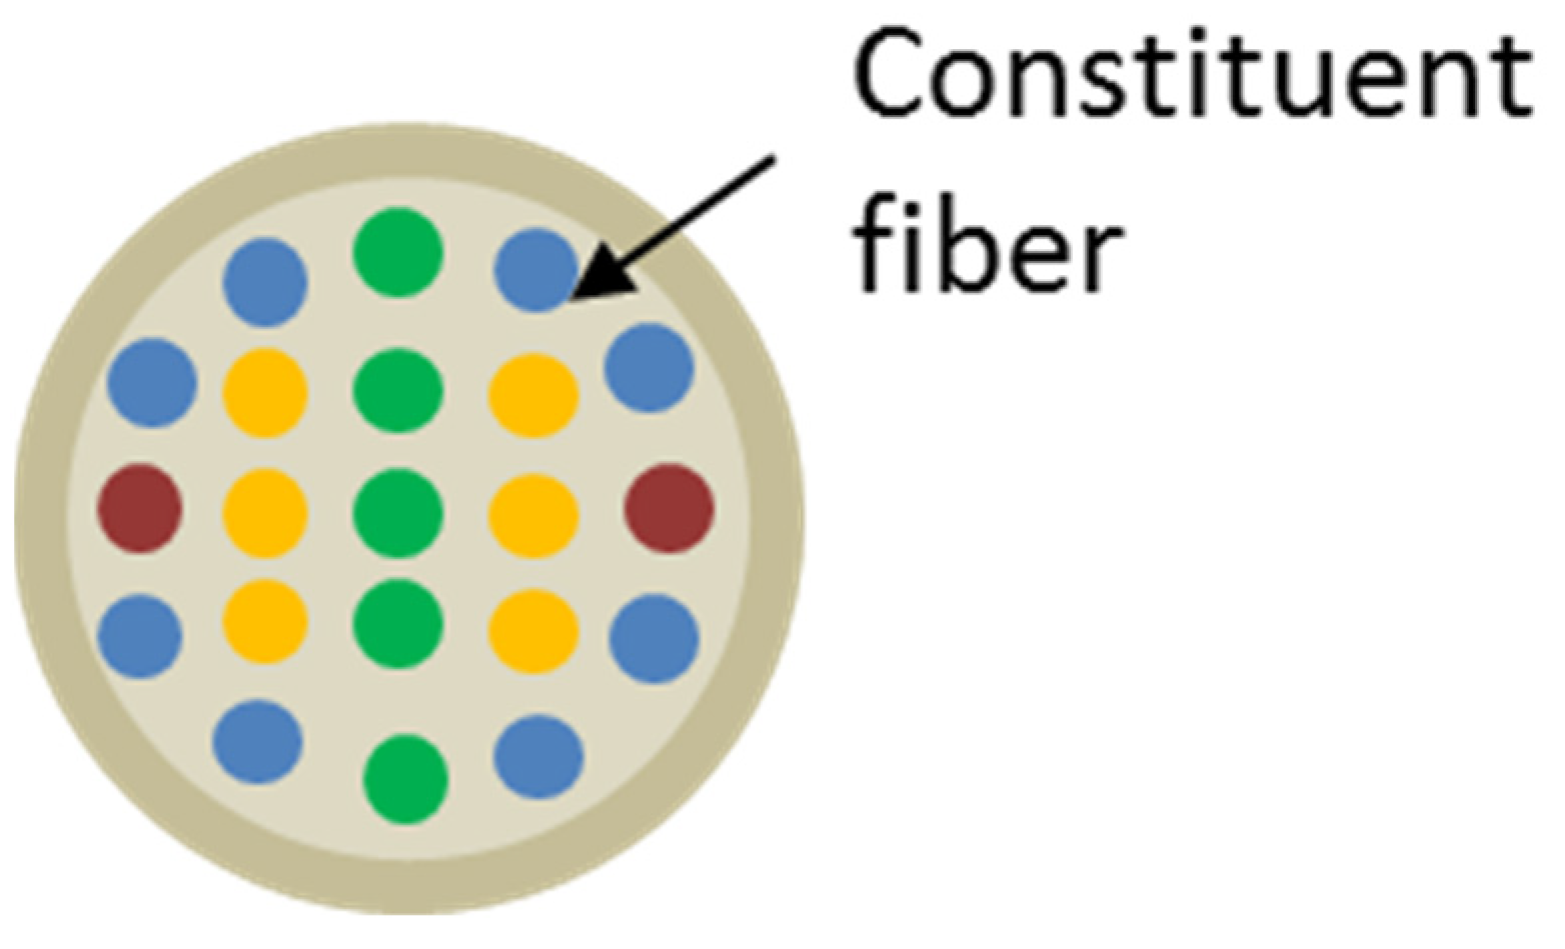
3.1. Fabrication of Fiber-Optic Nanoarrays from Fiber Bundles

Fiber-optic nanoarrays, as well as microarrays, are often based on fiber bundles such as those used in imaging fibers for medical endoscopes [34,81]. By fabricating a sensing array on the distal face of an imaging fiber, it is possible to employ it both for imaging and sensing [82]. Imaging bundles usually consist of a few thousand constituent optical fibers. Each constituent fiber has a core that is surrounded by a thin cladding (see Figure 8). Characteristic optical modes are guided in each fiber core and transmit optical information. There are two types of fiber arrangements in a fiber cable: ordered (coherent) and random. The ordered fiber bundles enable remote locations to be viewed. Such bundles are used for imaging and sensing. The randomly arranged bundles are used for illumination.
Imaging fibers were prepared from high-silica materials used for telecommunication fibers, high-purity multicomponent optical glasses, and polymers. Two main techniques were employed to fabricate imaging bundles from glass materials, namely rod-in-tube stacking [83,84] and winding [84,85]. In the rod-in-tube technique, short segments of input large-core optical fibers are stacked into an outer tube, forming a bundle preform. The preform is then heated and pulled on a fiber-drawing tower. During pulling, fiber claddings fuse together and to the outer tube and form a monolithic glass preform that is drawn to a fiber bundle with a desired diameter. Due to preform drawing, a proportional reduction in the diameter of the cores of the input fibers takes place. Usually, the final diameter of each fiber core is approximately 3–5 μm. A polymer jacket can be applied to the drawn fiber bundle [84]. This technique is primarily employed for the preparation of silica fiber bundles.
In the winding technique, a fiber is wound around a large drum that can be provided with a groove defining the cable shape. When the desired number of fiber threads is wound up, the formed coil is fixed by fusing or gluing and cut into sections. The sections can be used for imaging or for stacking novel preforms for drawing fiber bundles. This technique is used for the fabrication of fiber bundles from multicomponent optical glasses. However, it can be used for winding bundles from silica-based fibers. Both techniques are relatively complicated and require expensive and complex preparation facilities. Issues such as the correct position of each constituent fiber to its neighbors, cross-talk between fiber cores in the bundle, etc., must be solved. Generally, the cross-talk between the bundle is higher for smaller cores and lower cladding-core refractive-index differences. Thus, fiber bundles prepared of multicomponent optical glasses exhibit lower cross-talks [86]. Fortunately, there are imaging fibers available commercially that can be employed for the development of sensing fiber arrays.
It is worth mentioning that coherent fiber bundles can also be fabricated in the laboratory by stacking several large-core fibers together. This approach was used to develop a fiber microsensor for vapor sensing [87]. The bundle ends were fixed by polymer. Such bundles were investigated to test olfactory principles.

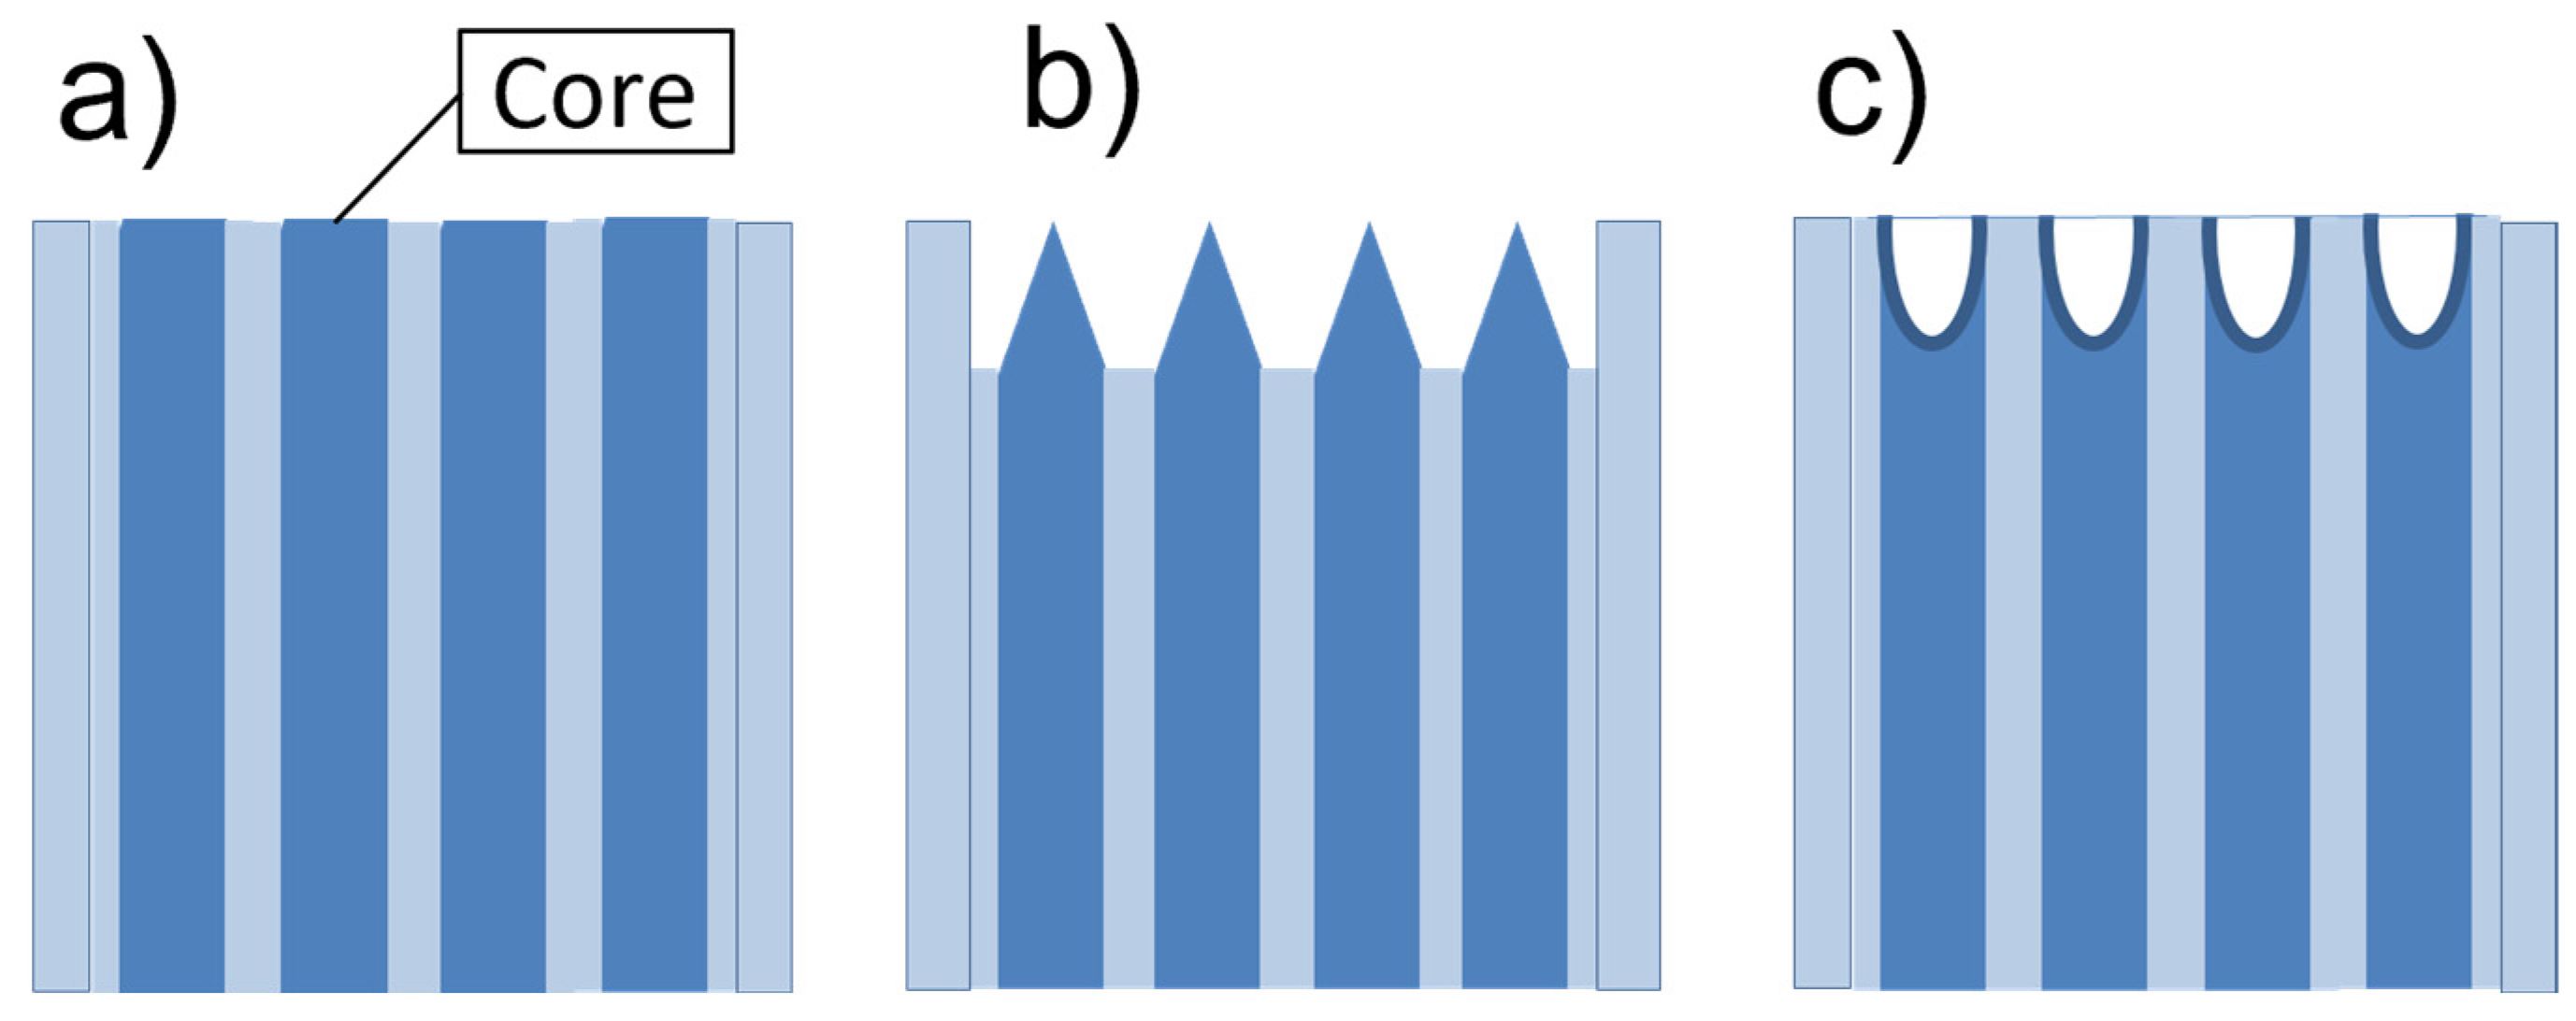
3.1.1. Fiber Nanoarrays Prepared by Wet Etching of Fiber Bundles

In order to fabricate fiber-optic sensing nanoarrays and microarrays on distal faces of imaging fibers, wet etching is often employed. Structures on the distal bundle face, which can be fabricated by wet etching, are schematically shown in Figure 9. For silica-based bundles, solutions containing hydrofluoric acid and ammonium fluoride were used. The etching process is described by chemical reactions in Equations (1)–(4). Due to the complete dissociation of ammonium fluoride in aqueous solutions, its use in etching solutions considerably improves the etching process. By controlling concentrations of etching solutions, different nanotextured arrays were obtained by etching bundles consisting of fibers with germanium dioxide-doped silica cores and fluorine-doped silica claddings. Usually, etching solutions are mixed with a 40% aqueous solution of NH4F, approximately 50% HF, and water [88,89,90,91,92,93,94,95]. In some papers, hydrochloric acid [91] or acetic acid [95] was also added to the etching solution. Arrays of nanowells were obtained using short etching times of up to several minutes [88,89,90,91]. Long etching times (tens of minutes) were employed for the preparation of nanotip arrays [92,93,94,95]. Etching solutions with NH4F and HF concentrations of approximately 0.3 and 0.07 g/mL were mixed for nanowell and nanotip fabrications. It is worth mentioning that an etching solution with NH4F and HF concentrations of about 0.08 and 0.3 g/L, respectively, and a short etching time was used to obtain nanowell arrays with very sharp nanospikes on their contact zones [91]. Nanotip arrays with a tip apex diameter of approximately 50 nm were fabricated [95]. To obtain nanowells with small depths of 50 nm, input fiber bundles were tapered [88].
Solutions containing HF can be used for etching silica-based imaging fibers. On the other hand, etching solutions containing only hydrochloric acid were employed for etching the distal faces of fiber bundles prepared by optical glasses [96,97]. In these experiments, short etching times were used, and arrays of submicrometer wells with depths of 170–190 nm were fabricated [97].

3.1.2. Fiber Nanoarrays on Single Fibers

Recently, novel approaches have been developed for the preparation of fiber nanoarrays on the distal face of optical fiber. The term “Lab-on-fiber” was introduced for such nanoarrays [98]. These nanoarrays can be fabricated using methods such as focused ion beam milling, femtosecond laser micromachining, lithographic techniques, nano-transferring, self-assembly, and optical tweezers [99]. Most of these techniques require complex and expensive devices. A relatively simple technique is based on nanosphere lithography [98,99]. It uses commercially available polystyrene nanospheres. In fact, such spheres have diameters of 200–500 nm, and the term submicrometer spheres would be more suitable. They form arranged monolayers on the water surface. The monolayer can be transferred onto the distal face of a fiber, coated with a nanolayer of silver or gold (thicknesses 30–80 nm). The nanopatterned fiber face is obtained by removing the polystyrene spheres. Metal nanopatterns formed in gaps between the spheres define the shapes of such nanopatterns (e.g., nanoparticles with triangular cross-sections). Such fiber nanoarrays can be employed for SPR and SERS sensors.
Nanoparticles with more complex shapes have also been fabricated on the distal faces of single fibers. Thus, gold antennas 65 nm long, 50 nm wide, and 40 nm tall, separated by gaps of 25 nm along their long axis and 100 nm along their short axis, were prepared on the distal face of a single silica fiber with a core diameter of 62.5 μm and short length of approximately 30 cm [100]. The antenna nanoarray was fabricated by electron-beam lithography, electron-beam evaporation, and by lift-off on a silicon substrate and then transferred to the fiber facet using thin polymeric film (∼200 nm) on polydimethylsiloxane (PDMS) substrate. The polymeric film was removed using oxygen plasma, thus retaining gold antennas on the fiber face. This fiber was tested for SERS-based detection.
A nanostructured silver coating on the distal face of a standard graded-index silica fiber was fabricated using nanoimprint lithography [101]. In this case, the lithography was used to replicate nanostructured cicada wings on the fiber face. The nanoarray replica was coated with a silver layer of 60 nm in thickness. This fiber was also tested in SERS experiments. Generally, nanolithographic techniques allow us to fabricate sophisticated optical arrays. However, they require special and costly devices.

3.2. Fiber-Optic Array Chemical Sensors and Biosensors

Remote imaging by optical fiber bundles can be applied for in situ or in vivo detection in biology and medicine. This approach offers advantages such as compactness, versatility, multiplexing capability, in situ detection, etc., in various biological microenvironments [102]. To increase the information capacity of such images, tissues or cells are often loaded with fluorescence dyes. Registered maps of the dye fluorescence intensity make it possible to observe cellular structures and their changes. This approach, however, can be limited by several factors, such as cell autofluorescence, detection selectivity, sample preparation, etc.
Chemical sensors and biosensors based on fiber-optic arrays enable us to realize the concept of combined imaging and chemical sensing [82]. Thus, such arrays make it possible to view a sample and measure surface concentrations of chemicals. As imaging fibers can consist of thousands of individual fibers, they allow us to address thousands of sensors. To fabricate such array sensors from fiber bundles, opto-chemical transducers or biotransducers are applied to the distal end of the bundle. It is important that this transducer application does not decrease the bundle imaging capabilities. The transducers can be applied on the distal bundle ends as homogenous sensing layers, discrete polymeric sensing regions, or micro- and nanospheres. These approaches were developed on fiber microarrays. To explain their principles, their brief description is reported in Section 3.2.1. Some of these approaches were implemented in the preparation of fiber-optic sensing nanoarrays, as shown in Section 3.2.2.

3.2.1. Fiber-Optic Microsensing Arrays

A homogenous sensing layer for oxygen sensing was coated on the polished distal end of a fiber bundle using photopolymerization [103,104]. Curing radiation was launched into the bundle’s proximal face, guided to the distal end immersed in a mixture of siloxane polymer containing ruthenium complex as the fluorescence transducer for sensing oxygen. The radiation cured the siloxanes primarily on the distal ends of the constituent bundle fibers. These ends were coated with the same polymer and the same transducer.
Another approach employed a bundle of 19 silica fibers. The distal end of each fiber was coated with a specific polymer containing fluorescence dye using photopolymerization or sol-gel method [87]. Then, the coated fibers were arranged into the bundle end. Such a bundle was tested for sensing of vapors. Artificial neural networks were employed for sensing vapor mixtures.
Discrete microsensing regions were also prepared by photopolymerization [105,106]. However, in this approach, curing radiation is not launched into the whole proximal face of a bundle but only into its part. A pinhole and a microscope objective are employed for this launching. The launched radiation is guided to the bundle distal face that is immersed in a prepolymer mixture. This mixture contains proper monomers, cross-linkers, photo-initiators, and a proper opto-chemical transducer. A sensing polymer cone grows on the illuminated distal face within several seconds. Then, the uncured polymer is washed off the distal face. The illuminated area is moved to another place, and the coating process is repeated with another prepolymer mixture. Thus, multiple sensing cones with diameters corresponding to that of the illuminated area, e.g., from 20–100 μm, can be formed on the distal bundle end. This technique has been employed for the fabrication of fiber microarray sensors for the simultaneous detection of oxygen and glucose [105] or pH, CO2, and O2 [106].
Microsphere-based microsensing arrays employ microwells fabricated using wet etching on the distal face of a fiber bundle [107]. The diameters of these microwells correspond to the core diameters of the fibers of which the bundle consists. Usually, they are on a level of several micrometers. The depths of the microwells depend on etching conditions. Microspheres with diameters complementary to those of the microwell, which contain opto-chemical transducers or biotransducers, are loaded into the microwells (see Figure 10). These microspheres form individual sensors. As microsphere loading is random, it is necessary to identify where particular sensors are located, i.e., to encode the microspheres. Different approaches have been developed for such encoding [107,108]]. Optical encoding was used in fiber microarray sensors [109]. Such approaches can be based on multiple coding fluorescent dyes with different emission spectra. It is important that these emission spectra are different from those used for sensing. If each specific sensor type in the array is linked with unique fluorescent properties of encoding dyes, measurements of dye emissions allow us to identify different sensor types. The encoding dyes can be incorporated into microspheres by adsorption, covalent bonds, or internal entrapment.
Fiber-optic microarrays have also been employed for the direct investigation of living cells [109]. Depending on cell dimensions, microwells with diameters of 2 to 6 μm were prepared by wet etching on the distal faces of imaging fibers. Coding fluorescence dyes with different emission patterns were implemented into cell and bacteria strains, which enabled us to identify these strains and their changes in randomly loaded microwells. By measuring fluorescence signals, responses of the cells and bacteria to external chemical parameters (pH, oxygen, CO2, and glucose) were observed.

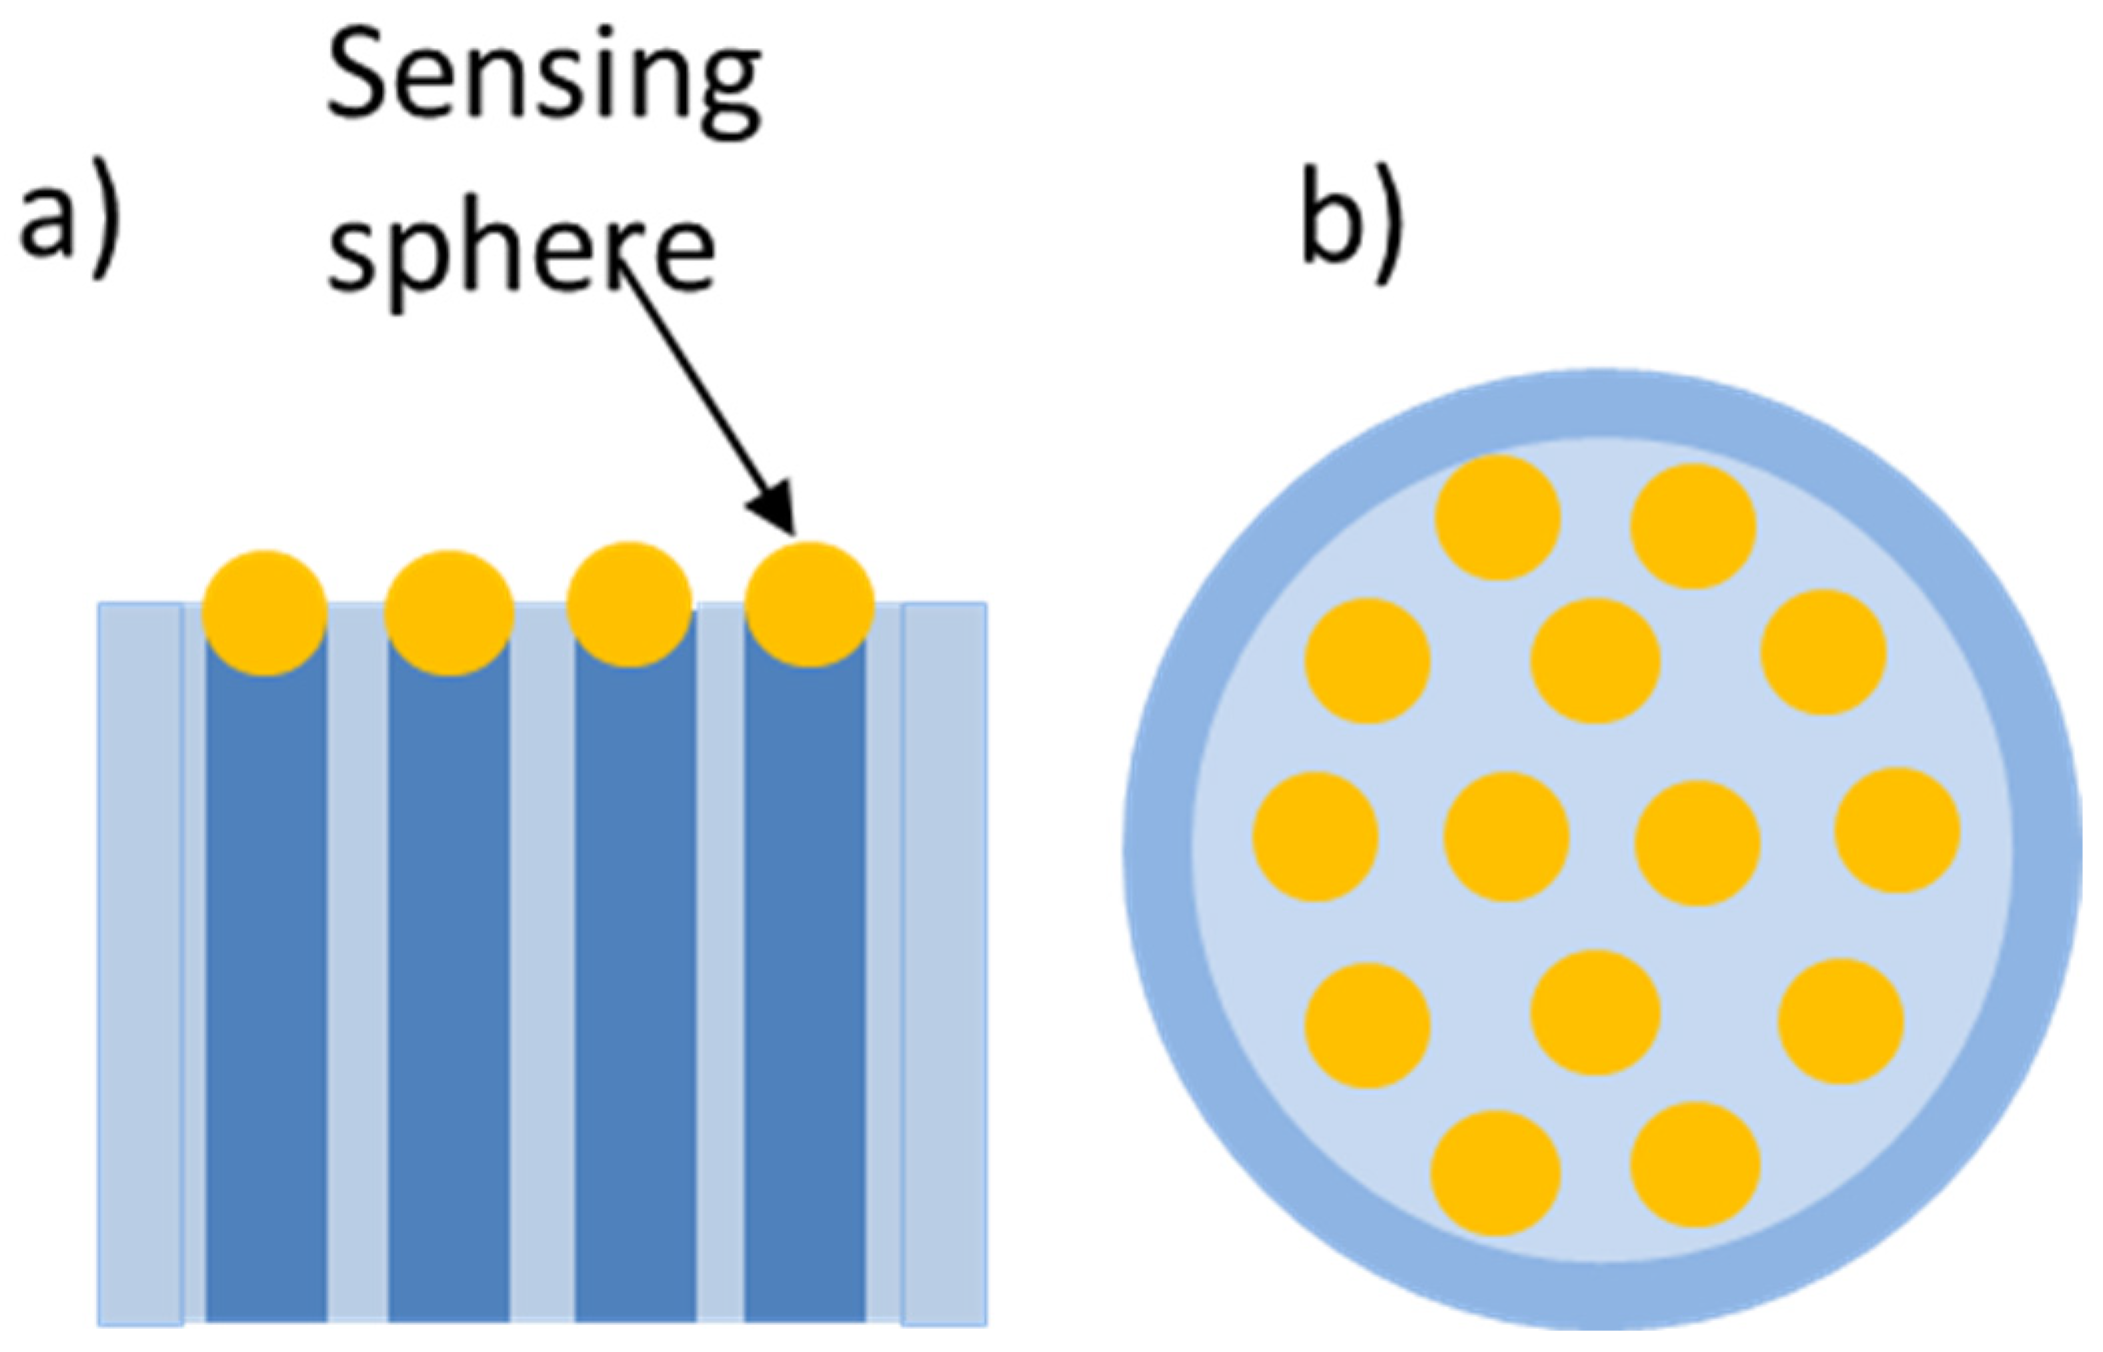
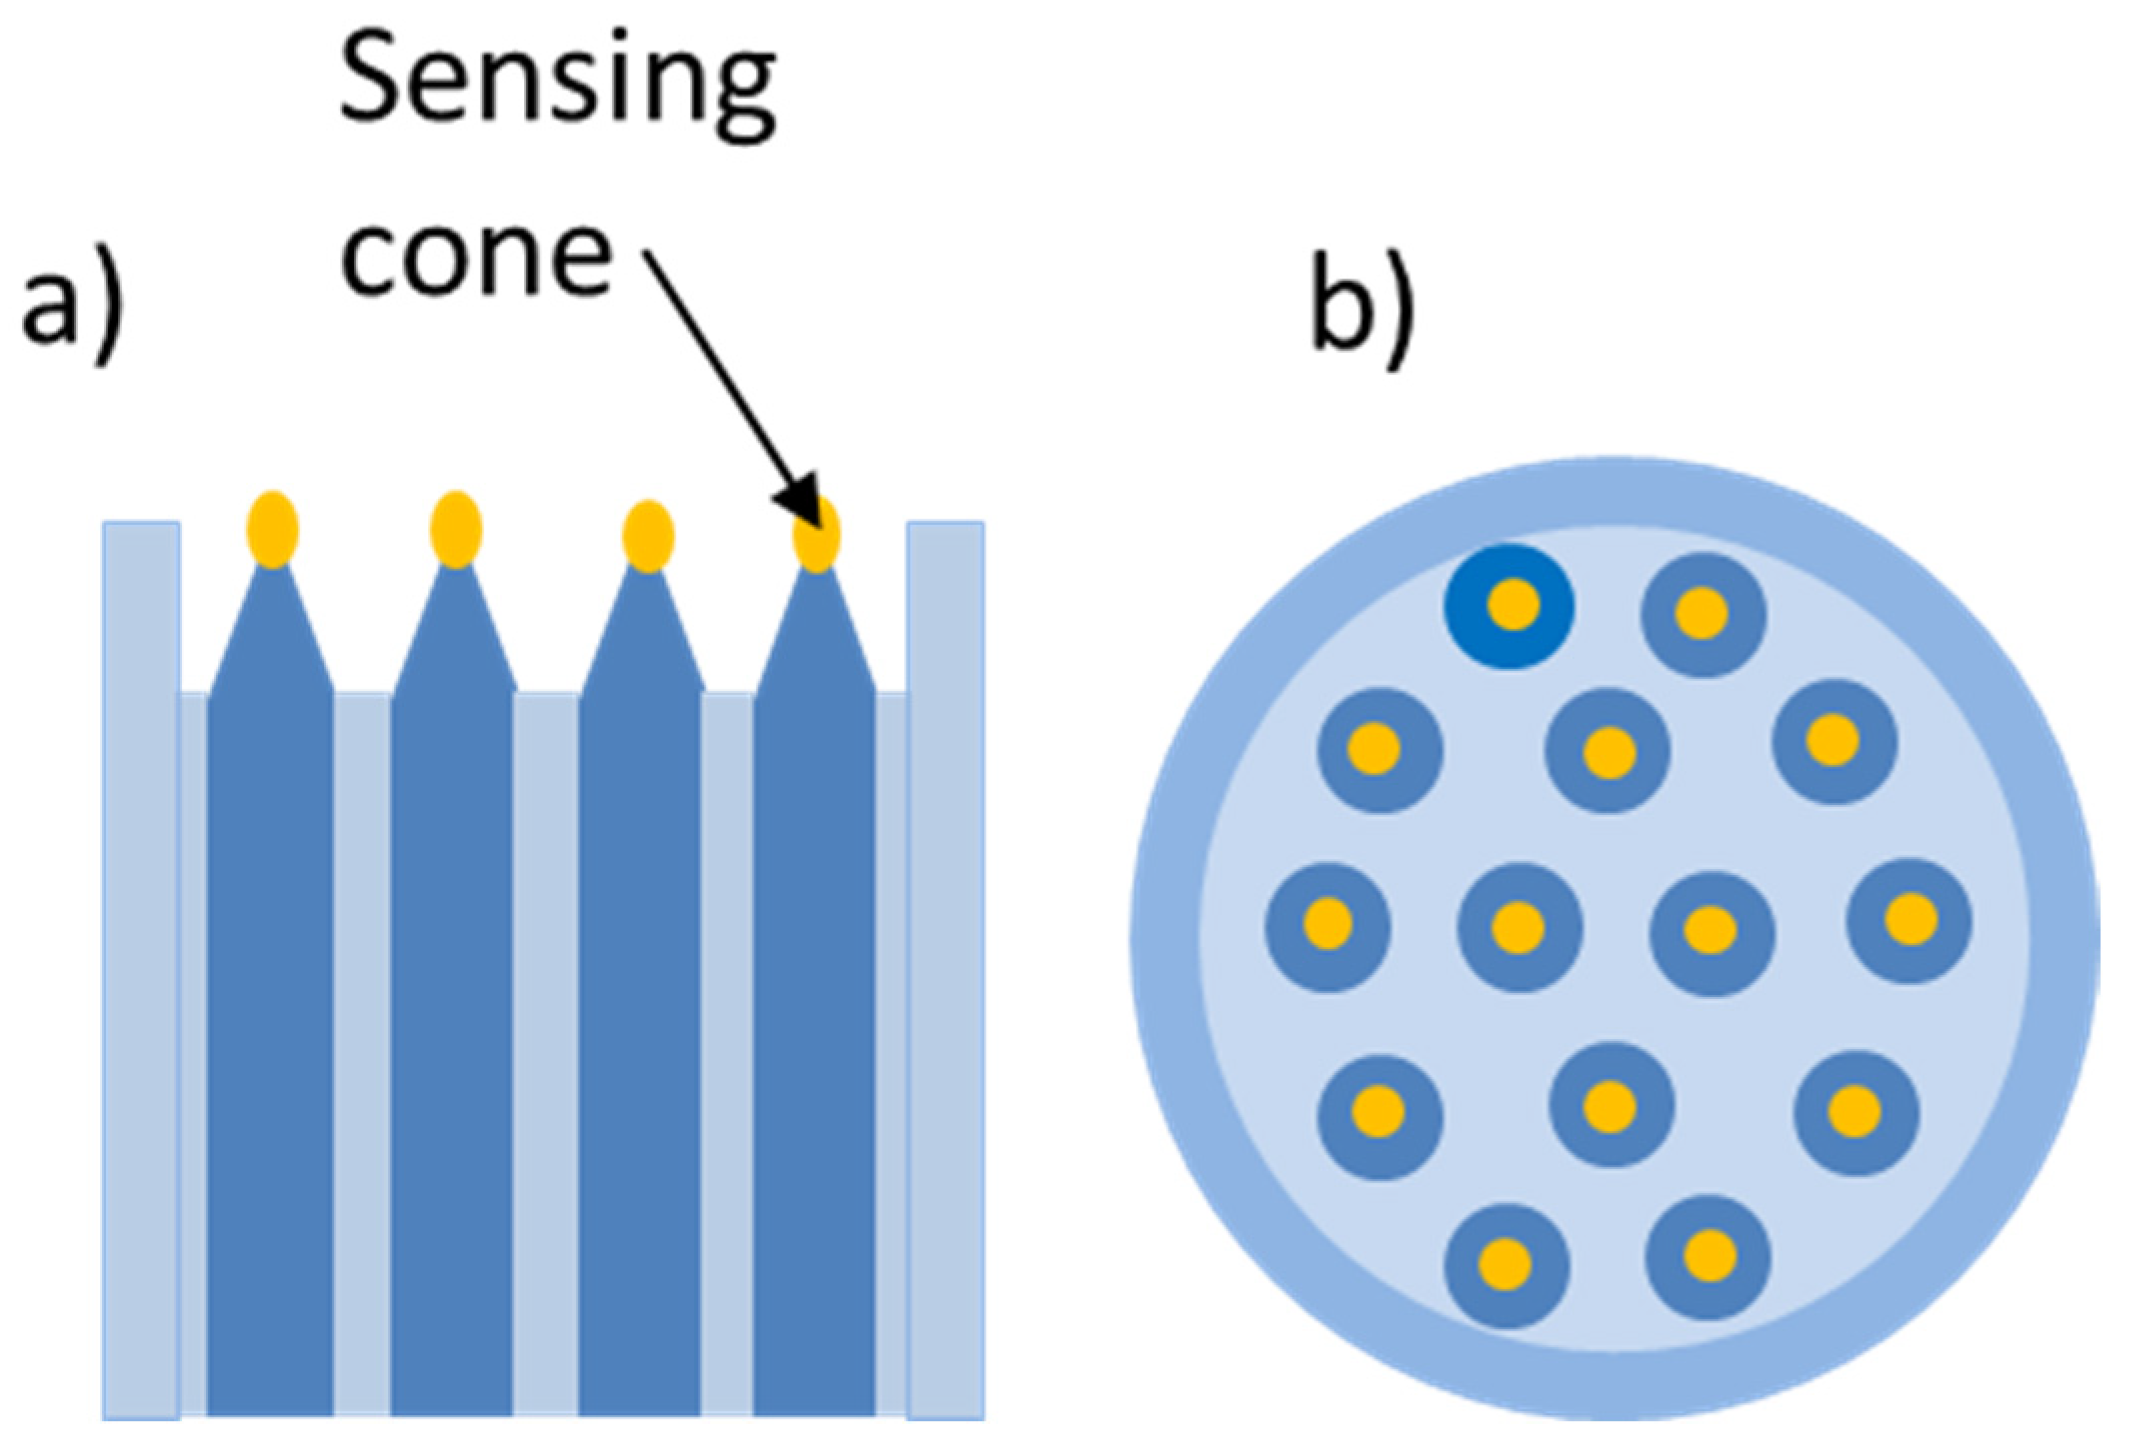
3.2.2. Fabrication of Fiber-Optic Sensing Nanoarrays

Some of the techniques developed for preparing fiber-optic sensing microarrays have been adapted for the fabrication of fiber-optic sensing nanoarrays. Thus, the technique of the homogenous polymeric layer was used for the development of a nanotip array pH sensor with fluorescein derivative as a fluorescence pH transducer [95]. The transducer was dissolved in monomer (vinyl alcohol), and the solution was applied as a thin layer on the array by spin-coating. Radiation was launched into the whole proximal fiber face, which fixed the transducer only on the fiber tips due to monomer photopolymerization (see Figure 11). Using an epifluorescence microscope, the transducer was excited at 485 nm from the proximal fiber face. Fluorescence signals emitted at the distal fiber end were guided to the proximal fiber end, where they were detected by a CCD camera. Values such as pKa = 6.2, a linear range from pH~5.5 to 7.0, a sensitivity of approximately 125 pH−1, and a response time of 1.5 s were determined with this nanoarray chemical sensor. It was also employed for imaging pH maps in a liver cell.
A fiber nanotip array was employed for the development of a Hg2+ sensor [110]. It employed a thioamide–rhodamine transducer for selective mercury ion sensing. This transducer was immobilized on silanized tips by active ester–amine coupling. The sensitivity of approximately 0.38 (log(M))−1 and limit of detection better than 10−5 M (mol/L) were determined.
Nanobeads immobilizing fluorescence transducers were loaded into nanowells on the distal face of an imaging fiber (Figure 10). This approach was tested with fiber nanowells of 700 and 300 nm in diameters fabricated by wet etching on the distal face of a bundle based on multicomponent optical glasses [97]. The depths of these wells were below 200 nm, and thus they can be labeled as submicrometer wells. Polystyrene 700 nm or melamine 300 nm nanobeads containing rhodamine B were used. These nanobeads were deposited into nanowells from an aqueous solution or as dried. Rhodamine B was excited at 540 nm, and its fluorescence at 605 nm was detected using an inverted fluorescence microscope. To avoid the effects of light diffraction on nanowells of 300 nm in diameter, the fluorescence emitted from the distal face was interrogated by the microscope instead of guiding it through the bundle to the proximal face.
A similar approach was employed in a fiber nanowell biosensor based on DNA hybridization [96]. Different single DNA strands were immobilized on polystyrene nanobeads and randomly loaded into the nanowells. The encoding was based on using a set of complementary single DNA strands with a fluorescent label.

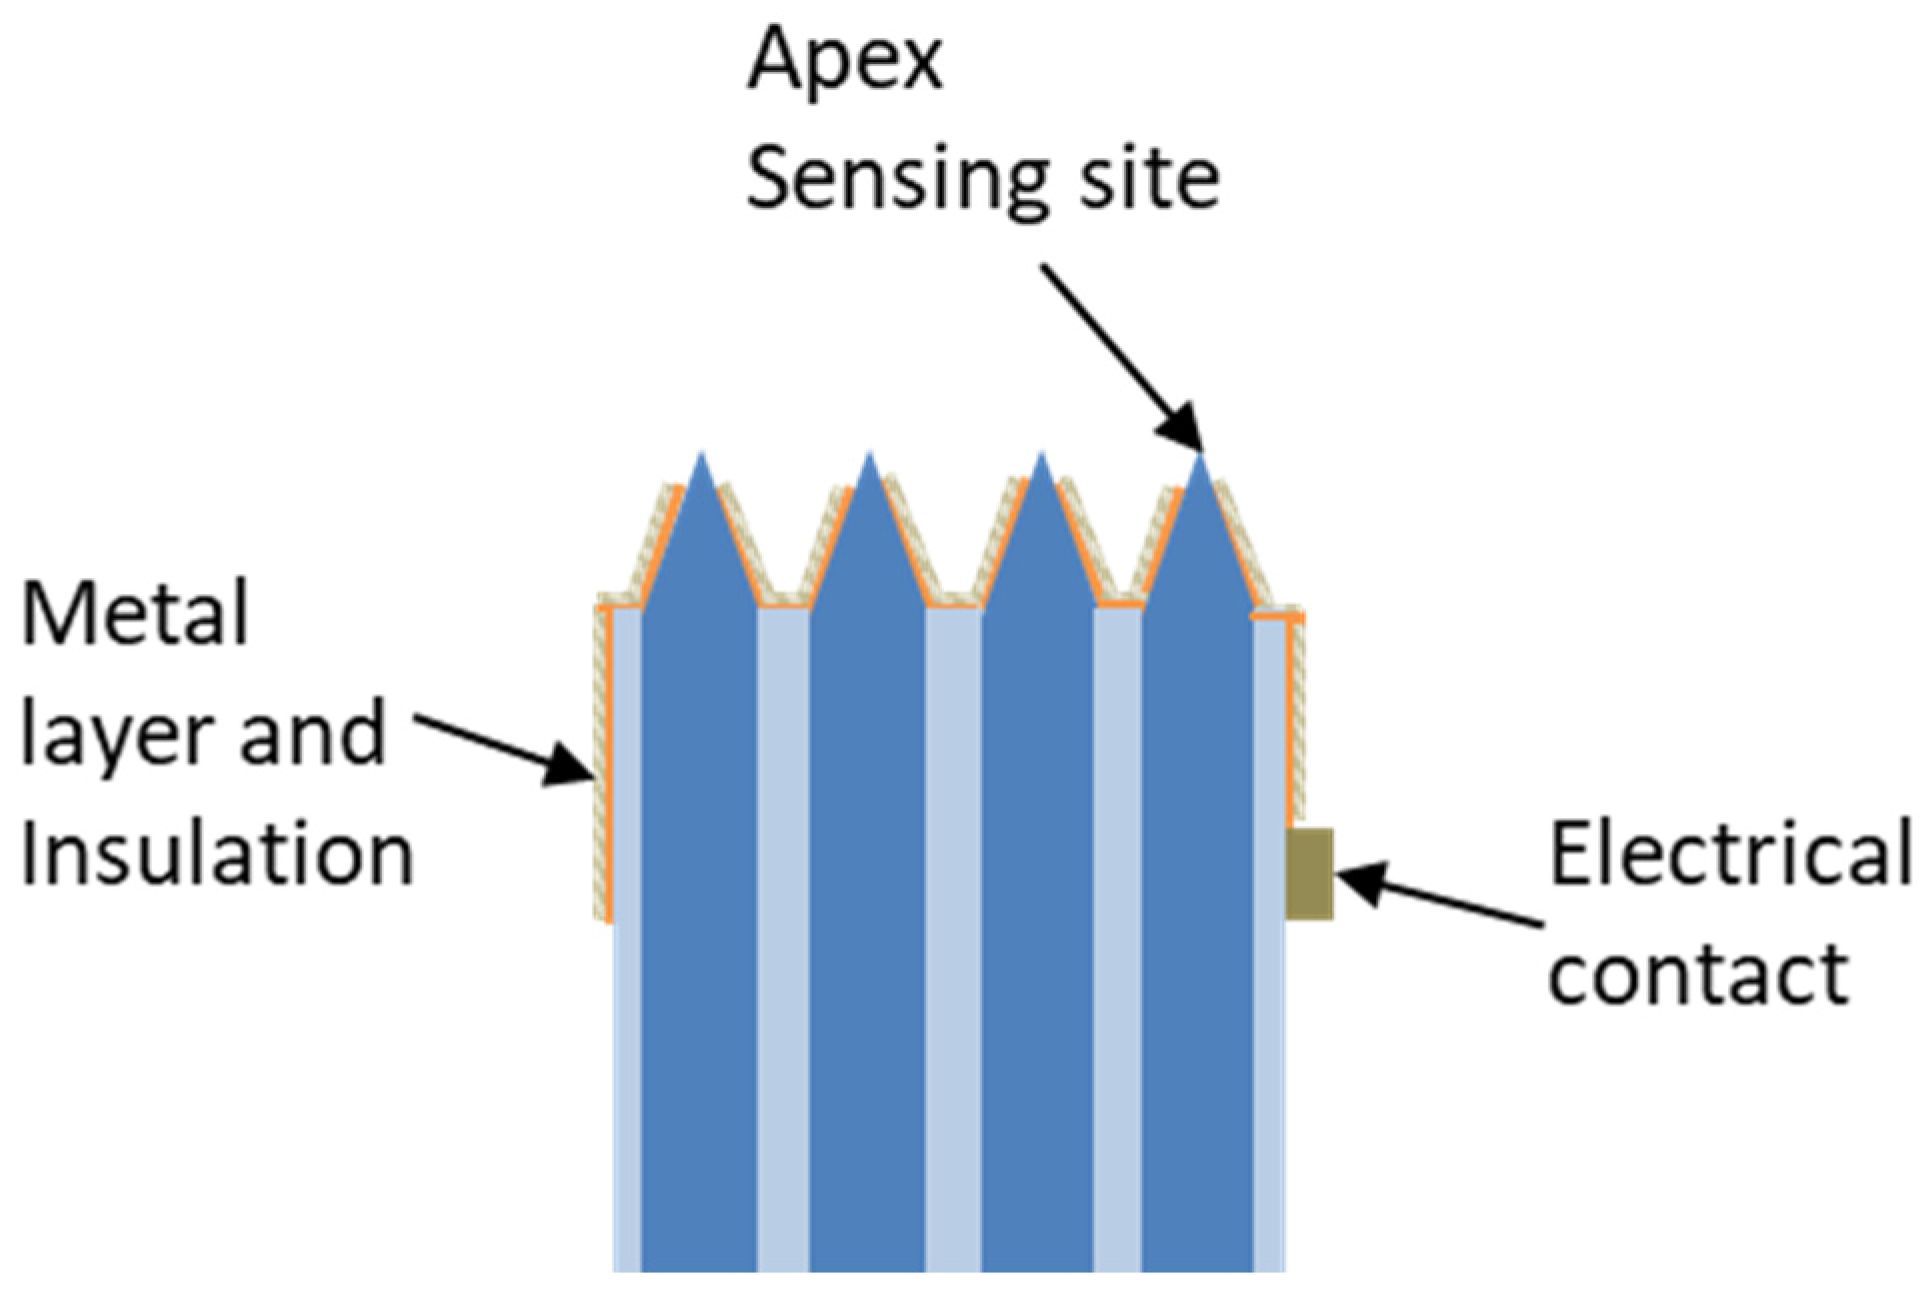
3.3. Fiber-Optic Sensing Nanoarrays Coated with Metallic Nanolayerss

Fiber-optic nanoarrays have been employed in SERS nanosensors. These nanosensors can be prepared by applying a thin silver or gold layer onto nanoarrays on the distal faces of fiber bundles (see Section 3.1.1). Such layers reflect the texture of the nanoarray. Thus, they exhibit high roughness necessary for enhancing Raman scattering, and they are suitable for SERS sensors. Fiber nanoarrays on the distal faces of single fibers (see Section 3.1.2) have also been used in SERS nanosensors.

3.3.1. SERS on Metal Arrays on Distal Faces of Single Optical Fibers

Gold antennas applied on the distal face of a standard optical fiber have been tested in a SERS sensor [100]. Self-assembled monolayers of benzenethiol and 4-[(E)-2-pyridin-4ylethenyl]pyridine were adsorbed on the antennas. In SERS experiments, a helium-neon laser operating at 632.8 nm was used for the Raman scattering excitation. SERS signals were detected at the proximal fiber face. A Raman signal enhancement factor of 2.6–5.1 × 10⁵ was estimated from these experiments.
Using a sensing fiber with the cicada wings replication on the distal fiber face, Raman spectra of self-assembled monolayer (SAM) of thiophenol were measured [101]. Short fiber segments with lengths of several centimeters were used. In the measurements, the distal fiber face was directly illuminated by a fiber-coupled 532 nm laser. SERS radiation was detected by a CCD camera of a Raman microscope focused on the distal face. Similar spectra were obtained when the laser radiation was launched into the proximal fiber face, and the Raman scattered radiation was also detected there. Rhodamine 6G was also measured on this set-up. However, excitation with a 632 nm laser was used in these experiments. Strong Raman spectra of both chemicals were measured.

3.3.2. SERS on Nanoarrays Prepared on Imaging Fibers

Imaging fibers with nanotip and nanowell arrays on their distal ends coated with thin silver or gold nanolayers offer us nanostructured surfaces required for SERS as well as waveguides necessary for transmitting the excitation and excited radiations from the proximal to distal face and vice versa. However, some SERS sensor setups do not use fiber bundles for transmission of excitation and excited radiations. This was the case of a hand-tapered fiber bundle provided on its distal end with a nanowell array [89]. The array was coated with a silver film of 100 nm in thickness. A fiber length was 10 cm. SAM of benzenethiol was prepared on this array. SERS was excited with a 633 nm laser focused on the array. Raman scattered radiation was detected using an objective placed in front of the array. An enhancement factor of 106 was determined. However, due to hand tapering, the fiber was not capable of guiding either excitation or excited radiation.
Another paper reports the results of SERS experiments made with an imaging fiber provided with nanowell and nanospike arrays on the distal face [111]. The fiber consisting of 30,000 constituent fibers was tapered by thermal pulling. In tapered fibers, diameters of constituent-fiber cores ranged from 140 to 1100 nm. All the tapers were chemically etched in a solution of hydrofluoric acid buffered with ammonium fluoride. The produced nanoarrays were provided with silver coatings having thicknesses in a range of 5–200 nm. It was found that at thicknesses below 150 nm, silver islands are formed on the spikes. The metalized probes were tested for SERS measurements with solutions containing benzoic acid or brilliant creosol blue (BCB). Radiation of a 632.8 nm laser was launched into the distal face; generated Raman scattering was detected at the proximal face with a CCD camera. Enhancement factors in a range of 106–107 were determined from these experiments. SERS images of a gel sample containing BCB or Texas red were also obtained, with the bundle having cores of 140 nm in diameter being in contact with the gel samples. A spatial resolution of 284 nm was determined, which makes this approach very promising for imaging.
A nanotip fiber-optic array was also employed for SERS experiments [93]. The array was obtained from an imaging bundle of 270 μm in diameter consisting of 6000 individual silica fibers. These fibers were chemically etched, which resulted in an array of sharp conical tips with nanometer apexes. The tips were coated with a gold coating of 30 nm in thickness. The probes were interrogated in a reflection arrangement, i.e., by launching radiation of a 752 nm laser into the proximal face of a bundle segment of 30 cm in length and by detecting generated Raman scattering at the proximal face. High-intensity Raman spectra of benzenethiol were registered. An enhancement factor of 5 × 10⁴ was estimated. Moreover, remote Raman maps based on the benzenethiol 1072 cm−1 vibration band were obtained using this nanotip array. These maps reflect SERS signals generated at individual metalized tips, making it possible to imagine local chemical information.

3.4. Opto-Electrochemical Sensing by Fiber-Optic Nanoarrays

Fiber nanoarrays coated with metallic nanolayers enable us to employ both electrochemical and optical principles for sensor preparation and use. Such metal materials are electrically conductive, and they can be used as electrodes. These electrodes enable the realization of electrochemical reactions directly on the distal fiber face. Such reactions can be used to either immobilize a transducer on the fiber surface or to modulate a luminescence signal, which is monitored through the optical fiber itself.
Electrochemical methods have been employed for grafting oligonucleotides (ONT) onto the tips of a fiber-optic nanotip array coated with a gold layer [112]. For this grafting, an electrochemical microcantilever was used to apply picolitre drops of a solution containing sensing ONT in pyrrole onto selected individual tips and for electropolymerization of the applied pyrrole solution. The hybridization of complementary DNA strains was detected by an epifluorescence microscope. Using this approach, three types of ONTs were immobilized on the nanotip array, making it possible to fabricate sensing multiplexes.
Metalized fiber-optic arrays have also enabled the use of electroluminescence for sensing [113]. As an example, a fiber-optic nanotip array with tip apex diameters of approximately 100 nm was prepared by chemical etching of the distal face of an imaging fiber. The etched face was coated with a gold layer of 30 nm in thickness (see Figure 12). A metal wire was connected to the coating. Then, the metalized tips were insulated with an electrophoretic paint. The electrochemical characteristics of this sensing fiber were proved by cyclic voltammetry using a solution of Ru(NH3)63+. This sensing fiber was tested for NADH imaging. The electrochemical reaction of Ru(bpy)32+ complex with NADH occurred at an applied potential of 1.2 V and generated electroluminescence signals at the fiber tips, which were detected at the proximal sensing fiber face by an epifluorescence microscope with a CCD camera. Electroluminescence intensity maps were obtained.

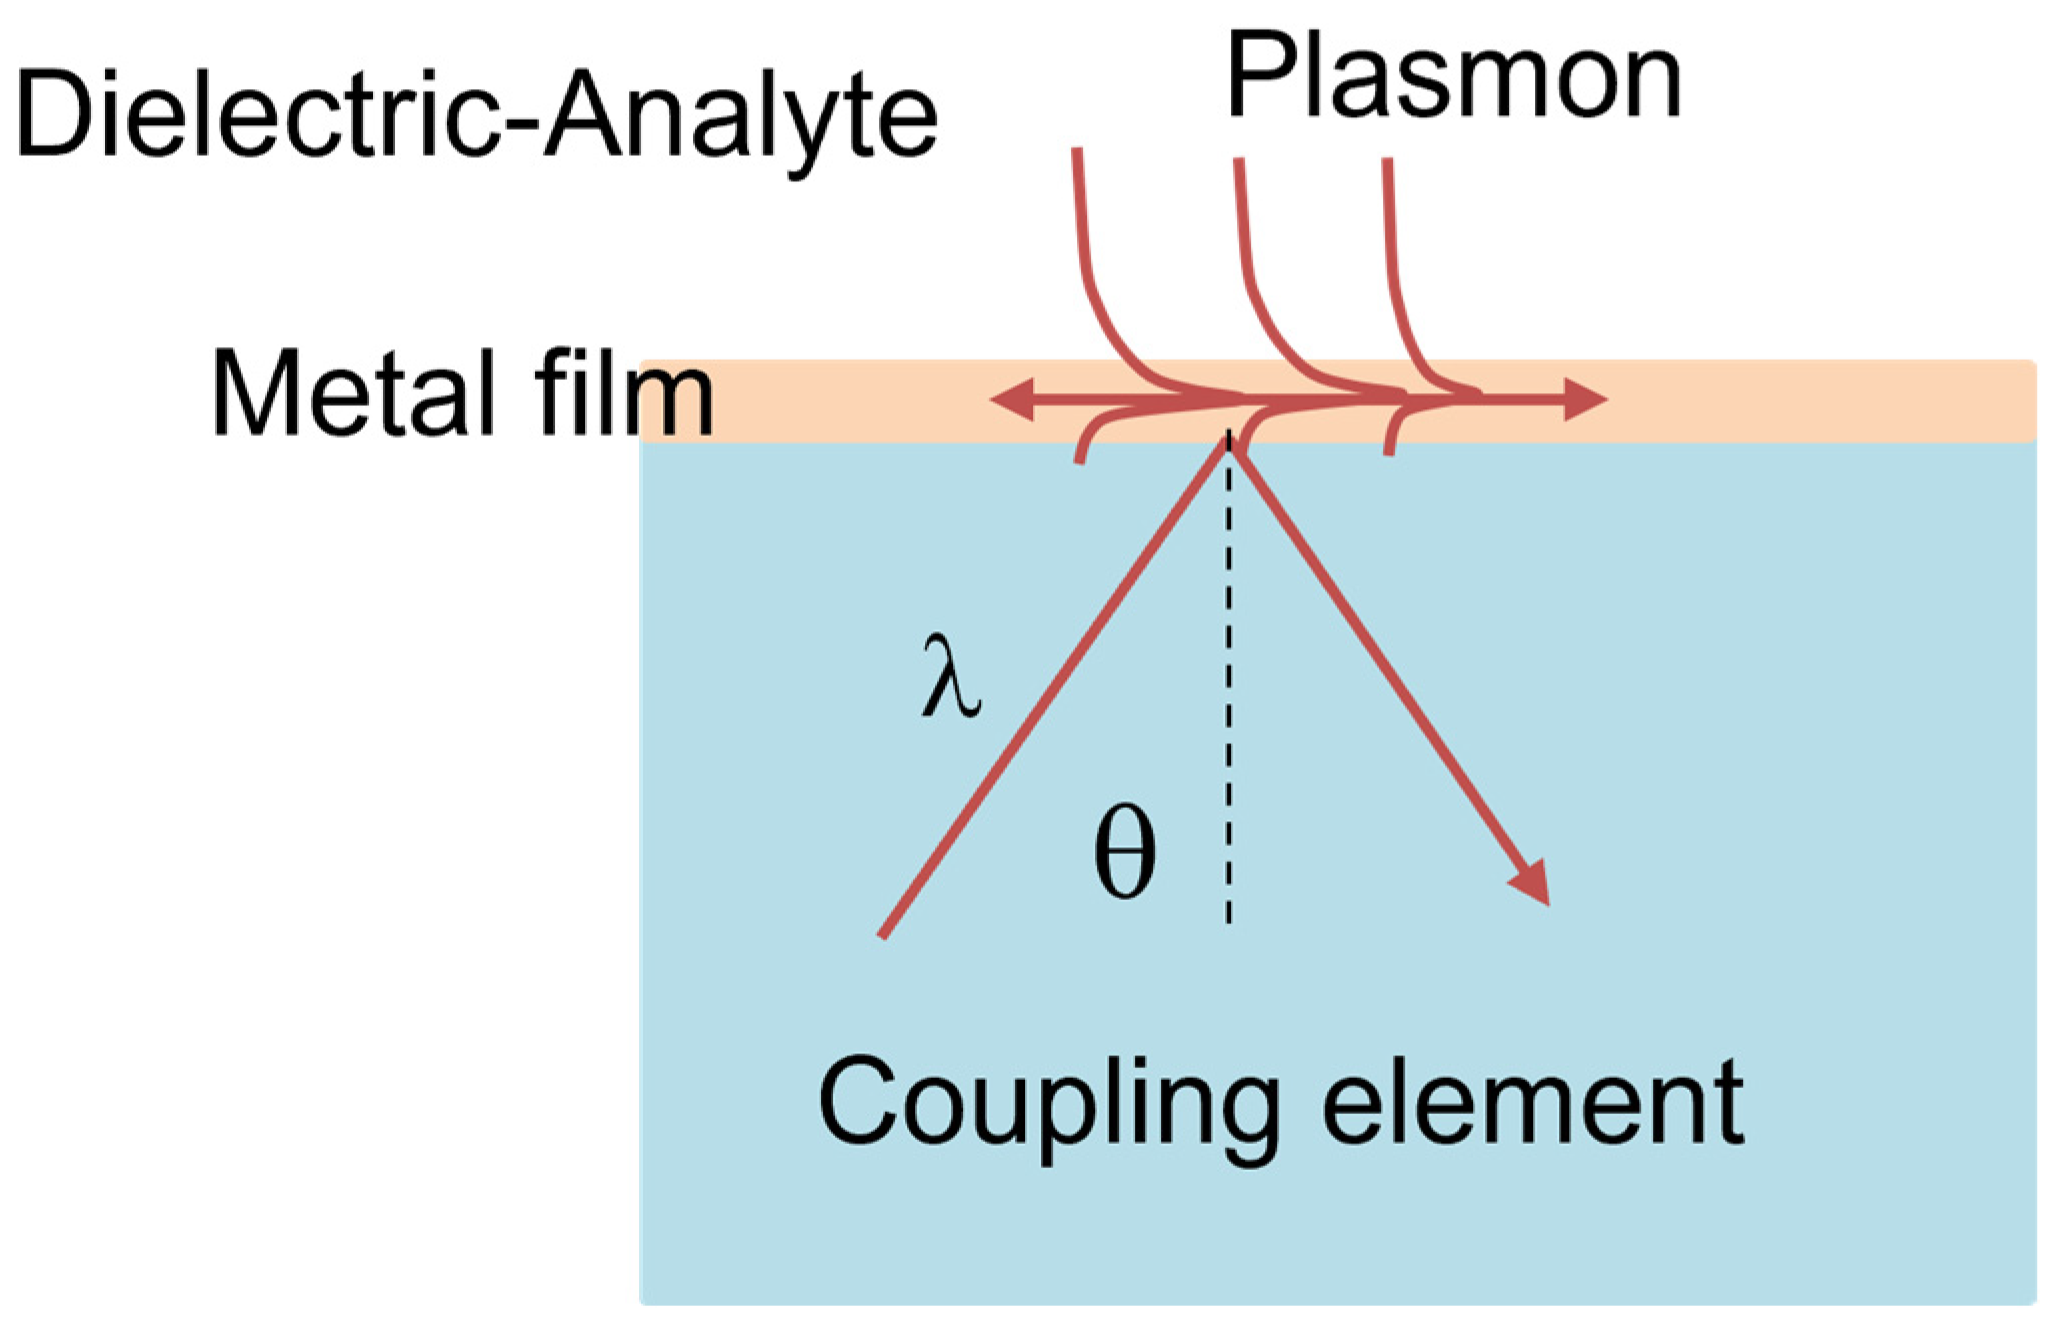
4. Surface Plasmon Resonance Sensors

Recently, surface plasmon resonance (SPR) sensors have been intensively investigated, particularly for biosensing. One can find extensive reviews on SPR sensors elsewhere [16,114]. SPR sensors represent another sensor type in that the nanometer dimensions of a sensor part are closely related to specific physical phenomena, namely, surface plasmons (SPs). SPs are related to energy changes of electron plasma that exist at the interface between two materials where the real part of the dielectric permittivity changes its sign. It is known that metals have negative values of permittivity at visible and near-infrared wavelength regions, while dielectrics, such as gases, solutions, glasses, etc., have positive values. Thus, SPR sensors usually employ metal/dielectric interfaces. SPs can be generated optically using the principal setup shown in Figure 13. In such a setup, input radiation launched in a coupling optical element is reflected from a thin metallic layer coated on the element. At suitable coupling conditions, i.e., at surface plasmon resonance (SPR), energy from the radiation is coupled into oscillations of electronic plasma moved at the metal/external dielectric interface, and SP is generated. SP is connected with an electromagnetic SP wave that propagates in the metal and the dielectric (see Figure 13). The evanescent part of this SP wave penetrates into the dielectric at distances of approximately 150–500 nm. Due to high optical losses of the layers, SP waves propagate on distances in the range of 3–30 μm [114].
SPR curves can be obtained by varying parameters of the input radiation, such as the wavelength or input angle, and by measuring the output intensity of the radiation reflected from the metal–dielectric interface. Depending on the parameter changed, the terms wavelength or spectral interrogation and angular interrogation are often used. Typical response curves of wavelength-interrogated SPR sensors are schematically shown in Figure 14a. Similar curves can be obtained for angle-interrogated SPR sensors. Shapes of these curves depend on the metal composition, layer thickness, refractive index profile of the coupling fiber, and the refractive index of the dielectric. The minima of these curves indicate SP generation in the resonance conditions. Wavelength positions of the minima of SPR curves depend on the refractive index of the external dielectric n, as schematically shown in Figure 14a. By plotting these shifts versus the corresponding refractive indices, a calibration curve schematically shown in Figure 14b is obtained. Such curves measured with SPR sensors are used for sensitive detection of the refractive index of analytes in contact with metallic sensor layers.
In addition to SP generated at metal/dielectric planar interfaces, there are also localized surface plasmons (LSPs) [16,115]. LSPs are excited by light at interfaces between dielectric and metallic nanoparticles (generally nanoobjects). The light interacts with electrons in the conductive band of the metal [16]. Shapes of resonant curves of LSPs strongly depend on the composition, dimensions, dielectric environment, and particle–particle separation distance of such nanoparticles. LSPR curves with several dips have been reported for non-spherical nanoparticles (nanorods, nanotriangles, etc.) [115]. Due to highly localized evanescent parts of LSPR sensors, they can be used for the detection of several analyte molecules in the very close vicinity of nanoobjects.
SPR curves can be measured in the visible wavelength region. Generally, SPR sensors require four main parts, namely a light source, coupling element, metallic layer in which SP is generated, and detector. Light sources for SPR sensors should enable us to control the polarization, wavelength, incident angle, and beam width of excitation light. It is known that SPs are excited with TM-polarized light [16,114]. However, unpolarized radiation has also been used in SPR sensors [11,116,117]. Light sources such as lasers, laser diodes, halogen lamps, etc., can be employed. Different coupling elements, including optical prisms, optical gratings, planar waveguides, or optical fibers have been employed as SPR coupling elements [114]. The former two coupling elements are employed in commercially available SPR devices. Evanescent parts of waves propagating in these elements are used for SP excitations. Thin layers of metals such as gold, silver, aluminum, copper, or palladium have been tested in SPR sensors. Usually, thicknesses of such layers range from 20 to 70 nm. Light detectors in SPR sensors include photodiodes, photodiode arrays, or spectrometers.
Although optical prisms and gratings are preferred coupling elements in SPR sensors, one can find many papers in which optical fibers have been employed for preparing such elements [16]. In transmission fiber-optic SPR sensors, metallic layers are coated on the boundary between the optical core and cladding, as schematically shown in Figure 15a. Reflection FO SPR sensors are also used. The metal film is applied on the distal fiber face in these sensors (see Figure 15b). Multimode plastic optical fibers (POF) and polymer-clad silica (PCS) fibers, U-shaped PCS fibers, as well as single-mode (SM) D fibers, tapered fibers, microstructure fibers (MSFs), and hollow-core photonic crystal fibers (HCPCF) have been employed in such SPR sensors (see schematic cross-sections in Figure 16) [16].
Coupling optical fibers, such as POFs, PCS fibers, SM fibers, MSFs, and HCPCFs, have step-index refractive index profiles in their cores. The ratio of power transmitted in evanescent waves of these fibers is in the range of 0.1–0.5% of the total power transmitted in the fiber, which can limit the responses of such SPR sensors [12]. To avoid such limitation, U-bent PCS fibers, U-bent POFs, or biconical fiber tapers are used [16].
Special techniques for launching light into the proximal faces of PCS fiber, which increases this ratio, were also developed [11,117]. They employ the excitation of PCS fibers with inclined collimated beams. An angular distribution curve is obtained by changing the angle of inclination and by measuring the corresponding output optical power from the fiber. An example of a typical angular distribution curve for an SPR sensor based on a PCS fiber is shown in Figure 17a. The local minima on the curve indicate the SP generation. Its shape is changed with the refractive index of materials in contact with the metal layer. Such angular distributions represent SPR curves measured on fiber-optic SPR sensors using angular interrogation. Output-power changes due to changes in the external refractive index determined for a fixed angle of inclination are employed in a calibration curve (see Figure 17b). Moreover, special multimode silica optical fibers, called inverted-graded index (IGI) fibers, were also tested as coupling elements of SPR sensors [116]. Refractive-index profiles of such fibers have the minimum in the core center and gradient increase to the core/cladding boundary. In such fibers, light reflects from the core/cladding boundary at a very narrow range of angles. A light source placed on the fiber axis can be used for the excitation of SPR sensors based on IGI fibers [116]. A detection limit of approximately 5 × 10⁻⁵ RIU was achieved with sensors based on IGI fibers.

4.1. Fabrication of Fiber-Optic SPR Sensors

Fiber-optic SPR sensors are fabricated in two principal steps. In the first step, access to the core/cladding boundary is created. This access is obtained by removing the polymeric cladding of POFs, PCS, or IGI fibers [11,116,117]. Usually, chemical and mechanical approaches are combined. In the case of SM fibers, the silica part of the fiber is removed to the core/cladding boundary on one side of the fiber by grinding and polishing [106]. The second step of the sensing fiber preparation consists of the fabrication of a thin SPR metal layer on the core/cladding boundary. In some FOSPR sensors, a thin metal (e.g., Cr) or dielectric layer (e.g., Ta2O5) is coated over the SPR metal layer. Such a layer enables us to tailor the refractive index operation range of the sensor [118]. Physical methods such as thermal evaporation and magnetic sputtering are usually used for the application of metal and dielectric layers. PCS fibers and POFs can be rotated during the deposition to prepare the circularly symmetric homogenous metal layer [11,117].

4.2. Fiber-Optic SPR Sensors for Chemical Sensing

SPR sensors rely on refractive index detection. Their great advantage consists in the possibility to sensitively detect refractive index changes at refractive index values around 1.33, which is a value of the water refractive index. Thus, they are very useful for sensing in aqueous solutions which are typical for medicine and biology. However, refractive index-based detection is not selective and therefore, various approaches have been developed for the selectivity increase in SPR sensors. Such developments are mainly focused on SPR biosensors. They include the employment of biotransducers such as immunoassays, enzymes, oligonucleotides, cells, or viruses [8]. More information on SPR biosensors can be found elsewhere [8,16,114].
The sensitivity and selectivity of SPR chemical sensors can be tailored by applying detection membranes over the metal layers of these sensors [119,120,121,122,123,124,125,126,127,128,129,130,131,132]. In such sensors, the detected analyte being in a mixture with other chemicals is specifically captured in the membrane. This capturing changes the membrane refractive index, and these changes are detected by the SPR sensor. Such detection membranes have been prepared of polymers, molecularly imprinted polymers, metal oxides, carbon materials, etc.

4.2.1. Fiber-Optic SPR Gas Sensors

Fiber-optic (FO) SPR sensors for the detection of gases have been investigated. A detailed review of such chemical sensors can be found elsewhere [133]. Sensing membranes of metal oxides or carbon materials such as graphene have been tested in FOSPR gas sensors. Nanocomposites of metal oxide, graphene, and graphite nanoparticles in different polymers have also been investigated for gas detection. Examples of characteristics of selected FOSPR gas sensors are presented in Table 3.
In FOSPR gas sensors shown in Table 3, thermal evaporation was used for the application of Au, Ag, metal oxides, ITO, BCP, PVP, etc. Wet chemical syntheses were used for the preparation of reduced graphene oxide or carbon nanotubes modified with reduced graphene oxide [119,121]. These nanomaterials were dispersed in methyl methacrylate, and the sols were applied by dip-coating onto the fiber where it was polymerized into poly(methyl methacrylate) nanocomposites. The dip-coating technique was also employed for the application of the fluorosilicone polymer layer onto the SPR sensing fiber of the PCS fiber [11]. The layer was coated on the SAM of alkanethiol applied on the silver layer. The sensitivity value for C2HCl3 is reported in Table 3 [11]. Using the same sensor, sensitivities of 7, 3.4, and 2.1 μV/ppm were determined for gases such as CCl4, CHCl3, and CH2Cl2, respectively. These measurements employed the angular interrogation at a wavelength of 670 nm.
Hydrogen is an important gas broadly used in the chemical industry as fuel, etc. For its sensing, a concentration of 4% vol. in air is important. This concentration value is considered a lover explosion limit [117]. The FOSPR hydrogen sensors reported in Table 4 mostly used Pd as the sensing material. This material changes its refractive index due to hydrogen dissolved in it [117]. ITO layer was also used both for SPR excitation and for hydrogen sensing [144]. In addition to sensing layers of pure Pd [145,146], the sensing layer of ZnO + Pd nanocomposite was also used [147]. This layer was fabricated from aqueous dispersions of the nanocomposite using dip-coating. Unfortunately, detailed information on the dispersion fabrication is missing in the paper [147].
The effects of thermal annealing of sensing layers in contact with hydrogen on the sensitivity of hydrogen sensors were investigated [146]. It was found that thermal annealing of the Au/Ta2 O5/Pd multilayer in a gas mixture of H2 (4 vol.%) and N2 at 400 °C improved the detection sensitivity (compare [145] and [146]). The sensors employed a special fiber-optic element prepared by splicing a short SM fiber (a length of 15 mm) between two MMF fibers. The SM and MMF fibers had the same output diameters of 125 µm but different core diameters of 8 and 62.5 µm, respectively. Due to the core differences, cladding modes were excited in the SM fiber, which excited SPs in the Au layer in the multilayer applied to the SM fiber. Such a sensing element does not require grinding and polishing of SM fibers to D-shapes, but a good splicing device is necessary. The fabrication of such an element requires precise preparation of the faces of spliced fibers and their splicing. There is a simpler sensing approach that uses a PCS sensing fiber excited by an inclined collimated beam [11,117] or uses U-bent fibers [143].
The excitation by an inclined collimated beam was also tested for the detection of pure hydrogen [117]. Results obtained with a dual FOSPR sensor based on two same FOSPR sensors on one fiber were also published in the paper. It was found that about two times higher responses were measured with the dual sensor than with each of the single sensors.
An important issue of SPR chemical sensors, their selectivity, has also been addressed in FOSPR gas sensors. By measuring the responses of these sensors to single gases, it has been determined that the selectivity can be tailored by the composition of sensing layers. Thus, the response of a FOSPR sensor with a sensing layer of rGO in PMMA to NH3 was found to be about seven times higher than the responses to H2S, Cl2, or H2 [119]. Similarly, the chlorine sensor with the sensing layer of In2O3 doped with SnO2 exhibited a five times higher response to Cl2 than to NH3, CH4, or H2 [139]. Similar response differences were determined with the CH4 sensor based on the layer composed of rGO-modified with carbon nanotubes in PMMA for CH4, NH3, or H2S gases [121]. Fiber-optic SPR hydrogen sensors employing Pd in the sensing layer exhibit high detection selectivity to hydrogen because hydrogen penetrates into Pd matrices and induces phase changes there, which are accompanied by refractive index changes. No results on the selectivity were reported for the ITO-based hydrogen sensor [144].

4.2.2. Fiber-Optic SPR Sensors for Detection in Solutions

Many FOSPR sensors for detection in solutions have been developed [16]. Most of them consist of a metal layer for the SP excitation and a sensing layer for the detection. In LSPR-based FO sensors, metal nanoparticles can be immobilized in a sensing layer applied onto a sensing fiber. Two principal approaches, namely molecularly-imprinted polymers (MIPs) [16,148] and nanomaterials (NMs) [16], have been employed for the preparation of sensing layers.
MIPs represent sensing materials that can, to some extent, replace biotransducers for sensing biologically important molecules. MIPs contain molecular recognition sites that are complementary in shape, size, and functional groups to template analytes used for their fabrication. Thus, MIPs allow us to achieve high detection sensitivities and selectivities to biologically important analytes, similarly to bio-transducers. Bio-transducers require more specific conditions (pH, solvent) [8] during the sensor preparation and operation. Their preparation is not easy; however, some of them are commercially available. On the other hand, MIPs can be fabricated in a chemical laboratory. Generally, MIPs are fabricated by an approach schematically described in Figure 18. In the approach, functional monomer forms complex with template under the effect of cross-linker. As the templates, molecules of analytes or their specific fragments are used. The complex, pre-printed polymer is polymerized in the presence of an initiator. A catalyst can also be added. All these chemicals are dissolved in a suitable solvent that influences the pore formation. In the last step, the template is removed from the printed polymer using suitable solutions and the imprinted polymer is obtained. Usually, a layer of the pre-printed or printed polymer is applied onto a sensing fiber by dip-coating or spin-coating method and the template removal from the applied layer is carried out on this layer. Rarely prepared MIP powders are dispersed in solvent, and the dispersion is applied onto a sensing fiber. Applied MIP layers usually have thicknesses in a range of 1–2µm [16].
Methyl methacrylate acid (MAA), acrylic acid (AA), acryl amide (AM), 2-hydroxyl methacrylate (HEMA), methyl methacrylate, styrene, etc., can be used as functional polymers for the preparation of MIPs. Divinylbenzene (DVB), ethylene glycol dimethacrylate (EGDMA), N,N-methylenebisacrylamide (BISAM), organophosphate pesticide profenofos, etc., were employed as cross-linkers. As initiators, azobisisobutyronitrile (AIBN), ammonium persulfate (APS), benzoylperoxide, potassium persulfate, etc., can be used for MIPs synthesis. N-tetramethyldiamine can be employed as a catalyst. Benzene, dimethyl sulfoxide, DVB, water, and phosphate buffers can be used as solvents in MIP syntheses. Pure ethanol or methanol, or their mixtures with acetic acid, were employed for template removals from printed polymers.
MIPs based on methyl methacrylic acid as the functional monomer was employed in FOSPR of melanin [122], profenofos [123], l’ nicotiamide [124], trinitrotoluene (TNT) [125], and furfural in wine [126]. MAA, together with HEMA, were used in MIPs for the development of erythromycin [127] and cocaine [128] FOSPR sensors. MIPs based on AM have been employed in FOSPR sensors for the detection of tetracycline [129], vitamin B3 [130], BSA, and S1 subunit of SARS-CoV-2 spike protein [131]. A special MIP was fabricated based on a polyaniline–silver nanocomposite imprinted with ascorbic acid [132]. In this MIP, the nanocomposite polymer was prepared of aniline, silver nitrate, and concentrated nitric acid. Ascorbic acid was added to the polymer as a template. The template was removed from the printed polymer by dipping it in water. It is worth mentioning that MIPs have also been prepared by the sol-gel method [149]. Probably, such materials have not been tested in FOSPR sensors yet. Examples of FOSPR sensors used for detection in solutions are presented in Table 5. More FOSPR sensors for chemical detection in solutions can be found elsewhere [16].
Nanomaterials have also been employed for the preparation of sensing layers of FO SPR sensors for detection in solutions [16]. Such nanomaterials can be prepared by physical methods, e.g., by thermal evaporation, sputtering, nanoimprint lithography, etc. Wet chemical syntheses have also been employed. Thus, gold nanoparticles were prepared by citrate synthesis. This synthesis was based on the reaction of HAuCl4 with trisodium citrate in aqueous solution [150]. The produced nanoparticles were employed in LSPR sensors. Core-shell Al@ZnO nanoparticles were obtained by laser ablation of Al and ZnO targets in water [151]. On the other hand, core-shell α-Fe2O3@SnO2 nanoparticles were obtained via a two-step process [152]. In the first step, solid α-Fe2O3 nanoparticles were prepared by reaction of FeCl3 with NaH2PO4 in an aqueous solution and by centrifugation. In the second step, these NPs were dispersed in a solution of ethylene glycol and coated with a nanoshell of SnO2 fabricated by reaction of K2SnO3 with urea. The solid core-shell NPs were obtained by centrifugation and annealed at temperatures up to 500 °C. To apply these NPs onto sensing fibers by the dip-coating technique, they were probably dispersed in a solvent. However, details of this re-dispersion cannot be found in [152].
Nanoparticles with triangular cross-sections and heights of approximately 50 nm were fabricated by nanoimprint lithography on the distal face of the PCS fiber [154]. In this case, the FOLSPR sensor operated in the reflection mode. A magneto-plasmonic FOSPR sensor of dissolved ammonia was fabricated by coating a thin Co layer (a thickness of 30 nm) by sputtering onto a multimode fiber with a core diameter of 62.5 μm and outer diameter of 125 μm [156]. This layer was overcoated with a silver layer of 60 nm in thickness. A chemical synthesis based on reactions of silver nitrate with sodium hydroxide, ammonium hydroxide, and glucose was used in this case. It was found that the detection sensitivity increases if the external magnetic field is applied.
Some papers on FOSPR sensors of sensing in solutions have dealt with the detection selectivity. It was found that the sensor of ascorbic acid [132] exhibited about ten times higher response to this acid than to uric acid or citric acid. Similar response differences were determined with the erythromycin sensor when used for detecting erythromycin and kanamycin sulfate [127]. About five times higher response of the profenofos sensor to this pesticide than to parathion pesticide was found [123]. The cocaine FOSPR sensor exhibited about three times higher responses to cocaine than to codeine [128]. It was also found that about three times higher responses can be measured for dissolved ammonium than for sensing dissolved sulfates with the ammonium sensor [156].

5. Novel Directions in Fiber-Optic Chemical Nanosensors

Recently, novel nanomaterials have been employed in fiber-optic chemical sensors. These materials allow us to develop fiber-optic nanomaterial-based sensors in which nanoscale dimensions of such nanomaterials bring novel sensing performance. Depending on their characteristic dimensions, these nanomaterials include 0D quantum dots (QDs), 1D nanowires, nanorods or nanotubes, 2D nanosheets, and 3D nanoarrays. A comprehensive review of FO biosensors with detection sites modified with such nanomaterials can be found elsewhere [17]. However, in some papers cited in this review, no biotransducers were reported for sensing analytes important for biology and medicine. Thus, considering sensor definitions, such FO sensors are more chemical sensors [157] than biosensors [158]. Examples of these FO chemical nanosensors are shown in Table 6. Information on 3D sensing nanostructures can be found in Section 3.1.2 and Section 3.3.1 of this paper.

5.1. FO Chemical Sensors with 0D Sensing Nanomaterials

Fluorescence sensors with QDs have been developed. Microwave-assisted wet chemical synthesis was employed for the preparation of carbon QDs modified with o-phenyldiamine (PhDam) [21]. In this synthesis, the QDs were prepared by heating an aqueous solution of citric acid and PhDam in a microwave oven. Quantum dots of CdSe or CdTe were prepared by wet chemical synthesis [22,23]. QDs were applied onto fiber faces by their immersion in QD sols [21,22]. The immersion of an exposed-core microstructure fiber in the CdTe@CdS sol was employed for applying such QDs on the core/boundary surface [23]. In this case, the exposed-core microstructure fiber with a core diameter of 7µm and three large air holes in the cladding was used. One of these holes was accessible from the fiber surface through a grove, thus making it possible to fill it with chemicals. All QDs mentioned in Table 6 were employed for sensing dissolved nitric oxide based on fluorescence quenching.

5.2. FO Chemical Sensors with 1D Sensing Nanomaterials

Carbon nanotubes and ZnO nanorods have been used in FO chemical sensors. Thus, commercially available multi-walled carbon nanotubes (MWCNTs) were used in the catechol FO nanosensor [24]. In this sensor, MWCNTs were used for the preparation of a nanocomposite with ZnO nanoparticles. These nanoparticles were synthesized from zinc acetate. A sensing membrane of CTAB was prepared on the nanocomposite surface that controlled the access and concentrations of catechol in sensing sites on the surface.
Using a hydrothermal growth process, ZnO nanorods were fabricated from zinc acetate and zinc nitrate on the Au layer [25]. Refractive index changes induced by E. coli strain adsorption on nanorods were detected with an SPR sensor. The sensor employed a plastic optical fiber with a gold layer applied on the face and on the core/cladding boundary as well. Thus, the sensor operated both in transmission and reflection modes. The catechol, dopamine, and E. coli strain sensors can be classified as 1D FO nanosensors because they use 1D nanomaterials in sensing layers.
Commercially available MWCNTs were also used in molecularly imprinted pyrrole polymer (MIP) for dopamine detection [159]. This MIP nanocomposite was modified with a nafion assembly that controlled the catechol access and concentrations in sensing sites on the MIP surface.

5.3. FO Chemical Sensors Based on 2D Nanomaterials

Metal nanolayers, graphene nanosheets, MoS2 nanosheets, and nanosheets of MXenes have been employed in 2D nanomaterial FO sensors. The detection sensitivity and selectivity of FO chemical sensors can be enhanced using graphene, graphene oxide, and reduced graphene oxide nanosheets as sensing nanomaterials. Such materials are applied on the core/cladding boundary from graphene materials by immersing the fibers in graphene nanomaterial dispersions for tens of minutes [26,27]. In this case, layers of nanometric dimensions can be fabricated. Commercially available aqueous dispersions of graphene oxide nanosheets [26] and laboratory-prepared nanosheets of reduced graphene oxide were employed for fabrications of sensing layers of the hemoglobin FO sensors [26,27]. These sensors were based on external refractive index changes caused by hemoglobin, which were detected with a tilted fiber grating [26] or long-period grating [27]. The sensing layers were applied on the outer fiber surface with a diameter of 125 µm.
Laboratory-prepared dispersion of reduced graphene oxide was also used in FO sensors of dopamine and nicotine [28]. In these sensors, a special Fabry–Perrot interferometer was set up from an input SM fiber with a core of 8 µm in diameter, output MMF of 105 µm in diameter and a capillary in which both the fibers were inserted. The distal face of the SM fiber and the distal face of the MMF fiber was coated with thin gold layers. The inner wall of the capillary was coated with a layer of reduced graphene (rGO) onto which rhodamine 6G (rh6G) was adsorbed. The fluorescence of rh6G was quenched by this adsorption. In the presence of analyte, rh6G molecules are de-adsorbed from the rGO layer and are replaced with analyte molecules. The liberated rh6G molecules excited at 514 nm emitted the fluorescence at about 560 nm. This fluorescence was coupled into optical modes propagating in the capillary cavity. Intermodal interference was detected using a two-step optoelectronic heterodyne technique, not optically. This technique enabled the extraction of the intermodal interference and suppression of the optoelectronic noise. However, the precise preparation of sensing fibers is necessary for interferometric measurements.
Sulfide nanomaterials, such as MoS2, with structures similar to nanosheet graphene materials, represent new materials for nanosensor developments. A glucose FO SPR sensor based on a multilayer consisting of a gold nanolayer, three monolayers of MoS2, and one monolayer of graphene modified with pyrene-1-boronic acid (PBA) was tested [29]. This detection multilayer was applied on a standard D-shaped SM fiber. A thin layer of Cr (5 nm) was coated on the D-shaped part in order to increase the adhesion of the multilayer to the fiber. PBA was used for controlling the access of glucose to the graphene surface. Commercially available stacks of MoS2 and graphene were used. Such a stack consists of a substrate, monolayer of MoS2 (or graphene), and polymeric cover. In the coating process, the substrate was removed with a suitable solvent, and the monolayer with the cover was floated on the water surface to the surface of the D-part of the fiber. After removing this water, drying, and curing, the polymer cover was dissolved in a suitable solvent. In the case of MoS2, this process was repeated, and several monolayers were applied.
The sensor of BSA [160] was based on refractive index changes induced by different BSA concentrations in a layer of ITO applied onto a Cu layer. In this case, the ITO layer with a thickness of 15 nm both modified the operation range of the SPR sensor and served as the sensing layer. However, a high detection selectivity cannot be expected in this case because active sites on the ITO surface are not specific only for BSA.
An approach for sensing hydrogen peroxide in solution with a disposable SPR sensor was developed [161]. It is based on etching a silver sensor layer by H2O2. Due to the etching, the layer thickness decreases, which is related to a decrease in the intensity of light reflected from the layer. A maximum thickness decrease was of about 20 nm, and a silver layer with a thickness of 10 nm remained on the fiber. A calibration curve was obtained from intensity values determined after etching for 20 min. The approach was employed for sensing hydrogen peroxide generated in the enzymatic oxidation of glucose under the catalysis of glucose oxidase. In this sensor, a tilted fiber grating was inscribed into the core of a standard single-mode fiber.
Recently, new nanomaterials with similar structures as that of graphene have been employed in FO chemical sensors [30,31,162]. These nanomaterials, called MXenes, are based on transition metal carbides or nitrides. Their composition can be described by a general formula Mn+1XnT, where M represents a transition metal, X is carbon or nitrogen, and Tx- hydrophilic terminal groups such as –OH and –F. These terminal groups make such materials very suitable for the detection in aqueous solutions. Nanosheet material based on Nb2CT was used in the FO nanosensor for chlorpyrifos pesticide detection [30]. A tilted fiber grating was used for monitoring refractive index changes induced by the pesticide in the nanomaterial layer (a thickness of 1–5 nm). Unfortunately, one cannot find any information about the material origin and the preparation of the layer on the fiber in the paper [30]. The sensor was based on the photothermal principle. By irradiating a pesticide solution with a laser of 400 nm in wavelength, the refractive index of the solution is changed. This change is detected by the sensor. A method for the compensation of the effects of external temperature fluctuations is proposed in the paper.
A special Mach–Zehnder interferometer modified with Ti3CN nanosheet material was developed for refractive index measurements [31]. This interferometer consists of an input SM fiber with a core diameter of 9 µm, a silica fiber with a diameter of 125 µm and a length of 1 mm, a D-shaped silica fiber of 62.5 µm in thickness and a length of 0.269 mm, a silica fiber of 125 µm in diameter, and the output SM fiber with a core diameter of 9 µm. All these fibers were optically connected by splicing. The resonator cavity was formed by the D-shaped fiber spliced between two short silica fibers. Ti3CN nanomaterial was coated on the D-shaped fiber optically by launching a high-power laser beam in the input SM fiber and putting the D-shaped part in contact with Nb2CN in ethanol. However, details of this preparation are missing in the paper. Spectral interferometry in a spectral range from 1440 to 1640 was used for the sensor interrogation. It was found that the detection sensitivity of the sensor can be increased by increasing the nanomaterial concentration in the dispersion used for its coating [31]. This increase is related to an increase in the sensing layer thickness. The preparation of such interferometers requires great practical experience. Generally, interferometric techniques are sensitive, but they can be influenced by external factors such as temperature, vibrations, etc.
Similar MXene nanomaterial Nb2CT has been tested in a FO nanosensor for detecting concentrations of dissolved oxygen in water (biological oxygen demand-BOD) [162]. In this sensor, nanosheets of the Nb2CT nanomaterial were applied on the waist of a biconical taper prepared from a standard SM fiber. The taper with a waist diameter of 4.7 µm and a length of 2.3 mm was fabricated. Commercially available dispersions of Nb2CT nanomaterial were used. The material was immobilized optically on the waist by launching the laser radiation in the fiber, with the taper being in contact with the dispersion. Strong evanescent waves in the waist region enabled fixing the material to the waist. In measurements, two spectral dips in a spectral region of 1540–1650 nm were employed. These dips shifted to longer wavelengths due to a refractive-index increase in Nb2CT caused by oxygen dissolved in water.
The detection selectivity of some FO chemical nanosensors in Table 6 has also been investigated. It was found that the catechol nanosensor [24] exhibited an about three times higher response to catechol than to dopamine or nitrobenzene. Responses to different chemicals, such as ascorbic acid or uric acid, were also determined with the glucose sensor [29]. For concentrations of 0.1 mM, the highest response was determined for glucose and by about 1.5 times lower response for ascorbic acid. It was also shown that pesticide detection based on the photothermal technique is not influenced by sodium, potassium, and calcium ions in pesticide solutions [30]. About three times higher responses were determined with the dopamine sensor [159] for dopamine than for serotonin or ascorbic acid.

6. Conclusions and Perspectives

This review deals with four types of fiber-optic nanosensors for chemical sensing, namely fiber nanotip sensors, fiber nanoarray sensors, fiber-optic SPR sensors, and fiber-optic nanomaterial-based sensors. These sensors employ silica or plastic optical fibers. The review shows the fabrication of such sensor, their material characteristics, and their sensing performance for chemical detection in gases, solutions, cells, bacteria, pores, etc. Examples of biosensors employing such nanosensors are also reported to document their broad sensing performance.
Fiber nanotip sensors can employ commercially available SNOM nanotips, or they can be prepared by thermal pulling or chemical etching. While thermal pulling requires a sophisticated device, the etching can be realized in a chemical laboratory, provided that safety rules for working with hydrofluoric acid are kept. However, nanotips prepared by chemical etching need to be metalized to preserve their mechanical stability. On the other hand, SNOM nanotips are metalized. Nanotips with apex diameters below 100 nm can be employed for intracellular measurements. However, in this field, they will compete with PEBBLES (probes embedded in biologically localized environments). Thus fiber-optic nanotip and microtip sensors can be useful for chemical detection in pores, cell tissues, and small drops. Chemical sensing in plant tissues and drops of exudates from plants is possible with fiber microtip sensors [163] and can provide us with information on chemical mechanisms in plant tissues, leaves, etc. Information about concentrations of chemicals in material pores can be employed for investigations of solid catalysts, metal corrosion, etc. One can also expect that fiber-optic microtips and nanotips will be employed for the development of optical tweezers and coupling devices. Fiber nanotips coated with metallic nanoparticles or nanoislands exhibit very good performance for SERS-based chemical analysis, which still is not fully employed.
Fiber nanoarray sensors based on imaging fibers offer us great performance for precise imaging and multiplexed sensing in solutions, small objects, cellular cultures, etc. The fabrication of such nanoarrays by chemical etching is simple and well-elaborated. The quality of imaging with imaging fibers can hardly be overcome with other techniques. In the field of sensing arrays, they will compete with approaches employing microtitration plates [164] and “Lab-on-fiber” approaches. The potential of fiber nanoarrays for the development of SERS-based chemical sensors is not still fully utilized. One can expect that novel robotic techniques will allow the rapid development of “Lab-on-fiber” micro and nanosensors for chemical sensing and biosensing.
Many remarkable results have been achieved with fiber-optic SPR chemical sensors and mainly biosensors. However, fiber-optic chemical sensors compete with commercially available SPR devices based on prisms or gratings as excitation elements. Such devices enable multichannel detection with referencing, which is not common for fiber-optic SPR sensors. Moreover, the preparation of fiber-optic SPR sensors requires special physical techniques such as thermal evaporation or sputtering for the application of metal nanolayers. In some fiber-optic SPR sensors, it is necessary for the fiber to be rotated during the metal application on the fiber. Thus, fiber-optic SPR sensors are expected to be more employed in well-equipped laboratories where they can offer great performance for the research and development of novel chemical transducers and biotransducers and for detection in multicomponent samples.
Recently, many fiber-optic nanomaterial-based chemical sensors have been investigated. Such nanosensors employed quantum dots, carbon nanotubes, oxide nanorods, ceramic or metal nanolayers, nanosheets of graphene materials, sulfide materials, and MXenes, as well as nanoarrays on the fiber faces. Such materials have been applied to different fiber-optic elements. One can expect that the research and development of sensing nanomaterials will rapidly continue in the future. To test the sensing performance of such novel nanomaterials, optical fibers can be useful. Such nanomaterials can be tested using evanescent-wave fiber-optic sensors with increased sensitivity [20], fibers with inscribed gratings, and photonic crystal fibers. One can expect that the use of such sensing approaches will enable us to decrease the research expenses necessary for the development of novel sensing materials.

Author Contributions

Conceptualization, V.M. and I.K.; methodology, V.M. and I.K.; validation, V.M., I.K. and I.K.; formal analysis, V.M.; investigation, V.M., I.K. and I.B., resources, V.M. and I.B.; writing—original draft preparation, V.M.; writing—review and editing, V.M., I.K. and I.B., supervision, V.M.; project administration, V.M. and I.K.; funding acquisition, V.M. and I.K. All authors have read and agreed to the published version of the manuscript.

Funding

The paper was supported by the Ministry of Education, Youth and Sport of the Czech Republic (contract No. LC06034), by Grant Agency AS CR (grant No. IAA600380805), and by the Czech Science Foundation (contracts. 102/05/0956, 102/08/P639, 102/99/0548, P102/12/2361).

Acknowledgments

The authors acknowledge Daniela Berkova for collecting and sorting the papers on which this paper is based.

Conflicts of Interest

The authors declare no conflict of interest.

References

  1. Wolfbeis, O.S. Fiber-Optic Chemical Sensors and Biosensors. Anal. Chem. 2002, 74, 2662–2678. [Google Scholar] [CrossRef]
  2. Wolfbeis, O.S. Fiber-Optic Chemical Sensors and Biosensors. Anal. Chem. 2004, 76, 3269–3284. [Google Scholar] [CrossRef]
  3. Wolfbeis, O.S. Fiber-Optic Chemical Sensors and Biosensors. Anal. Chem. 2006, 78, 3859–3874. [Google Scholar] [CrossRef]
  4. Wolfbeis, O.S. Fiber-Optic Chemical Sensors and Biosensors. Anal. Chem. 2008, 80, 4269–4283. [Google Scholar] [CrossRef] [PubMed]
  5. Wang, X.-D.; Wolfbeis, O.S. Fiber-Optic Chemical Sensors and Biosensors (2008−2012). Anal. Chem. 2013, 85, 487–508. [Google Scholar] [CrossRef]
  6. Wang, X.-D.; Wolfbeis, O.S. Fiber-Optic Chemical Sensors and Biosensors (2013−2015). Anal. Chem. 2016, 88, 203–227. [Google Scholar] [CrossRef]
  7. Wang, X.-D.; Wolfbeis, O.S. Fiber-Optic Chemical Sensors and Biosensors (2015−2019). Anal. Chem. 2020, 92, 397–430. [Google Scholar] [CrossRef] [PubMed]
  8. Borisov, S.M.; Wolfbeis, O.S. Optical Biosensors. Anal. Chem. 2008, 108, 423–461. [Google Scholar] [CrossRef] [PubMed]
  9. Abdelmalek, F.; Lacroix, M.; Chovelon, J.M.; Jaffrezic-Renault, N.; Berkova, D.; Matejec, V.; Kasik, I.; Chomat, M.; Gagnaire, H. Consequences of TiO2 doping on the optical properties of porous silica layers coated on silica optical fibers. Thin Sol. Film. 1999, 340, 280–287. [Google Scholar] [CrossRef]
  10. Skokankova, J.; Mrazek, J.; Matejec, V.; Hayer, M.; Kasik, I.; Chomat, M.; Berkova, D.; Barau, A.; Zaharescu, M.; Raileanu, M. Properties of xerogel layers for the detection of toluene in water. Mater. Sci. Eng. C 2006, 26, 208–213. [Google Scholar] [CrossRef]
  11. Abdelghani, A. Jaffrezic-Renault, N. SPR fibre sensor sensitised by fluorosiloxane polymers. Sens. Actuators B-Chem. 2001, 74, 117–123. [Google Scholar] [CrossRef]
  12. Snyder, A.W.; Love, J.D. Optical Waveguide Theory. Part II Electromagnetic Analysis of Optical Waveguides; Springer: New York, NY, USA, 1983; pp. 203–353. [Google Scholar] [CrossRef]
  13. Monro, T.M.; Belardi, W.; Furusawa, K.; Baggett, J.C.; Broderick, N.G.R.; Richardson, D.J. Sensing with microstructured optical fibres. Meas. Sci. Technol. 2001, 12, 854–858. [Google Scholar] [CrossRef]
  14. Matejec, V.; Mrázek, J.; Hayer, M.; Podrazký, O.; Kaňka, J.; Kašík, I. Sensitivity of microstructure fibers to gaseous oxygen. Meas. Sci. Eng. 2008, 28, 876–881. [Google Scholar] [CrossRef]
  15. Elsherif, M.; Salih, A.E.; Gutiérrez Munoz, M.; Alam, F.; AlQattan, B.; Antonysamy, D.S.; Fawzi Zaki, M.; KYetisen, A.; Park, S.; Wilkinson, T.D.; et al. Optical Fiber Sensors: Working Principle, Applications, and Limitations. Adv. Photonics Res. 2022, 3, 2100371. [Google Scholar] [CrossRef]
  16. Gupta, B.D.; Kant, R. Recent advances in surface plasmon resonance based fiber optic chemical and biosensors utilizing bulk and nanostructures. Opt. Laser Technol. 2018, 101, 144–161. [Google Scholar] [CrossRef]
  17. Li, M.; Singh, R.; Wang, Y.; Marques, C.; Zhang, B.; Kumar, S. Advances in Novel Nanomaterial-Based Optical Fiber Biosensors—A Review. Biosensors 2022, 12, 843. [Google Scholar] [CrossRef]
  18. Boussard-Plédel, C. Chalcogenide waveguides for infrared sensing. In Chalcogenide Glasses: Preparation, Properties and Applications; Adam, J.-L., Zhang, X., Eds.; Woodhead Publishing Series in Electronic and Optical Materials; Woodhead Publishing Limited: Oxford, UK; Cambridge, UK; London, UK; Philadelphia, PA, USA; New Delhi, India, 2014; Volume 44, pp. 381–410. [Google Scholar] [CrossRef]
  19. Bureau, B.; Boussard, C.; Cui, S.; Chahal, R.; Laure Anne, M.; Nazabal, V.; Sire, O.; Loréal, O.; Lucas, P.; Monbet, V.; et al. Chalcogenide optical fibers for midinfrared sensing. Opt. Eng. 2014, 53, 027101. [Google Scholar] [CrossRef]
  20. Matějec, V.; Chomát, M.; Hayer, M.; Kašik, I.; Berková, D. Development of special optical fibers for evanescent-wave chemical sensing. Czech. J. Phys. 1999, 49, 883–888. [Google Scholar] [CrossRef]
  21. Wu, W.; Huang, J.; Ding, L.; Lin, H.; Yu, S.; Yuan, F.; Liang, B. A real-time and highly sensitive fiber optic biosensor based on the carbon quantum dots for nitric oxide detection. J. Photochem. Photobiol. A 2021, 405, 112963. [Google Scholar] [CrossRef]
  22. Ding, L.; Fan, C.; Zhong, Y.; Li, T.; Huang, J. A sensitive optic fiber sensor based on CdSe QDs fluorophore for nitric oxide detection. Sens. Actuators B-Chem. 2013, 185, 70–76. [Google Scholar] [CrossRef]
  23. Ding, L.Y.; Ruan, Y.L.; Li, T.; Huang, J.; Warren-Smith, S.C.; Ebendorff-Heidepriem, H.; Monro, T.M. Nitric oxide optical fiber sensor based on exposed core fibers and CdTe/CdS quantum dots. Sens. Actuators B-Chem. 2018, 273, 9–17. [Google Scholar] [CrossRef]
  24. Pathak, A.; Gupta, B.D. Fiber-Optic Plasmonic Sensor Utilizing CTAB-Functionalized ZnO Nanoparticle-Decorated Carbon Nanotubes on Silver Films for the Detection of Catechol in Wastewater. ACS Appl. Nano Mater. 2020, 3, 2582–2593. [Google Scholar] [CrossRef]
  25. Fallah, H.; Asadishad, T.; Parsanasab, G.-M.; Harun, S.W.; Mohammed, W.S.; Yasin, M. Optical Fiber Biosensor toward E-coli Bacterial Detection on the Pollutant Water. Eng. J. 2021, 25, 1–8. [Google Scholar] [CrossRef]
  26. Sun, Y.; Guo, X.; Moreno, Y.; Sun, Q.; Yan, Z.; Zhang, L. Sensitivity adjustable biosensor based on graphene oxide coated excessively tilted fiber grating. Sens. Actuators B-Chem. 2022, 351, 130832. [Google Scholar] [CrossRef]
  27. Wang, R.; Ren, Z.; Kong, D.; Hu, B.; He, Z. Highly sensitive label-free biosensor based on graphene-oxide functionalized micro-tapered long period fiber grating. Opt. Mater. 2020, 109, 110253. [Google Scholar] [CrossRef]
  28. Cao, Z.; Yao, B.; Qin, C.; Yang, R.; Guo, Y.; Zhang, Y.; Wu, Y.; Bi, L.; Chen, Y.; Xie, Z.; et al. Biochemical sensing in graphene enhanced microfiber resonators with individual molecule sensitivity and selectivity. Light Sci. Appl. 2019, 8, 107. [Google Scholar] [CrossRef]
  29. Yu, H.; Chong, Y.; Zhang, P.; Ma, J.; Li, D. A D-shaped fiber SPR sensor with a composite nanostructure of MoS2-graphene for glucose detection. Talanta 2020, 219, 121324. [Google Scholar] [CrossRef] [PubMed]
  30. Li, W.; Miao, Y.; Guo, T.; Zhang, K.; Yao, J. Nb2CTx MXene-tilted fiber Bragg grating optofluidic system based on photothermal spectroscopy for pesticide detection. Biomed. Opt. Express 2021, 12, 7051–7063. [Google Scholar] [CrossRef]
  31. Yi, D.; Wang, C.; Gao, L.; Chen, Y.; Liu, F.; Geng, Y.; Zhang, H.; Li, X. Ti3CN MXene-based ultra-sensitive optical fiber salinity sensor. Opt. Lett. 2022, 47, 138–141. [Google Scholar] [CrossRef]
  32. Baig, N.; Kammakakam, I.; Falathabe, W. Nanomaterials: A review of synthesis methods, properties, recent progress, and challenges. Mater. Adv. 2021, 2, 1821–1871. [Google Scholar] [CrossRef]
  33. Berneschi, S.; Barucci, A.; Baldini, F.; Cosi, F.; Quercioli, F.; Pelli, S.; Righini, G.C.; Tiribilli, B.; Tombelli, S.; Trono, C.; et al. Optical Fibre Micro/Nano Tips as Fluorescence-Based Sensors and Interrogation Probes. Optics 2020, 1, 213–242. [Google Scholar] [CrossRef]
  34. Deiss, F.; Sojic, N.; White, D.J.; Stoddart, P.R. Nanostructured optical fibre arrays for high-density biochemical sensing and remote imaging. Anal. Bioanal. Chem. 2010, 396, 53–71. [Google Scholar] [CrossRef]
  35. Betzig, E.; Trautman, J.K.; Harris, T.D.; Weiner, J.S.; Kostelak, R.L. Breaking the Diffraction Barrier: Optical Microscopy on a Nanometric Scale. Science 1991, 251, 1468–1470. [Google Scholar] [CrossRef] [PubMed]
  36. Tan, W.; Shi, Z.-Y.; Smith, S.; Birnbaum, D.; Raoul Kopelman, R. Submicrometer Intracellular Chemical Optical Fiber Sensor. Science 1992, 258, 778–781. [Google Scholar] [CrossRef]
  37. Lewis, A.; Lieberman, K. The optical Near Field and Analytical Chemistry. Anal. Chem. 1991, 63, 625A–638A. [Google Scholar] [CrossRef]
  38. Lee, S.; Jiao, M.; Zhang, Z.; Yu, Y. Nanoparticles for Interrogation of Cell Signaling. Annu. Rev. Anal. Chem. 2023, 16, 333–351. [Google Scholar] [CrossRef]
  39. Clark, H.A.; Hoyer, M.; Philbert, M.A.; Kopelman, R. Optical Nanosensors for Chemical Analysis inside Single Living Cells. 1. Fabrication, Characterization, and Methods for Intracellular Delivery of PEBBLE Sensors. Anal. Chem. 1999, 71, 4831–4836. [Google Scholar] [CrossRef] [PubMed]
  40. Clark, H.A.; Kopelman, R.; Tjalkens, R.; Philbert, M.A. Optical Nanosensors for Chemical Analysis inside Single Living Cells. 2. Sensors for pH and Calcium and the Intracellular Application of PEBBLE. Anal. Chem. 1999, 71, 4837–4843. [Google Scholar] [CrossRef]
  41. Kopelman, R.; Smith, S.; Tan, W.; Zenobi, R.; Lieberman, K.; Lewis, A. Spectral analysis of surfaces at subwavelength resolution, Proc. SPIE Environ. Process Monit. Technol. 1992, 1637, 33–40. [Google Scholar]
  42. Paiva, J.S.; Jorge, P.A.S.; Rosa, C.C.; Cunha, J.P.S. Optical fiber tips for biological applications: From light confinement, biosensing to bioparticles manipulation—Review. Biochim. Biophys. Acta (BBA)-General. Subj. 2018, 1862, 1209–1246. [Google Scholar] [CrossRef]
  43. Valaskovic, G.A.; Holton, M.; Morrison, G.H. Parameter control, characterization, and optimization in the fabrication of optical fiber near-field probes. Appl. Opt. 1995, 34, 1215–1228. [Google Scholar] [CrossRef]
  44. Turner, D.R. Etch Procedure for Optical Fibers. US Patent 4,469,554, 4 September 1984. [Google Scholar]
  45. Hoffmann, P.; Dutoit, B.; Salathe, R.-P. Comparison of mechanically drawn and protection layer chemically etched optical fiber tips. Ultramicroscopy 1995, 61, 165–170. [Google Scholar] [CrossRef]
  46. Anderson, G.P.; Golden, J.P.; Ligler, F.S. A fiber tapered optic biosensor: Combination fibers designed for improved signal acquisition. Biosens. Bioelectr. 1993, 8, 249–256. [Google Scholar] [CrossRef]
  47. Muramatsu, H.; Homma, K.; Chiba, N.; Yamamoto, N.; Egawa, A. Dynamic etching method for fabricating a variety of tip shapes in the optical fibre probe of a scanning near-field optical microscope. J. Microscop. 1999, 194, 383–387. [Google Scholar] [CrossRef]
  48. Lazarev, A.; Fang, N.; Luo, Q.; Zhang, X. Formation of fine near-field scanning optical microscopy tips. Part I. Rev. Sci. Instrum. 2003, 74, 3679–3683. [Google Scholar] [CrossRef]
  49. Giannetti, A.; Barucci, A.; Cosi, F.; Pelli, S.; Tombelli, S.; Trono, C.; Baldini, F. Optical fiber nanotips coated with molecular beacons for DNA detection. Sensors 2015, 15, 9666–9680. [Google Scholar] [CrossRef] [PubMed]
  50. Griffini, D.; Insinna, M.; Salvadori, S.; Barucci, A.; Cosi, F.; Pelli, S.; Righini, G.C. On the CFD analysis of a stratified taylor-couette system dedicated to the fabrication of nanosensors. Fluids 2017, 2, 8. [Google Scholar] [CrossRef]
  51. Lambelet, P.; Sayah, A.; Pfeffer, M.; Philipona, C.; Marquis-Weible, F. Chemically etched fiber tips for near-fieldoptical microscopy: A process for smoother tips. Appl. Opt. 1998, 37, 7289–7292. [Google Scholar] [CrossRef]
  52. Stὅckle, R.; Fokas, C.; Deckert, V.; Zenobia, R.; Sick, B.; Hecht, B.; Wild, U.P. High-quality near-field optical probes by tube etching. Appl. Phys. 1999, 75, 160–162. [Google Scholar] [CrossRef]
  53. Pangaribuana, T.; Jiang, S.; Ohtsu, M. Highly Controllable Fabrication of Fiber Probe for Photon Scanning Tunneling. Scanning 1994, 16, 362–367. [Google Scholar] [CrossRef]
  54. Koronczi, I.; Reichert, J.; Ache, H.J.; Krause, C.; Werner, T.; Wolfbeis, O.S. Submicron sensors for ion detection based on measurement of luminescence decay time. Sens. Actuators B-Chem. 2001, 74, 47–53. [Google Scholar] [CrossRef]
  55. Koronczi, I.; Reichert, J.; Heinzmann, G.; Ache, H.J. Development of a submicron optochemical potassium sensor with enhanced stability due to internal reference. Sens. Actuators B-Chem. 1998, 51, 188–195. [Google Scholar] [CrossRef]
  56. Tai, Y.-H.; Wei, P.-K. Sensitive liquid refractive index sensors using tapered optical fiber tips. Opt. Lett. 2010, 35, 944–946. [Google Scholar] [CrossRef]
  57. Tan, W.; Shi, Z.Y.; Kopelman, R. Development of submicron chemical fiber optic sensors. Anal. Chem. 1992, 64, 2985–2990. [Google Scholar] [CrossRef]
  58. Munkholm, C.; Walt, D.R.; Milanovich, F.P.; Klainer, S.M. Polymer Modification of Fiber Optic Chemical Sensors as a Method of Enhancing Fluorescence Signal for pH Measurement. Anal. Chem. 1986, 58, 1427–1430. [Google Scholar] [CrossRef]
  59. Vo-Dinh, T.; Kasili, P.; Wabuyele, M. Nanoprobes and nanobiosensors for monitoring, and imaging individual living cells. Nanomed. Nanotechnol. Biol. Medic. 2006, 2, 22–30. [Google Scholar] [CrossRef] [PubMed]
  60. Wanga, S.; Ye, F.; Lang, X.; Fei, D.; Ge, Y.; Turner, A.P.F. Detection of [Ca2+] changes in sub-plasma membrane microdomains in a single living cell by an optical fiber-based nanobiosensor. Austin J. Nanomed. Nanotechnol. 2014, 2, 1022. [Google Scholar]
  61. Barker, S.L.R.; Bjorn, A.; Thorsrud, B.A.; Kopelman, R. Nitrite- and Chloride-Selective Fluorescent Nano-Optodes and in Vitro Application to Rat Conceptuses. Anal. Chem. 1998, 70, 100–104. [Google Scholar] [CrossRef]
  62. Tan, W.; Shi, Z.-Y.; Kopelman, R. Miniaturized fiber-optic chemical sensors with fluorescent dye-doped polymers. Sens. Actuators B-Chem. 1995, 28, 157–165. [Google Scholar] [CrossRef]
  63. Rosenzweig, Z.; Kopelman, R. Development of a submicrometer optical fiber oxygen sensor. Anal. Chem. 1995, 67, 2650–2654. [Google Scholar] [CrossRef]
  64. Tan, W.; Kopelman, R.; Barker, S.L.R.; Miller, M.T. Peer Reviewed: Ultrasmall Optical Sensors for Cellular Measurements. Anal. Chem. 1999, 71, 606A–612A. [Google Scholar] [CrossRef]
  65. Hossein-Zadeha, M.; Delgado, J.; Schweizer, F.; Lieberman, R. Sub-micron Opto-Chemical Probes for Studying Living Neurons. In Proceedings of the SPIE 10051, Neural Imaging and Sensing, San Francisco, CA, USA, 8 February 2017. 100510G; paper 100510G(9pp). [Google Scholar] [CrossRef]
  66. Bui, J.D.; Zelles, T.; Lou, H.J.; Gallion, V.L.; Phillips, M.I.; Tan, W. Probing intracellular dynamics in living cells with near-field optics. J. Neurosc. Methods 1999, 89, 9–15. [Google Scholar] [CrossRef]
  67. Vo-Dinh, T.; Kasili, P. Fiber-optic nanosensors for single-cell monitoring-Review. Anal. Bioanal. Chem. 2005, 382, 918–925. [Google Scholar] [CrossRef] [PubMed]
  68. Alarie, J.P.; Vo-Dinh, T. Antibody-Based Submicron Biosensor for Benzo[A]Pyrene DNA Adduct. Polycycl. Arom. Compd. 1996, 8, 45–52. [Google Scholar] [CrossRef]
  69. Cullum, B.M.; Griffin, G.D.; Miller, G.H.; Vo-Dinh, T. Intracellular Measurements in Mammary Carcinoma Cells Using Fiber-Optic Nanosensors. Anal. Biochem. 2000, 277, 25–32. [Google Scholar] [CrossRef] [PubMed]
  70. Kasili, P.M.; Song, J.M.; Vo-Dinh, T. Optical Sensor for the Detection of Caspase-9 Activity in a Single Cell. J. Am. Chem. Soc. 2004, 126, 2799–2806. [Google Scholar] [CrossRef]
  71. Barker, S.L.R.; Kopelman, R. Development and Cellular Applications of Fiber Optic Nitric Oxide Sensors Based on a Gold-Adsorbed Fluorophore. Anal. Chem. 1998, 70, 4902–4906. [Google Scholar] [CrossRef]
  72. Cordek, J.; Wang, X.; Tan, W. Direct Immobilization of Glutamate Dehydrogenase on Optical Fiber Probes for Ultrasensitive Glutamate Detection. Anal. Chem. 1999, 71, 1529–1533. [Google Scholar] [CrossRef]
  73. Song, J.M.; Kasili, P.M.; Griffin, G.D.; Vo-Dinh, T. Detection of Cytochrome c in a Single Cell Using an Optical Nanobiosensor. Anal. Chem. 2004, 76, 2591–2594. [Google Scholar] [CrossRef]
  74. Petry, R.; Schmitt, M.; Popp, J. Raman spectroscopy—A prospective tool in the Life Sciences. Chem. Phys. Chem. 2003, 4, 14–30. [Google Scholar] [CrossRef]
  75. Jonathan, P.; Scaffidi, J.P.; Gregas, M.K.; Seewaldt, V.; Vo-Dinh, T. SERS-based plasmonic nanobiosensing in single living cells. Anal. Bioanal. Chem. 2009, 393, 1135–1141. [Google Scholar] [CrossRef]
  76. Chen, Z.; Dai, Z.; Chen, N.; Liu, S.; Pang, F.; Lu, B.; Wang, T. Gold Nanoparticles-Modified Tapered Fiber Nanoprobe for Remote SERS Detection. IEEE Phot. Technol. Lett. 2014, 26, 777–780. [Google Scholar] [CrossRef]
  77. Lucotti, A.; Zerbi, G. Fiber-optic SERS sensor with optimized geometry. Sens. Actuators B-Chem. 2007, 121, 356–364. [Google Scholar] [CrossRef]
  78. Wang, J.; Geng, Y.; Shen, Y.; Shib, W.; Xu, W.; Xu, S. SERS-active fiber tip for intracellular and extracellular pH sensing in living single cells. Sens. Actuators B-Chem. 2019, 290, 527–534. [Google Scholar] [CrossRef]
  79. Hutter, T.; Elliot, S.R.; Mahajan, S. Optical fibre-tip probes for SERS: Numerical study for design considerations. Opt. Express 2018, 26, 15539–15550. [Google Scholar] [CrossRef] [PubMed]
  80. Zheng, X.T.; Hua, W.; Wang, H.; Yang, H.; Zhoud, W.; Li, C.M. Bifunctional electro-optical nanoprobe to real-time detect local biochemical processes in single cells. Biosens. Bioelectron. 2011, 26, 4484–4490. [Google Scholar] [CrossRef]
  81. Walt, D.R. Fiber Optic Array Biosensors. BioTechniques 2006, 41, 529–535. [Google Scholar] [CrossRef]
  82. Bronk, K.S.; Michael, K.L.; Pantano, P.; Walt, D.R. Combined Imaging and Chemical Sensing Using a Single Optical Imaging Fiber. Anal. Chem. 1995, 67, 2750–2757. [Google Scholar] [CrossRef]
  83. Kapany, N.S. Method of Making a Fiber Optical Bundle. US Patent 3,190,735, 22 June 1965. [Google Scholar]
  84. Fiber Bundles. Available online: https://www.rp-photonics.com/fiber_bundles (accessed on 15 August 2023).
  85. Fiber Optic Technology. Available online: https://www.schott.com/en-us/expertise/technology-and-processing/fiber-optic-technology (accessed on 15 August 2023).
  86. Ghaemi, H.F.; Li, Y.; Thio, T.; Wang, T. Fiber image guide with subwavelength resolution. Appl. Phys. Lett. 1998, 72, 1137–1139. [Google Scholar] [CrossRef]
  87. White, J.; Kauer, J.S.; Dickinson, T.A.; Walt, D.R. Rapid Analyte Recognition in a Device Based on Optical Sensors and the Olfactory Systém. Anal. Chem. 1996, 68, 2191–2202. [Google Scholar] [CrossRef] [PubMed]
  88. Pantano, P.; Walt, D.R. Ordered Nanowell Arrays. Chem. Mater. 1996, 8, 2832–2835. [Google Scholar] [CrossRef]
  89. White, D.J.; Mazzolini, A.P.; Stoddart, P.R. Fabrication of a range of SERS substrates on nanostructured multicore optical fibres. J. Raman Spectrosc. 2007, 38, 377–382. [Google Scholar] [CrossRef]
  90. White, D.J.; Stoddart, P.R. Nanostructured optical fiber with surface-enhanced Raman scattering functionality. Opt. Lett. 2005, 30, 598–600. [Google Scholar] [CrossRef] [PubMed]
  91. Guieu, V.; Lagugné-Labarthet, F.; Servant, L.; Talaga, D.; Sojic, N. Ultrasharp Optical-Fiber Nanoprobe Array for Raman Local-Enhancement Imaging. Small 2008, 4, 96–99. [Google Scholar] [CrossRef] [PubMed]
  92. Guieu, V.; Talaga, D.; Servant, L.; Sojic, N.; Lagugne’-Labarthet, F. Multitip-Localized Enhanced Raman Scattering from a Nanostructured Optical Fiber Array. J. Phys. Chem. C 2009, 113, 874–881. [Google Scholar] [CrossRef]
  93. Guieu, V.; Garrigue, P.; Lagugné-Labarthet, F.; Servant, L.; Sojic, N.; Talaga, D. Remote surface enhanced Raman spectroscopy imaging via a nanostructured optical fiber bundle. Opt. Expr. 2009, 17, 24030–24035. [Google Scholar] [CrossRef] [PubMed]
  94. Pantano, P.; Walt, D.R. Toward a near-field optical array. Rev. Sci. Instr. 1997, 68, 1537–1539. [Google Scholar] [CrossRef]
  95. Liu, Y.H.; Dam, T.H.; Pantano, P. A pH-sensitive nanotip array imaging sensor. Anal. Chim. Acta 2000, 419, 215–225. [Google Scholar] [CrossRef]
  96. Tam, J.M.; Song, L.; Walt, D.R. Fabrication and optical characterization of imaging fiber-based nanoarrays. Talanta 2005, 67, 498–502. [Google Scholar] [CrossRef]
  97. Tam, J.M.; Song, L.; Walt, D.R. DNA detection on ultrahigh-density optical fiber-based nanoarrays. Bios. Bioelectr. 2009, 24, 2488–2493. [Google Scholar] [CrossRef]
  98. Pisco, M.; Galeotti, F.; Quero, G.; Grisci, G.; Micco, A.; Mercaldo, L.V.; Veneri, P.D.; Cutolo, A.; Cusano, A. Nanosphere lithography for optical fiber tip nanoprobes. Light Sci. Appl. 2017, 6, e16229. [Google Scholar] [CrossRef] [PubMed]
  99. Liang, Y.; Yu, Z.; Li, L.; Xu, T. A self-assembled plasmonic opticalfiber nanoprobe for label-free biosensing. Sci. Rep. 2019, 9, 7379. [Google Scholar] [CrossRef]
  100. Smythe, E.J.; Dickey, M.D.; Bao, J.; Whitesides, G.M.; Capasso, F. Optical antenna arrays on a fiber facet for in situ surface enhanced Raman scattering detection. Nano Lett. 2009, 9, 1132–1138. [Google Scholar] [CrossRef]
  101. Kostovski, G.; White, D.J.; Mitchell, A.; Austin, M.W.; Stoddart, P.R. Nanoimprinted optical fibres: Biotemplated nanostructures for SERS sensing. Biosens. Bioelectr. 2009, 24, 1531–1535. [Google Scholar] [CrossRef] [PubMed]
  102. Dromard, T.; Lévêque, J.-L.; Sojic, N. Remote in vivo imaging of fluorescein-stained corneocytes on human skin. Rev. Sci. Instrum. 2007, 78, 053709. [Google Scholar] [CrossRef]
  103. Zhao, Y.; Richman, A.; Storey, C.; Nina, B.; Radford, N.B.; Pantano, P. In Situ Fiber-Optic Oxygen Consumption Measurements from a Working Mouse Heart. Anal. Chem. 1999, 71, 3887–3893. [Google Scholar] [CrossRef] [PubMed]
  104. Li, L.; Walt, D.R. Dual-Analyte Fiber-Optic Sensor for the Simultaneous and Continuous Measurement of Glucose and Oxygen. Anal. Chem. 1995, 67, 3746–3752. [Google Scholar] [CrossRef]
  105. Ferguson, J.A.; Healey, B.G.; Bronk, K.S.; Barnard, S.M.; Walt, D.R. Simultaneous monitoring of pH, CO2 and 02 using an optical imaging fiber. Anal. Chim. Acta 1997, 340, 123–131. [Google Scholar] [CrossRef]
  106. Steemers, F.J.; Walt, D.R. Multi-Analyte Sensing: From Site-Selective Deposition to Randomly-Ordered Addressable Optical Fiber Sensors. Mikrochim. Acta 1999, 131, 99–105. [Google Scholar] [CrossRef]
  107. Czarnik, A.W. Encoding methods for combinatorial chemistry. Curr. Opin. Chem. Biol. 1997, 1, 60–66. [Google Scholar] [CrossRef]
  108. Venketeswaran, A.; Lalam, N.; Wuenschell, J.; Ohodnicki, P.R., Jr.; Badar, M.; Chen, K.P.; Lu, P.; Duan, Y.; Chorpening, B.; Buric, M. Recent Advances in Machine Learning for Fiber Optic Sensor Applications. Adv. Intell. Syst. 2022, 4, 2100067. [Google Scholar] [CrossRef]
  109. Biran, I.; Walt, D.R. Optical Imaging Fiber-Based Single Live Cell Arrays: A High-Density Cell Assay Platform. Anal. Chem. 2002, 74, 3046–3054. [Google Scholar] [CrossRef] [PubMed]
  110. Chen, K.; Adam, K.; Sojic, N.; Schmittel, M. Photochemical functionalisation of optical nanotips with a rhodamine chemosensor for remote through-fiber detection of Hg2+. RSC Adv. 2013, 3, 24140–24145. [Google Scholar] [CrossRef]
  111. Hankus, M.E.; Li, H.; Gibson, G.J.; Cullum, B.M. Surface-Enhanced Raman Scattering-Based Nanoprobe for High-Resolution, Non-Scanning Chemical Imaging. Anal. Chem. 2006, 78, 7535–7546. [Google Scholar] [CrossRef]
  112. Descamps, E.; Duroure, N.; Deiss, F.; Leichle’, T.; Adam, C.; Mailley, P.; Aı¨t-Ikhlef, A.; Livache, T.; Nicub, L.; Sojic, N. Functionalization of optical nanotip arrays with an electrochemical microcantilever for multiplexed DNA detection. Lab. Chip. 2013, 13, 2956–2962. [Google Scholar] [CrossRef]
  113. Chovin, A.; Garrigue, P.; Pecastaings, G.; Saadaoui, H.; Sojic, N. Development of an ordered microarray of electrochemiluminescent nanosensors. Meas. Sci. Technol. 2006, 17, 1211–1219. [Google Scholar] [CrossRef]
  114. Homola, J. (Ed.) Surface Plasmon Resonance Based Sensors; Springer: Berlin/Heidelberg, Germany, 2006; pp. 1–251. [Google Scholar]
  115. Petryayeva, E.; Krull, U.J. Localized surface plasmon resonance: Nanostructures, bioassays and biosensing—A review. Anal. Chim. Acta 2011, 706, 8–24. [Google Scholar] [CrossRef] [PubMed]
  116. Bardin, F.; Kašík, I.; Trouillet, A.; Matějec, V.; Gagnaire, H.; Chomát, M. Surface plasmon resonance sensor using an optical fiber with an inverted graded-index profile. Appl. Opt. 2002, 41, 2514–2520. [Google Scholar] [CrossRef]
  117. Bévenot, X.; Trouillet, A.; Veillas, C.; Gagnaire, H.; Cléement, M. Surface plasmon resonance hydrogen sensor using an optical fibre. Meas. Sci. Technol. 2002, 13, 118–124. [Google Scholar] [CrossRef]
  118. Slavík, R.; Homola, J.; Čtyroky, J. Single-mode optical fiber surface plasmon resonance sensor. Sens. Actuators B-Chem. 1999, 54, 74–79. [Google Scholar] [CrossRef]
  119. Mishra, S.K.; Tripathi, S.N.; Choudhary, V.; Gupta, B.D. SPR based fiber optic ammonia gas sensor utilizing nanocomposite film of PMMA/reduced graphene oxide prepared by in situ polymerization. Sens. Actuators B-Chem. 2014, 199, 190–200. [Google Scholar] [CrossRef]
  120. Raj, D.R.; Prasanth, S.; Vineeshkumar, T.V.; Sudarsanakumar, C. Ammonia sensing properties of tapered plastic optical fiber coated with silver nanoparticles/PVP/PVA hybrid. Opt. Commun. 2015, 340, 86–92. [Google Scholar] [CrossRef]
  121. Mishra, S.K.; Tripathi, S.N.; Choudhary, V.; Gupta, B.D. Surface plasmon resonance–based fiber optic methane gas sensor utilizing graphene–carbon nanotubes–poly(methyl methacrylate) hybrid nanocomposite. Plasmonics 2015, 10, 1147–1157. [Google Scholar] [CrossRef]
  122. Shrivastav, A.M.; Mishra, S.K.; Gupta, B.D. Fiber optic SPR sensor for the detection of melamine using molecular imprinting. Sens. Actuators B-Chem. 2015, 212, 404–410. [Google Scholar] [CrossRef]
  123. Shrivastav, A.M.; Usha, S.P.; Gupta, B.D. Fiber optic profenofos sensor based on surface plasmon resonance technique and molecular imprinting. Biosens. Bioelectron. 2017, 79, 150–157. [Google Scholar] [CrossRef]
  124. Cennamo, N.; D’Agostino, G.; Pesavento, M.; Zeni, L. High selectivity and sensitivity sensor based on MIP and SPR in tapered plastic optical fibers for the detection of L-nicotine. Sens. Actuators B-Chem. 2014, 191, 529–536. [Google Scholar] [CrossRef]
  125. Cennamo, N.; D’Agostino, G.; Galatus, R.; Bibbòa, L.; Pesavento, M.; Zeni, L. Sensors based on surface plasmon resonance in a plastic optical fiber for the detection of trinitrotoluene. Sens. Actuators B-Chem. 2013, 188, 221–226. [Google Scholar] [CrossRef]
  126. Pesavento, M.; Zeni, L.; De Maria, L.; Alberti, G.; Cennamo, N. SPR-Optical Fiber-Molecularly Imprinted Polymer Sensor for the Detection of Furfural in Wine. Biosens. 2021, 11, 72. [Google Scholar] [CrossRef]
  127. Shrivastav, A.M.; Usha, S.P.; Gupta, B.D. Highly sensitive and selective erythromycin nanosensor employing fiber optic SPR/ERY imprinted nanostructure: Application in milk and honey. Biosens. Bioelectron. 2017, 90, 516–524. [Google Scholar] [CrossRef]
  128. Nguyen, T.H.; Sun, T.; Grattan, K.T.V. Surface plasmon resonance based fibre-optic chemical sensor for the detection of cocaine. In Proceedings of the SPIE 9916, Sixth European Workshop on Optical Fibre Sensors, Limerick, Ireland, 30 May 2016; Volume 991612, pp. 146–149. [Google Scholar] [CrossRef]
  129. Verma, R.; Gupta, B.D. Optical fiber sensor for the detection of tetracycline using surface plasmon resonance and molecular imprinting. Analyst 2013, 138, 7254–7263. [Google Scholar] [CrossRef]
  130. Verma, R.; Gupta, B.D. Fiber optic SPR sensor for the detection of 3-pyridinecarboxamide (vitamin B3) using molecularly imprinted hydrogel. Sens. Actuators B-Chem. 2013, 177, 279–285. [Google Scholar] [CrossRef]
  131. Cennamo, N.; D’Agostino, G.; Perri, C.; Arcadio, F.; Chiaretti, G.; Parisio, E.M.; Camarlinghi, G.; Vettori, C.; Di Marzo, F.; Cennamo, R.; et al. Proof of Concept for a Quick and Highly Sensitive On-Site Detection of SARS-CoV-2 by Plasmonic Optical Fibers and Molecularly Imprinted Polymers. Sensors 2021, 21, 1681. [Google Scholar] [CrossRef] [PubMed]
  132. Shrivastav, A.M.; Usha, S.P.; Gupta, B.D. A localized and propagating SPR, and molecular imprinting based fiber-optic ascorbic acid sensor using an in situ polymerized polyaniline–Ag nanocomposite. Nanotechnology 2016, 27, 345501. [Google Scholar] [CrossRef] [PubMed]
  133. Tabassum, R.; Kant, R. Recent trends in surface plasmon resonance based fiber–optic gas sensors. Sens. Actuators B-Chemical 2020, 310, 127813. [Google Scholar] [CrossRef]
  134. Bhatia, P.; Gupta, B.D. Surface plasmon resonance based fiber optic ammonia sensor utilizing bromocresol purple. Plasmonics 2013, 8, 779–784. [Google Scholar] [CrossRef]
  135. Mishra, S.K.; Bhardwaj, S.; Gupta, B.D. Surface plasmon resonance–based fiber optic sensor for the detection of low concentrations of ammonia gas. IEEE Sens. J. 2015, 15, 1235–1239. [Google Scholar] [CrossRef]
  136. Mishra, S.K.; Kumari, D.; Gupta, B.D. Surface plasmon resonance based fiber optic ammonia gas sensor using ITO and polyaniline. Sens. Actuators B-Chem. 2012, 171–172, 976–983. [Google Scholar] [CrossRef]
  137. Pathak, A.; Mishra, S.K.; Gupta, B.D. Fiber–optic ammonia sensor using Ag/SnO2 thin films: Optimization of thickness of SnO2 film using electric field distribution and reaction factor. Appl. Opt. 2015, 54, 8712–8721. [Google Scholar] [CrossRef]
  138. Shobin, L.R.; Sastikumar, D.; Manivannan, S. Glycerol mediated synthesis of silver nanowires for room temperature ammonia vapor sensing. Sens. Actuators A-Physical 2014, 214, 74–80. [Google Scholar] [CrossRef]
  139. Mishra, S.K.; Gupta, B.D. Surface plasmon resonance–based fiber optic chlorine gas sensor utilizing indium–oxide–doped tin oxide film. IEEE J. Lightwave Technol. 2015, 33, 2770–2776. [Google Scholar] [CrossRef]
  140. Usha, S.P.; Mishra, S.K.; Gupta, B.D. Fabrication and characterization of a SPR based fiber optic sensor for the detection of chlorine gas using silver and zinc oxide. Materials 2015, 8, 2204–2216. [Google Scholar] [CrossRef]
  141. Tabassum, R.; Mishra, S.K.; Gupta, B.D. Surface plasmon resonance–based fiber optic hydrogen sulphide gas sensor utilizing Cu–ZnO thin films. Phys. Chem. Chem. Phys. 2013, 15, 11868–11874. [Google Scholar] [CrossRef] [PubMed]
  142. Mishra, S.K.; Rani, S.; Gupta, B.D. Surface plasmon resonance based fiber optic hydrogen sulphide gas sensor utilizing nickel oxide doped ITO thin film. Sens. Actuators B-Chem. 2014, 195, 215–222. [Google Scholar] [CrossRef]
  143. Paul, D.; Datta, S.; Biswas, R. LSPR enhanced gasoline sensing with a U–bent optical fiber. J. Phys. D Appl. Phys. 2016, 49, 305104. [Google Scholar] [CrossRef]
  144. Mishra, S.K.; Gupta, B.D. Surface plasmon resonance–based fiber–optic hydrogen gas sensor utilizing indium–tin oxide (ITO) thin films. Plasmonics 2012, 7, 627–632. [Google Scholar] [CrossRef]
  145. Hosoki, A.; Nishiyama, M.; Igawa, H.; Seki, A.; Choi, Y.; Watanabe, K. A surface plasmon resonance hydrogen sensor using Au/Ta2O5/Pd multi–layers on hetero–core optical fiber structures. Sens. Actuators B-Chem. 2013, 185, 53–58. [Google Scholar] [CrossRef]
  146. Hosoki, A.; Nishiyama, M.; Igawa, H.; Seki, A.; Watanabe, K. A hydrogen curing effect on surface plasmon resonance fiber optic hydrogen sensors using an annealed Au/Ta2O5/Pd multi-layers film. Opt. Express 2014, 2, 18556–18563. [Google Scholar] [CrossRef]
  147. Tabassum, R.; Gupta, B.D. Fiber optic hydrogen gas sensor utilizing surface plasmon resonance and native defects of zinc oxide by palladium. J. Opt. 2016, 18, 015004. [Google Scholar] [CrossRef]
  148. Ayivi, R.D.; Adesanmi, B.O.; McLamore, E.S.; Wei, J.; Obare, S.O. Molecularly Imprinted Plasmonic Sensors as Nano-Transducers: An Effective Approach for Environmental Monitoring Applications. Chemosensors 2023, 11, 203. [Google Scholar] [CrossRef]
  149. Lofgreen, J.E.; Ozin, G.A. Controlling morphology and porosity to improve performance of molecularly imprinted sol–gel silica. Chem. Soc. Rev. 2014, 43, 911–933. [Google Scholar] [CrossRef]
  150. Chauhan, S.K.; Punjabi, N.; Sharma, D.K.; Mukherji, S. A silicon nitride coated LSPR based fiber-optic probe for possible continuous monitoring of sucrose content in fruit juices. Sens. Acuators. B-Chem. 2016, 222, 1240–1250. [Google Scholar] [CrossRef]
  151. Tabassum, R.; Kaur, P.; Gupta, B.D. Tuning the field distribution and fabrication of an Al@ZnO core–shell nanostructure for a SPR-based fiber optic phenyl hydrazine sensor. Nanotechnol. 2016, 27, 215501. [Google Scholar] [CrossRef]
  152. Sharma, S.; Gupta, B.D. Fiber optic surface-plasmon-resonance-based highly sensitive arsenic sensor prepared using α-Fe2O3/SnO2 core-shell nanostructure with optimized probe parameters. Appl. Opt. 2018, 57, 10466–10473. [Google Scholar] [CrossRef] [PubMed]
  153. Tabassum, R.; Gupta, B.D. Surface plasmon resonance based fiber optic detection of chlorine utilizing polyvinylpyrolidone supported zinc oxide thin films. Analyst 2015, 140, 1863–1870. [Google Scholar] [CrossRef] [PubMed]
  154. Antohe, I.; Spasic, D.; Delport, F.; Li, J.; Lammertyn, J. Nanoscale patterning of gold-coated optical fibers for improved plasmonic sensing. Nanotechnology 2017, 28, 215301. [Google Scholar] [CrossRef]
  155. Raj, D.R.; Prasanth, S.; Vineeshkumar, T.V.; Sadarsanakumar, C. Surface plasmon resonance based fiber optic sensor for mercury detection using gold nanoparticles PVA hybrid. Opt. Commun. 2016, 367, 102–107. [Google Scholar] [CrossRef]
  156. Samavati, Z.; Borhani, T.N.; Samavati, A.; Ismail, A.F.; Rahman, M.A.; Othman, M.H.D.; Soleymani, M. Optical fiber sensor based on magneto-plasmonic features of Ag-Co nanostructure for ppm ammonium detection in aqueous solutions. Opt. Fiber Technol. 2021, 67, 102730. [Google Scholar] [CrossRef]
  157. Wolfbeis, O.S. Editorial: Probes, Sensors, and Labels: Why is Real Progress Slow? Ang. Chem. Int. Ed. 2013, 52, 9864–9865. [Google Scholar] [CrossRef]
  158. Nagel, B.; Dellweg, H.; Gierasch, L.M. Glossary for chemists of terms used in biotechnology (IUPAC Recommendations 1992). Pure Appl. Chem. 1992, 64, 143–168. [Google Scholar] [CrossRef]
  159. Pathak, A.; Gupta, B.D. Ultra-selective fiber optic SPR platform for the sensing of dopamine in synthetic cerebrospinal fluid incorporating permselective nafion membrane and surface imprinted MWCNTs-PPy matrix. Biosens. Bioelectron. 2019, 133, 205–214. [Google Scholar] [CrossRef]
  160. Wang, Q.; Sun, B.; Hu, E.T.; Wei, W. Cu/ITO-Coated Uncladded Fiber-Optic Biosensor Based on Surface Plasmon Resonance. IEEE Photonics Technol. Lett. 2019, 31, 1159–1162. [Google Scholar] [CrossRef]
  161. Zhang, X.; Wu, Z.; Liu, F.; Fu, Q.; Chen, X.; Xu, J.; Zhang, Z.; Huang, Y.; Tang, Y.; Guo, T.; et al. Hydrogen peroxide and glucose concentration measurement using optical fiber grating sensors with corrodible plasmonic nanocoatings. Biomed. Opt. Express 2018, 9, 1735–1744. [Google Scholar] [CrossRef] [PubMed]
  162. Bi, M.; Miao, Y.; Li, W.; Fei, C.; Zhang, K. Ultrasensitive BOD Detection of Fiber Integrated with Nb2CTx MXene for Water Pollution. J. Light. Technol. 2022, 40, 2173–2180. [Google Scholar] [CrossRef]
  163. Kasik, I.; Mrazek, J.; Martan, T.; Pospisilova, M.; Podrazky, O.; Matejec, V.; Hoyerova, K.; Kaminek, M. Fiber-optic pH detection in small volumes of biosamples. Anal. Bioanal. Chem. 2010, 398, 1883–1889. [Google Scholar] [CrossRef]
  164. Mayr, T.; Igel, C.; Liebsch, G.; Klimant, I.; Wolfbeis, O.S. Cross-Reactive Metal Ion Sensor Array in a MicroTiter Plate Format. Anal. Chem. 2003, 75, 4389–4396. [Google Scholar] [CrossRef] [PubMed]
Figure 1. Fiber-optic chemical sensor; (a) a principal sensor scheme; (b) schematic electrical-intensity distribution in a fundamental guided mode; blue curve-guided-mode intensity in the core, red curve-guided-mode intensity in the cladding, i.e., evanescent wave.
Chemosensors 11 00521 g001
Figure 2. Schemes of the principal structure and output spectrum of (a) tilted fiber Bragg grating and (b) long-period grating. Λ: grating period and λG: principal grating wavelength.
Chemosensors 11 00521 g002
Figure 3. Schematic description of thermal pulling technique. (a) An input fiber element. (b) Biconical taper with a waist around the center. (c) Two fiber tips.
Chemosensors 11 00521 g003
Figure 4. A photo of a microtip prepared at the author’s laboratories.
Chemosensors 11 00521 g004
Figure 5. Scheme of Turner etching. (a) Beginning of etching. (b) Etching in progress. (c) Etching end.
Chemosensors 11 00521 g005
Figure 6. Scheme of tube etching method. (a) Beginning of the process. (b) Intermediate process stage, e.g., the tip formation.
Chemosensors 11 00521 g006
Figure 7. A scheme of a set-up used with fiber nanotip sensors based on an inverted fluorescence microscope.
Chemosensors 11 00521 g007
Figure 8. A principal scheme of a fiber-optic array composed of twenty-one constituent fibers and four different sensors distinguished by different colors.
Chemosensors 11 00521 g008
Figure 9. A scheme of the etched fiber bundle. (a) Input bundle. (b) Tip array. (c) Well array.
Chemosensors 11 00521 g009
Figure 10. A scheme of a sphere-based fiber-optic array for homogenous sensing; (a) sectional view and (b) ground-plan.
Chemosensors 11 00521 g010
Figure 11. A scheme of a tip-based fiber-optic array for homogenous sensing obtained by photopolymerization; (a) sectional view and (b) ground-plan.
Chemosensors 11 00521 g011
Figure 12. A sectional view of a fiber-optic array for opto-electrochemical sensing.
Chemosensors 11 00521 g012
Figure 13. A principal setup for excitation of surface plasmons.
Chemosensors 11 00521 g013
Figure 14. Sensing characteristics of a wavelength-interrogated SPR sensor. (a) Response curves. (b) Calibration curve.
Chemosensors 11 00521 g014
Figure 15. Schemes of fiber-optic SPR sensor set ups. (a) Transmission setup. (b) Reflection setup.
Chemosensors 11 00521 g015
Figure 16. Schematic cross-sections of optical fibers used for SP excitation: (a) plastic and polymer-clad silica fibers, (b) single-mode D-fibers, (c) U-bent fibers, and (d) microstructure fibers.
Chemosensors 11 00521 g016
Figure 17. Excitation of a fiber-optic SPR sensor excited by an inclined collimated beam. (a) Response curve. (b) Calibration curve.
Chemosensors 11 00521 g017
Figure 18. Principle of the fabrication of MIPs.
Chemosensors 11 00521 g018
Table 2. Examples of fiber nanotip and submicrometer tip biosensors.
AnalyteTransducerTip Apex Diameter [nm]Linear RangeReference
BPTBPT antibody25–600.06–1.6 nM[69]
NO2Cytochrome c’2000.02–1 mM[71]
GlutamateGlutamate dehydrogenase30–50015–30 µM[72]
DNAMolecular beacon300.57–10,000 nM[49]
Table 3. Selected characteristics of FOSPR gas sensors.
AnalyteFiberLayer for SPR ExcitationSensing LayerSensitivityRef.
NH3PCS600Ag/SiBCP0.45 nm/ppm[134]
PCS600CuBCP1.59 nm/ppm[135]
PCS600ITOBCP1.82 nm/ppm[135]
PCS600ITOPAni0.12 nm/ppm[136]
PCS600CurGO in PMMA0.90 nm/ppm[119]
PCS600AgSnO22.15 nm/ppm[137]
Taper POFAg NPsPVP + PVA0.88.count/ppm[120]
POFAg NWs-0.17 count/ppm[138]
Cl2PCS600AgIn2O3 + SnO20.15 nm/ppm[139]
PCS600AgZnO1.40 nm/ppm[140]
H2SPCS600CuZnO0.65 nm/ppm[141]
PCS600AgITO + NiO2.70 nm/ppm[142]
CH4PCS600AgrGOGCNT in PMMA0.60 nm/ppm[121]
C2HCl3PCS400AgSAM/Fsil19.2 μV/ppm[11]
GasolinePCS800 U-bentAu NPs-0.12 mV/ppm[143]
Ag NPs-0.08 mV/ppm[143]
In Table 3, PCS600 means a straight PCS fiber with a core diameter of 600µm; NPs—nanoparticles; NWs—nanowires; NT-nanotubes; rGO—reduced graphene oxide, PMMA—poly (methyl methacrylate); PAni—polyaniline; PVP + PVA—copolymer of vinylpyrolidone and vinyl alcohol; SAM—self-assembled monolayer of alkanethiol; Fsil—fluorinated polysiloxane; BCP—bromocresol purple. Maximal sensitivity values are reported in Table 3.
Table 4. Characteristics of hydrogen gas sensors.
FiberLayer for SPR ExcitationSensing LayerResponse DifferenceReference
PCS600AgZnO + Pd80 nm[147]
PCS600ITO(ITO)1.28 dB[144]
HetCoreAu/Ta2O5Pd0.38 dB[145]
HetCoreAu/Ta2O5Pd0.42 dB[146]
PCS400SEPd (12 nm)(Pd)30%[117]
In Table 4, HetCore means a sensing element fabricated of a short sensing SM fiber with a core diameter of 3μ spliced between input and output MMF fibers with core diameters of 62.5 μm. PCS400SE abbreviates a PCS fiber with a core diameter of 400 μm excited by an inclined collimated beam. The response difference was determined from measurements with 4 vol.% of H2 in nitrogen and with pure nitrogen.
Table 5. Characteristics of selected FOSPR chemical sensors.
AnalyteFiberLayer for SP ExcitationSensing LayerSensitivityReference
MelaninPCS600AgMIP110 nm/log(M)[122]
ProfenofosPCS600AgMIP112 nm/log(M)[123]
NicotinamidePOF980 tapeAuMIP11.3 × 104 nm/M[124]
TNTPOF980 D-shapePhtR/AuMIP12.7 × 104 nm/M[125]
Furfural in winePOF980 D-shapePhtR/AuMIP1255 nm/(mg/L)[126]
ErythromycinPCS600AgMIP2205 nM/μM[127]
CocainePCS1000AuMIP20.5 nm/(mg/L)[128]
TetracyclinePCS600AgMIP3700 nm/µM[129]
OxytetracyclinePCS600AgMIP3150 nm/µM[129]
Vitamin B3PCS600AgMIP31.48 nm/(mg/L)[130]
BSAPOF980 D-shapePhtR/AuMIP31.95 nm/µM[131]
S1-subunitPOF980 D-shapePt/AuMIP36.483 nm/µM[131]
Ascorbic acidPCS600AgMIP430 nm/m[132]
SucrosePCS400 U-bendAuNPsSiNx0.032 (%wgt.)−1 [150]
PhenylhydrazinePCS600AgAl@ZnO NPs0.12 nm/(µg/L)[151]
As3+PCS600Agα-Fe2O3@SnO2NPs2.06 nm/(µg/L)[152]
Cl2 solutionPCS6000Ag/ZnOPVP4 nm/ppm[153]
RI-sensingPCS400-faceAuAu triangles1795 nm/RIU[154]
Hg2+PCS600AgAuNPs in PVA0.7 nm/(µM][155]
NH3 solutionMMF62.5CoAg0.131 nm/ppm[156]
In Table 5, PCS600, PCS400, POF980, and MMF62.5 refer to polymer-clad silica fibers, plastic optical fibers, and multimode fiber with core diameters of 600, 400, 980, and 62.5µm, respectively; PhtR—photoresist layer (a thickness of 1.5 µm), M abbreviates [mol/L]; PVP is polyvinyl pyrrolidone, MIP1—molecularly imprinted polymer based on MAA, MIP2—molecularly imprinted polymer based on MAA and HEMA; MIP3 is based on acrylamide, MIP4 on polyaniline, and NPs abbreviates nanoparticles Al@Zno. NPs are core-shell nanoparticles with Al core and ZnO shell.
Table 6. Characteristics of selected fiber-optic nanomaterial-based chemical sensors.
AnalyteFiberPrincipleSensing LayerSensitivity and LODRef.
NO solutionPCS600 faceFluQeCQDs-PhDam/CA0.006 ppm−1 and 9 nM[21]
NO solutionPOF bundle faceFluQeCdSeQDs/CA0.0006 deg/M and 0.1 nM[22]
NO solutionECMSFFluQeCdTe@CdS QDs0.34 (log(M))−1 and 0.01 nM[23]
CatecholPCS600/AgSPRZnONP-MWCNTs-CTAB5.5 nm/µM and 0.1 µM[24]
E-coliPOF125/Cr/Au, faceSPRZnO NR4.4 × 10−4 unit (CFU/mL)−1 and <1000 CFU/mL[25]
DopaminePCS400/AuSPRMIP MWCNT PPy/nafion68 nm/log(M) and 18.9 pM[159]
HemoglobinSMF8-TFGRI sensingGO8.2 nm/(mg/mL) and <0.1 mg/mL[26]
HemoglobinSM8, taper, LPG680RI sensingrGO2 nm/(mg/mL) and 0.02 mg/mL[27]
DopamineFP interferometerInterferom.rGO0.51 kHz/µM and 200 nM[28]
NicotineFP interferometerInterferom.rGO0.2 kHz/µM and 10 nM[28]
GlucoseSMF8 D-shape/Cr/AuSPRMoS2/G-PBA6709 nm/RIU and <0.1 mM[29]
PesticideSMF-TFGPhototermalNb2CTx1.8 pm/ppm and 0.35 ppm[30]
SalinityMZ-FO interferometerInterferometryTi3CN−5.3 nm/% and <1%[31]
BSAPCS400/Cu/ITOSPR(ITO)1.9 nm/(mg/mL) and 0.57 µg/mL[160]
H2O2SMF8-TFG/AgSPR-Ag etching(Ag)~1.9 dB/µM and <0.2 µM[161]
BODSMF8 taperRI sensingNb2CTx35 nm/(mg/mL) and 5.7 × 10⁻⁴ mg/mL[162]
In Table 6, PCF400, PCS600, SMF8, and POF125 abbreviate polymer-clad silica fiber with a core diameter of 400 µm and 600 µm, respectively, SMF8 means single-mode fiber with a core diameter of 8 µm, POF125—plastic optical fiber with a core diameter of 125 µm, ECMSF is exposed-core microstructure fiber, FP interferometer—Fabry-Perrot interferometer, TFG—tilted fiber grating, LPG680 abbreviates long period grating with a period of 680 µm, MZ interferometer is Mach Zehnder interferometer, FluQe—fluorescence quenching, CQDs—carbon quantum dots, PhDam means o-phenylenediamine, CA—cellulose acetate, -MWCNTs- muti-walled carbon nanotubes, CTAB—1-hexadecyltrimethylammonium bromide, NR-nanorods, MIP MwCNT-Ppy means molecularly imprinted polymer of MwCNTs and pyrrole, GO, and rGO are graphene oxide, and reduced graphene oxide, respectively, G-graphene, PBA-pyrene-1-boronic acid, M abbreviates mol/L, RIU is refractive-index unit, and LOD is limit of detection.
Disclaimer/Publisher’s Note: The statements, opinions and data contained in all publications are solely those of the individual author(s) and contributor(s) and not of MDPI and/or the editor(s). MDPI and/or the editor(s) disclaim responsibility for any injury to people or property resulting from any ideas, methods, instructions or products referred to in the content.

