Article

A Europium-Based Optical Sensor for the Detection of Carbon Dioxide and Its Application for a Fermentation Reaction

by
Erin N. Benton
,
Nawagamu A. K. Rajitha Perera
,
Vladimir N. Nesterov
,
Wijayantha Perera
,
Mohammad A. Omary
* and
Sreekar B. Marpu
*
Department of Chemistry, University of North Texas, Denton, TX 76203, USA
*
Authors to whom correspondence should be addressed.
These authors contributed equally to this work.
Chemosensors 2023, 11(1), 5; https://doi.org/10.3390/chemosensors11010005
Submission received: 2 October 2022 / Revised: 14 November 2022 / Accepted: 25 November 2022 / Published: 21 December 2022
(This article belongs to the Special Issue Advances in Nanocomposite Luminescent Sensors)

Abstract

:
A new europium-based complex, K[Eu(hfa)4] with hfa = hexafluoroacetylacetonate is synthesized and its structure confirmed via X-ray crystallography. The structure unravels an anionic octa-coordinate complex, K[Eu(hfa)4], as opposed to the neutral hexacoordinate complex Eu(hfa)3 routinely/ubiquitously presumed to be the case in the literature. The complex displayed pH-dependent, “on–off” emission changes in solution and exhibited a pKa of 6.13 ± 0.06 in ethylene glycol. In solution, the sensor complex exhibited drastic variation in emission intensity corresponding to changes in the concentration of CO2 gas purged. Based on multiple purge cycles of N2 and CO2, the emission intensity changes can be correlated to the concentration of CO2 in the solution. The sensor’s ability to quantify the CO2 presence is based on emission variations of the 5D07F2 line in the Eu(III) complex at 618 nm. The sensor exhibits a linear response to CO2 concentrations in the range of 0–25% (0–8.50 mM or 0–189.95 mmHg). Based on calibration data, the limit of detection (LOD) is determined to be 0.57% (0.19 mM or 4.33 mmHg) in solution. The I100/I0 ratio is determined to be 80.29 ± 3.79. The percent change in intensity from purging N2 to 100% CO2 is 7911.16%. Over the course of seven cycles of purging different concentrations of CO2, there is essentially no deviation in the emission intensity of the sensor in solution, indicating stability and reversibility. In addition to the analytical characterization of the sensor, the mechanism of CO2 sensing is investigated using cyclic voltammetry, IR, and Raman spectroscopy. These data indicate the reduction of europium(III) to europium(II) in an alkaline medium and suggest changes in the hfa ligand chemistry (association/dissociation and protonation) due to CO2 purging. The potential use of the sensor complex for real-life applications is herein evaluated via a well-known fermentation reaction. The CO2 generated during yeast’s anaerobic respiration in sucrose media is quantified using the sensor complex and a calibrated, commercial CO2 probe; both exhibit similar CO2 concentration values, validating the calibration curve and the viability of the complex as a bona fide sensor. Based on the data collected, a highly stable, brightly red-emissive Eu(III) complex with the ability to differentiate concentrations of CO2 in solution is hereby developed and characterized with benefits for various CO2 sensing applications.

Graphical Abstract

1. Introduction

Carbon dioxide (CO2) is a major component in the atmosphere, a well-known greenhouse gas [1], and an important by-product of metabolism. Therefore, quantitative detection of CO2 is vitally important for many fields of study, including the food industry, medical research, marine sciences, biotechnology, and the beverage industry [1,2,3,4,5,6]. Additionally, CO2 gas sensors are found in fire extinguishers [7] and used for breath analysis [8]. CO2 measurements are critical in controlling air pollution. Real-time quantitative measurements of CO2 are important for monitoring fermentation and cell cultures [9]. Infrared sensors that are exclusively for gaseous CO2 and Severinghaus electrodes exclusively for dissolved CO2 are established devices used to monitor CO2 gas concentrations [10]. There is a high demand for optical sensors due to their advantages over conventional non-optical methods, which include: reduced signal-to-noise ratios, no water interference, possible miniaturization of the instrument, remote sensing, cost-effectiveness, etc. [3,4,5]. Most optical CO2 sensors work by monitoring changes in emission and absorption that occur in the presence vs. absence of CO2 [11]. The changes in concentration of CO2 can be correlated to changes in emission intensity, absorbance, emission lifetime, emission/excitation/absorption wavelength shift, or a combination of these optical changes. In most cases, changes in the pH of the medium result in optical changes of the sensor, and the best sensors respond to the smallest variations in the pH of the medium [10,11]. Additionally, photoluminescence (PL), resonance energy change, and dual luminophore referencing are some advanced techniques that are employed in fiber-optic sensor devices [12]. Accurate measurement of the pCO2 is very important, in addition to the aforementioned optical methods. Numerous instruments and methods, including gas chromatography (GC), mass spectrometry (MS), and modified pH electrodes, are used for measuring the pCO2. Although MS can give real-time analysis, it is expensive. GC requires 10–20 min to produce results and requires recalibration when the instrument is turned off [13]. Slow response time, temperature, and pH variations in the medium, combined with electrical resistance issues, render pH electrodes less effective [13]. To avoid most of the above drawbacks, researchers have turned to optical methods and employed them successfully [13,14,15,16]. Among the optical methods, direct measurement of the absorbance of CO2 in the IR region, measuring changes in absorbance or photoluminescence from pH-sensitive dyes, [13] ratiometric methods, fiber-optic sensors, [15] and donor–acceptor systems with the time-resolved PL technique are popular methods [14]. Absorption changes are found to be less sensitive and selective compared to PL intensity or lifetime changes [13].
Europium-based luminescent molecular systems have been investigated for optical sensing applications because they exhibit bright-red, narrow emissions with large operative Stokes shifts, long excited-state lifetimes—up to milliseconds—and emissions that are sensitive to the local environments [17,18,19]. Weak f-f transitions of europium can be improved enormously by coordination to a sensitizing chromophore that allows intramolecular energy transfer. Additionally, the lowest singlet (S1) and triplet (T1) fluorescent and phosphorescent excited states of the chromophore, respectively, can be altered upon altering the local ionic and molecular environment [19]. Introduction of different substituents to the ligand may alter the intermolecular interactions among molecules, which could help ameliorate self-quenching [20]. Some previous investigations have shown the formation of luminescent Eu(III) complexes that are pH-sensitive by coordinating the Eu(III) center to a pH-sensitive ligand [21,22]. In this study, the pH sensitivity of K[Eu(hfa)4] was exploited by using an amine-substituted polyhedral oligomeric silsesquioxane (a PSS derivative) to develop a solution-phase CO2 sensor based on direct emission changes of the Eu(III) complex. PSS was selected as the base for its cage-like structure to stabilize the K[Eu(hfa)4] complex [23]. K[Eu(hfa)4] is unique in the way that the phosphorescence intensity is enhanced upon an increase in the concentration of CO2; such emission turn-on sensors upon greater analyte concentration are usually preferred over quenching-based sensors. In this work, the real-time utility of the K[Eu(hfa)4] sensor is evaluated by monitoring the changes in dissolved CO2 concentration in the fermentation process. Fermentation is selected because of its significance/ubiquity in biological metabolism plus the alcohol and beverage industry, among others (vide infra), concomitant with its facile experimental setup that, together with the aforementioned advantages of optical-based (in general) and PL-based (in particular) methods, render the entire detection method of CO2 and its fermentation application rather convenient and inexpensive, yet most sensitive and selective.
Fermentation is applied in the biopharmaceutical, food, and environmental industries [24]. Fermentation of sugar (ethanol production) has been a well-known process for many centuries. However, due to the introduction of new technologies, such as genetic engineering and advanced computer science, ethanol production has rapidly developed to an industrial scale [24]. Yeast (Saccharomyces cerevisiae) is used more than any other microorganism worldwide for fermentation due to its long history of safe usage, readily available genetic systems for cloning, and well-understood physiology [25]. The fermentation rate is highly dependent on the nature of the sugar used [26,27]. Sucrose and glucose are more favorable than fructose because yeast does not have proper enzymes to break down fructose [27]. In this work, the changes in dissolved CO2 concentration during fermentation of sucrose by yeast are detected and analyzed using an Eu-based photoluminescent complex. The concentration of CO2 determined using the sensor complex was compared with that of a commercial CO2 probe to validate the certainty of the sensor complex for live applications.

2. Experimental Section

2.1. Materials

The following chemicals were directly ordered from Sigma Aldrich with the highest available purity and used without further purification: ethylene glycol, europium(III) chloride hexahydrate, 1,1,1,5,5,5-hexafluoro-2,4-pentanedione (hexafluoroacetylacetonate, hfa), potassium tert-butoxide, acetic acid, ammonium hydroxide, 1-butyl-3-methylimidazolium tetrafluoroborate (1B3MIMBF4), and polyhedral oligomeric silsesquioxanes provided as “PSS hydrate-Octakis(tetramethylammonium)substituted” (PSS). All CO2 and N2 cylinders were ordered from Airgas and directly purged into the sensor sample.

2.2. Physical Measurements

Steady-state photoluminescence (PL) spectra were acquired with a PTI QuantaMaster Model QM-4 scanning spectrofluorometer equipped with a 75-watt xenon arc lamp. A xenon flash lamp was used to acquire phosphorescence lifetime data. The pH measurements were made using a Sper Scientific 840087 Basic pH Meter and performed using 1M NH4OH at 25 °C. Single-crystal X-ray diffraction data were obtained on a Rigaku XtaLAB Synergy-S Diffractometer equipped with dual Mo and Cu PhotonJet-S microfocus X-ray sources, a HyPix-6000HE Hybrid Photon Counting detector, and an Oxford Cryostream 800 liquid nitrogen cooling system. Further details about the crystal structure can be found in the Supporting Information. Single crystals were obtained by slow evaporation of a concentrated methanol solution of K[Eu(hfa)4]. Infrared readings were taken by a Spectrum Two model PerkinElmer FT-IR spectrophotometer. A Renishaw InVia was used for Raman spectroscopy. CO2 probe readings were taken by the Industrial Gas Analyzer FD-600 Forensics Detectors™ with a range of 0–100% CO2.

2.3. Synthesis of K[Eu(hfa)4]

The literature procedure was followed to synthesize the compound [28]. First, 0.336 g (3.0 mmol) of potassium tert-butoxide (KOBut) was dissolved in 10 mL of deionized water (DI), and 0.624 g (3.0 mmol) of hexafluoroacetylacetonate ligand (hfa) was added, followed by 10 min of stirring at room temperature. Then, 0.366 g (1 mmol) of EuCl3.6H2O dissolved in 10 mL of DI water was added to the mixture of hfa and KOBut. The final mixture was stirred for 30 min at 60 °C under N2 atmosphere followed by 2.5 h of stirring at RT. A white precipitate was obtained by filtering, washing with DI water (2 × 100 mL), and drying under vacuum for 12 h. Crystals were obtained by slow evaporation of methanol or ethanol. During pKa estimation, 0.1 M ammonium hydroxide was used to adjust the pH levels for pKa determination.

2.4. CO2 Purging Studies

In general terms, when making a CO2 sensor, the 2 mg of K[Eu(hfa)4] is first dissolved in 10 mL of ethylene glycol. Then, the appropriate amount of PSS base was added dropwise into the above solution to make it pH 8 (non-luminescent state). Before taking the readings, 100% CO2 gas was purged for 10 min to make the solution saturated. Then, N2 gas was purged for 30 min to remove the dissolved CO2 in the sensor ethylene glycol solution. This reading was taken as the 0% CO2 gas or N2 purge. After that, desired percentage of CO2 gases were purged for 10 min, and the fluorescent response was recorded using a spectrofluorometer.

2.5. RTIL (Room Temperature Ionic Liquid) Studies
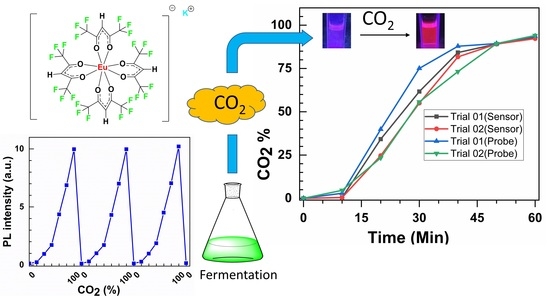
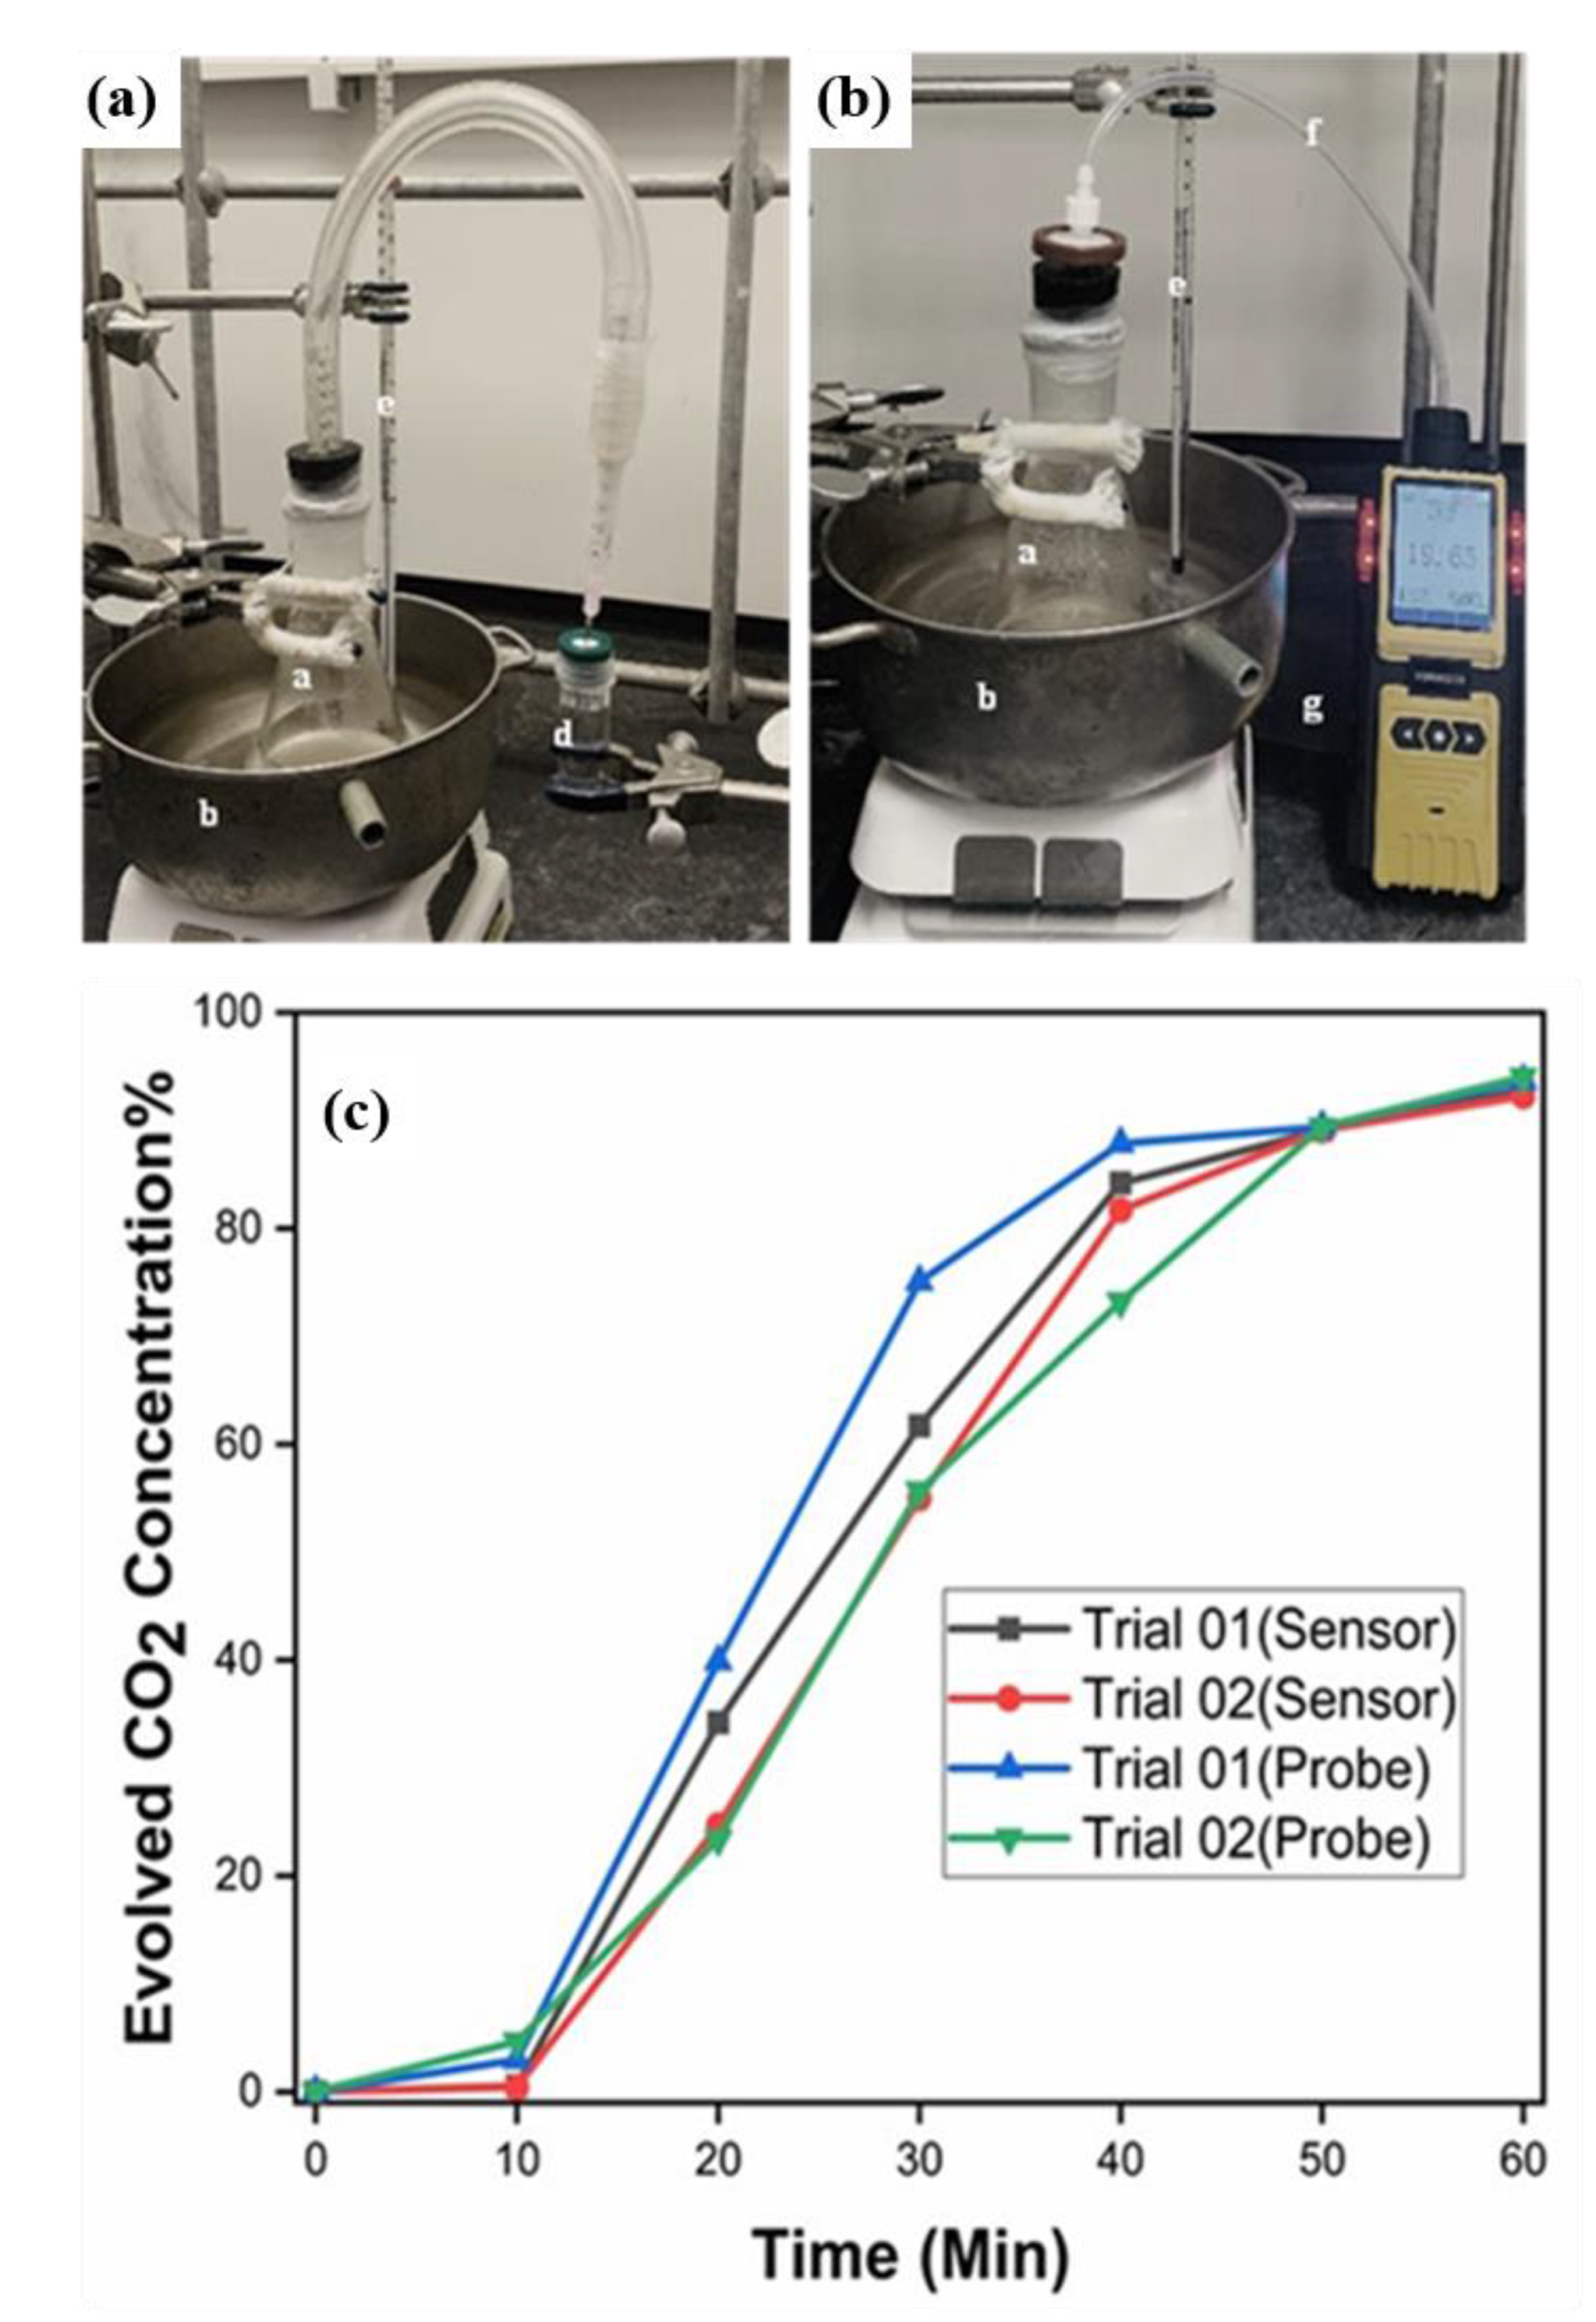
A 2 mg sample of K[Eu(hfa)4] complex was dissolved in 10 mL of ethylene glycol, and 0.25 mL of 1B3MIMBF4 was added to the above solution; then, the mixture was mixed well. A control study was conducted without adding 1B3MIMBF4. For both solutions, N2 was purged for 10 min. After that, 25%, 50%, and 100% CO2 gas aliquots were purged for 10 min, and the luminescence readings were recorded on each N2 and CO2 gas purge.

2.6. Fermentation

The anaerobic respiration (fermentation) was performed using a literature procedure with minor modifications [29]. A conical flask containing 25 mL water was heated at 37 °C for 20 min. An 8.0 g sample of household granulated sugar was dissolved, bringing the concentration of sugar to 0.93 M. The sugar solution was purged with N2 gas for 15 min to ensure removal of dissolved oxygen, followed by the addition of 2.5 g of yeast (Fleischmann’s active dry yeast original, purchased from Walmart). The flask was closed with an outlet septum to collect the CO2 generated during fermentation. The CO2 produced during fermentation was collected directly into 5 mL of sensor solution. Every 10 min, 2 mL of the sensor solution was used to measure changes in emission intensity. In the control experiment, the evolved CO2 was directly connected to a calibrated commercial CO2 sensor probe (Industrial Gas Analyzer FD-600 Forensics Detectors™) to quantify the CO2 concentration evolved from the fermentation flask.

3. Results and Discussion

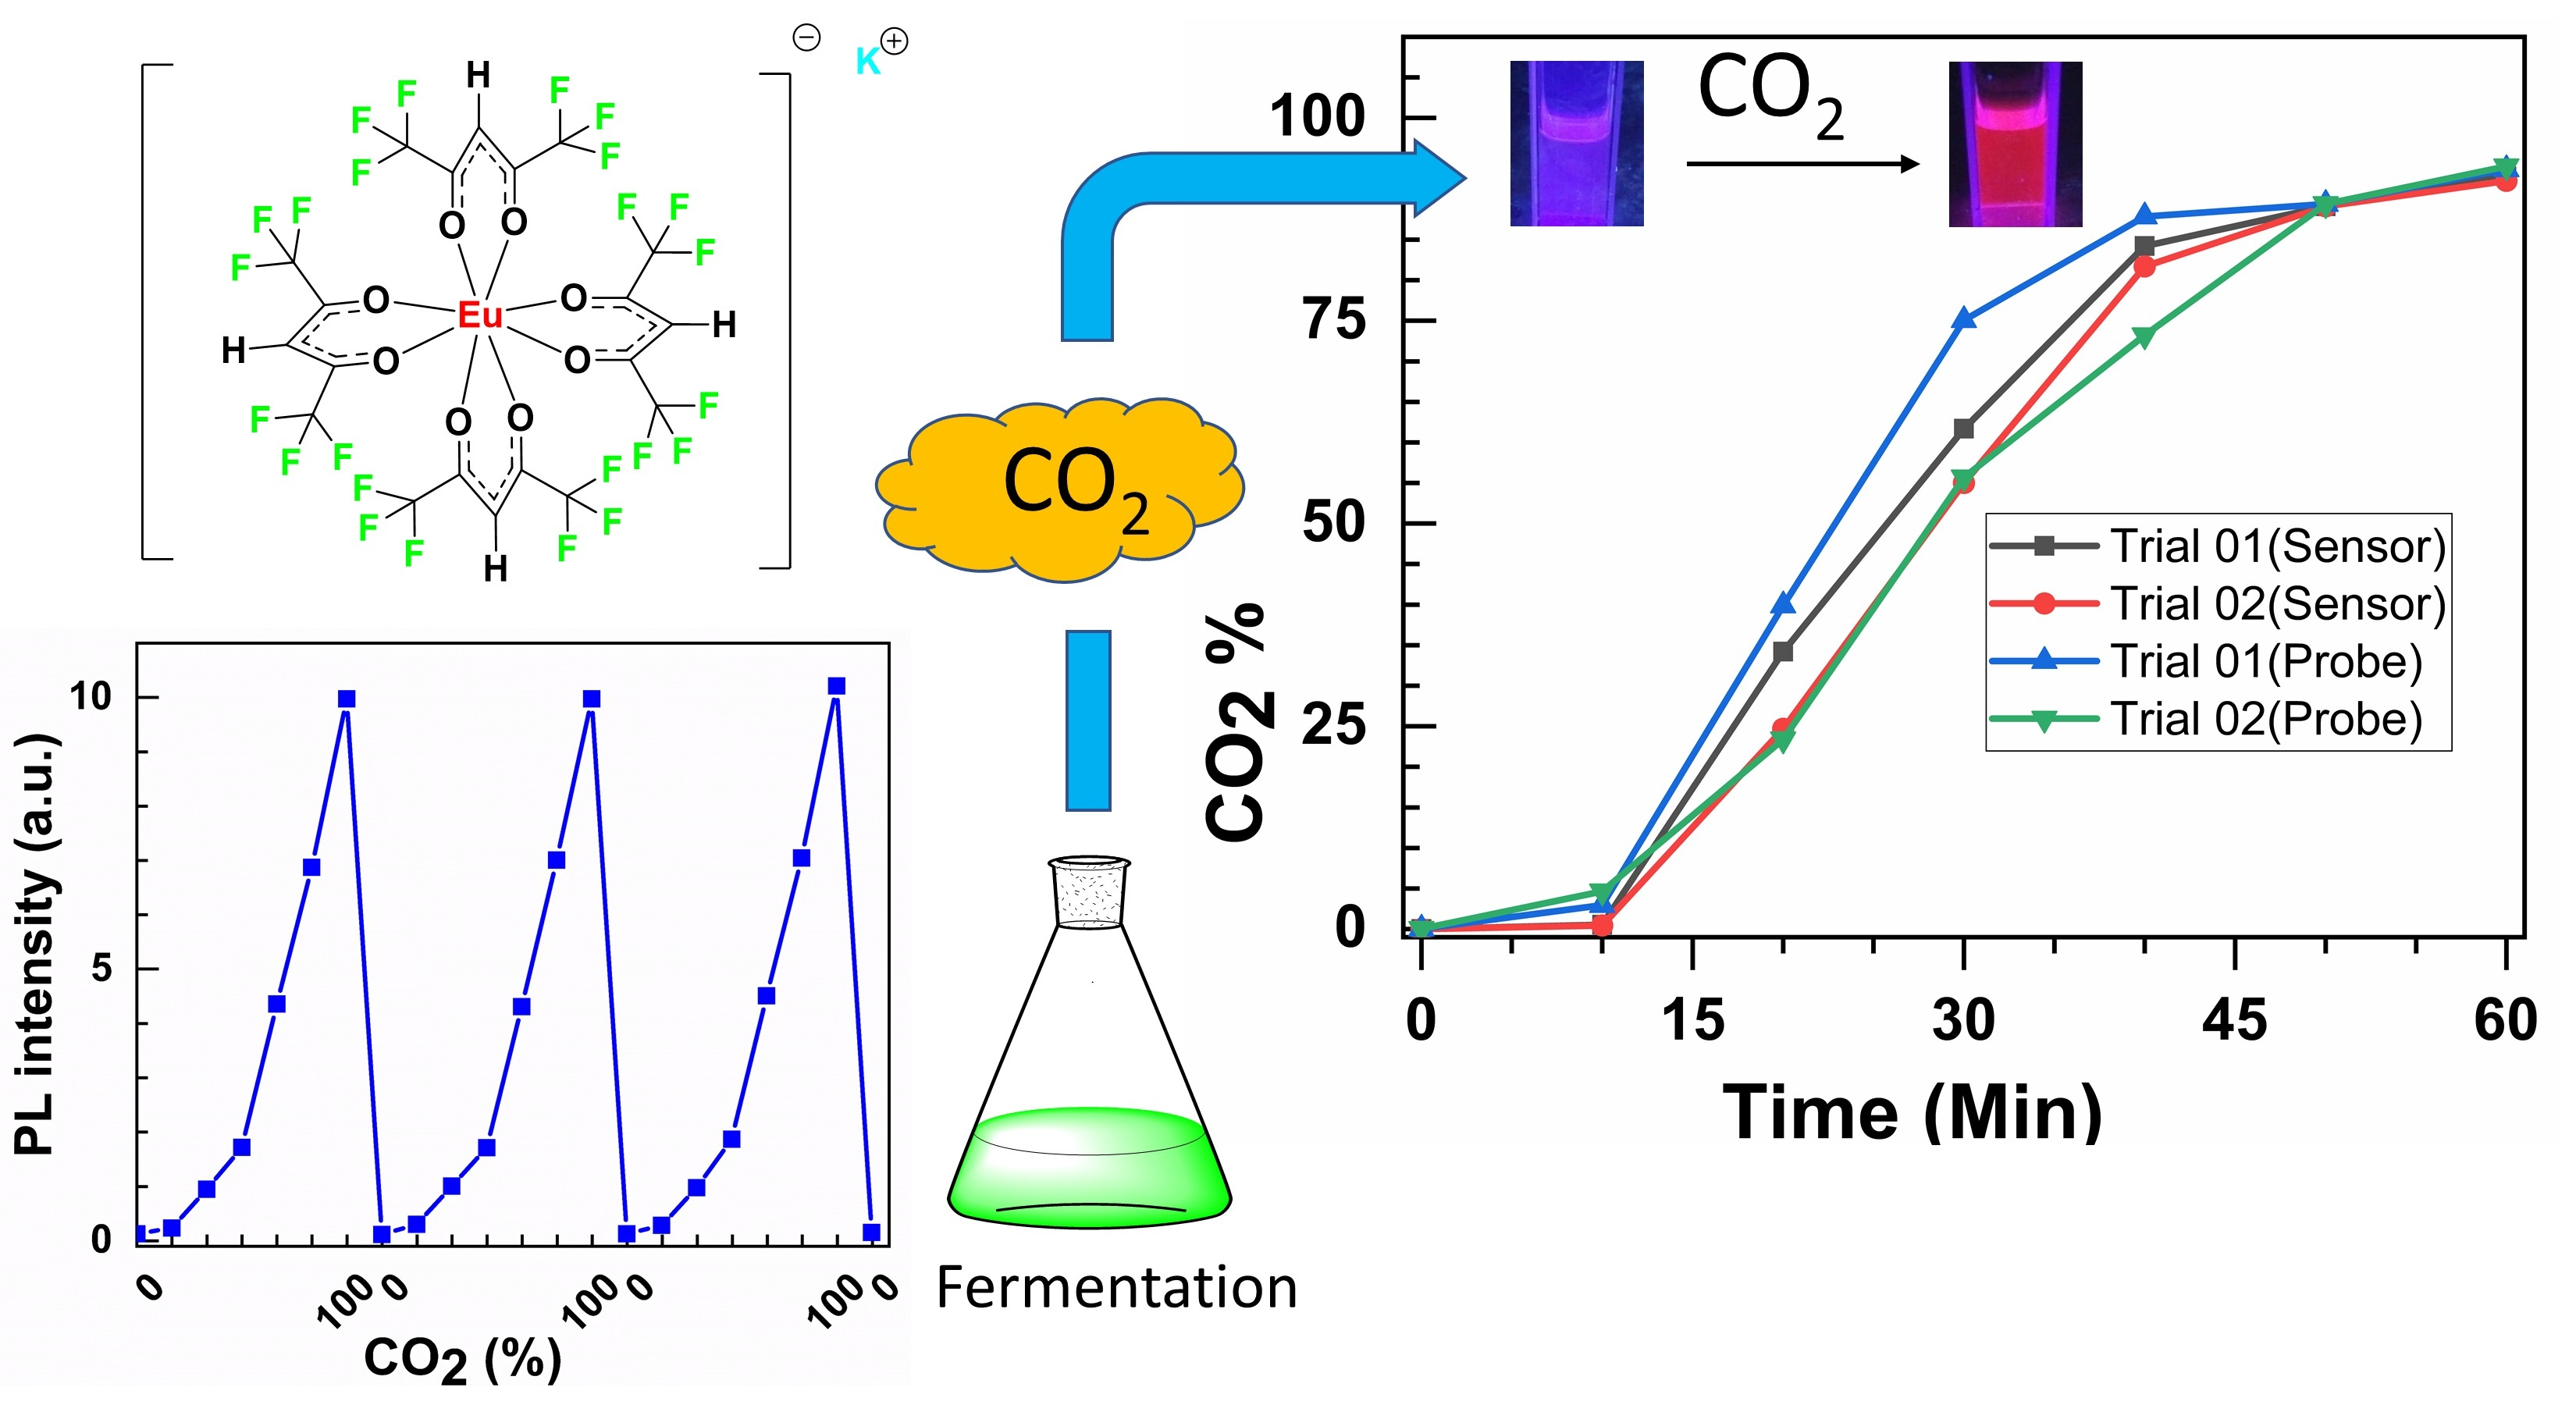
3.1. Crystal Structure and Complex Formula

The structure of K[Eu(hfa)4] we have determined is shown in Figure 1. Similar to other complexes in the literature, [30,31], this compound is a linear polymer chain with potassium counterion atoms sandwiched between [Eu(hfa)4] complex monomer units. Further information about the crystal parameters can be found in Table S1.
As cited above, K[Eu(hfa)4] was synthesized by using an established procedure for making “Eu(hfa)3(H2O)2”—whose structure has been defined within a significant number of literature reports [28,32,33,34,35,36]. Furthermore, there are a few papers that substantiate the Eu(hfa)3(H2O)2 formula based upon elemental analysis [37,38,39]. Interestingly, even though the same procedure was followed, our synthesis resulted in a resolved crystal structure that gave rise to a different structure and the formula K[Eu(hfa)4] (Figure 1). The synthesis was repeated on multiple occasions, all resulting in the formation of an Eu(III) center coordinated by four hfa ligands instead of the three hfa ligands suggested in the older literature [37,38,39]. According to inorganic chemistry textbooks, ligands based upon β-diketonates generally crystallize as hydrates and are extremely difficult to dehydrate even in vacuo [40]. The underlying reason for the formation of K[Eu(hfa)4] may be founded in the “chelate effect” of the hfa bidentate vs. the aqua monodentate ligand [40]. The coordination geometry shows an octa-coordinate Eu(III) center in a distorted square anti-prismatic geometry due to the tetrakis coordination of each hfa as a bridged bidentate ligand with Eu-O distances in the 2.356(3)–2.429(3) Å range (average 2.393 Å). The distortion in the geometry from an idealized square anti-prism and the asymmetry of the coordination of the four hfa ligands, as evidenced by the variation in Eu-O distances and O-Eu-O bond angles, are consistent with strong lattice motif interactions of the complex anion with the potassium counterions, akin to known situations in the literature (e.g., greater distortion in the coordination sphere of Na3[TaF8] vs (NO)2[XeF8]) [41,42]; see Table S1 (Supporting Information) for additional details about the structural analysis.

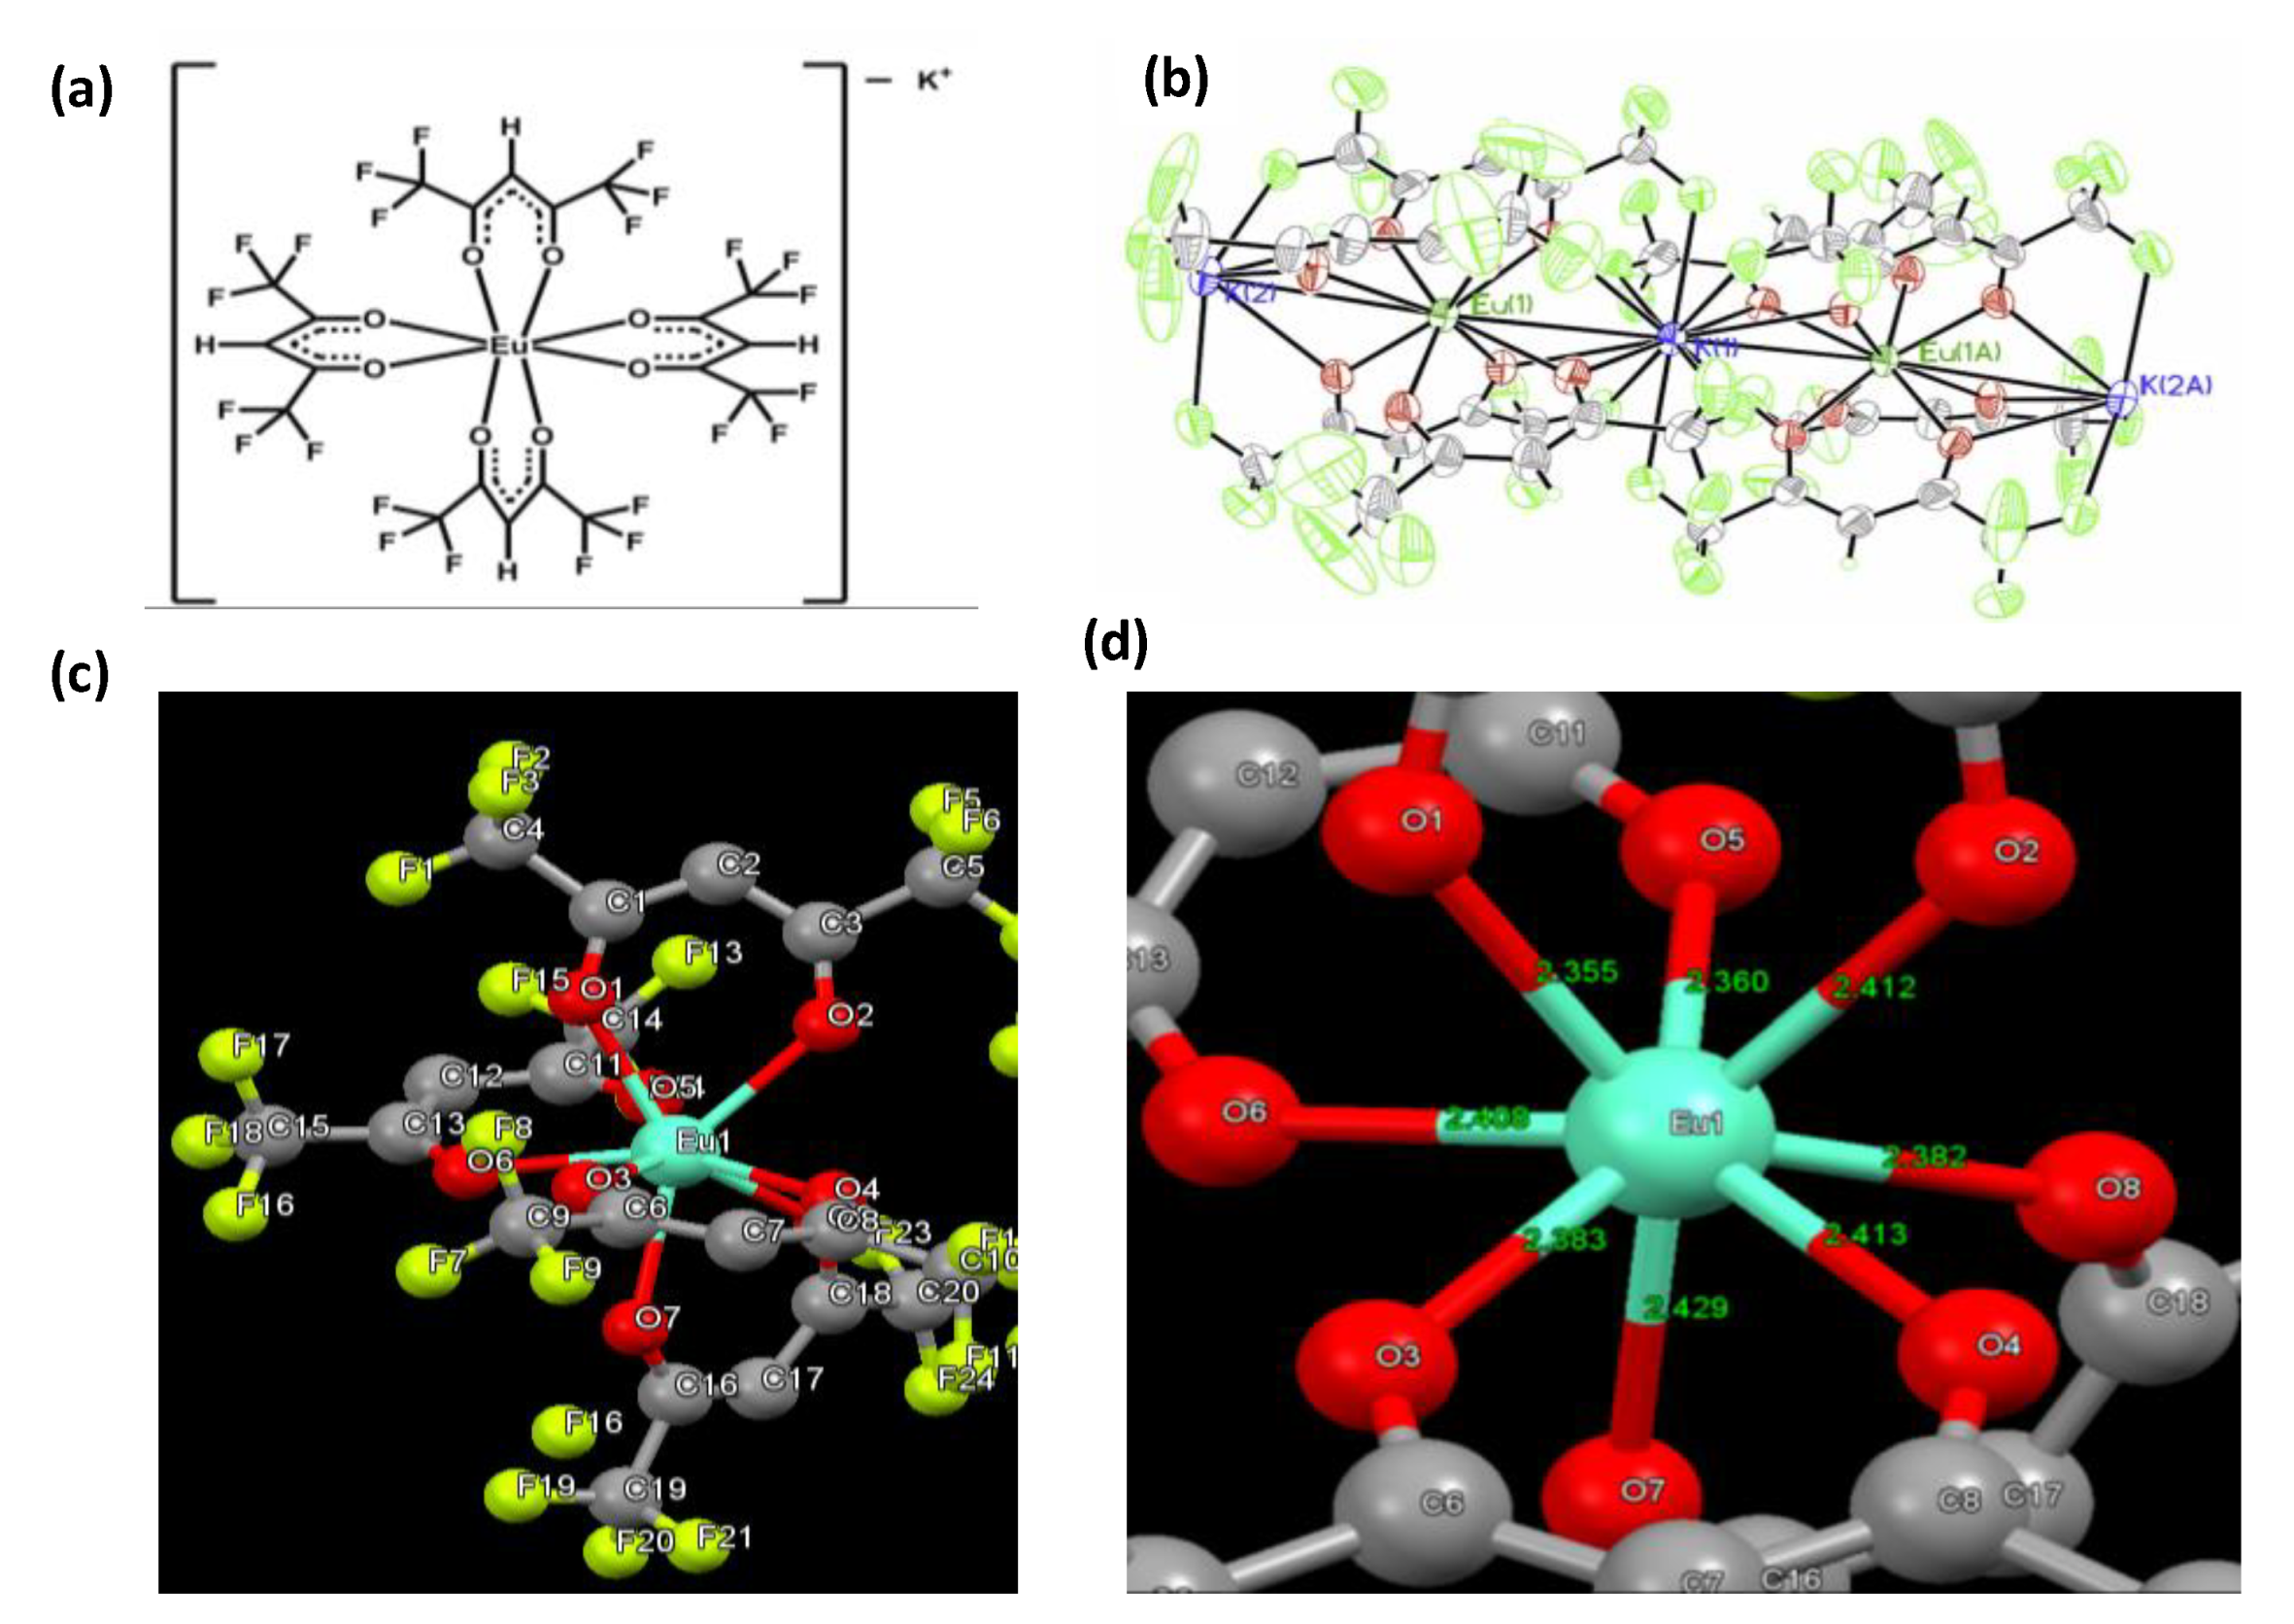
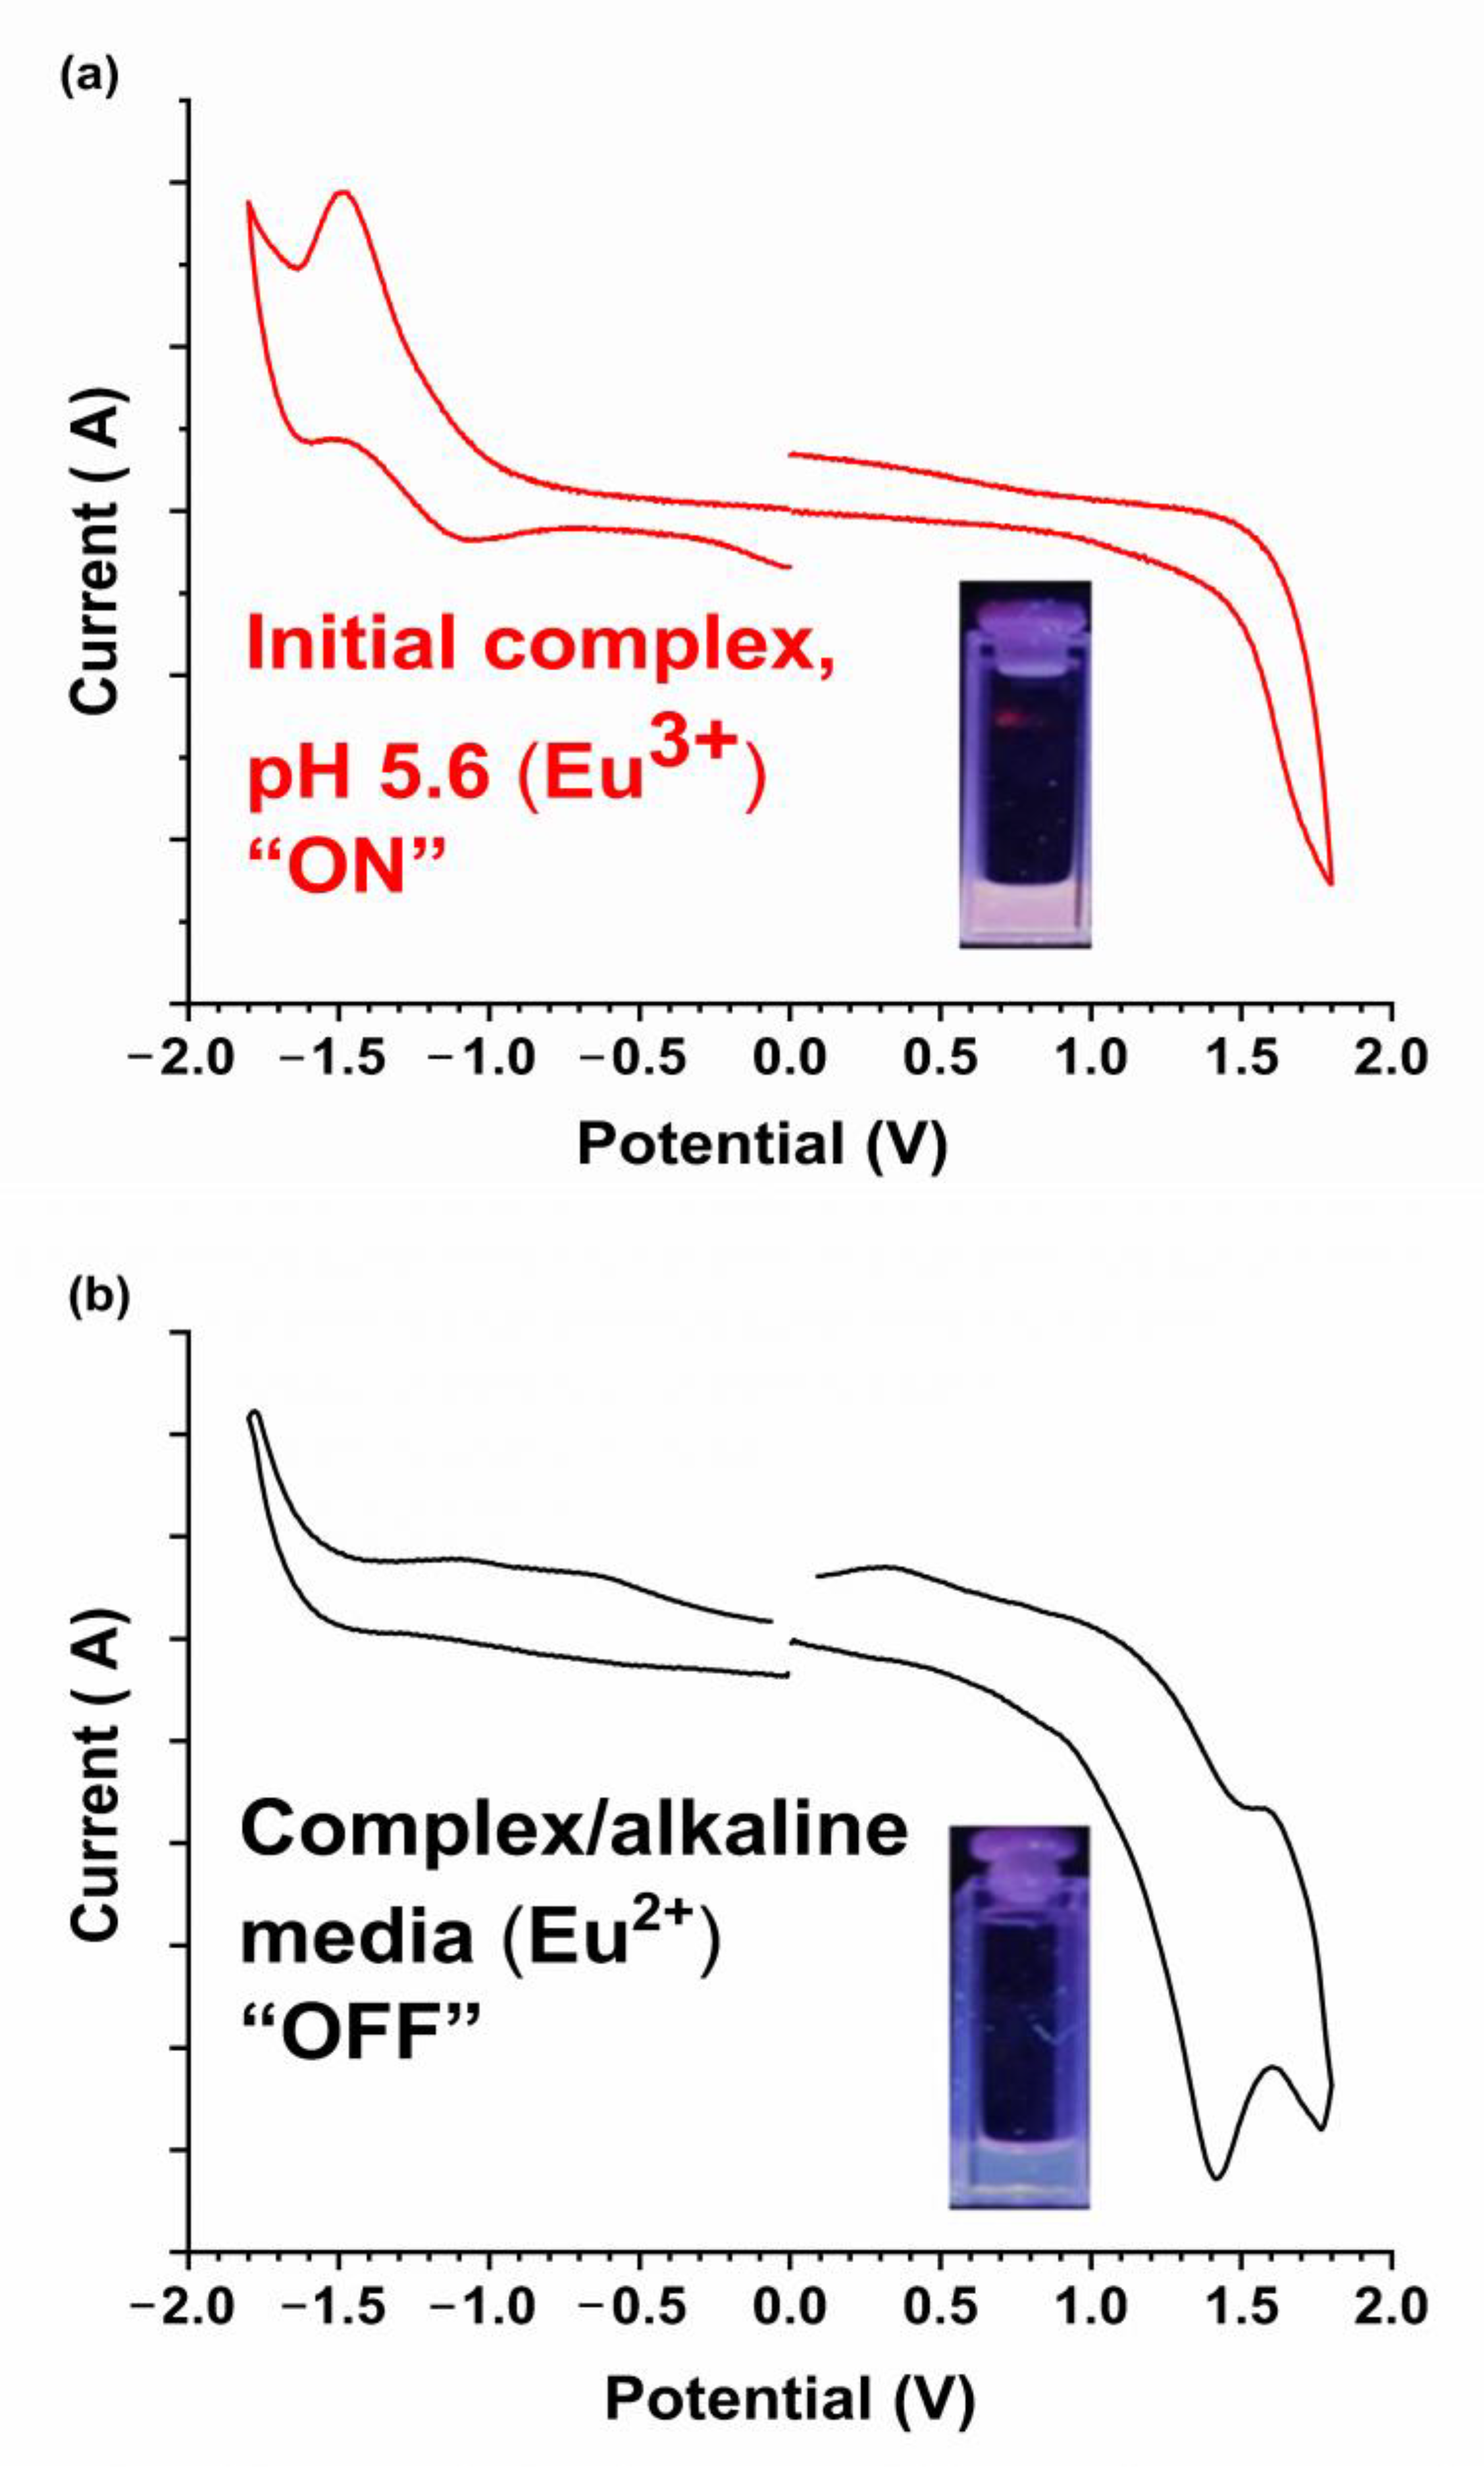
3.2. “On–Off” pH-Switched Sensitization of K[Eu(hfa)4] PL

Europium (III) complexes are known for “on–off” emission switching with respect to changes in the pH of the medium [43,44,45]. The senor exhibits typical red emission at pH values from 4–7, concomitant with quenching at higher acidic and alkaline pH levels [45]. In this work, we have considered the peak arising from the 5D07F2 transition at 618 nm. Figure 2 shows that this red emission is quenched completely at pH 8 but becomes prominent at pH 4.0 and 6.0. These data clearly show that the red 5D07F2 atomic Eu(III) emission slightly decreases in intensity upon going from pH 4 to 6. Overall, the sensor solution exhibits a toggled “on/off” switching with an “on” signal in an acidic medium (pH 4 to 6) that is switched “off” in an alkaline medium (pH > 7.0). Sharp 5D07FJ atomic Eu(III) transition lines dominate the emission spectra, whereas the excitation spectra are dominated by broad transitions characteristic of the four hfa ligands, signifying that the emission lines observed represent sensitized phosphorescence via ligand antenna effect as opposed to direct excitation of the lanthanide ion.
To evaluate the “on–off” emission changes with respect to pH, cyclic voltammetry (CV) studies were performed. Such CV investigations can determine the changes in the oxidation state of the complex at different pH values because Eu(II) from the metal reduction process is known to be non-emissive [46] or weakly emissive specially in methanol medium [47]. Also the oxidation of Eu2+ to Eu+3 is reported in acidic media in aqueous solution [47]. Thus, the CV experiment was performed to confirm the changes in the oxidation state of the Eu(III) metal center from 3+ to 2+, with changes in pH from ~5.6 to 8.0. Figure 3a,b show oxidation and reduction cycles of the initial complex at pH 5.6 and complex in alkaline medium (pH 8), respectively. The initial complex only shows reduction as expected, changing its oxidation state 3+ to 2+ (Figure 3a), while the complex in alkaline medium shows only oxidation (Figure 3b). This shows that the complex in alkaline medium exhibits a lower oxidation state compared to the initial complex, which is +2. This was confirmed by the weak emission detected at 468 nm for the complex in alkaline medium, which is in the signature blue emission region for Eu2+ [48,49,50] (Figure S1). These data suggest that the Eu3+ center undergoes a chemical reduction to Eu2+ in alkaline media, triggering ligand dissociation due to the reduced Columbic attraction. The in situ Eu2+ generation is responsible for the quenched red emission.

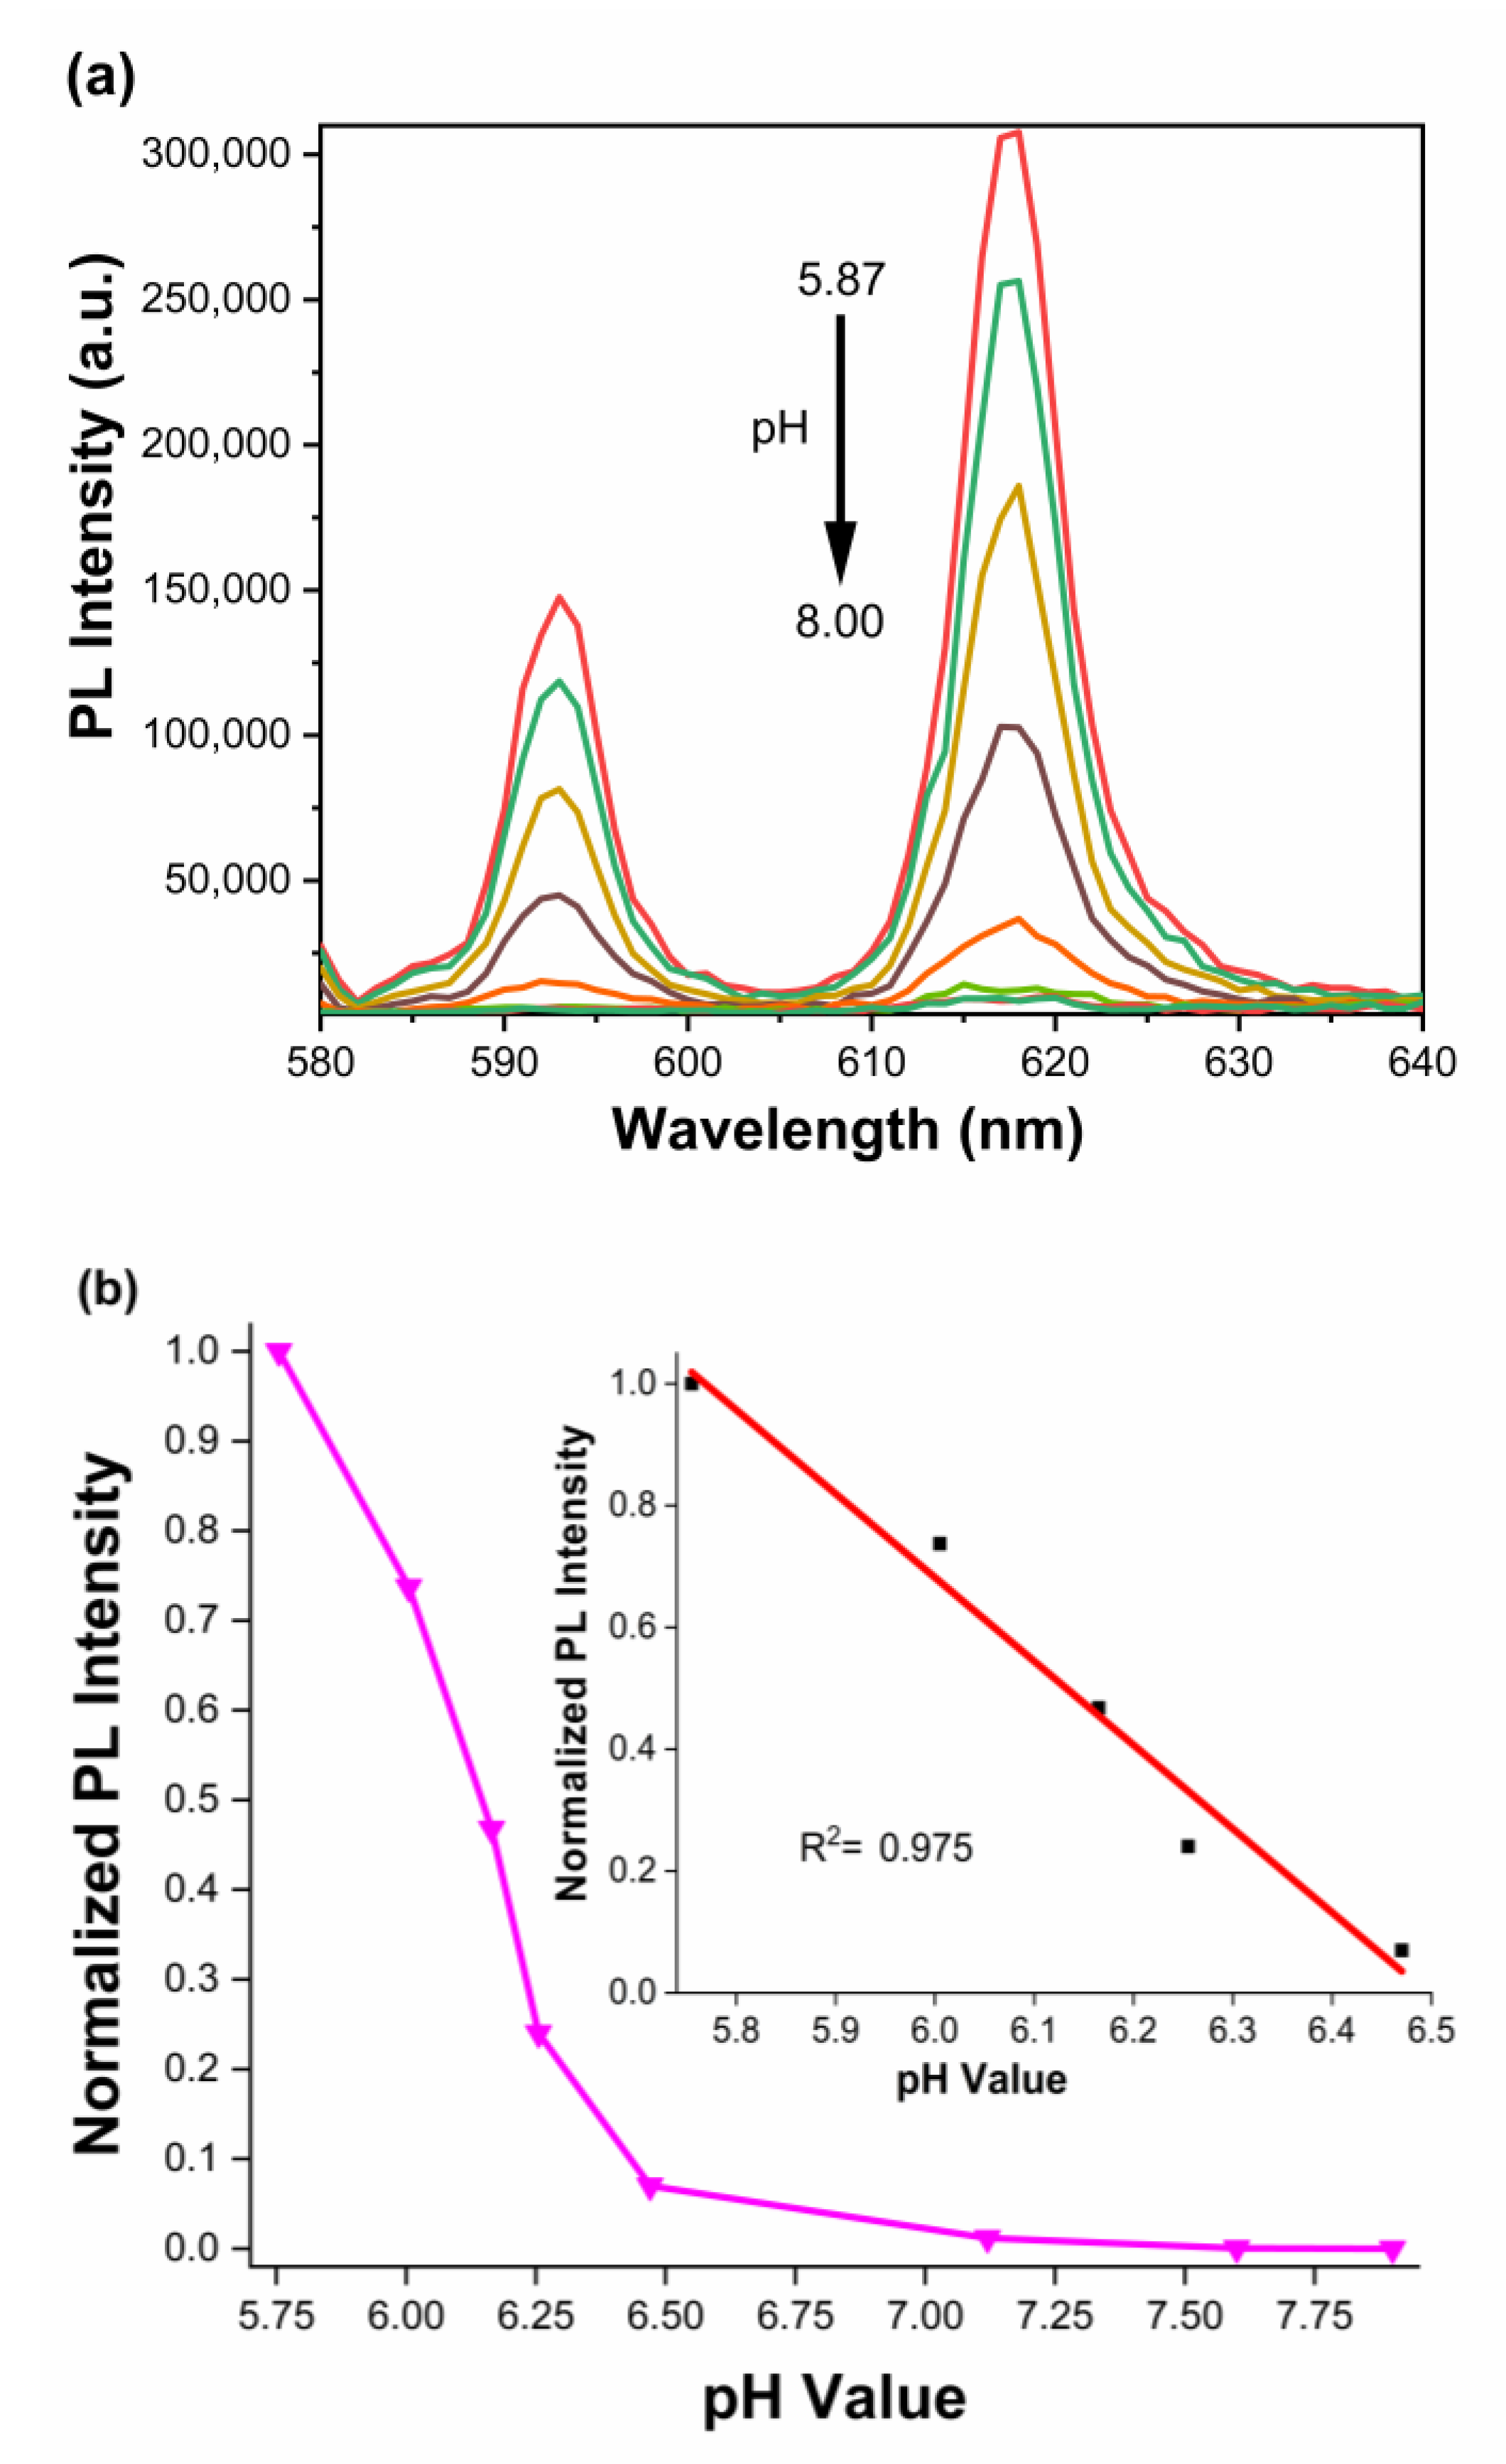
3.3. PL Titration and Determination of Acidity Constant (pKa)

After determining the pH sensitivity of the complex, it was essential to determine the pKa of the complex to understand its usage as a CO2 sensor. The pH-dependent titration was performed by recording the changes in emission intensity of the complex at different pH points. The titration was performed for the pH range of ca. 5.8 to 8.0 (Figure 4a) in a 50:50 ethylene glycol:H2O system. Based on the PL intensity changes in the complex, recorded at 618 nm, the resulting pKa was determined to be 6.13 ± 0.06 (Figure 4b and Figure S2, and Table S2) by correlating the x-axis value at 0.5 units of the y-axis value. Based on the literature value of carbon dioxide–bicarbonate dissociation, the pKa of the complex (6.13) overlaps nicely with the first dissociation constant, 6.1, encouraging the usage of the Eu(III) system for CO2 sensing studies. (The pKa of free hfa (hexafluoroacetylacetonate) is 4.35 [51]). Figure 4b shows that the emission intensity vs. pH exhibits a linear response within the pH 5.8–6.5 range with an R2 = 0.973.
CO2(g) + H2O(l) ⇌ HCO3(aq) + H+ (pKa = 6.1)
HCO3 (aq) + H2O(l) ⇌ CO3−2 + H3O+ (l) (pKa = 10.3)
Hhfa (aq) ⇌ hfa (aq) + H+(aq) (pKa = 4.35)

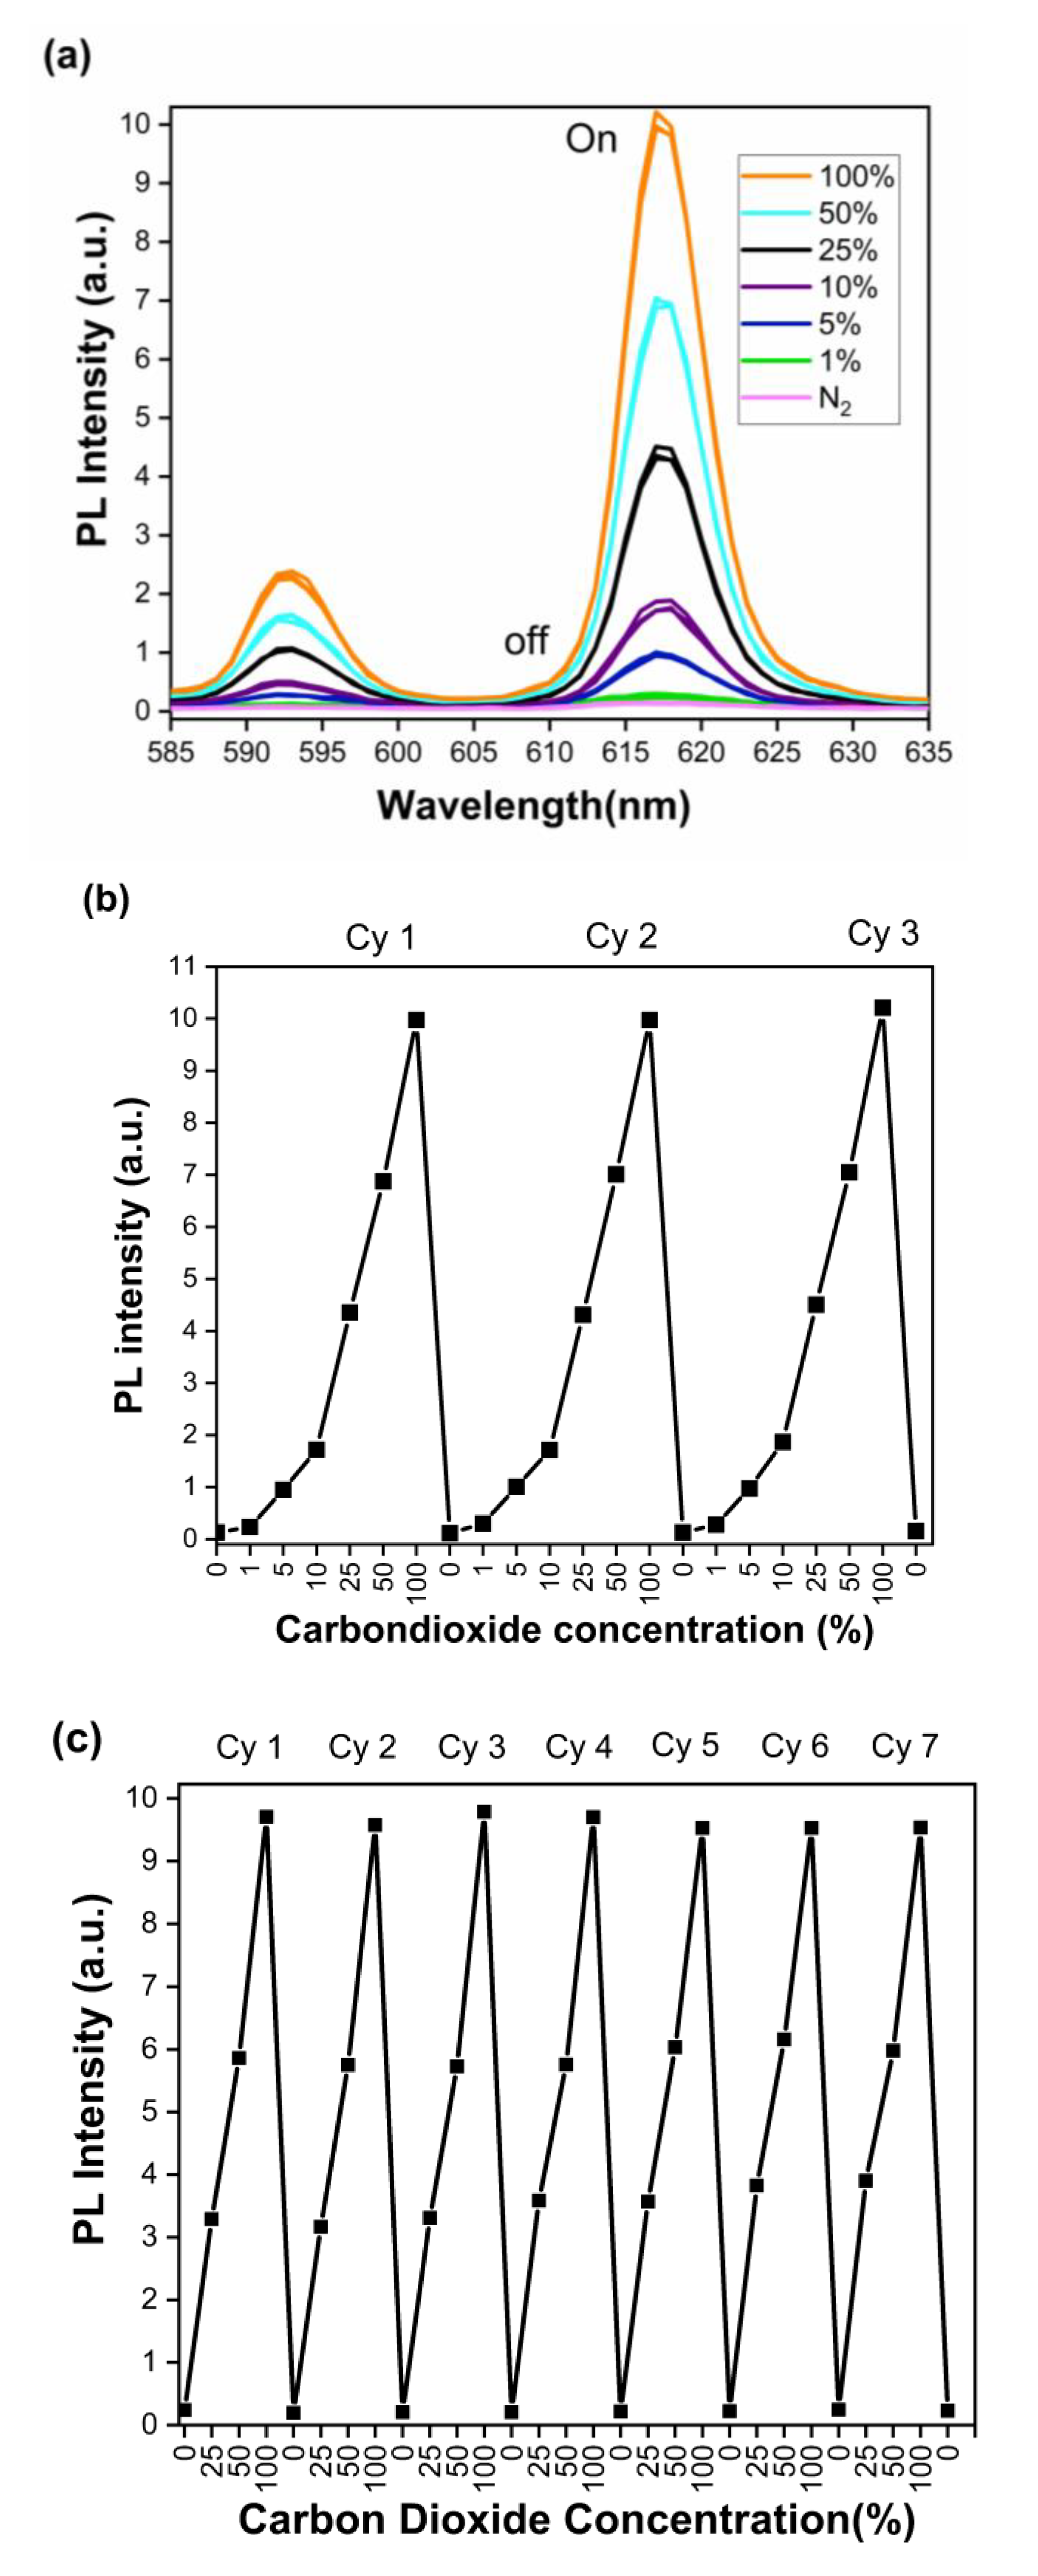
3.4. CO2 Sensing Properties in Solution

When CO2 is dissolved in solution, it changes the pH of the medium, altering the emission intensity of the sensor. Different solvents (ethanol, isopropanol, tetrahydrofuran = THF, polyethylene glycol, and butanol) have been tested. Among these solvents, we have found that K[Eu(hfa)4] exhibits CO2 sensing only in methanol and ethylene glycol media. We hypothesize that this is due to the polarity and solubility of CO2 in these solvents, which impacts the sensing studies. Following these solvents, the sensing behavior of K[Eu(hfa)4] was tested in 50% methanol, 100% methanol, and ethylene glycol (EG). Among these three solvent systems, the complex has been found to exhibit the highest emission changes and stability in the presence vs. absence of CO2 in the EG medium (see Figure S3a–c). The high volatility of methanol created issues with the purging experiments; hence, EG was selected for all such experiments.
In addition to the verification of different suitable solvents for the study, a room temperature ionic liquid (RTIL), 1-butyl-3-methylimidazolium tetrafluoroborate (1B3MIMBF4), was used to evaluate its impact on the sensing studies in these different solvents. However, the presence of the RTIL did not enhance the emission intensity changes nor the stability of the sensor as expected [52]; hence, RTILs were discontinued afterward (Figure S4).
The PL spectra shown in Figure 5 were collected with a 330 nm excitation wavelength, corresponding to the original spectral data in Figure 2 above. The changes in emission intensity of the complex were monitored at 1, 5, 10, 25, 50, and 100% CO2 in CO2/N2 gases mixtures (Figure 5a). These data clearly show that the K[Eu(hfa)4] complex, in an alkaline medium, exhibits a step-wise increase in intensity of the 618 nm peak as the percentage of CO2 increases. However, while purging with N2 gas, the emission was fully quenched, clearly showing the “on–off” switching between 100% CO2 and N2. Most importantly, the emission intensity changes at different tested concentrations of CO2 are highly distinguishable. The I100/I0 ratio is 80.39 ± 3.6 (Table S3), and the percent change in emission intensity going from N2 to 100% CO2 (I0 to I100) is 7911.16%, where I0 and I100 are the intensities after N2 and 100% CO2 gas purging, respectively. To understand the repeatability, stability, and reproducibility of these emission intensity changes at different concentrations of CO2, the “on–off” studies were conducted for multiple continuous cycles. Figure 5c shows data from seven cycles and establishes the reversibility and reproducibility of the sensor. Standard deviations (for all seven cycles) are 0.028, 0.019, and 0.001 for 25%, 50%, and 100% CO2 in N2, respectively (Figure S5). In addition to fluorescence emission intensity measurements, the emission lifetime measurements were acquired for the initial complex before any changes, after base/N2 purging, and for the 100% CO2-purged sample. The initial complex exhibited 303.3 µs (chi2 = 0.90), whereas after the base/N2 purge, the sample does not exhibit any detectable emission lifetime as expected; after purging with 100% CO2, the sample exhibited two emission lifetime values of 260.6 µs and 56.1 µs (chi2 = 0.94). (Figure S6, Table S4).

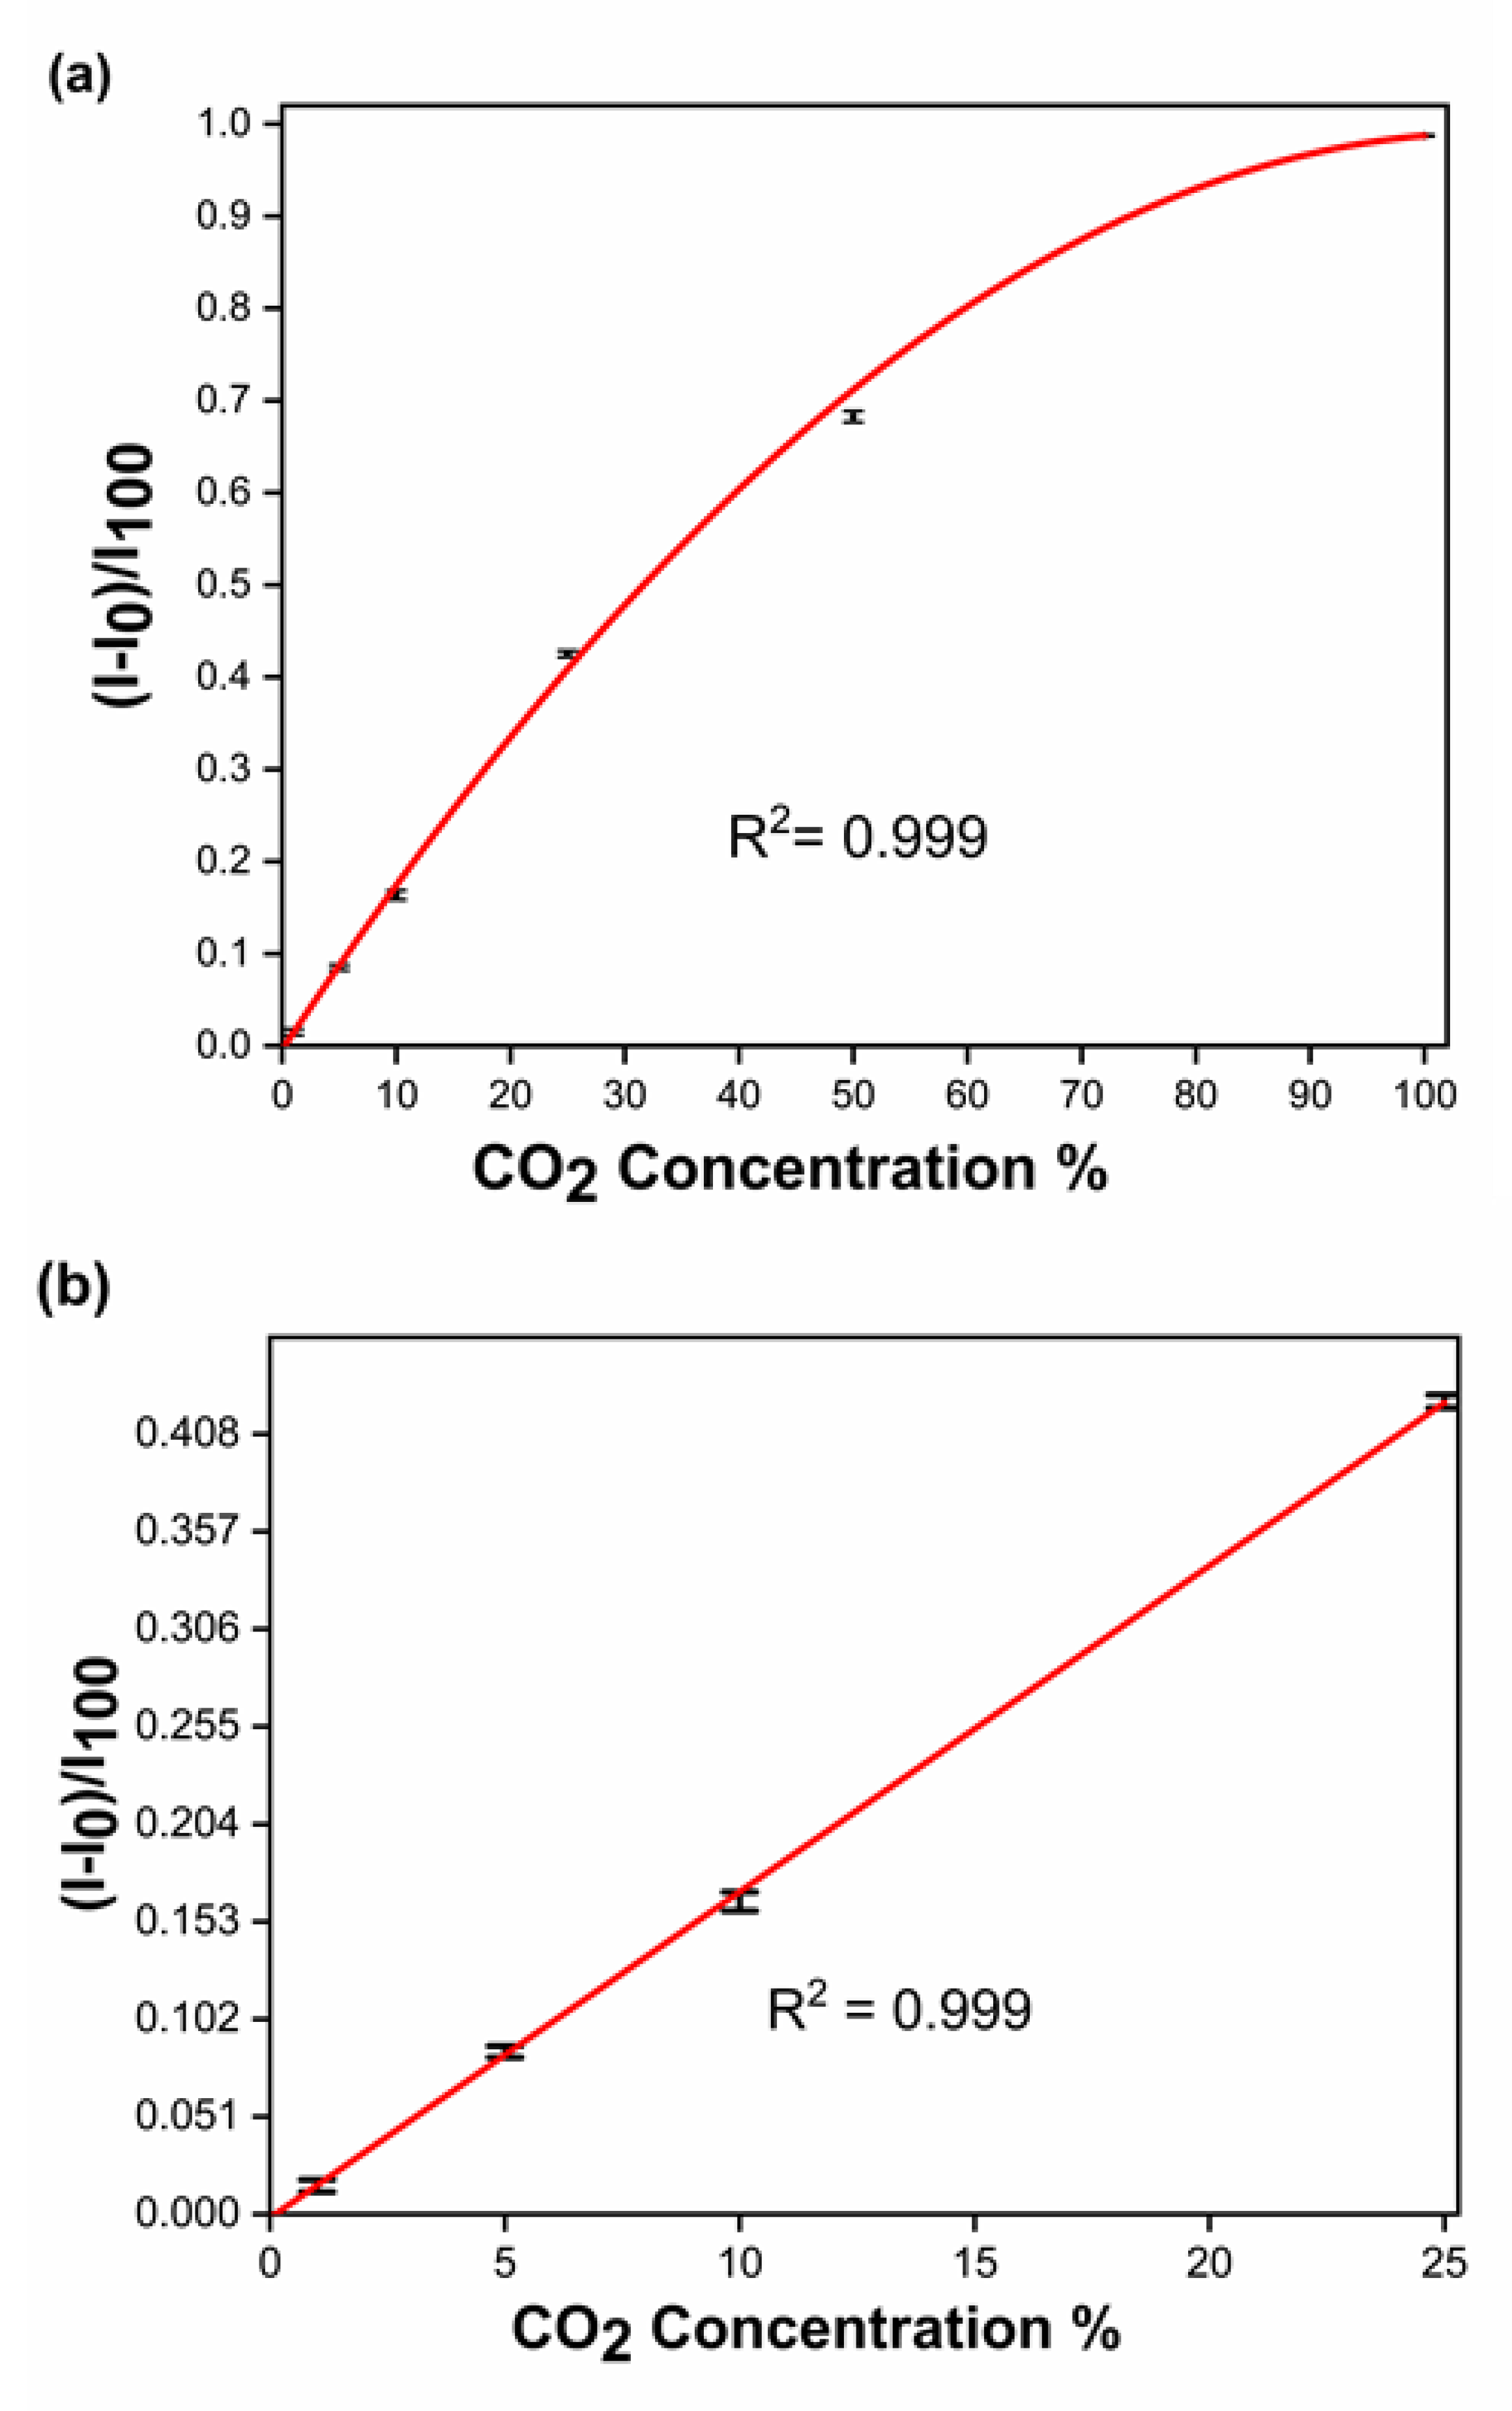
3.5. Standardization and Quantification of the Sensor

The Yutaka Amao group previously reported the europium sensitivity with CO2 [11]. Following the established method based on plotting ((I − I0)/I100) vs. (CO2) in the literature [11], the data we obtained were plotted to establish a standard curve using the complex at different concentrations of CO2. Figure 6a shows the full-scale data points from 0% to 100% CO2 in N2, with an impressive R2 = 0.999 obtained (see Table S6). In Figure 6b, the linear part of the calibration curve is shown between 0–25 [CO2%] in N2, with an R2 = 0.9998. The limit of detection (LOD) is 0.57% [CO2%] in N2 (Table S5).

3.6. A Blind Study to Determine Unknown Concentrations of CO2 Using the Standard Curve Equation

To understand the applicability of the standard curve for estimating the unknown concentration of CO2, an equation was obtained from the graph for the linear region, 0–25%:
A = 0.017 [CO2%] − 0.002
where A is the (I − I0)/I100 value, and the CO2 concentration is in an N2 gas matrix. In a blind study, the equation was tested with different unknown concentrations of CO2 from 1–25% in N2 (Table 1 and Figure S7). The results showed good accuracy and very little variation in the calculated vs. actual concentration for each gas mixture sample tested.
The response time is defined as the time taken to change 90% of the sensor intensity after its exposure to a different atmosphere. The experiment was conducted to measure the response time, and the graph was plotted as (I − I0)/I100 vs. gas purging time. In the experiment, 5%, 50%, and 100% CO2 in N2 gas mixtures were purged continuously until the emission intensity readings were saturated (Figure S8). Readings were taken every 1 min for CO2 and every 5 min for N2. The response times are summarized in Table 2.

3.7. Interferences

Inorganic gasses such as SO2, NO2, and H2S have been reported to interfere with commercial CO2 sensors [53,54,55]. In some cases, NO2 and SO2 have caused significant interference compared to other gasses [56]. Because CO2 is less acidic compared to most other interfering gasses (e.g., SO2) the effect can be minimized by buffering at a higher pH level [54]. After understanding the different analytical properties of the sensor, an attempt was made to understand the effect of interference gases on the sensing ability of K[Eu(hfa)4]. Because the sensor responds to CO2 changes based on changes in the pH of the medium, the sensor was tested for the acidic gases SO2 and NO2. Thus, dissolved NO2 and SO2 gases in ethylene glycol resulted in extremely acidic pH values of 0–1. Only the presence of NO2 annihilated the senor’s irreversibly. SO2, on the other hand, sensitized the emission, but the reversibility was not stable and was challenging to reproduce (Figure S9). Further investigations to understand the effects of these two gases on the chemistry of the sensor complex are warranted.

3.8. Understanding the Changes in Molecular Dynamics after CO2 Purge

With the “on–off” PL switching, we have investigated the molecular dynamics of K[Eu(hfa)4] to understand the changes in the structure of the complex in the presence vs. absence of CO2 gas. The molecular structure was already known from the crystallographic data for the initial complex (crystals grown from a pH 5.6 solution). Different solid samples were prepared separately and analyzed for changes in IR and Raman data (see Figure S10a,b) before and after CO2 purging. Major Raman peaks for the initial complex were identified as follows. The sharp peaks at 248 cm−1 and 1353 cm−1 are due to Eu-O and C-F (CF3) stretching vibrations, respectively [57]. The C=C-H bending mode is assigned for the 1102 cm−1 peak, as expected from the literature [58]. After CO2 purging, the C=C-H bending peak disappeared, and the intensity of the Eu-O stretching peak decreased. In the IR spectrum, the prominent O-H stretch was detected at 3398 cm−1, and the new alkane C-H stretch appeared at 3038 cm−1 after CO2 purging, confirming the enol formation and the protonation of the C=C bond in the hfa ligand [59]; see Figure S10b.
Based on the Raman and FTIR data, we believe that the hfa ligands undergo protonation to form the enol form, which reduces the sensitization effect of the europium(III) center. Based on the mechanism accepted in the literature [59], the proposed changes in the structure of the complex with respect to changes in the gas atmosphere are shown in Figure S10c. The proposed mechanism explains the changes in PL intensity due to changes in the corresponding molecular arrangements in 1 under different gas media.

3.9. Evaluating K[Eu(hfa)4] for a Real-World Application

Fermentation of sugar was selected for evaluating the use of K[Eu(hfa)4] for real-world applications. Fermentation of sugar was carried out following an established literature procedure with minor modifications [29] (see the Section 2). Before the experiment, the commercial CO2 probe was validated with 1%, 25%, 50%, and 100% CO2 gases from calibrated cylinders (see Table S7). Both the actual and control experiments were performed two times, and the data are shown in Figure 7 (see Tables S8 and S9). After 50 min and 60 min of fermentation time, both the sensor and probe showed very similar CO2 levels, highlighting the accuracy and authenticity of the sensor complex. In 2008, the Hjalmerson group performed sucrose (0.15 M) fermentation with the same yeast species, Fleischmann’s active dry yeast, and found a concentration of CO2 around 10,000 ppm (~1%) after 8 min of reaction [27]. The results herein give rise to 0.45% and 0.36% of CO2 after 8 min, and 0.64% and 0.52% of CO2 after 10 min for Trials 01 and 02, respectively. Our data are very close to one of the literature findings, and the minor variations could be due to subtle differences in the experimental setup and/or the initial concentration of sucrose.

4. Conclusions

Here we presented the results of investigating a europium-based complex, K[Eu(hfa)4], that can qualitatively and quantitatively detect dissolved CO2 with an LOD of 0.57% (0.19 mM) in an ethylene glycol (EG) medium. With the pKa of the K[Eu(hfa)4] being within the pH range of the first dissociation of the HCO3/CO2 system, the Eu complex is found to be suitable for the detection of different concentrations of dissolved CO2. The ability of the sensor to differentiate various concentrations of CO2 gas is evaluated by purging the complex solution in EG medium with N2 and 1%, 5%, 10%, 25%, 50%, and 100% CO2 in N2 gases for three cycles. The study is repeated with seven cycles of N2 purging—with 25%, 50%, and 100% CO2 concentrations in N2—and the standard deviations for the 25%, 50%, and 100% samples are 0.028, 0.019, and 0.001, respectively. A calibration curve was established and validated for unknown %CO2 samples. Using the calibration curve, an equation was developed for the linear range, A = 0.017 [CO2] 0.002, and verified with three different percentage-masked CO2 gas samples. The response times for switching N2 to 5% CO2, 5% to 50% CO2, 50% to 100% CO2, and 100% CO2 to N2 were 3, 5, 6, and 5 min, respectively. A rather colossal signal percent change of 7911.16% and excellent signal-to-noise ratio of 80.29 ± 3.79 were observed upon turn-on/off switching/toggling between N2 and 100% CO2 gas, convenient for easy detection and free of signal-to-noise ratio issues. These impressive sensing metrics are attributed, in part, to the rather large operative Stokes shift herein (34,722.22 cm−1 or 288 nm), which prevents the self-quenching of the luminescence and ensures no interference from the excitation wavelength in the emission signal. As an example of additional utilization of these results, the CO2 production in the fermentation of sugar was quantitatively detected and the readings validated by a commercial CO2 probe, which showed good accuracy. The chemistry changes of the ligand and the complex at different pH values are investigated using FTIR and Raman spectroscopy, providing evidence for possible protonation of the carbonyl group in acidic media and the reduction of the europium metal center from 3+ to 2+ using cyclic voltammetry. Detailed investigation pertaining to chemistry of the ligand (s) is underway in an ongoing project where the focus is understanding the effects of different organic ligands on optimizing the sensitivity for the same application.

Supplementary Materials

The following supporting information can be downloaded at: https://www.mdpi.com/article/10.3390/chemosensors11010005/s1. Figure S1: PL spectra of K[Eu(hfa)4] in alkaline medium (pH 8). Blank sample consist of methanol and PSS base. Sensor sample consists of methanol, PSS base and K[Eu(hfa)4]. Graph shows the weak Eu2+ peak at 468nm. Figure S2: pKa determination of the complex K[Eu(hfa)4]in under constant µ =0.01 M of NH4OH in Ethylene glycol/H2O. pKa was determined by taking 0.5 Normalized data point. Figure S3a: Effect of Solvents towards CO2 sensing in 100% MeOH. Figure S3b: Effect of Solvents towards CO2 sensing 50:50 MeOH: H2O. Figure S3c: Effect of Solvents towards CO2 sensing 100% ethylene Glycol. Figure S4: Effect of RTIL [1-butyl-3-methylimidazolium tetrafluoroborate (1B3MIMBF4)] in solution phase study for CO2 sensitivity. Figure S5: Fluorescence intensity of K[Eu(hfa)4] in ethylene glycol medium- Seven consecutive cycles. One Cycle sequence as follows: N2, 25% CO2, 50%CO2 and 100%CO2. Figure S6: Fluorescence intensity of unknowns. Figure S7: Response time of sensor switching from different concentration of CO2%. Figure S8: Fluorescence intensity of SO2 and NO2 purging. Figure S9: K[Eu(hfa)4] sensor was subjected 100% CO2 purging and prepared solid sample for testing. (a) FTIR (b) Raman Spectroscopy was taken from the same solid samples (c) Schematic of enol formation of hfa ligands. FTIR and Raman spectroscopy of PSS (base) were included to identify the matrix influence on spectra. Figure S10: Fermentation experiments conducted with 0.93M sugar concentration and 2.5g of yeast for one hour. The readings were taken after every 10 min. (a) trial 01 (b) trial 02. Table S1: Crystal structure data for the K [Eu(hfa)4] complex, Table S2: pKa calculations. pKa was determined by taking 0.5 Normalized data point. Table S3a: Fluorescence intensities of three consecutive cycles of CO2 purge (1%, 5%,10%, 25%, 50%,100%). Table S3b: CO2% calculations for three consecutive cycles. Table S4: LOD calculations using Residual standard deviation method. Table S5a: I-I0/I100 Vs [CO2%] calculations. Table S5b: I-I0/I100 Vs [CO2%] average and standard deviation calculations. Table S6: CO2 Probe Validation with Carbon dioxide Cylinders. Table S7: Fermentation trial 1 data Pictures from the CO2 Probe on sugar in respective time intervals. Table S8: Fermentation trial 2 data Pictures from the CO2 Probe on sugar in respective time intervals. References in Supplementary Materials: Refs [60,61,62,63].

Author Contributions

Conceptualization, S.B.M.; methodology, S.B.M. and M.A.O.; formal analysis, E.N.B., N.A.K.R.P., V.N.N., and W.P.; investigation, E.N.B., and N.A.K.R.P.; resources, S.B.M., and M.A.O.; data curation, N.A.K.R.P., E.N.B., V.N.N., and W.P.; writing—E.N.B., N.A.K.R.P., and S.B.M.; writing—review and editing, N.A.K.R.P., M.A.O., and S.B.M.; visualization, M.A.O. and S.B.M.; supervision, S.B.M.; project administration, S.B.M.; funding acquisition, S.B.M., and M.A.O. All authors have read and agreed to the published version of the manuscript.

Funding

This research was primarily funded by a United States National Science Foundation (Grants CHE-1413641 and CHE-1545934), National Aeronautics and Space Administration (Subcontract No. GN-16-0561 to UNT from Intelligent Optical Systems, Inc.) and Robert A. Welch Foundation (Grant B-1542) awards.

Institutional Review Board Statement

Not applicable.

Informed Consent Statement

Not applicable.

Data Availability Statement

Data is contained within the article or supplementary materials.

Acknowledgments

We are grateful for help with some measurements from Anuradha Liyanage and Wijayantha in the Francis D’Souza group, Lama Abu-Amara in the Hao Yan group, and Jose Calderon (departmental shared instrumentation facility) for assistance with CV, Raman, and IR measurements, respectively. Data collected for this paper represent part of the Ph.D. dissertations of Nawagamu A.K. Rajitha Perera and Erin N. Benton.

Conflicts of Interest

The authors declare no conflict of interest.

References

  1. Zhang, Y.; Zhang, X.; Zhang, X.; Mu, H.; Li, H.; An, M.; Yoon, J.; Yu, H. Dual-channel sensing of CO2: Reversible solution-gel transition and gelation-induced fluorescence enhancement. Sens. Actuators B Chem. 2018, 255, 2764–2778. [Google Scholar] [CrossRef]
  2. Borchert, N.B.; Kerry, J.P.; Papkovsky, D.B. A CO2 sensor based on Pt-porphyrin dye and FRET scheme for food packaging applications. Sens. Actuators B Chem. 2013, 176, 157–165. [Google Scholar] [CrossRef]
  3. Lochman, L.; Zimcik, P.; Klimant, I.; Novakova, V.; Borisov, S.M. Red-emitting CO2 sensors with tunable dynamic range based on pH-sensitive azaphthalocyanine indicators. Sens. Actuators B Chem. 2017, 246, 1100–1107. [Google Scholar] [CrossRef]
  4. Sun, J.; Ye, B.; Xia, G.; Zhao, X.; Wang, H. A colorimetric and fluorescent chemosensor for the highly sensitive detection of CO2 gas: Experiment and DFT calculation. Sens. Actuators B Chem. 2016, 233, 76–82. [Google Scholar] [CrossRef]
  5. Contreras-Gutierrez, P.K.; Medina-Rodríguez, S.; Medina-Castillo, A.L.; Fernandez-Sanchez, J.F.; Fernandez-Gutierrez, A. A new highly sensitive and versatile optical sensing film for controlling CO2 in gaseous and aqueous media. Sens. Actuators B Chem. 2013, 184, 281–287. [Google Scholar] [CrossRef]
  6. Mills, A.; Lepre, A.; Wild, L. Breath-by-breath measurement of carbon dioxide using a plastic film optical sensor. Sens. Actuators B Chem. 1997, 39, 419–425. [Google Scholar] [CrossRef]
  7. Habib, M.; Hussain, S.S.; Riaz, S.; Naseem, S. Preparation and Characterization of ZnO Nanowires and their Applications in CO2 Gas Sensors. Mater. Today Proc. 2015, 2, 5714–5719. [Google Scholar] [CrossRef]
  8. Fernández-Sánchez, J.F.; Cannas, R.; Spichiger, S.; Steiger, R.; Spichiger-Keller, U.E. Optical CO2-sensing layers for clinical application based on pH-sensitive indicators incorporated into nanoscopic metal-oxide supports. Sens. Actuators. B Chem. 2007, 128, 145–153. [Google Scholar] [CrossRef]
  9. Ge, X.; Kostov, Y.; Rao, G. High-stability non-invasive autoclavable naked optical CO2 sensor. Biosens. Bioelectron. 2003, 18, 857. [Google Scholar] [CrossRef]
  10. Mills, A.; Chang, Q. Fluorescence plastic thin-film sensor for carbon dioxide. Analyst 1993, 118, 839–843. [Google Scholar] [CrossRef]
  11. Nakamura, N.; Amao, Y. An optical sensor for CO2 using thymol blue and europium(III) complex composite film. Sens. Actuators B Chem. 2003, 92, 98–101. [Google Scholar] [CrossRef]
  12. Chu, C.; Lo, Y. Fiber-optic carbon dioxide sensor based on fluorinated xerogels doped with HPTS. Sens. Actuators. B Chem. 2008, 129, 120–125. [Google Scholar] [CrossRef]
  13. Sipior, J.; Randers-Eichhorn, L.; Lakowicz, J.R.; Carter, G.M.; Rao, G. Phase Fluorometric Optical Carbon Dioxide Gas Sensor for Fermentation Off-Gas Monitoring. Biotechnol. Prog. 1996, 12, 266–271. [Google Scholar] [CrossRef]
  14. Lakowlcz, J.R.; Szmacmslu, H.; Karakelle, M. Optical sensing of pH and pC0, using phase-modulation fluorimetry and resonance energy transfer. Anaiytrca Chmrea Acta 1993, 272, 179. [Google Scholar] [CrossRef]
  15. Agayn, V.I.; Walt, D.R. Fiber-optic Sensor for Continuous Monitoring of Fermentation pH. Bio/Technol. 1993, 11, 726–729. [Google Scholar] [CrossRef]
  16. Leiner, M.J.P. Luminescence chemical sensors for biomedical applications: Scope and limitations. Anal. Chim. Acta 1991, 255, 209. [Google Scholar] [CrossRef]
  17. Hasegawa, Y.; Sato, N.; Hirai, Y.; Nakanishi, T.; Kitagawa, Y.; Kobayashi, A.; Kato, M.; Seki, T.; Ito, H.; Fushimi, K. Enhanced Electric Dipole Transition in Lanthanide Complex with Organometallic Ruthenocene Units. J. Phys. Chem. A 2015, 119, 4825–4833. [Google Scholar] [CrossRef]
  18. Lunstroot, K.; Driesen, K.; Nockemann, P.; Van Hecke, K.; Van Meervelt, L.; Görller-Walrand, C.; Binnemans, K.; Bellayer, S.; Viau, L.; Le Bideau, J.; et al. Ionic liquid as plasticizer for europium(III)-doped luminescent poly(methyl methacrylate) films. Phys. Chem. Chem. Phys. 2010, 12, 1879–1885. [Google Scholar] [CrossRef] [Green Version]
  19. Parker, D. Luminescent lanthanide sensors for pH, pO 2 and selected anions. Coord. Chem. Rev. 2000, 205, 109–130. [Google Scholar] [CrossRef] [Green Version]
  20. Lowe, M.; Parker, D.; Reany, O.; Aime, S.; Botta, M.; Castellano, G.; Gianolio, E.; Pagliarin, R. pH-dependent modulation of relaxivity and luminescence in macrocyclic gadolinium and europium complexes based on reversible intramolecular sulfonamide ligation. J. Am. Chem. Soc. 2001, 123, 7601–7609. [Google Scholar] [CrossRef]
  21. Zhang, X.; Jiao, Y.; Jing, X.; Wu, H.; He, G.; Duan, C. pH-sensitive fluorescent sensors based on europium(III) complexes. Dalton Trans. 2011, 40, 2522. [Google Scholar] [CrossRef] [PubMed]
  22. Wei, C.; Wei, H.; Yan, W.; Zhao, Z.; Cai, Z.; Sun, B.; Meng, Z.; Liu, Z.; Bian, Z.; Huang, C. Water-Soluble and Highly Luminescent Europium(III) Complexes with Favorable Photostability and Sensitive pH Response Behavior. Inorg. Chem. 2016, 55, 10645–10653. [Google Scholar] [CrossRef] [PubMed]
  23. Lieberman, R.A.; Delgado-Alonso, J. Extended-length fiber optic carbon dioxide monitoring. SPIE 2013, 8718, 79–88. [Google Scholar]
  24. Ge, X.; Kostov, Y.; Rao, G. Low-cost noninvasive optical CO2 sensing system for fermentation and cell culture. Biotechnol. Bioeng. 2005, 89, 329–334. [Google Scholar] [CrossRef]
  25. Marques, W.L.; Raghavendran, V.; Stambuk, B.U.; Gombert, A.K. Sucrose and Saccharomyces cerevisiae: A relationship most sweet. FEMS Yeast Res. 2016, 16, fov107. [Google Scholar] [CrossRef] [Green Version]
  26. Wilson, J.; Miller, A.; Hoang, A.; Collette, J.; Dubose, T. Sucrose increases the emission of CO2 during yeast (Saccharomyces cerevisiae) fermentation faster than glucose. J. Undergrad. Biol. Lab. Investig. 2019, 2, 1–4. [Google Scholar]
  27. Crancer, M.; Roy, J.; Zayaleta, C.; Hjalmerson, E. Analyzing the Rate of Carbon Dioxide Created by Fermentation in Yeast With Different Types of Sugars. J. Undergrad. Biol. Lab. Investig. 2018, 1, 1–5. [Google Scholar]
  28. De Silva, C.R.; Wang, R.; Zheng, Z. Highly luminescent Eu(III) complexes with 2,4,6-tri(2-pyridyl)-1,3,5-triazine ligand: Synthesis, structural characterization, and photoluminescence studies. Polyhedron 2006, 25, 3449–3455. [Google Scholar] [CrossRef]
  29. Koutsokali, M.; Valahas, M. Anaerobic and Aerobic Respiration in Yeast: Small-Scale Variations on a Classic Laboratory Activity. J. Chem. Educ. 2020, 97, 1041–1047. [Google Scholar] [CrossRef]
  30. Burns, J.H.; Danford, M.D. The Crystal Structure of Cesium Tetrakis (hexafluoroacetylacetonato)europate and -americate. Isomorphism with the Yttrate. Inorg. Chem. 1968, 8, 1780–1784. [Google Scholar] [CrossRef]
  31. Barry, M.C.; Wei, Z.; He, T.; Filatov, A.S.; Dikarev, E.V. Volatile Single-Source Precursors for the Low-Temperature Preparation of Sodium-Rare Earth Metal Fluorides. J. Am. Chem. Soc. 2016, 138, 8883–8887. [Google Scholar] [CrossRef]
  32. Armelao, L.; Belli Dell’Amico, D.; Bottaro, G.; Bellucci, L.; Labella, L.; Marchetti, F.; Mattei, C.A.; Mian, F.; Pineider, F.; Poneti, G.; et al. 1D hetero-bimetallic regularly alternated 4f-3d coordination polymers based on N-oxide-4,4′-bipyridine (bipyMO) as a linker: Photoluminescence and magnetic properties. Dalton Trans. 2018, 47, 8337–8345. [Google Scholar] [CrossRef] [Green Version]
  33. Osawa, M.; Hoshino, M.; Wada, T.; Hayashi, F.; Osanai, S. Intra-Complex Energy Transfer of Europium(III) Complexes Containing Anthracene and Phenanthrene Moieties. J. Phys. Chem. A 2009, 113, 10895–10902. [Google Scholar] [CrossRef]
  34. Kozuka, T.; Yamamoto, M.; Ktagawa, Y.; Nakansh, T.; Fushm, K.; Hasegawa, Y. Photosensitized Luminescence of Highly Thermostable Mononuclear Eu(III) Complexes with π-Expanded β-Diketonate Ligands. Bull. Chem. Soc. Jpn. 2017, 90, 1287–1292. [Google Scholar] [CrossRef]
  35. Yamamoto, M.; Nakansh, T.; Ktagawa, Y.; Sek, T.; Ito, H.; Fushm, K.; Hasegawa, Y. Synthesis and Photophysical Properties of Eu(III) Complexes with Phosphine Oxide Ligands including Metal Ions. Bull. Chem. Soc. Jpn. 2018, 91, 6–11. [Google Scholar] [CrossRef]
  36. Wang, Z.; Liu, N.; Li, H.; Chen, P.; Yan, P. The Role of Blue-Emissive 1,8-Naphthalimidopyridine N-Oxide in Sensitizing EuIII Photoluminescence in Dimeric Hexafluoroacetylacetonate Complexes. Eur. J. Inorg. Chem. 2017, 2017, 2211–2219. [Google Scholar] [CrossRef]
  37. Lyle, S.J.; Witts, A.D. A Critical Examination of Some Methods for the Preparation of Tris and Tetrakis Diketonates of Europium(III). Inorg. Chem. Acta 1971, 5, 481–484. [Google Scholar] [CrossRef]
  38. Hasegawa, Y.; Yamamuro, M.; Wada, Y.; Kanehisa, N.; Kai, Y.; Yanagida, S. Luminescent Polymer Containing the Eu(III) Complex Having Fast Radiation Rate and High Emission Quantum Efficiency. J. Phys. Chem. A 2003, 107, 1697–1702. [Google Scholar] [CrossRef]
  39. Richardson, M.F.; Wagner, W.F.; Sands, D.E. Rare-earth trishexafluoroacetylacetonates and related compounds. J. Inorg. Nucl. Chem. 1968, 30, 1275–1289. [Google Scholar] [CrossRef]
  40. Cotton, S. Coordination Chemistry of the Lanthanides. In Lanthanide and Actinide Chemistry; Woolins, D., Crabtree, B., Atwood, D., Meyer, G., Eds.; John Wiley and Sons: Hoboken, NJ, USA, 2006; pp. 39–41. [Google Scholar]
  41. Langer, V.; Smrčok, Ľ.; Boča, M. Redetermination of Na3TaF8. Acta Crystallogr. C 2010, 66, i8–i86. [Google Scholar] [CrossRef]
  42. Peterson, S.W.; Holloway, J.H.; Coyle, B.A.; Williams, J.M. Antiprismatic Coordination about Xenon: The Stucture of Nitrosonium Octafluoroxenate(VI). Science 1971, 173, 1238–1239. [Google Scholar] [CrossRef] [PubMed]
  43. Gunnlaugsson, T.; Parker, D. Luminescent europium tetraazamacrocyclic complexes with wide range pH sensitivity. Chem. Commun. 1998, 4, 511–512. [Google Scholar] [CrossRef]
  44. Lowe, M.P.; Parker, D. pH Switched sensitisation of europium(III) by a dansyl group. Inorg. Chim. Acta 2001, 317, 163–173. [Google Scholar] [CrossRef]
  45. Bazzicalupi, C.; Bencini, A.; Bianchi, A.; Giorgi, C.; Masotti, A.; Valtancoli, B.; Fusi, V.; Roque, A.; Pina, F. pH Modulation of The Luminescence Emission of a New Europium Cryptate Complex. Chem. Commun. 2000, 7, 561–562. [Google Scholar] [CrossRef]
  46. Gunnlaugsson, T.; Leonard, J.P.; Sénéchal, K.; Harte, A.J. pH Responsive Eu(III)−Phenanthroline Supramolecular Conjugate:  Novel “Off − On − Off” Luminescent Signaling in the Physiological pH Range. J. Am. Chem. Soc. 2003, 125, 12062–12063. [Google Scholar] [CrossRef]
  47. Sabbatini, N.; Ciano, M.S.; Dellonte, S.; Bonazzi, A.; Balzani, V. Absorption and emission properties of a europium(II) cryptate in aqueous solution. Chem. Phys. Lett. 1982, 90, 265. [Google Scholar] [CrossRef]
  48. Sabbatini, N.; Ciano, M.; Dellonte, S.; Bonazzi, A.; Bolletta, F.; Balzani, V. Photophysical properties of europium(II) cryptates. J. Phys. Chem. 1984, 88, 1534–1537. [Google Scholar] [CrossRef]
  49. Ishii, A.; Hasegawa, M. An Interfacial Europium Complex on SiO2 Nanoparticles: Reduction-Induced Blue Emission System. Sci. Rep. 2015, 5, 11714. [Google Scholar] [CrossRef]
  50. Christoffers, J.; Starynowicz, P. A europium(II) complex with bis-pyridino-18-crown-6. Polyhedron 2008, 27, 2688–2692. [Google Scholar] [CrossRef]
  51. Sadi, B.B.; Li, C.; Kramer, G.H. An emergency radiobioassay method for 226Ra in human urine samples. Radiat. Prot. Dosim. 2012, 151, 10–16. [Google Scholar] [CrossRef] [Green Version]
  52. Lu, B.; Jin, J.; Zhang, L.; Li, W. Absorption of carbon dioxide into aqueous blend of monoethanolamine and 1-butyl-3-methylimidazolium tetrafluoroborate. Int. J. Greenh. Gas Control 2012, 11, 152–157. [Google Scholar] [CrossRef]
  53. Kobos, R.K.; Parks, S.J.; Meyerhoff, M.E. Selectivity Characteristics of Potentiometric Carbon Dioxide Sensors with Various Gas Membrane Materials. Anal. Chem. 1982, 54, 1976–1980. [Google Scholar] [CrossRef]
  54. Mascini, M.; Cremisini, C. Evaluation of measuring range and interferences for gas-sensing potentiometric probes. Anal. Chim. Acta 1978, 97, 237. [Google Scholar] [CrossRef]
  55. Revsbech, N.P.; Garcia-Robledo, E.; Sveegaard, S.; Andersen, M.H.; Gothelf, K.V.; Larsen, L.H. Amperometic microsensor for measurement of gaseous and dissolved CO2. Sens. Actuators. B Chem. 2019, 283, 349–354. [Google Scholar] [CrossRef]
  56. Ishiji, T.; Takahashi, K.; Kira, A. Amperometric carbon dioxide gas sensor based on electrode reduction of platinum oxide. Anal. Chem. 1993, 65, 2736–2739. [Google Scholar] [CrossRef]
  57. Malandrino, G.; Bettinelli, M.; Speghini, A.; Fragalà, I.L. Europium ”Second Generation” Precursors for Metal-Organic Chemical Vapor Deposition: Characterization and Optical Spectroscopy. Eur. J. Inorg. Chem. 2001, 2001, 1039–1044. [Google Scholar] [CrossRef]
  58. Bray, R.G. Infrared and Raman Spectroscopy of Uranyl (Hexafluoroacetyl-Acetonate)2 Adducts in the Vapor and Condensed Phases. Spectrochim. Acta 1983, 39, 559. [Google Scholar] [CrossRef]
  59. Howard, D.L.; Kjaergaard, H.G.; Huang, J.; Meuwly, M. Infrared and Near-Infrared Spectroscopy of Acetylacetone and Hexafluoroacetylacetone. J. Phys. Chemistry. A Mol. Spectrosc. Kinet. Environ. Gen. Theory 1900, 119, 7980–7990. [Google Scholar] [CrossRef]
  60. Sheldrick, G.M. SHELXT-Integrated space-group and crystal-structure determination. Acta Crystallogr. A Found. Adv. 2015, 71, 3–8. [Google Scholar] [CrossRef] [Green Version]
  61. Sheldrick, G.M. Crystal structure refinement with SHELXL. Acta Crystallogr. C Struct. Chem. 2014, 71, 3–8. [Google Scholar] [CrossRef] [Green Version]
  62. Spek, A.L. Structure validation in chemical crystallography. Acta Crystallogr. Sect. D Biol. Crystallogr. 2009, 65, 148–155. [Google Scholar] [CrossRef] [PubMed] [Green Version]
  63. Dolomanov, O.V.; Bourhis, L.J.; Gildea, R.J.; Howard, J.A.K.; Puschmann, H. OLEX2: A complete structure solution, refinement and analysis program. J. Appl. Cryst. 2009, 42, 339–341. [Google Scholar] [CrossRef]
Figure 1. (a) Molecular structure of K[Eu(hfa)4] and three views of its crystal structure, showing: (b) 50% thermal ellipsoids of two adjacent repeat units of the entire structure; (c) ball and stick drawings of a single complex anion unit (hydrogen atoms removed for clarity); and (d) a zoomed view thereof showing the coordination sphere with Eu-O distances labeled in Å units.
Chemosensors 11 00005 g001
Figure 2. Photoluminescence spectra of K[Eu(hfa)4] in solution at pH 4, 6, and 8. Right traces (λ > 500 nm) show emission spectra dominated by the sharp 5D07FJ atomic Eu(III) emission lines, while left traces (λ < 450 nm) show excitation spectra dominated by the broad hfa ligand-based transitions. Inset shows emission pictures under UV light irradiation at respective pH values.
Chemosensors 11 00005 g002
Figure 3. Cyclic voltammetry data for 1 at 0.5 mg/0.5 mL in dichlorobenzene solvent and TBAClO4 electrolyte (a) at pH 5.6 and (b) at pH 8.0. The inset pictures show the complex under a UV lamp at the respective pHs.
Chemosensors 11 00005 g003
Figure 4. (a) PL spectra of K[Eu(hfa)4] with different pH values from pH 5.87 to pH 8.0. (b) PL titration at 618 nm at different pH, the inset shows the linear relationship from pH 8.8 to 6.5 with R2 of 0.975.
Chemosensors 11 00005 g004
Figure 5. (a) PL spectra of the sensor after exposure to 1%, 5%, 10%, 25%, 50%, and 100% of CO2 in N2. (b) PL peak intensity changes for three purging cycles using 1%, 5%, 10%, 25%, 50%, and 100% of CO2 in N2. (c) PL peak intensity changes for seven purging cycles using 25%, 50%, and 100% of CO2 in N2.
Chemosensors 11 00005 g005
Figure 6. Variation of (I − I0)/I100 with CO2 concentration in N2 of (a) 0–100% (entire range, polynomial fit) and (b) 0–25% (linear range).
Chemosensors 11 00005 g006
Figure 7. Fermentation setup to detect the evolution of CO2 gas (a) with complex (b) using a CO2 probe (a = fermentation flask; b = 37 °C water bath; c = connecting tube with a needle attached to the end; d = sensor solution to receive CO2 gas from the fermentation setup; e = thermometer; f = connecting tube with a dust filter; g = probe). (c) Data plot showing the determination of CO2 gas concentration with time using complex 1 and a CO2 probe. (Also see Tables S8 and S9 and Figure S11).
Chemosensors 11 00005 g007
Table 1. Blind study was done for three unknown CO2 concentrations to understand the trustworthiness of the derived equation. See Figure S7.
Gas Sample%CO2, Calibration Curve %CO2, Actual
A1.37%1.99%
B6.38%6.00%
C10.57%10.04%
Table 2. Response time of sensor switching from different concentrations of %CO2. Reversibility was established with N2 purging; the intensity can be brought to a baseline via N2 purging to start a new cycle.
Response Time, Min.
N2 to 5% CO23
5% to 50% CO25
50% CO2 to 100% CO26
100% CO2 to N25
Disclaimer/Publisher’s Note: The statements, opinions and data contained in all publications are solely those of the individual author(s) and contributor(s) and not of MDPI and/or the editor(s). MDPI and/or the editor(s) disclaim responsibility for any injury to people or property resulting from any ideas, methods, instructions or products referred to in the content.

