1. Introduction
Pathogenic microbes have greatly threatened human health and safety [
1,
2]. Especially, Gram-negative bacteria have caused a more critical healthcare issue, due to their complex cell envelope consisting of three essential layers: an outer membrane (OM), a cytoplasmic membrane (CM) and a peptidoglycan cell wall (
Scheme 1a) [
3]. Unlike CM, which is composed of the fluid phospholipid bilayer, OM possesses phospholipids in the inner leaflet and lipopolysaccharides (LPS) in the outer leaflet, which exerts the barrier function and makes Gram-negative bacteria difficult to kill [
4,
5]. Many Gram-negative bacteria have acquired resistance to the traditional antibiotics that act on specific intracellular targets [
4,
6,
7]. To address this, membrane-active antimicrobials, such as the cationic amphiphiles, have been developed to physically disrupt bacterial membranes and thus show a low tendency to induce bacteria resistance [
8,
9,
10,
11,
12]. When the antimicrobials compromise the CM integrity of Gram-negative bacteria, it is commonly regarded as the lethal event [
4]. However, the existence of OM hinders the entry of antimicrobials to destroy the CM of bacteria, which often renders the designed antimicrobials invalid [
5,
13]. Thus, to facilitate the design and assessment of effective antimicrobials, it is necessary to monitor and understand the interaction of membrane-active antimicrobials with the OM and CM of Gram-negative bacteria.
To monitor the bacterial membrane disruption of antimicrobials, some electrical devices [
14,
15], liquid crystals sensors [
16] and fluorescence methods [
17,
18] have been explored. Fluorescence methods have attracted more attention not only due to the simple and fast feature, but also the direct visualization of the interaction between antimicrobials and bacteria [
4,
17,
19,
20]. Various fluorescent dyes, such as propidium iodide (PI), Rhodamine 123 and carbocyanine derivatives, have been developed to assess the viability and CM integrity of Gram-negative bacteria [
18]. However, none of the above dyes can be solely used to offer information about the change of OM and CM simultaneously [
21]. Two fluorochromes of OM and CM indicators must be adequately screened to avoid the wrong interpretations caused by the energy transfer phenomena between them [
18]. Therefore, grasping the OM and CM variation based on one single fluorescence probe will greatly simplify the method and is highly desirable to better reveal the interaction of membrane-active antimicrobials with OM and CM of Gram-negative bacteria.
Aggregation-induced emission luminogens (AIEgens) have achieved great success in detecting microbes and bioanalytes due to their merits of low background and high sensitivity [
22,
23,
24,
25,
26,
27]. AIEgens with multi-rotor structures are normally non-fluorescent due to the fast dissipation of the excited state energy by the free intramolecular motions of their rotors, but become strongly emissive when the rotor motions are restricted by the surroundings [
22,
28]. Moreover, the multi-rotor structures make AIEgens highly sensitive to their surroundings [
29,
30]. When further bearing a twisted donor–acceptor structure, the AIEgens can respond to microenvironmental changes with different color emissions due to the twisted intramolecular charge transfer (TICT) effect [
19,
29,
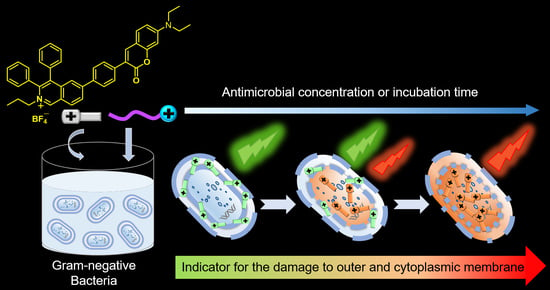
30]. These features make the AIEgens excellent candidates for visually monitoring the interaction of antimicrobials with Gram-negative bacterial OM and CM simultaneously. In this paper, a microenvironment-sensitive AIEgen, IQ-Cm, bearing a multi-rotor and twisted donor–acceptor structure, was employed to assess the antimicrobial-induced OM and CM disruption of Gram-negative bacteria by emitting two discernable colors, green and orange (
Scheme 1). Chemical-structurally, IQ-Cm was composed of a cationic isoquinolinium moiety and a coumarin unit. IQ-Cm was demonstrated to rapidly assess the antimicrobial activity of the three chosen representative membrane-active quaternary ammonium antimicrobials (
Scheme 1c). More importantly, the damaged extent of OM and CM caused by antimicrobials can be visually grasped based on the diverse emission responses of IQ-Cm to the different physiological states of Gram-negative bacteria, i.e., normal, OM-defective and CM-disruptive ones (
Scheme 1d).
2. Experimental Section
Materials: IQ-Cm was synthesized as reported previously [
19]. Propidium iodide (PI) and three cationic antimicrobials, hexadecyl trimethyl ammonium bromide (CTAB), dodecyl dimethyl benzyl ammonium bromide (DDBAB) and dodecyl trimethyl ammonium bromide (DTAB), were purchased from Thermo Fisher and TCI, respectively, and used as received. The Gram-negative bacterium
E. coli (JM109) was chosen as a representative. Phosphate-buffered saline (1× PBS, pH 7.4) was used throughout the work, unless otherwise noted.
Preparation of bacteria suspension: A single E. coli colony was added to 10 mL of Luria Broth (LB) culture, grown for 6–8 h under shaking (180–200 rpm) at 37 °C. E. coli was harvested by centrifugation at 7100 rpm for 2 min, washed once with PBS, and then re-dispersed in PBS. The optical density of the as-prepared E. coli suspension at 600 nm was adjusted to 1.0 (OD600 = 1.0) with PBS, which has about 108 CFU/mL of E. coli. For the preparation of the dead bacteria suspension, the harvested E. coli were treated with 200 µL of 75% alcohol solution for about 2–5 min, washed twice with PBS and re-suspended in PBS; it was kept on standby to determine the relationship of IQ-Cm emission intensity and dead bacteria number.
Evaluation of antimicrobial activity: The viability of
E. coli treated with three cationic antimicrobials was assessed with IQ-Cm (or PI) probe and traditional agar plate culture. The effect of IQ-Cm itself on the viability of
E. coli was evaluated by the traditional agar plate culture. IQ-Cm (or PI) probe method:
E. coli suspensions (~2 × 10
7 CFU/mL) were treated with different concentrations of antimicrobials in PBS at 37 °C for 30 min, and then directly incubated with 10 μM of IQ-Cm or 5 μg/mL of PI in PBS at room temperature. The corresponding fluorescence spectra were recorded on a spectrofluorometer (Perkin Elmer LS 55). The antimicrobial activity was calculated based on the equation [(
I −
I0)/(
Imax −
I0)] × 100, where
I is the fluorescence intensity of
E. coli suspensions with treatment of antimicrobials,
I0 is the fluorescence intensity of
E. coli suspensions without treatment (IQ-Cm at 600 nm or PI at 615 nm) and
Imax is the maximum achievable fluorescence intensity of the
E. coli suspensions with the treatment of different concentrations of antimicrobials. The traditional agar plate culture was conducted to calculate the corresponding antimicrobial activity according to reference [
31]: After
E. coli suspensions treated with different concentrations of antimicrobials in PBS at 37 °C for 30 min, the solutions were diluted by 10
4 times with PBS. Next, 100 μL of diluted
E. coli suspension was spread on LB agar plate and cultured at 37 °C for 14–16 h. The experiments were conducted in triplicate. The antimicrobial activity was calculated by the equation [(A − B)/A] × 100%, where A is the mean
E. coli colony number grown on LB agar plate in the control group without the antimicrobial treatment, and B is the mean
E. coli colony number grown on LB agar plate with the antimicrobial treatment. To determine MBC values, the curve of the antibacterial activity of the antimicrobials against their logarithm concentration was fitted by the function model DoseResp in the Growth/Sigmoidal category by software OriginPro 9.0.
Bacteria staining and imaging: To monitor the membranolytic action of antimicrobials on E. coli, the E. coli suspensions were treated with different concentrations of CTAB in PBS and then stained with IQ-Cm (10 μM) or PI (5 μg/mL) in PBS, as described in the evaluation of the antimicrobial activity experiments. Then, these E. coli suspensions were concentrated by centrifuging at 7100 rpm for 2 min. A total of 2 μL of the 10-times concentrated suspension was placed on the glass slide, covered with a coverslip, and then imaged on a fluorescence microscope with a ×100 oil lens (Upright Biological Microscope Ni-U). Imaging conditions for IQ-Cm: excitation filter = 460–490 nm, dichroic mirror = 505 nm, emission filter = 515 nm long pass; for PI: excitation filter = 510–550 nm, dichroic mirror = 570 nm, emission filter = 590 nm long pass. To monitor the membranolytic action of CTAB on E. coli under a different incubation time, similar procedures were followed with the fixed CTAB concentration of 20 μM and varied incubation time with E. coli.
Scanning electron microscopy (SEM): The morphological change of
E. coli with the antimicrobial treatment was observed by SEM (Carl Zeiss GeminiSEM 300, Jena, Germany), referring to the literature [
32].
E. coli suspensions (~2 × 10
7 CFU/mL) were treated with different concentrations of CTAB in PBS at 37 °C for 30 min, and then 0.5% glutaraldehyde PBS solution was added to fix the
E. coli for about 30 min. After centrifuging to remove the supernatant, 50 μL of sterile water was added to disperse the remaining
E. coli. A total of 5 μL of
E. coli suspension was transferred to a silicon slice, dried naturally, and then fixed with 0.1% glutaraldehyde overnight. Next, the
E. coli sample was washed with sterile water and then gradient-dehydrated with an ethanol solution with volume fractions of 60%, 70%, 90% and 100%, respectively. After vacuum drying, the as-prepared samples were sprayed with platinum prior to observation.
3. Results and Discussion
Escherichia coli (
E. coli), one of the most representative Gram-negative species, was chosen for demonstration. After being incubated with IQ-Cm,
E. coli in three physiological states were observed with three cases in the fluorescence field of the fluorescence microscope. As shown in
Figure 1a,
E. coli exhibit orange, green and weak/negligible emissions after being stained with IQ-Cm as compared to the bright filed image. Propidium iodide (PI) is a probe that only enters the dead bacteria with impaired CM and emits a red fluorescence [
33]. Co-staining with PI, the red emission of PI was found only in the orange-colored
E. coli, suggesting the orange-colored
E. coli are dead with destroyed CM. Vice versa,
E. coli with green or negligible emissions are alive. This observation is consistent with our previous work [
19]. IQ-Cm cannot stain healthy
E. coli due to the barrier function of OM and has a dim emission [
34]. Once their OM becomes defective, IQ-Cm is allowed to be inserted into the low-polarity lipid membrane of
E. coli and emits a green fluorescence [
35]. Additionally, when their CM is further destroyed, IQ-Cm is located in the cytoplasm with a large polar surrounding and emits a red-shift orange fluorescence based on the TICT effect [
36]. These distinctive fluorescence responses of IQ-Cm to the three states of
E. coli favor the monitoring of the antimicrobial-induced bacterial membrane damage and make it suitable for the bacterial viability assay. To verify it, IQ-Cm was incubated with live and dead
E. coli and their fluorescence spectra were recorded (
Figure 1b). A weak emission was observed for live
E. coli and a boosted orange emission with a maximum at about 600 nm was observed for dead
E. coli killed with 75% alcohol, which was also verified with the in situ fluorescence spectrum under a confocal microscope (
Figure S1). The fluorescence intensity of IQ-Cm shows a linear relationship with the amount of dead
E. coli (R
2 = 0.97) (
Figure 1c). Additionally, IQ-Cm shows negligible toxicity to
E. coli, where over 97% of bacterial viability is retained after being incubated with IQ-Cm at a concentration of up to 10 μM and still 90% at 20 μM (
Figure 1d). These properties of IQ-Cm are desired as a probe for assessing the activity of membrane-active antimicrobials and visualizing their interaction with OM and CM of Gram-negative bacteria, which will be discussed in the following.
Further IQ-Cm were used to assess the activity of membrane-active antimicrobials. Three commercial amphiphilic antimicrobials, i.e., hexadecyl trimethyl ammonium bromide (CTAB), dodecyl dimethyl benzyl ammonium bromide (DDBAB) and dodecyl trimethyl ammonium bromide (DTAB), which have different quaternary ammonium head groups and alkyl chain lengths and thus exert different antimicrobial potency, were chosen as representatives (
Scheme 1c). Membrane-active antimicrobials kill Gram-negative bacteria by damaging OM and CM [
4,
37]. This opens the access of IQ-Cm to the bacterial cytoplasm, giving rise to the orange emission.
E. coli were treated with different concentrations of antimicrobials for 30 min, followed by the staining of IQ-Cm. As shown in
Figure 2a–c, the emission intensity of IQ-Cm gradually increases with the increasing concentration of antimicrobials. The emission intensity of IQ-Cm reaches its maximum at a concentration of up to 30 µM for CTAB, 30 µM for DDBAB and 200 µM for DTAB, respectively, suggesting all
E. coli are almost killed. Meanwhile, it was found that antimicrobials alone do not cause an obvious change in emission of IQ-Cm (
Figure S2). Given the linear relationship of fluorescence intensity of IQ-Cm with the dead
E. coli concentration (
Figure 1c), the killing efficiency of antimicrobials at various concentrations can be calculated by the equation [(
I −
I0)/(
Imax −
I0)] × 100%, where
I is the fluorescence intensity of
E. coli treated with antimicrobials,
Imax is the achievable maximum intensity of
E. coli treated with antimicrobials and
I0 is the intensity of the control
E. coli group without antimicrobials. Minimal bactericidal concentration (MBC), an important parameter describing the antimicrobial effectiveness, can be easily determined from the plots in
Figure 2d–f for the three antimicrobials. Their MBC
90 (the concentration of the antimicrobials to kill 90% of the bacteria) were evaluated as 14.3, 29.7 and 91.4 µM for CTAB, DDBAB and DTAB against
E. coli, respectively. The traditional agar plate culture, a standard method, was performed, which shows very similar MBC
90 results of 14.8, 27.1 and 94.9 µM for CTAB, DDBAB and DTAB, respectively (
Figure 2g–i). In contrast, PI, the standard dead cell probe, had a MBC
90 value of 25.8 µM for CTAB against
E. coli (
Figure S3), which is greatly deviated from the traditional agar plate culture method (14.8 µM). These results fully confirm the reliability of IQ-Cm for the activity assessment of membrane-active antimicrobials. Moreover, this fluorescence method is simple and timesaving with only 1~2 h needed, while the agar plate culture needs skilled plating and 24 h to show results.
To monitor the membranolytic action of antimicrobials on Gram-negative bacterial OM and CM, the fluorescence images of
E. coli treated with different concentrations of CTAB and then stained with IQ-Cm were taken under a fluorescence microscope. As shown in
Figure 3a, the emission color and location sites of IQ-Cm in bacteria depend on the CTAB concentration. In the control group without CTAB,
E. coli show a negligible emission because of the barrier of the intact OM. After the addition of CTAB, the staining rate of
E. coli with green or orange emission increases with increasing the CTAB concentration, which is 50% for 6 µM, 80% for 8 µM, 99% for 12 µM and 100% for >15 µM of CTAB (
Figure 3a,b). This indicates that CTAB compromises the membrane integrity of
E. coli, allowing IQ-Cm to be inserted into the bacterial membrane of OM-defective
E. coli or further accumulate in the cytoplasm of CM-disruptive
E. coli. As a result,
E. coli show green or orange fluorescence. The proportion of two colors was also found to rely on the CTAB concentration (
Figure 3a), which reflects the extent of bacterial OM and CM disrupted by CTAB. At the low concentration of less than 8 µM, IQ-Cm-stained
E. coli mainly show green emission (
Figure 3a) and the ratio of green emission (530 nm) and orange emission (600 nm) is below 1.0 (
Figure 3c). A total of 6 µM of CTAB, as an example, killed less than 20% of
E. coli, which is much lower than the 50% staining rate of
E. coli by IQ-Cm (
Figure 3b). These results reveal that, at low concentrations, CTAB primarily compromises the physical integrity of Gram-negative bacteria OM, presumably due to the electrostatic interactions of quaternary ammonium of CTAB with the LPS on the OM of
E. coli [
4,
15].
As the CTAB concentration increased to 8~15 µM, clearly most of IQ-Cm-stained
E. coli exhibit green emission from their cell membrane and orange emission from their cytoplasm (
Figure 3a). This means that a higher concentration of CTAB increases the permeability of both OM and CM of
E. coli. Consequently, IQ-Cm could insert into the cell membrane and enter the cytoplasm of
E. coli to have green and orange emissions. However, at this concentration range, the killing activity of CTAB against
E. coli is still lower than the staining rate of
E. coli by IQ-Cm (
Figure 3b). This can be explained by the existence of the case where CTAB slightly affects the CM of
E. coli without leading to a lethal event, as confirmed by the existence of green
E. coli with faint orange fluorescence (
Figure 3a).
Upon further increasing the CTAB concentration to more than 15 µM, the killing activity of CTAB against
E. coli almost coincides with the staining rate of
E. coli by IQ-Cm, close to the unity (
Figure 3b). Almost all
E. coli show a prominent orange emission (
Figure 3a) with the ratio of intensities at 600 nm and 530 nm larger than 1 (
Figure 3c). The SEM images show that the
E. coli obviously collapse after being treated with this concentration range of CTAB, compared with the intact structures in control groups without CTAB treatment (
Figure S4). Furthermore, after being treated with 100 µM of CTAB, the all-stained
E. coli show an orange emission. This means that at high concentrations of >15 µM, CTAB significantly disrupts the OM and CM of
E. coli.
In contrast, the conventional PI probe has a much lower staining rate of
E. coli than that by IQ-Cm (
Figure 3b,d), because PI cannot respond to OM changes and only has a red emission when allowed to penetrate into the microbe to bind with cytoplasm DNA [
33]. In addition, the staining rate of
E. coli by PI is also lower than the killing activity of CTAB against
E. coli at the concentration below 20 µM (
Figure 3b), leading to the above-mentioned higher MBC
90 value assessed by the PI probe.
These fluorescence imaging results fully confirm that IQ-Cm as an indicator enables us to visualize the interactions of CTAB with the OM and CM of Gram-negative bacteria. It was revealed that CTAB interacts with the OM and CM of Gram-negative bacteria in a dose-dependent manner. At a low concentration, CTAB primarily compromises the OM of E. coli. At a medium concentration, additional CTAB further interact with the CM of E. coli and disrupts the CM of some E. coli, making CTAB exhibit mediate antimicrobial activity. At high concentrations, sufficient CTAB significantly disrupts both the OM and CM, thereby showing high killing activity against E. coli.
Furthermore, IQ-Cm was used to monitor the time course of membrane disruption of Gram-negative bacteria induced by membrane-active antimicrobials. We chose a CTAB concentration of 20 µM with the killing activity of 99.5% as an example. As shown in
Figure 4a, after incubated with CTAB for less than 20 min and then stained by IQ-Cm, some
E. coli exhibit green or green with faint orange, and the staining rate of
E. coli by IQ-Cm is obviously larger than that by PI (
Figure 4b and
Figure S5). This means CTAB initially disrupts the OM integrity of
E. coli and short incubation time is not sufficient for CTAB to fully destroy the CM of
E. coli. Upon extending the incubation time to 25 and 30 min, the cytoplasm of
E. coli was almost all found to emit predominant orange fluorescence (
Figure 4a). The staining efficiency of PI for
E. coli is gradually closer to that of IQ-Cm (
Figure 4b). These results suggest that 25 or 30 min of incubation time is required for 20 µM of CTAB to compromise the OM and CM of
E. coli and thus sufficiently exert the antimicrobial activity. Above all, IQ-Cm was demonstrated to be highly suitable for visualizing the interaction of membrane-active antimicrobials with the OM and CM of Gram-negative bacteria.


