
Determination of Ascorbic Acid in Pharmaceuticals and Food Supplements with the New Potassium Ferrocyanide-Doped Polypyrrole-Modified Platinum Electrode Sensor


Abstract
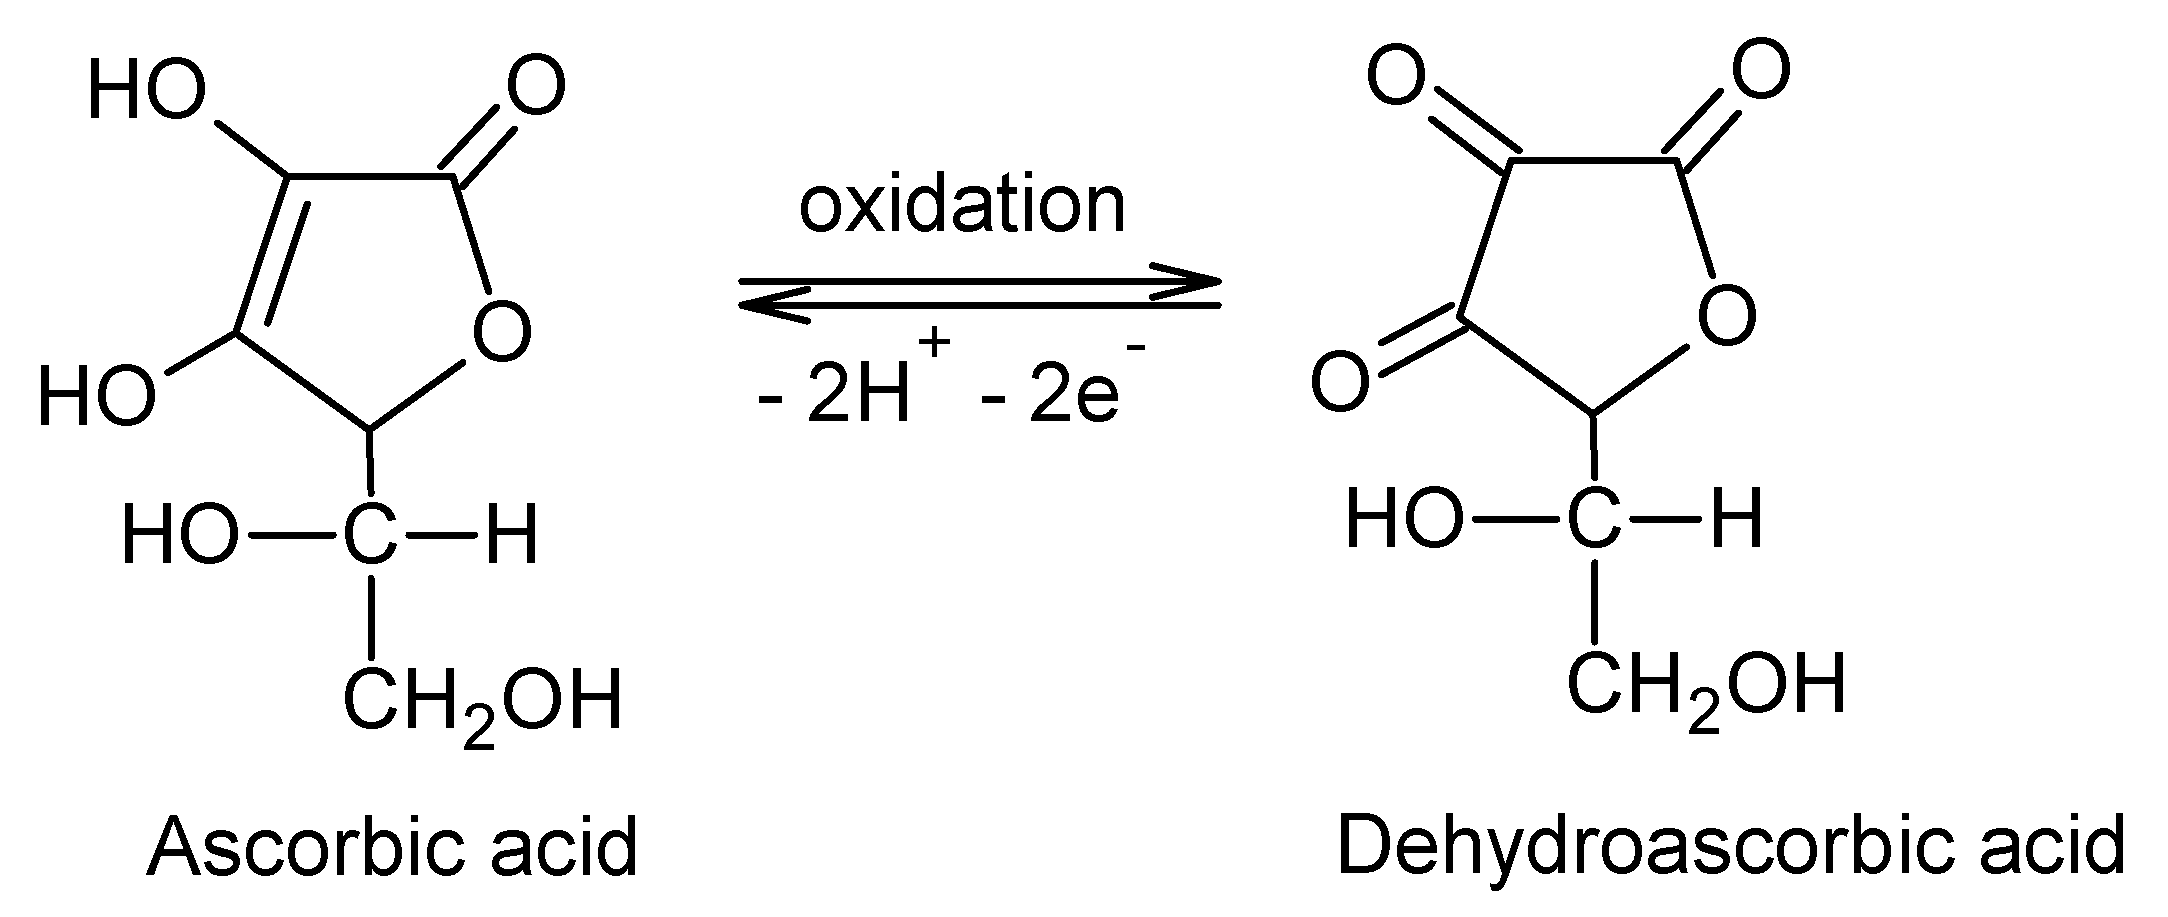
:1. Introduction
2. Materials and Methods
2.1. Chemicals and Solutions
2.2. Real Samples
2.3. Equipment and Software
2.4. Analytical Methods
3. Results and Discussions
3.1. Modification of Platinum Electrodes by Electropolymerization
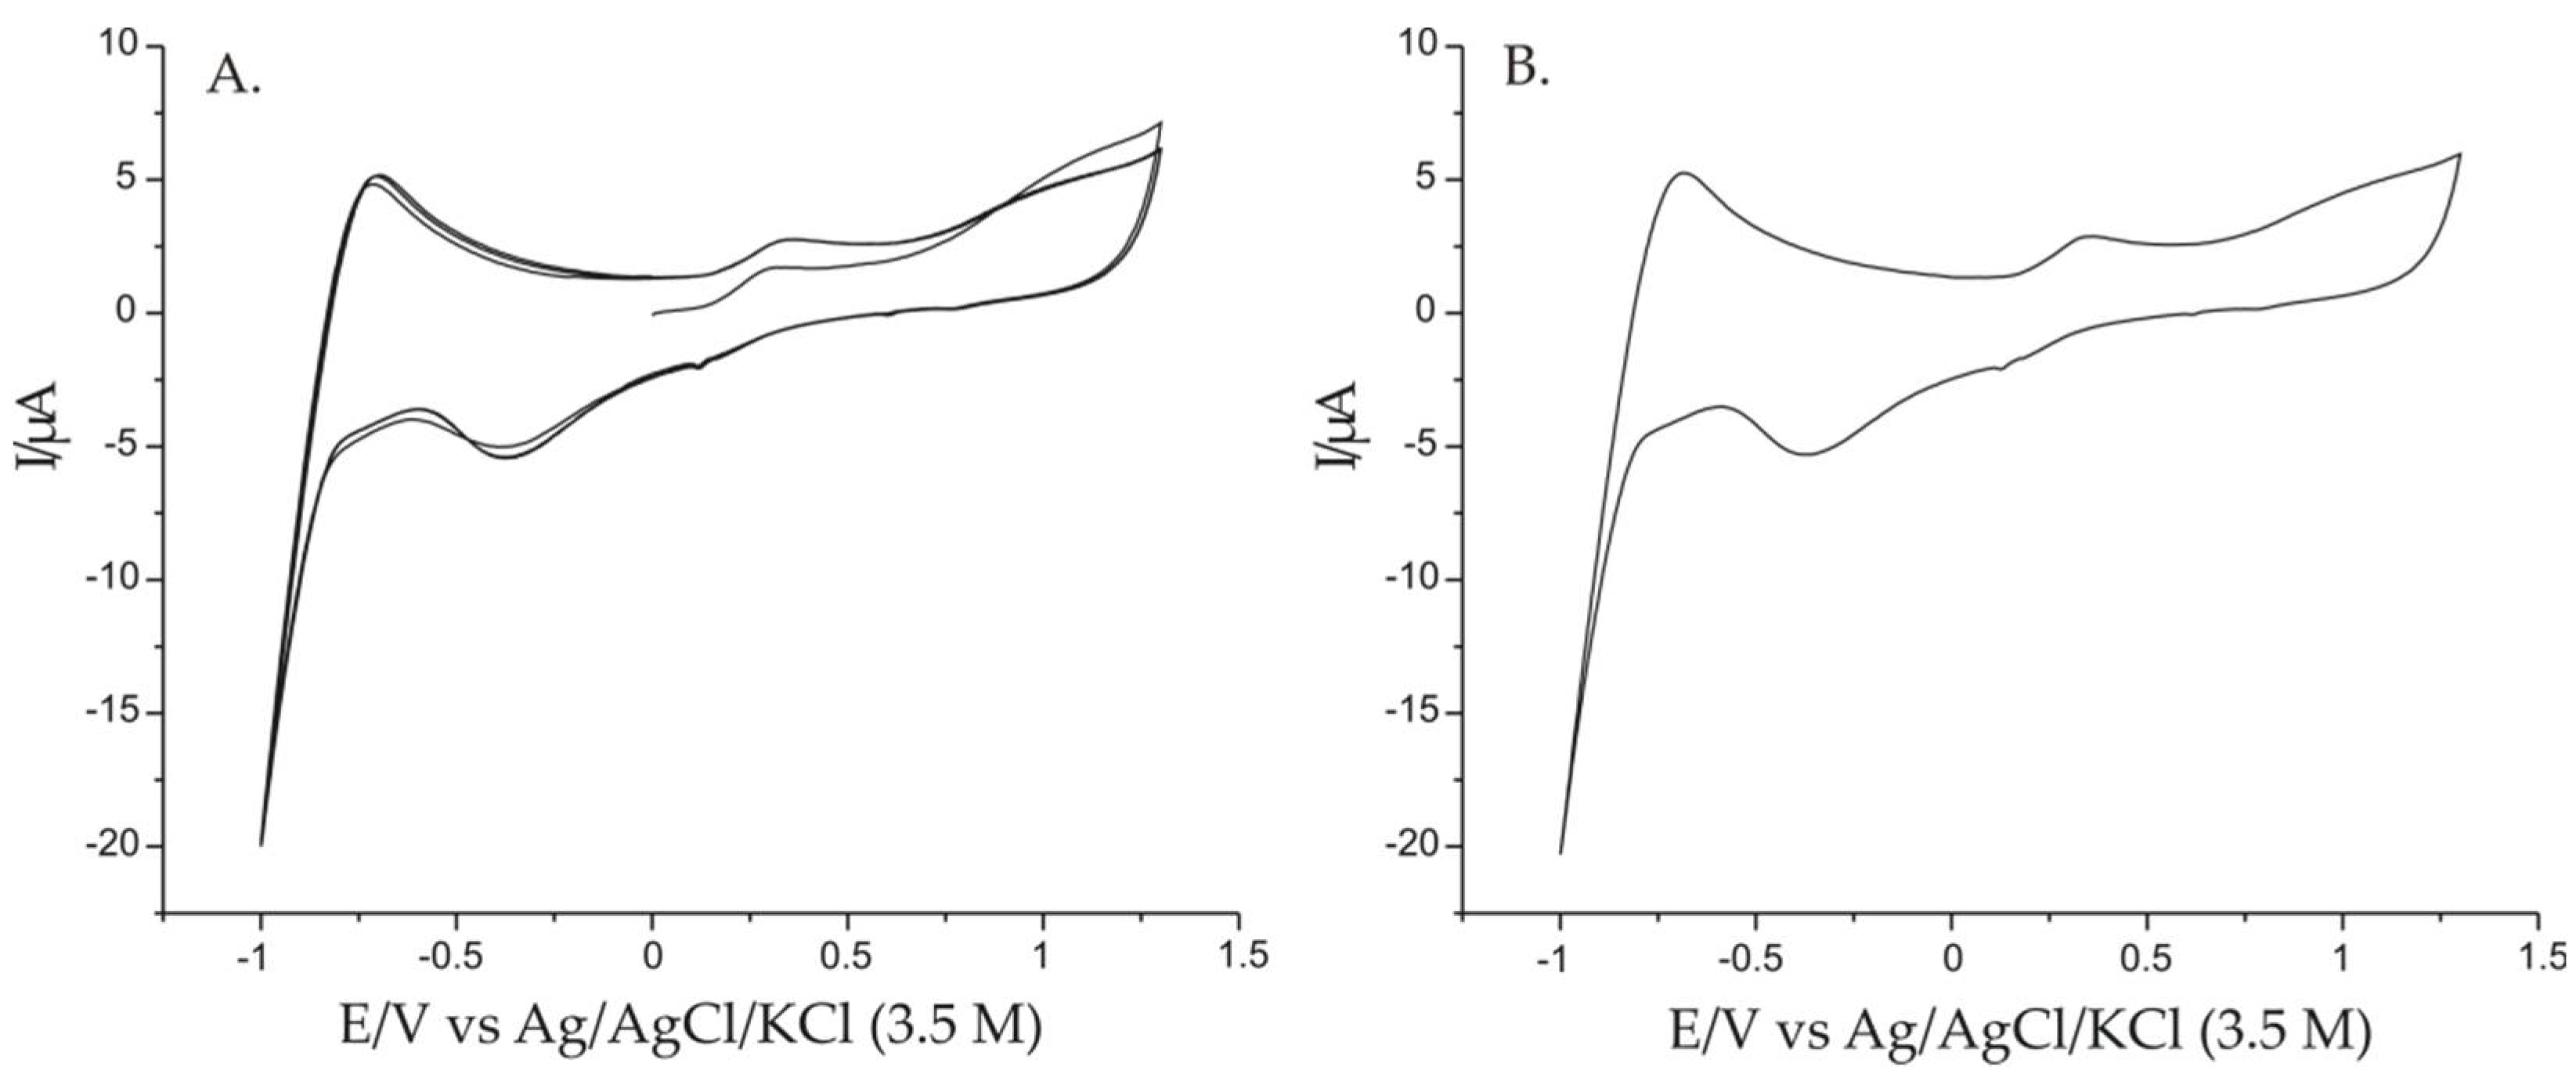
3.2. Electrochemical Responses of Pt/PPy/FeCN Immersed in 0.001 M AAs-0.1 M KCl Double Solution
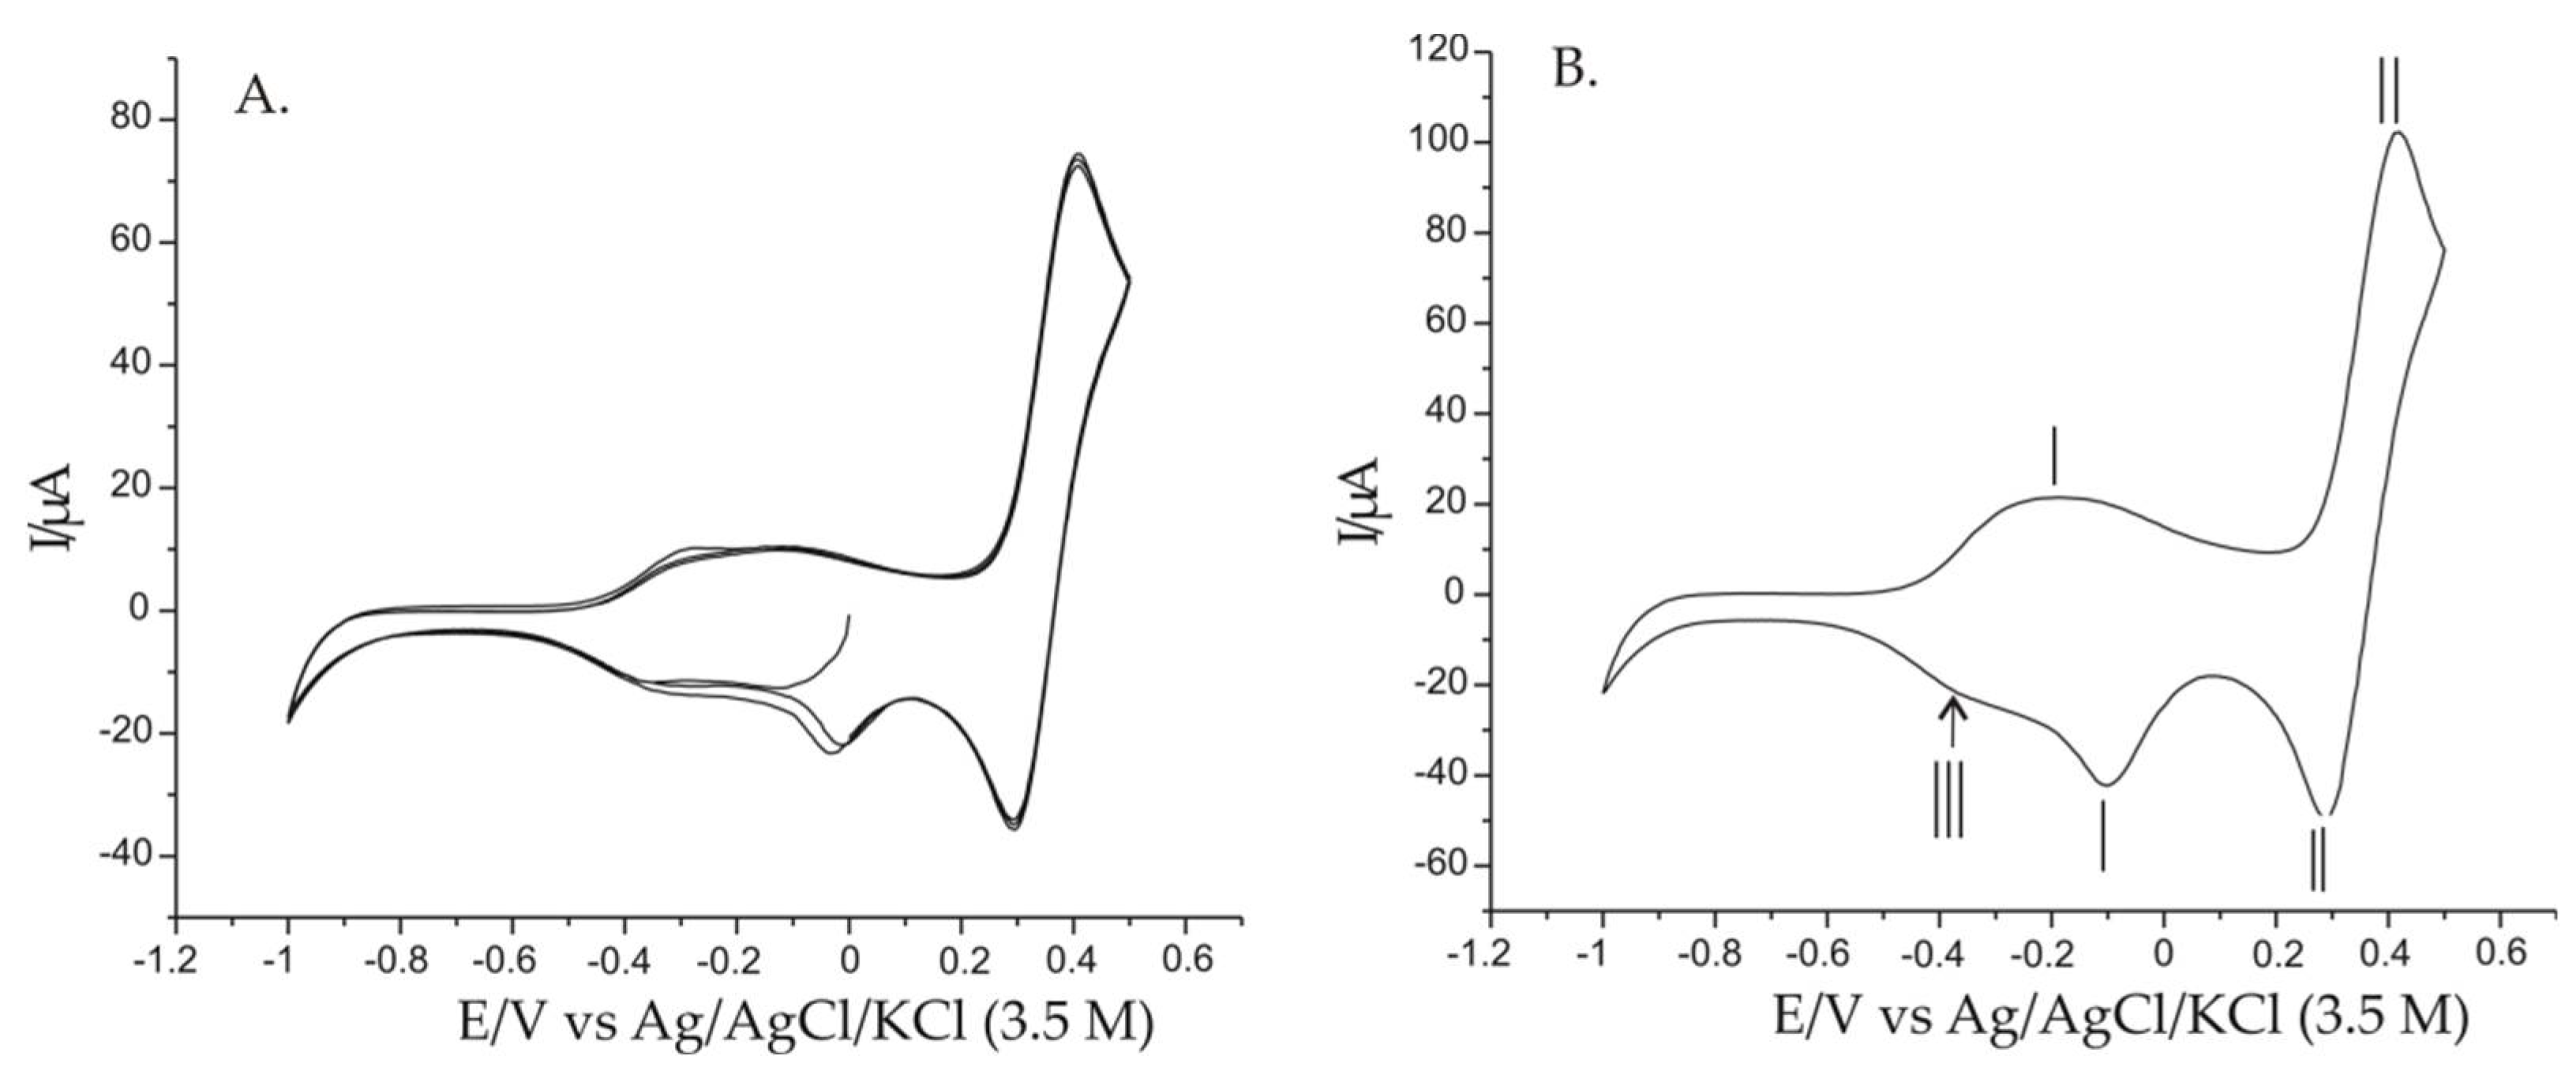
3.3. Stable Electrochemical Response and Behavior of Modified Electrodes Immersed in 0.001 M K4[Fe(CN)6]-0.1 M KCl Double Solution
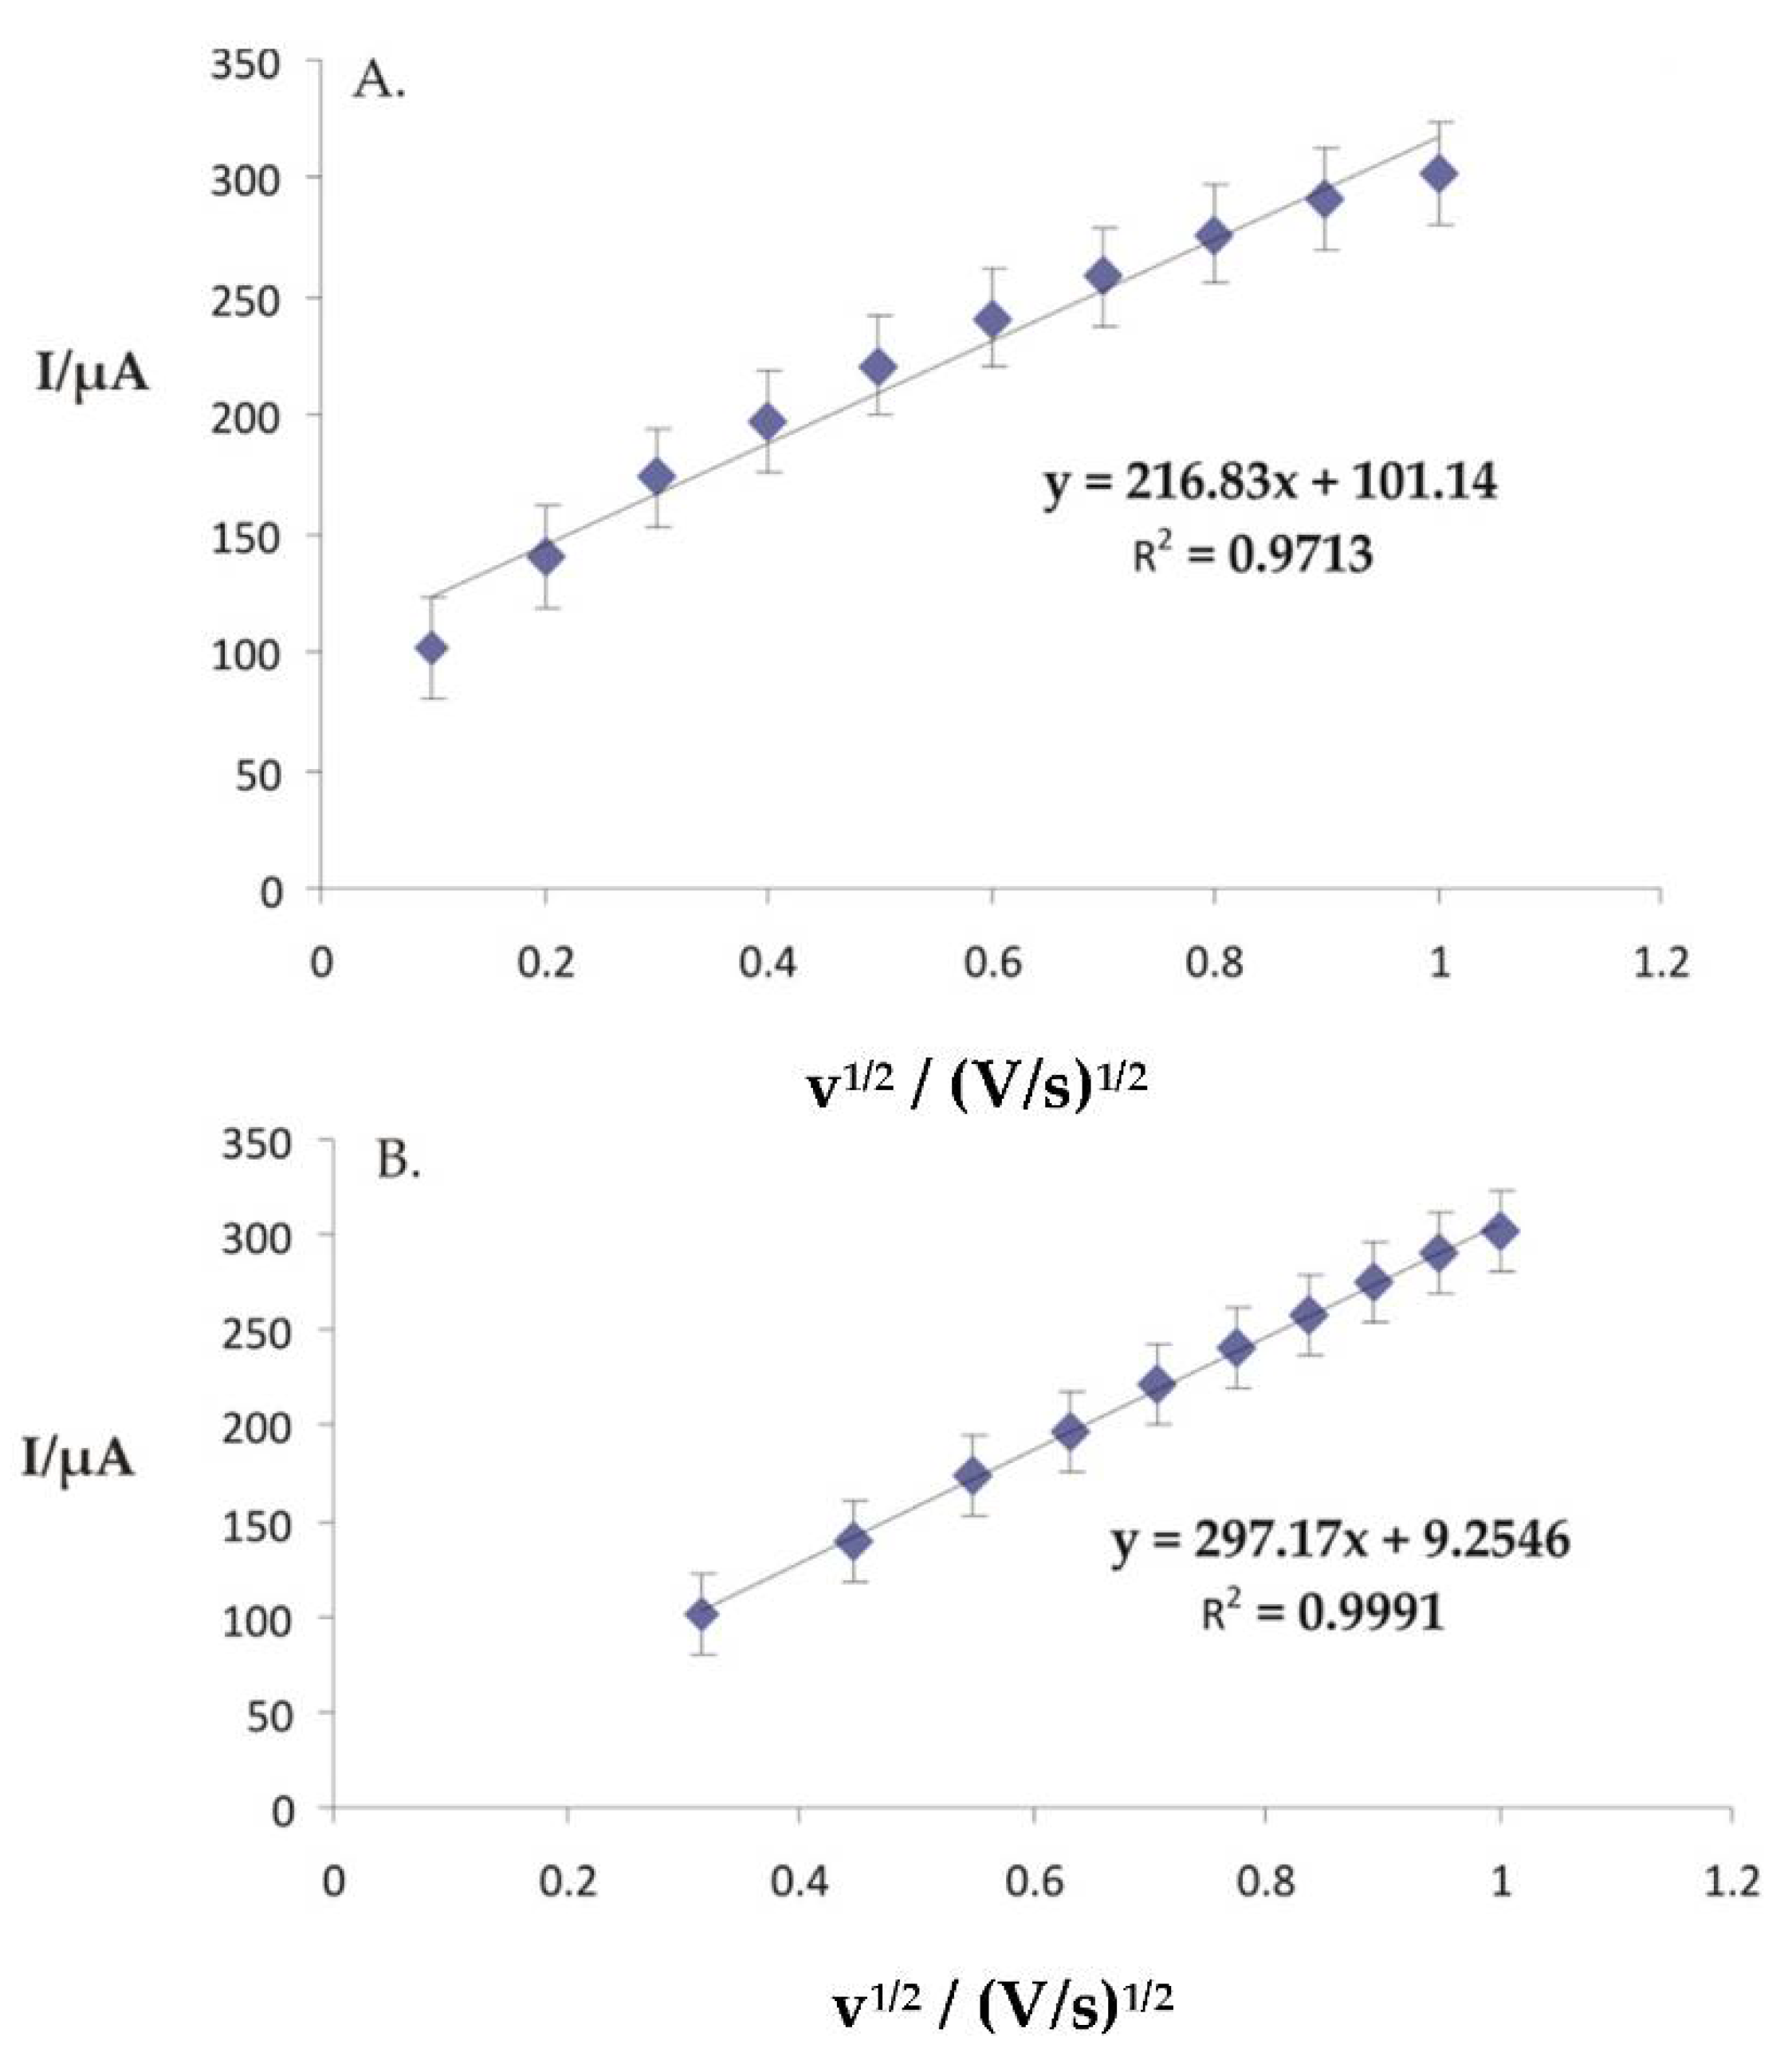
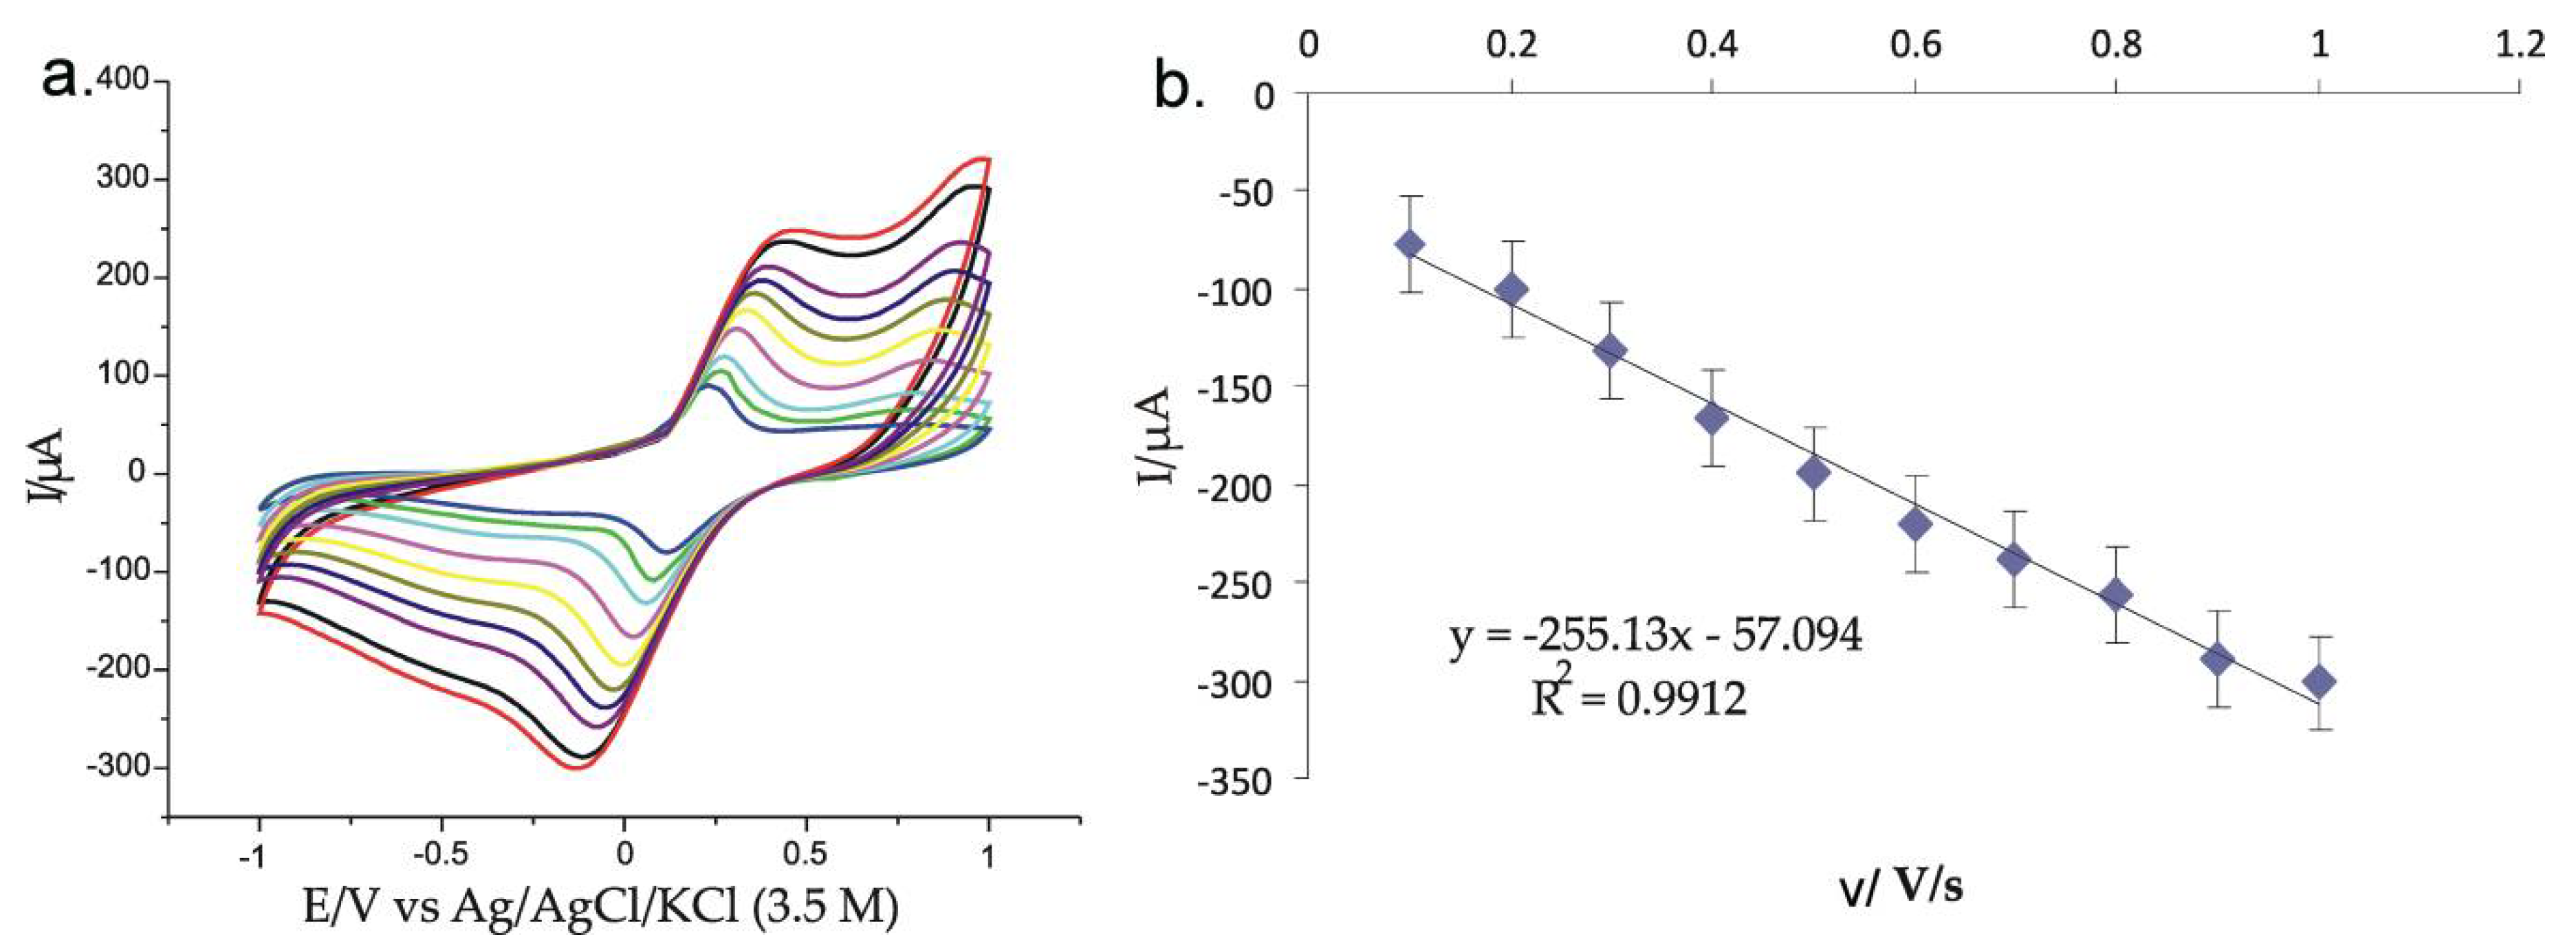
3.4. Influence of Scanning Rate of the Modified Electrodes Immersed in 0.001 M K4[Fe(CN)6]-0.1 M KCl Double Solution
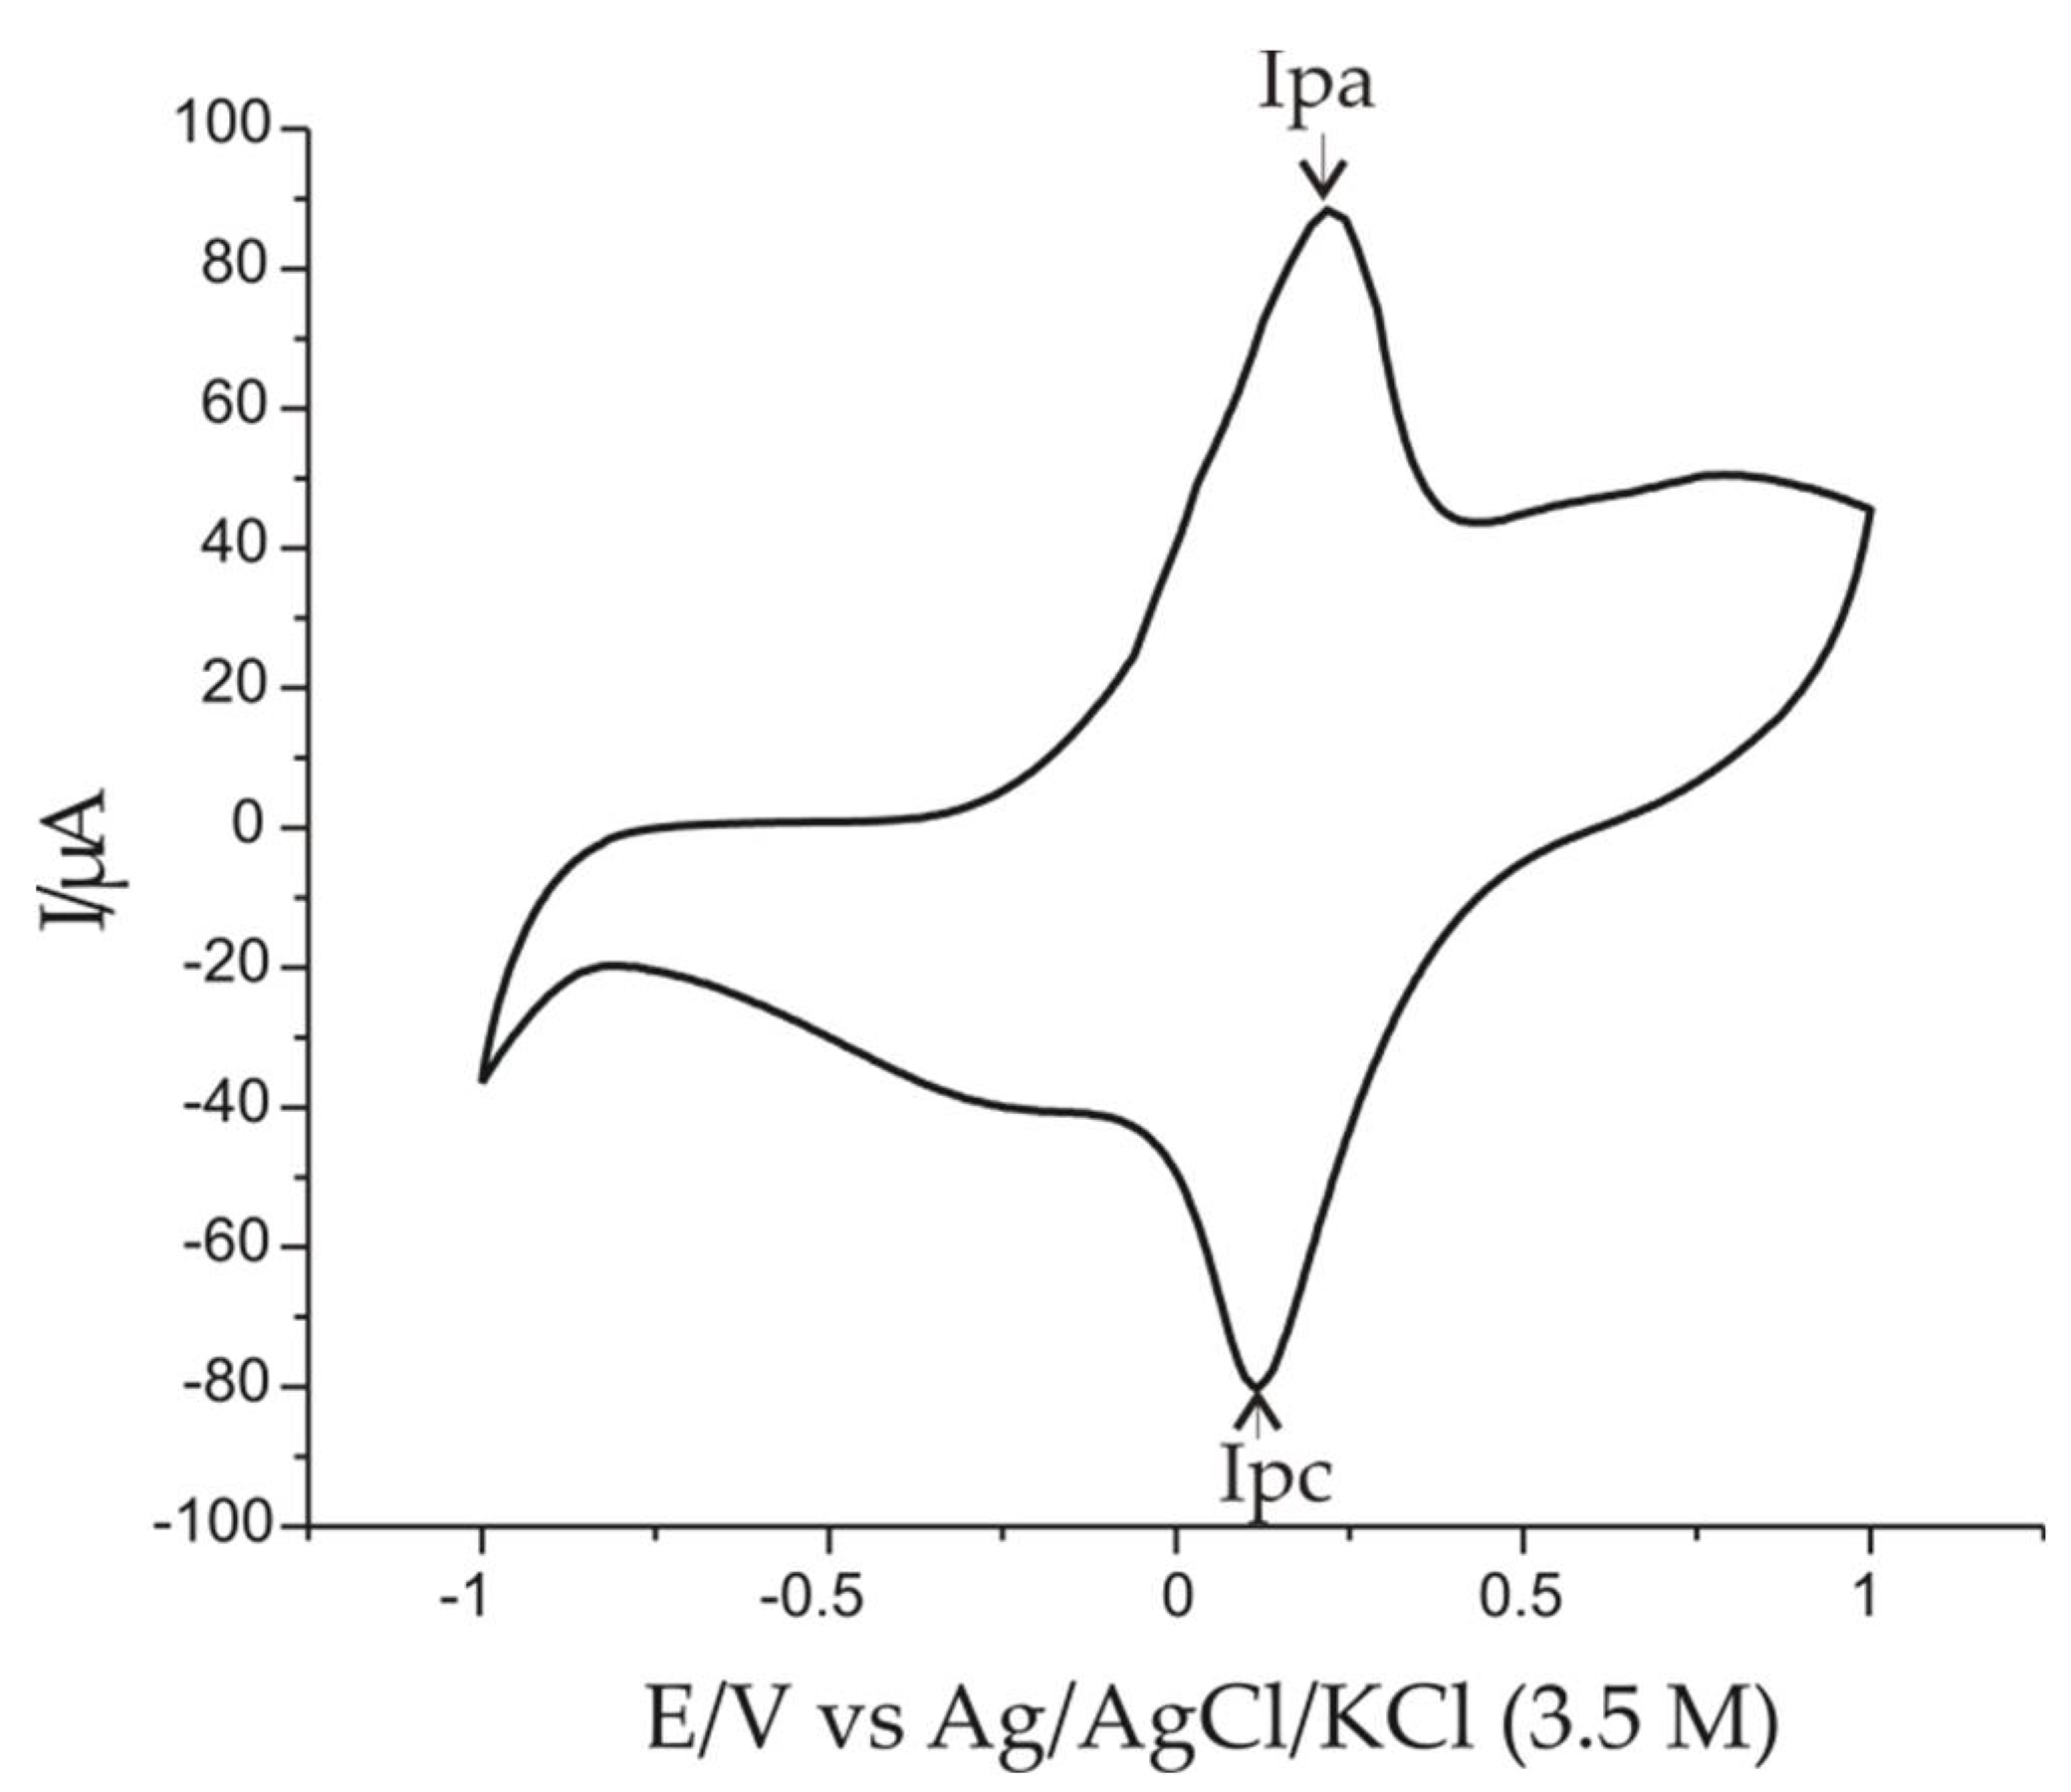
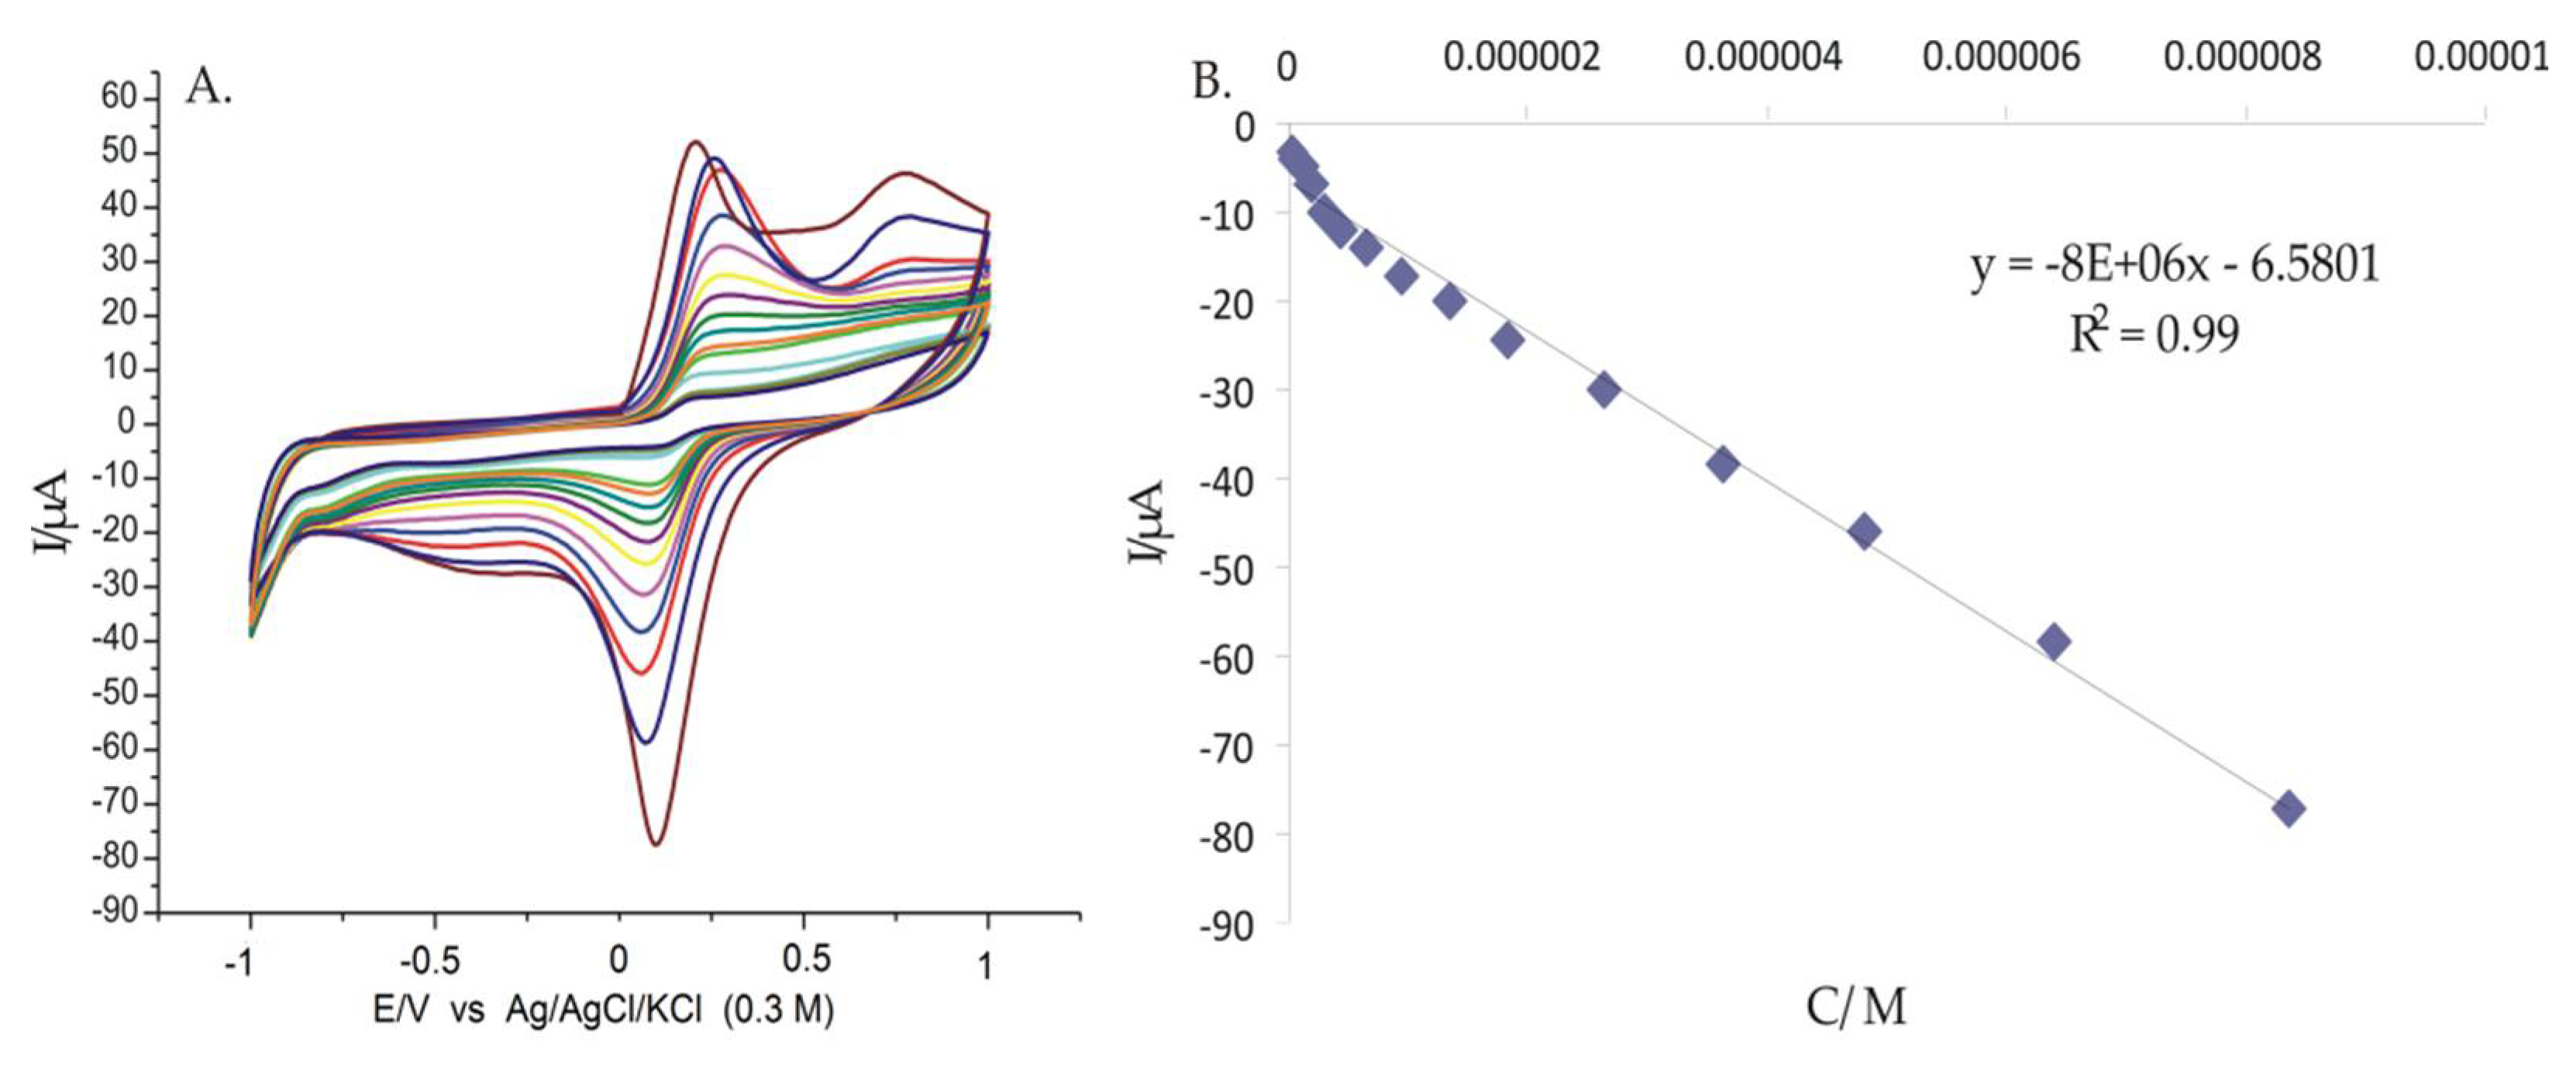
3.5. Electrochemical Responses of Modified Electrodes Immersed in 0.001 M AAs-0.1 M KCl Double Solution and the Influence of Scan Rate on Sensor Response
3.6. Pt/PPy-FeCN/AAs Sensor Calibration Curve and Detection Limit
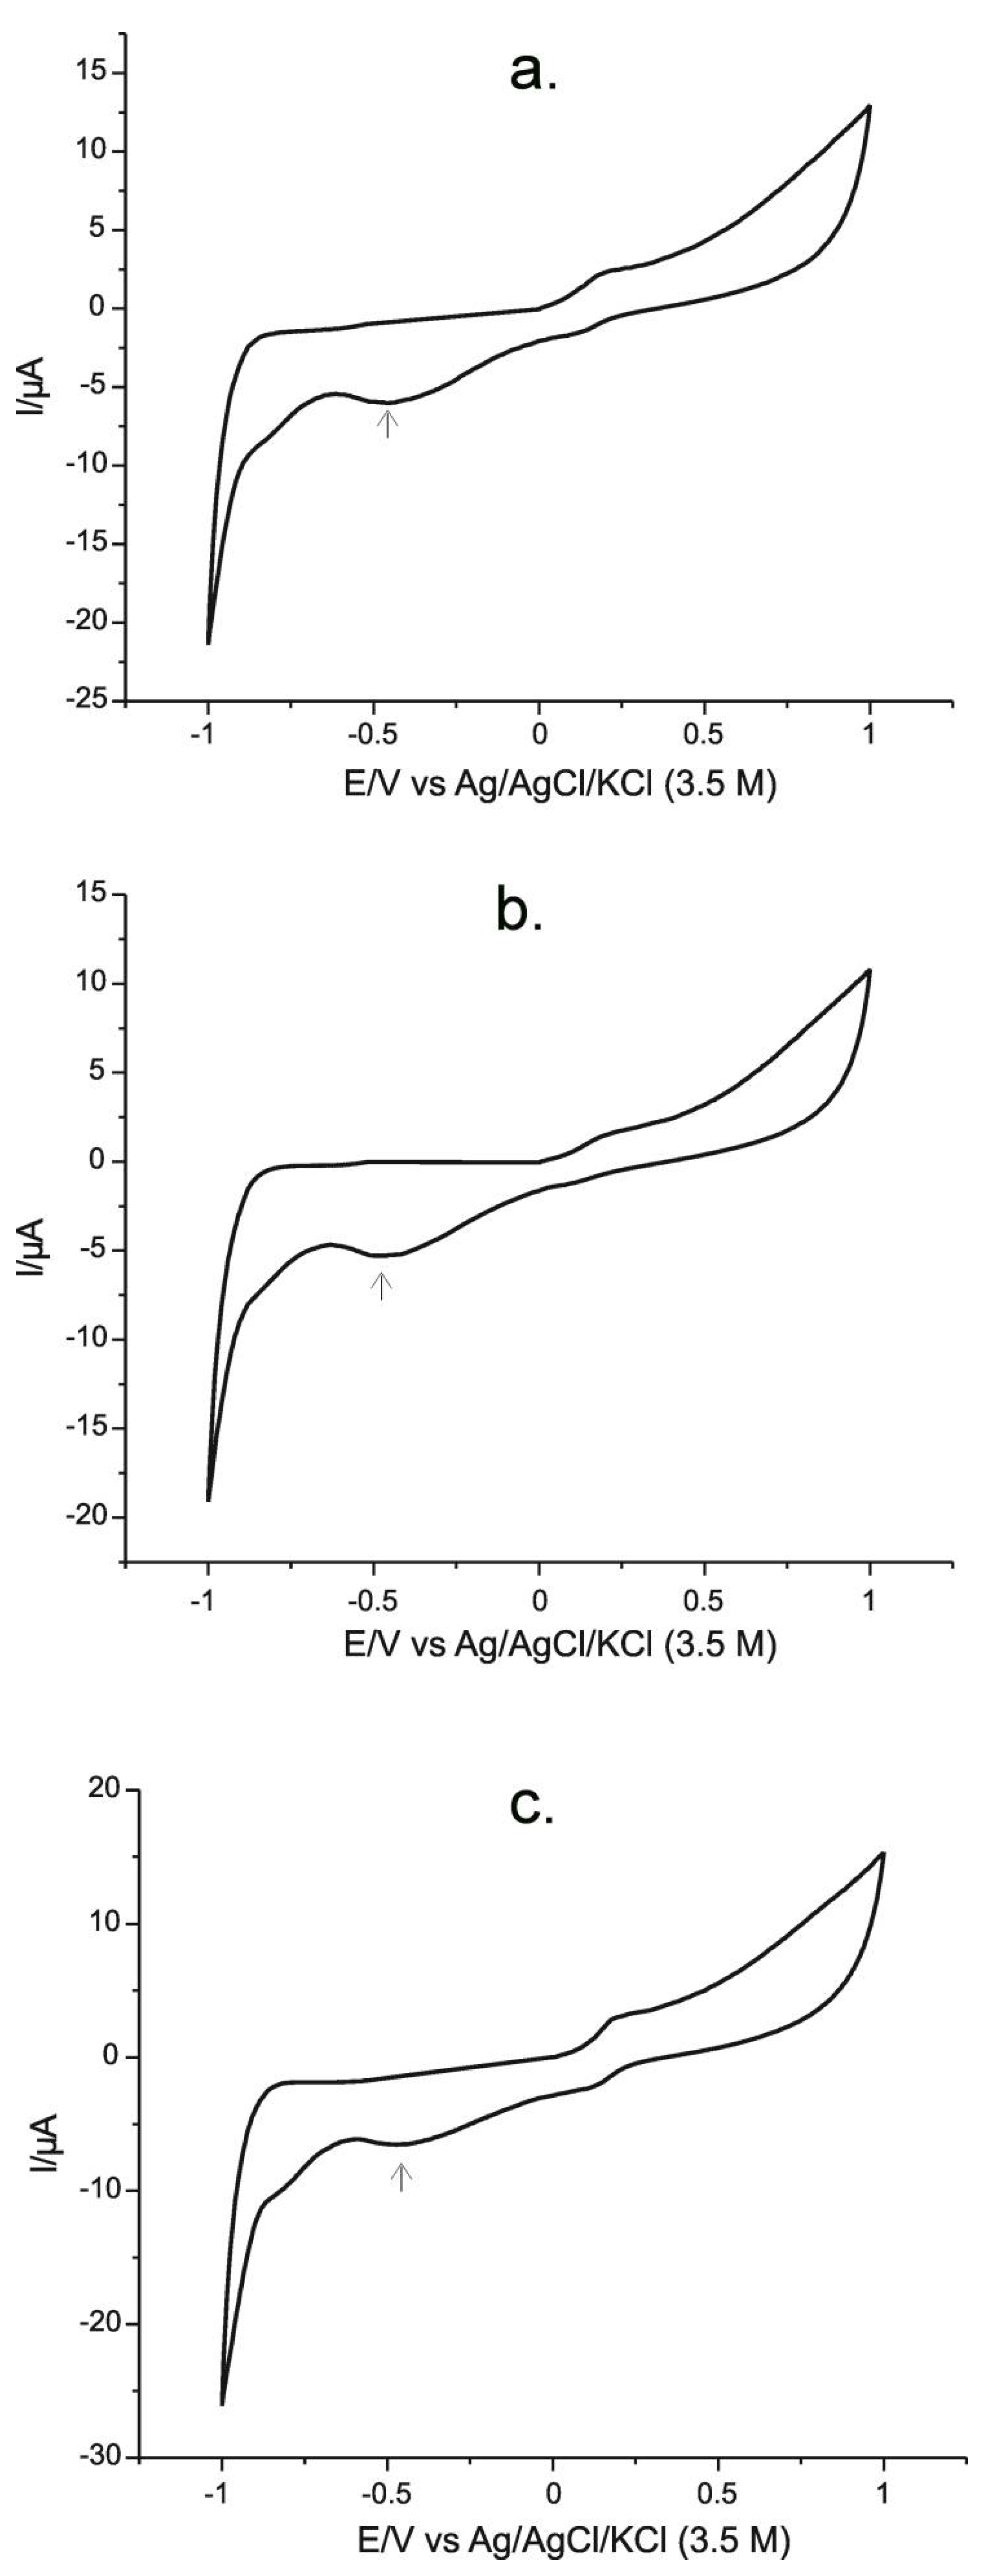
3.7. Quantitative Determination of AAs in Pharmaceutical Samples with a Pt/PPy-FeCN Sensor
4. Conclusions
Author Contributions
Funding
Institutional Review Board Statement
Informed Consent Statement
Data Availability Statement
Conflicts of Interest
References
- Berger, Z.; Berger Salinas, A.; Szánthó Pongrácz, G. La vitamina C y algo más: Un premio Nobel poco conocido en Chile. Rev. Méd. Chile 2015, 143, 1065–1069. [Google Scholar] [CrossRef] [Green Version]
- Pan, P.; Wu, S.G. Direct Determination of Ascorbic Acid in Fruits and Vegetables by Positive Scan Polarization Reverse Catalytic Voltammetry. Chin. J. Anal. Chem. 2019, 47, e19088–e19094. [Google Scholar] [CrossRef]
- Gonzalez, M.J.; Berdiel, M.; Duconge, J.; Levy Th, A.I.; Morales-Borges, R. High dose vitamin C and influenza: A case report. J. Orthomol. Med. 2018, 33, 3. [Google Scholar]
- Jalalvand, A.R. Four-dimensional voltammetry: An efficient strategy for simultaneous determination of ascorbic acid and uric acid in the presence of dopamine as uncalibrated interference. Sens. Bio-Sens. Res. 2020, 28, 100330. [Google Scholar] [CrossRef]
- Granero, A.M.; Pierini, G.D.; Robledo, S.N.; Di Nezio, M.S.; Fernández, H.; Zon, M.A. Simultaneous determination of ascorbic and uric acids and dopamine in human serum samples using three-way calibration with data from square wave voltammetry. Microchem. J. 2016, 129, 205–212. [Google Scholar] [CrossRef]
- Ang, K.B.A.; Lee, C.M.; Yu, H.M.O.; Uy, M.; Soriano, A.N.; Dugos, N.P. Determination of Diffusion Coefficients and Antioxidant Activities of Ascorbic Acid in Guava Juice using Cyclic Voltammetry. In IOP Conference Series: Materials Science and Engineering; IOP Publishing: Bristol, UK, 2020; Volume 778, p. 012037. [Google Scholar] [CrossRef]
- Soltani, N.; Ebrahimian, J.; Khayatkashani, M.; Tavakkoli, N.; Salavati-Niasari, M. Salvia officinalis extract mediated for the synthesis of SO-MgO-NPs and their utilization for simultaneous measurement of dopamine, uric acid, and ascorbic acid by voltammetry method. J. Mol. Liq. 2021, 341, 116932. [Google Scholar] [CrossRef]
- Deved, V.; Poyah, P.; James, M.T.; Tonelli, M.; Manns, B.J.; Walsh, M.; Hemmelgarn, B.R. Ascorbic Acid for Anemia Management in Hemodialysis Patients: A Systematic Review and Meta-analysis. Am. J. Kidney Dis. 2009, 54, 1089–1097. [Google Scholar] [CrossRef] [Green Version]
- Ravetti, S.; Clemente, C.; Brignone, S.; Hergert, L.; Allemandi, D.; Palma, S. Ascorbic Acid in Skyn Health. Cosmetics 2019, 6, 58. [Google Scholar] [CrossRef] [Green Version]
- Hujoel, P.P.; Kato, T.; Hujoel, I.A.; Hujoel, M.L.A. Bleeding tendency and ascorbic acid requirements: Systematic review and meta-analysis of clinical trials. Nutr. Rev. 2021, 79, 964–975. [Google Scholar] [CrossRef]
- Jing, L.; En-bo, S.; Quan-min, L. The Influencing Mechanism of Acidity on the Oxidation Peak Currents of Uric Acid and Ascorbic Acid at the PACPE by Cyclic Voltammetry. J. Chin. Chem. Soc. 2015, 62, 263–272. [Google Scholar] [CrossRef]
- Kohlmeier, M.; Vitamin, C. Nutrient Metabolism; Elsevier: Amsterdam, The Netherlands, 2003; pp. 542–551. ISBN 978-0-12-417762-8. [Google Scholar]
- Ji, D.; Liu, Z.; Liu, L.; Low, S.S.; Lu, Y.; Yu, X.; Zhu, L.; Li, C.; Liu, Q. Smartphone-based integrated voltammetry system for simultaneous detection of ascorbic acid, dopamine, and uric acid with graphene and gold nanoparticles modified screen-printed electrodes. Biosens. Bioelectron. 2018, 119, 55–62. [Google Scholar] [CrossRef]
- Yang, G.; Li, L.; Jiang, J.; Yang, Y. Direct electrodeposition of gold nanotube arrays of rough and porous wall by cyclic voltammetry and its applications of simultaneous determination of ascorbic acid and uric acid. Mater. Sci. Eng. C 2012, 32, 1323–1330. [Google Scholar] [CrossRef]
- Al Sulaiman, K.; Aljuhani, O.; Saleh, K.B.; Badreldin, H.A.; Al Harthi, A.; Alenazi, M.; Alharbi, A.; Algarni, R.; Al Harbi, S.; Alhammad, A.M.; et al. Ascorbic acid as an adjunctive therapy in critically ill patients with COVID-19: A propensity score matched study. Sci. Rep. 2021, 11, 17648. [Google Scholar] [CrossRef]
- Patel, M.; Hong, G.; Schmidt, B.; Al-janabi, L.; Adusumilli, R.K.; Tusha, J.; Giri, P.; Kumar, S. The Significance of Oral Ascorbic Acid in Patients with COVID-19. Chest 2020, 158, A325. [Google Scholar] [CrossRef]
- Coppock, D.; Violet, P.C.; Vasquez, G.; Belden, K.; Foster, M.; Mullin, B.; Magee, D.; Mikell, I.; Shah, L.; Powers, V.; et al. Pharmacologic Ascorbic Acid as Early Therapy for Hospitalized Patients with COVID-19: A Randomized Clinical Trial. Life 2022, 12, 453. [Google Scholar] [CrossRef]
- Rossetti, C.A.; Real, J.P.; Palma, S.D. High dose of ascorbic acid used in SARS Covid-19 treatment: Scientific and clinical support for its therapeutic implementation. ARS Pharm. 2020, 61, 145–148. [Google Scholar]
- Shaidarova, L.G.; Chelnokova, I.A.; Leksina, Y.A.; Gedmina, A.V.; Budnikov, H.C. In situ Voltammetry Determination of Ascorbic and Oxalic Acids in Juices and Fruits Using an Electrode Modified by a Gold–Palladium Bimetallic System. J. Anal. Chem. 2021, 76, 365–370. [Google Scholar] [CrossRef]
- Szultka, M.; Buszewska-Forajta, M.; Kaliszan, R.; Buszewski, B. Determination of ascorbic acid and its degradation products by high-performance liquid chromatography-triple quadrupole mass spectrometry: Liquid Phase Separations. Electrophoresis 2014, 35, 585–592. [Google Scholar] [CrossRef]
- Frenich, A.G.; Torres, M.E.H.; Vega, A.B.; Vidal, J.L.M.; Bolaños, P.P. Determination of Ascorbic Acid and Carotenoids in Food Commodities by Liquid Chromatography with Mass Spectrometry Detection. J. Agric. Food Chem. 2005, 53, 7371–7376. [Google Scholar] [CrossRef]
- Gazdik, Z.; Zitka, O.; Petrlova, J.; Adam, V.; Zehnalek, J.; Horna, A.; Reznicek, V.; Beklova, M.; Kizek, R. Determination of Vitamin C (Ascorbic Acid) Using High Performance Liquid Chromatography Coupled with Electrochemical Detection. Sensors 2008, 8, 7097–7112. [Google Scholar] [CrossRef] [Green Version]
- Bode, F.; Hübener, H.J. Identification of Uric Acid and Ascorbic Acid by Chromatography. Nature 1952, 170, 501. [Google Scholar] [CrossRef]
- Ma, Q.; Jin, Y.; You, H.; Ma, H. Determination of ascorbic acid by suppressed chemiluminescence. Guang Pu Xue Yu Guang Pu Fen Xi 2002, 22, 888–890. [Google Scholar]
- Zhu, Q.; Dong, D.; Zheng, X.; Song, H.; Zhao, X.; Chen, H.; Chen, X. Chemiluminescence determination of ascorbic acid using graphene oxide@copper-based metal–organic frameworks as a catalyst. RSC Adv. 2016, 6, 25047–25055. [Google Scholar] [CrossRef]
- Bunaciu, A.A.; Bacalum, E.; Aboul-Enein, H.Y.; Elena Udristioiu, G.; Fleschin, Ş. FT-IR Spectrophotometric Analysis of Ascorbic Acid and Biotin and their Pharmaceutical Formulations. Anal. Lett. 2009, 42, 1321–1327. [Google Scholar] [CrossRef]
- Fukushi, K.; Takeda, S.; Wakida, S.; Yamane, M.; Higashi, K.; Hiiro, K. Determination of ascorbic acid in vegetables by capillary zone electrophoresis. J. Chromatogr. A 1997, 772, 313–320. [Google Scholar] [CrossRef]
- Zykova, E.V.; Sandetskaya, N.G.; Ostrovskii, O.V.; Verovskii, V.E. Determining ascorbic acid in medicinal preparations by capillary zone electrophoresis and micellar electrokinetic chromatography. Pharm. Chem. J. 2010, 44, 463–465. [Google Scholar] [CrossRef]
- Berg, R.W. Investigation of L (+)-Ascorbic acid with Raman spectroscopy in visible and UV light. Appl. Spectrosc. Rev. 2015, 50, 193–239. [Google Scholar] [CrossRef] [Green Version]
- Rees, M.; Wright, A.G.; Holdcroft, S.; Bertoncello, P. Voltammetry at Hexamethyl-P-Terphenyl Poly(Benzimidazolium) (HMT-PMBI)-Coated Glassy Carbon Electrodes: Charge Transport Properties and Detection of Uric and Ascorbic Acid. Sensors 2020, 20, 443. [Google Scholar] [CrossRef] [Green Version]
- de Almeida, F.L.; dos Santos Filho, S.G. Nitrite Detection in Near-Neutral-pH Electrolytes by Differential Pulse Voltammetry under Cross Interference of Uric Acid, Ascorbic Acid, and Paracetamol. IEEE Sens. Lett. 2019, 3, 1–4. [Google Scholar] [CrossRef]
- Karastogianni, S.; Diamantidou, D.; Girousi, S. Selective Voltammetric Detection of Ascorbic Acid from Rosa Canina on a Modified Graphene Oxide Paste Electrode by a Manganese(II) Complex. Biosensors 2021, 11, 294. [Google Scholar] [CrossRef]
- Yalçınkaya, S.; Demetgül, C.; Timur, M.; Çolak, N. Electrochemical synthesis and characterization of polypyrrole/chitosan composite on platinum electrode: Its electrochemical and thermal behaviors. Carbohydr. Polym. 2010, 79, 908–913. [Google Scholar] [CrossRef]
- de los Santos Álvarez, N.; Fernández Abedul, M.T. Determination of ascorbic acid in dietary supplements by cyclic voltammetry. In Laboratory Methods in Dynamic Electroanalysis; Elsevier: Amsterdam, The Netherlands, 2020; pp. 13–23. ISBN 978-0-12-815932-3. [Google Scholar]
- Shewarega, Y.; Yenealem, D.; Siyum, F. Simultaneous Voltammetric Determination of Paracetamol and Ascorbic Acid Using Activated Glassy Carbon Electrode: Cyclic Voltammetry and Square Wave Voltammetry Study. Acta Chem. Iasi 2021, 29, 107–122. [Google Scholar] [CrossRef]
- Dinu, A.; Apetrei, C. A Review on Electrochemical Sensors and Biosensors Used in Phenylalanine Electroanalysis. Sensors 2020, 20, 2496. [Google Scholar] [CrossRef] [PubMed]
- Lechien, A.; Valenta, P.; Nürnberg, H.W.; Patriarche, G.J. Determination of ascorbic acid by differential pulse voltammetry. Z. Anal. Chem. 1982, 311, 105–108. [Google Scholar] [CrossRef]
- Lyons, M.E.G.; Breen, W.; Cassidy, J. Ascorbic acid oxidation at polypyrrole-coated electrodes. Faraday Trans. 1991, 87, 115. [Google Scholar] [CrossRef]
- Chan, H.S.O.; Toh, C.S.; Gan, L.M. Use of polythiophene and poly(thiophene-3-acetic acid) as charge-selective films for amperometric flow-cell detectors. J. Mater. Chem. 1995, 5, 631. [Google Scholar] [CrossRef]
- Lupu, S.; Mucci, A.; Pigani, L.; Seeber, R.; Zanardi, C. Polythiophene Derivative Conducting Polymer Modified Electrodes and Microelectrodes for Determination of Ascorbic Acid. Effect of Possible Interferents. Electroanalysis 2002, 14, 519–525. [Google Scholar] [CrossRef]
- Gualandi, I.; Marzocchi, M.; Scavetta, E.; Calienni, M.; Bonfiglio, A.; Fraboni, B. A simple all-PEDOT:PSS electrochemical transistor for ascorbic acid sensing. J. Mater. Chem. B 2015, 3, 6753–6762. [Google Scholar] [CrossRef]
- Ganesan, V.; Rastogi, P.K.; Gupta, R.; Meredith, M.T.; Minteer, S.D. Ion exchange voltammetry at branched polyethylenimine cross-linked with ethylene glycol diglycidyl ether and sensitive determination of ascorbic acid. Electrochim. Acta 2013, 105, 31–39. [Google Scholar] [CrossRef]
- Dinu, A.; Apetrei, C. A Review of Sensors and Biosensors Modified with Conducting Polymers and Molecularly Imprinted Polymers Used in Electrochemical Detection of Amino Acids: Phenylalanine, Tyrosine, and Tryptophan. Int. J. Mol. Sci. 2022, 23, 1218. [Google Scholar] [CrossRef]
- Hatamie, A.; Rahmati, R.; Rezvani, E.; Angizi, S.; Simchi, A. Yttrium hexacyanoferrate microflowers on freestanding three-dimensional graphene substrates for ascorbic acid detection. ACS Appl. Nano Mater. 2019, 2, 2212–2221. [Google Scholar] [CrossRef]
- Ghanbari, K.; Hajheidari, N. Simultaneous electrochemical determination of dopamine, uric acid and ascorbic acid using silver nanoparticles deposited on polypyrrole nanofibers. J. Polym. Res. 2015, 22, 152. [Google Scholar] [CrossRef]
- Mao, H.; Ji, C.; Liu, M.; Sun, Y.; Liu, D.; Wu, S.; Zhang, Y.; Song, X.M. Hydrophilic polymer/polypyrrole/graphene oxide nanosheets with different performances in electrocatalytic applications to simultaneously determine dopamine and ascorbic acid. RSC Adv. 2016, 6, 111632–111639. [Google Scholar] [CrossRef]
- Lupu, S.; Ion, I.; Ion, A.C. Voltammetric determination of phenol at platinum electrodes modified with polypyrrole doped with ferricyanide. Rev. Roum. Chim. 2009, 54, 351–357. [Google Scholar]
- Angizi, S.; Hatamie, A.; Ghanbari, H.; Simchi, A. Mechanochemical green synthesis of exfoliated edge-functionalized boron nitride quantum dots: Application to vitamin C sensing through hybridization with gold electrodes. ACS Appl. Mater. Interfaces 2018, 10, 28819–28827. [Google Scholar] [CrossRef]
- Freeman, C.J.; Ullah, B.; Islam, M.S.; Collinson, M.M. Potentiometric biosensing of ascorbic acid, uric acid, and cysteine in microliter volumes using miniaturized nanoporous gold electrodes. Biosensors 2020, 11, 10. [Google Scholar] [CrossRef]
- Wu, G.; Wu, Y.; Liu, X.; Rong, M.; Chen, X.; Chen, X. An electrochemical ascorbic acid sensor based on palladium nanoparticles supported on graphene oxide. Anal. Chim. Acta 2012, 745, 33–37. [Google Scholar] [CrossRef]
- Tavakkoli, N.; Nasrollahi, S.; Vatankhah, G. Electrocatalytic Determination of Ascorbic Acid Using a Palladium Coated Nanoporous Gold Film Electrode. Electroanalysis 2012, 24, 368–375. [Google Scholar] [CrossRef]
- Fredj, Z.; Ben Ali, M.; Abbas, M.N.; Dempsey, E. Simultaneous determination of ascorbic acid, uric acid and dopamine using silver nanoparticles and copper monoamino-phthalocyanine functionalised acrylate polymer. Anal. Methods 2020, 12, 3883–3891. [Google Scholar] [CrossRef]
- Mystkowski, E.M. The oxidation of ascorbic acid in the presence of copper. Biochem. J. 1942, 36, 494–500. [Google Scholar] [CrossRef] [Green Version]
- Shabalina, A.V.; Svetlichnyi, V.A.; Ryzhinskaya, K.A.; Lapin, I.N. Copper Nanoparticles for Ascorbic Acid Sensing in Water on Carbon Screen-printed Electrodes. Anal. Sci. 2017, 33, 1415–1419. [Google Scholar] [CrossRef] [PubMed] [Green Version]
- Council of Europe. European Pharmacopoeia 7.0, 7th ed.; Council of Europe: Strasbourg, France, 2011; Volume 1, ISBN 92-871-6700-1. [Google Scholar]
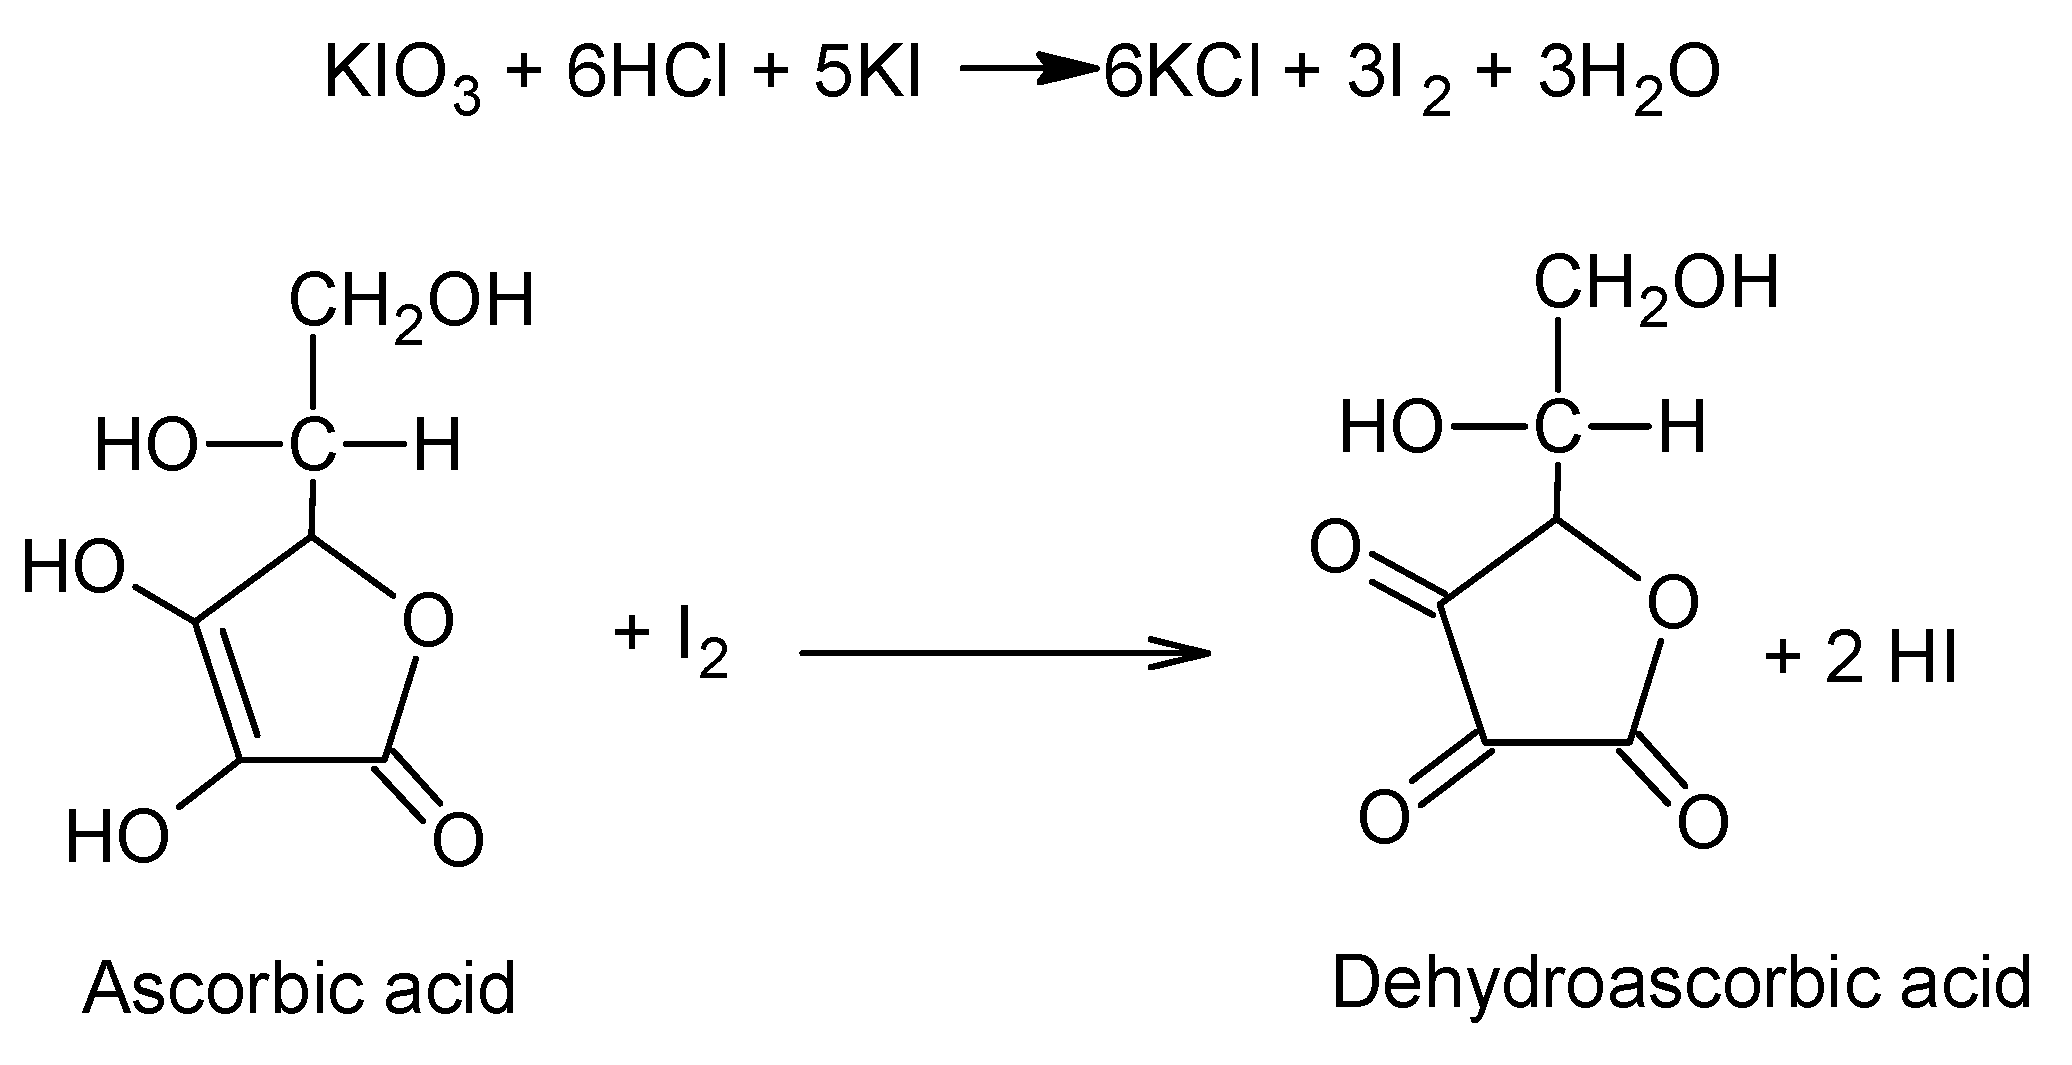
- Georgescu, C.V.; Gavat, C.C.; Voinescu, D.C. Iodometric Quantitative Analysis Method of Ascorbic Acid in Tablets. Rev. Chim. 2019, 70, 3555–3560. [Google Scholar] [CrossRef]
- Sowmya, P.; Sudhir, A.; Rai, K. Iodometric determination of ascorbic acid in bulk and Vitamin-C tablets using Potassium Iodate. Pharm. Pharmacol. Int. J. 2020, 8, 159–161. [Google Scholar]
- Dinu, A.; Apetrei, C. Development of a Novel Sensor Based on Polypyrrole Doped with Potassium Hexacyanoferrate (II) for Detection of L-Tryptophan in Pharmaceutics. Inventions 2021, 6, 56. [Google Scholar] [CrossRef]
- Dinu, A.; Apetrei, C. Development of Polypyrrole Modified Screen-Printed Carbon Electrode Based Sensors for Determination of L-Tyrosine in Pharmaceutical Products. Int. J. Mol. Sci. 2021, 22, 7528. [Google Scholar] [CrossRef]
- Dinu, A.; Apetrei, C. Quantification of Tyrosine in Pharmaceuticals with the New Biosensor Based on Laccase-Modified Polypyrrole Polymeric Thin Film. Polymers 2022, 14, 441. [Google Scholar] [CrossRef]
- Ohno, H. Electrochemical Aspects of Ionic Liquids; John Wiley & Sons: Hoboken, NJ, USA, 2005; ISBN 0-471-76252-0. [Google Scholar]
- Kato, M.; Honma, T.; Kondo, M.; Kuwahara, T.; Shimomura, M. Influence of surface modification of gold electrodes on electrochemical oxidation of ascorbic acid. J. Electrochem. Soc. Technol. Educ. Res. Pap. 2014, 21, 1–7. [Google Scholar]
- Dinu, A.; Apetrei, C. Voltammetric Determination of Phenylalanine Using Chemically Modified Screen-Printed Based Sensors. Chemosensors 2020, 8, 113. [Google Scholar] [CrossRef]
- Apetrei, I.; Apetrei, C. Development of a Novel Biosensor Based on Tyrosinase/Platinum Nanoparticles/Chitosan/Graphene Nanostructured Layer with Applicability in Bioanalysis. Materials 2019, 12, 1009. [Google Scholar] [CrossRef] [PubMed] [Green Version]
- Oukil, D.; Makhloufi, L.; Saidani, B. Preparation of polypyrrole films containing ferrocyanide ions deposited onto thermally pre-treated and untreated iron substrate: Application in the electroanalytical determination of ascorbic acid. Sens. Actuators B Chem. 2007, 123, 1083–1089. [Google Scholar] [CrossRef]
- Raoof, J.B.; Ojani, R.; Rashid-Nadimi, S. Preparation of polypyrrole/ferrocyanide films modified carbon paste electrode and its application on the electrocatalytic determination of ascorbic acid. Electrochim. Acta 2004, 49, 271–280. [Google Scholar] [CrossRef]
- Tan, C.; Zhao, J.; Sun, P.; Zheng, W.; Cui, G. Gold nanoparticle decorated polypyrrole/graphene oxide nanosheets as a modified electrode for simultaneous determination of ascorbic acid, dopamine and uric acid. New J. Chem. 2020, 44, 4916–4926. [Google Scholar] [CrossRef]
- Chikouche, I.; Dehchar, C.; Sahari, A.; Loucif, N. Response to Ascorbic Acid on Polypyrrole Film Modified by Copper Particles. Surf. Rev. Lett. 2019, 26, 1850187. [Google Scholar] [CrossRef]
- Demirkan, B.; Bozkurt, S.; Cellat, K.; Arıkan, K.; Yılmaz, M.; Şavk, A.; Çalımlı, M.H.; Nas, M.S.; Atalar, M.N.; Alma, M.H.; et al. Palladium supported on polypyrrole/reduced graphene oxidenanoparticles for simultaneous biosensing application of ascorbic acid, dopamine, anduric acid. Sci. Rep. 2020, 10, 2946. [Google Scholar] [CrossRef]
- Huang, Z.N.; Zou, J.; Teng, J.; Liu, Q.; Yuan, M.M.; Jiao, F.P.; Jiang, X.Y.; Yu, J.G. A novel electrochemical sensor based on self-assembled platinum nanochains—Multi-walled carbon nanotubes-graphene nanoparticles composite for simultaneous determination of dopamine and ascorbic acid. Ecotoxicol. Environ. Saf. 2019, 172, 167–175. [Google Scholar] [CrossRef]
- Ghanbari, K.; Bonyadi, S. Modified Glassy Carbon Electrode with Polypyrrole Nanocomposite for the Simultaneous Determination of Ascorbic acid, Dopamine, Uric acid, and Folic Acid. J. Electrochem. Sci. Technol. 2020, 11, 68–83. [Google Scholar] [CrossRef]
- Ghanbari, K.; Bonyadi, S. An electrochemical sensor based on reduced graphene oxide decorated with polypyrrole nanofibers and zinc oxide–copper oxide p–n junction heterostructures for the simultaneous voltammetric determination of ascorbic acid, dopamine, paracetamol, and tryptophan. New J. Chem. 2018, 42, 8512–8523. [Google Scholar] [CrossRef]


| Pt/PPy-FeCN Electrode | ||||||
|---|---|---|---|---|---|---|
| Epa 1 (V) | Epc 2 (V) | ΔE 3 (V) | Ipa 4 (µA) | Ipc 5 (µA) | Ipc/Ipa | |
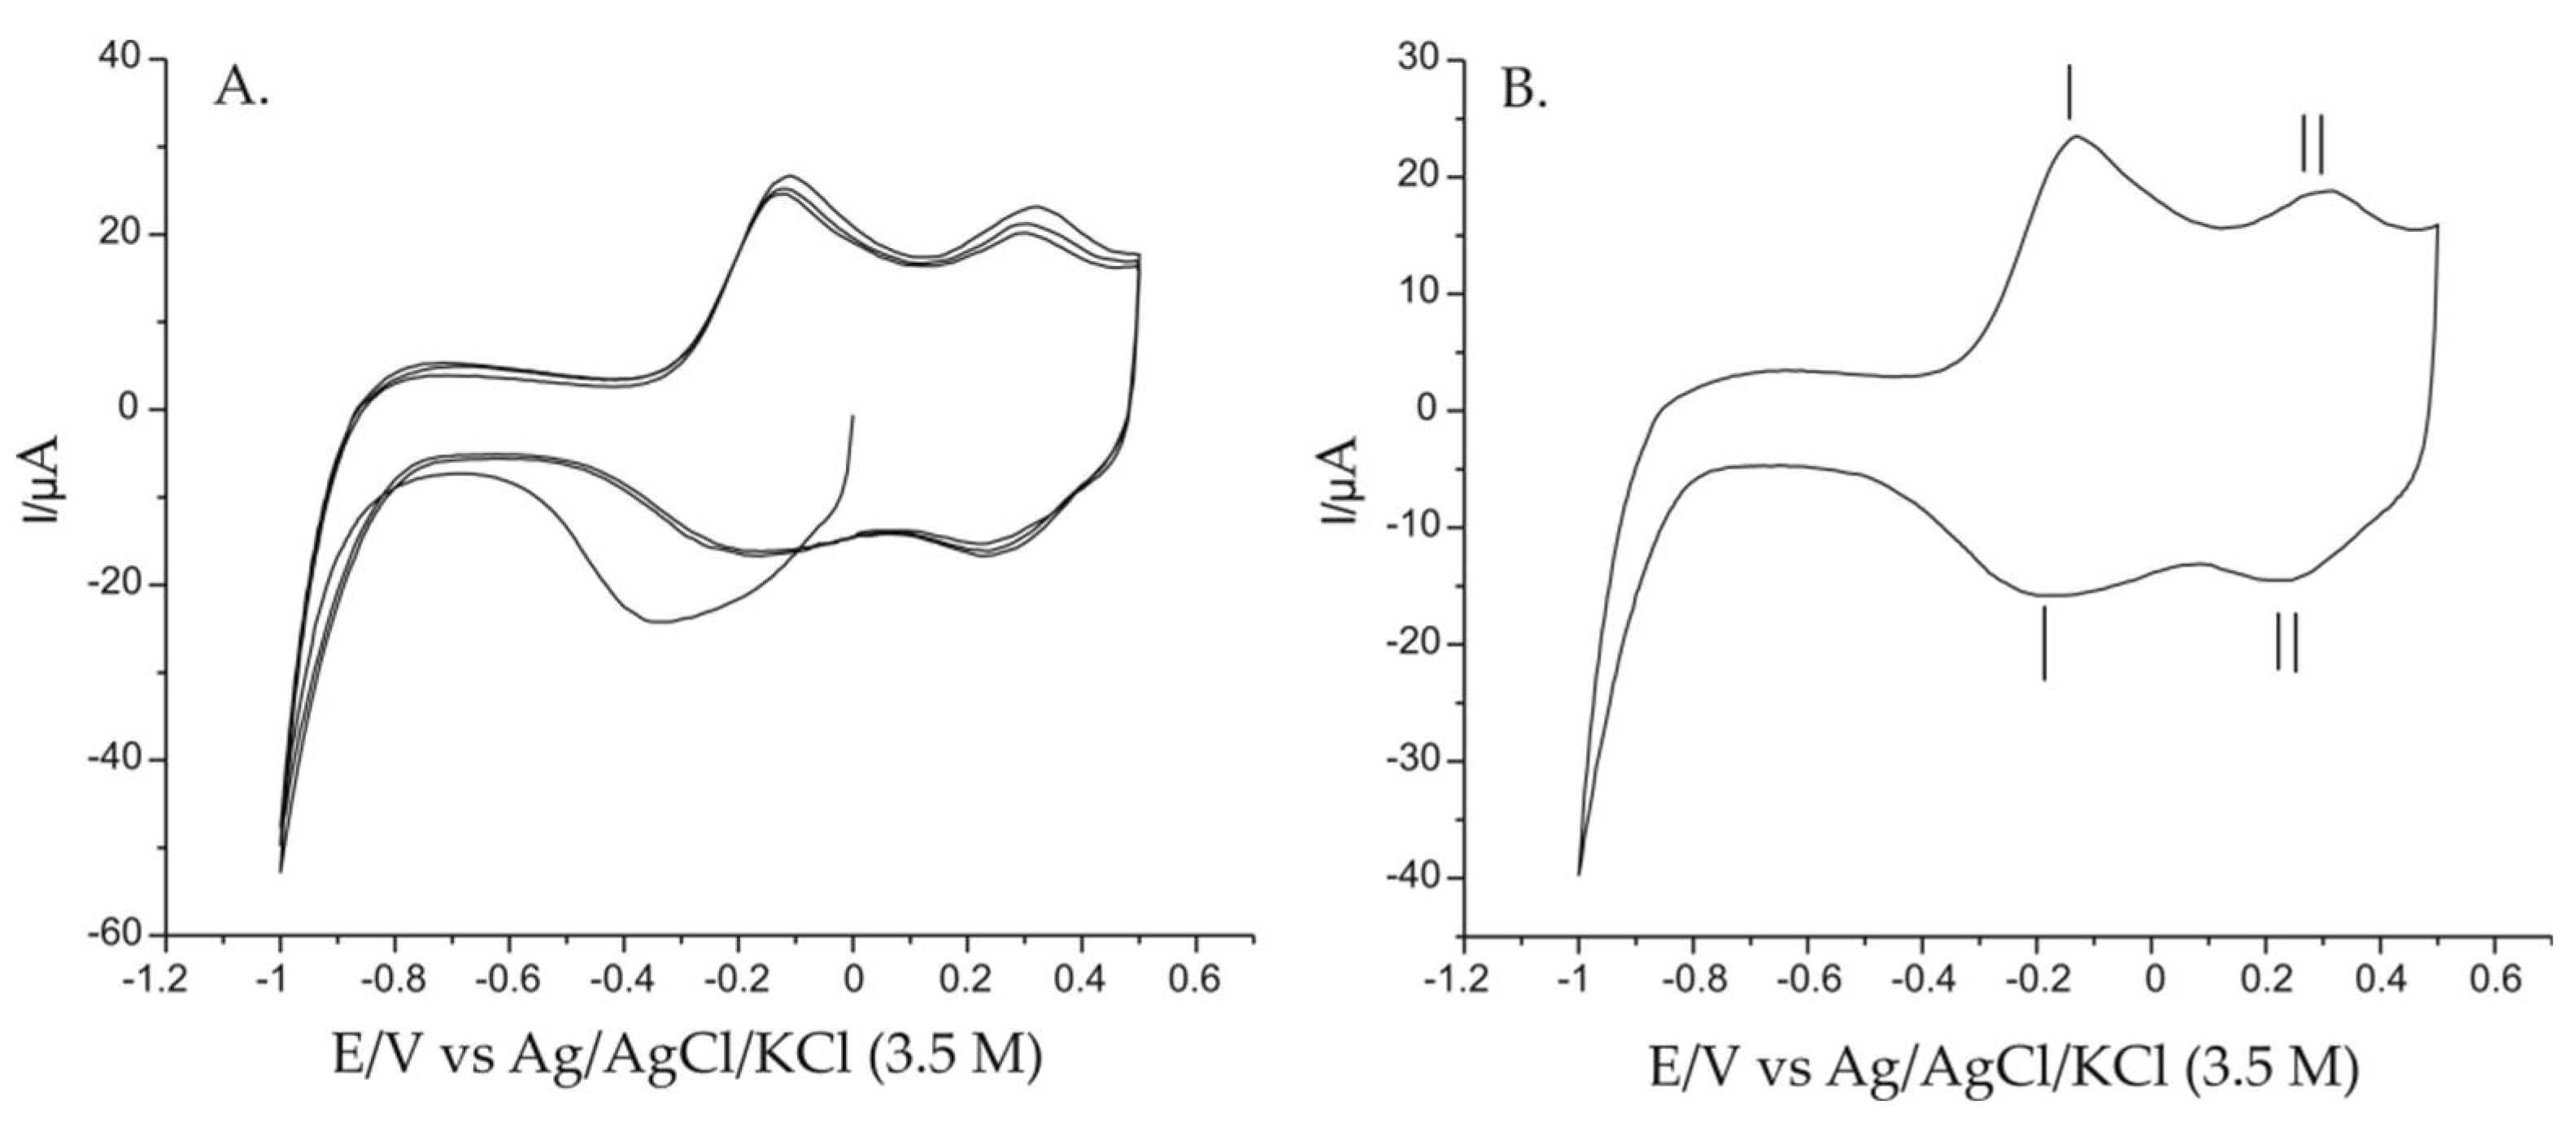
| Redox system I | −0.129 | −0.169 | 0.04 | 23.07 | −15.68 | 0.67 |
| Redox system II | 0.322 | 0.239 | 0.08 | 18.35 | −14.45 | 0.78 |
| Pt/PPy-FeCN Electrode | ||||||
|---|---|---|---|---|---|---|
| Epa 1 (V) | Epc 2 (V) | ΔE 3 (V) | Ipa 4 (µA) | Ipc 5 (µA) | Ipc/Ipa | |
| Redox system I | −0.171 | −0.101 | 0.069 | 21.07 | −42.11 | 1.99 |
| Redox system II | 0.418 | 0.287 | 0.131 | 101.76 | −48.99 | 0.48 |
| Cathodic peak III | - | −0.375 | - | - | −21.98 | - |
| Electrode | Pt | Pt/PPy-FeCN |
|---|---|---|
| Active area (cm2) | 0.54 | 4.1 |
| Geometric area (cm2) | 0.1265 | 0.1265 |
| Roughness factor | 4.26 | 32.64 |
| Sensor | Epa 1 (V) | Epc 2 (V) | ΔE 3 (V) | Ipa 4 (µA) | Ipc 5 (µA) | Ipc/Ipa |
|---|---|---|---|---|---|---|
| Pt/PPy-FeCN | 0.223 | 0.116 | 0.106 | 89.14 | −79.97 | 0.89 |
| Electrode | Method of Detection | LOD (M) | Real Sample | References |
|---|---|---|---|---|
| PPy/FCN/Fe and PPy/FCN/Fe3O4/Fe) (a polypyrrole containing ferrocyanide ions) | CV | 0.15 × 10⁻³ | for the determination of H2A in aqueous solution | [65] |
| Ppy/FCNMCPEs (polypyrrole/ferrocyanide films modified carbon paste electrode) | CV | 5.82 × 10⁻⁵ | - | [66] |
| AuNPs@GO/PPy/CFP (a gold nanoparticle decorated polypyrrole/graphene oxide composite on carbon fiber paper) | CV | 2.43 × 10⁻⁶ | urine sample | [67] |
| Cu-PPy/Si (copper-polypyrrole/silicon) | CV, CA | 0.20 × 10⁻³ | - | [68] |
| rGO/Pd@PPy NPs (palladium nanoparticles supported on polypyrrole/reduced graphene oxide) | CV | 4.9 × 10⁻⁸ | serum sample | [69] |
| PtNCs-MWCNTs-GNPs (platinum nanochains- multi-walled carbon nanotubes- graphene nanoparticles) | CV, DPV | 10.0 × 10⁻⁶ | vitamin C tablets | [70] |
| CuxO-ZnO/PPy/RGO (copper oxide-Zinc oxide/polypyrrole/reduced graphene oxide) | CV, DPV | 22 × 10−9 | human plasmatic serum | [71] |
| 3DCu(x)O-ZnO NPs/PPy/RGO (a three-dimensional porous nanocomposite of reduced graphene oxide decorated with polypyrrole nanofibers and zinc oxide-copper oxide) | CV | 0.024 | human blood serum | [72] |
| Pt/PPy-FeCN (platinum/polypyrrole- hexacianoferat de potasiu) | CV, CA | 2.5 × 10⁻⁷ | pharmaceuticals | this work |
| The Pharmaceutical Form in which AAs Is Found | Ipc (V) | Epc (V) | Manufacturer’s Reported Concentration (mg) | AAs Concentration (mg) | |
|---|---|---|---|---|---|
| CV Technique | Iodometric Method STAS 6182/15-87 | ||||
| Chewable tablet | −6.02 | −443.58 | 180 | 180 ± 6 | 180 ± 7 |
| Injectable ampoule | −5.38 | 750 | 750 ± 20 | 750 ± 23 | |
| Powder for oral suspension | −6.66 | 1000 | 1000 ± 25 | 1000 ± 31 | |
Publisher’s Note: MDPI stays neutral with regard to jurisdictional claims in published maps and institutional affiliations. |
© 2022 by the authors. Licensee MDPI, Basel, Switzerland. This article is an open access article distributed under the terms and conditions of the Creative Commons Attribution (CC BY) license (https://creativecommons.org/licenses/by/4.0/).
Share and Cite
Dinu, A.; Apetrei, C. Determination of Ascorbic Acid in Pharmaceuticals and Food Supplements with the New Potassium Ferrocyanide-Doped Polypyrrole-Modified Platinum Electrode Sensor. Chemosensors 2022, 10, 180. https://doi.org/10.3390/chemosensors10050180
Dinu A, Apetrei C. Determination of Ascorbic Acid in Pharmaceuticals and Food Supplements with the New Potassium Ferrocyanide-Doped Polypyrrole-Modified Platinum Electrode Sensor. Chemosensors. 2022; 10(5):180. https://doi.org/10.3390/chemosensors10050180
Chicago/Turabian StyleDinu, Ancuța, and Constantin Apetrei. 2022. "Determination of Ascorbic Acid in Pharmaceuticals and Food Supplements with the New Potassium Ferrocyanide-Doped Polypyrrole-Modified Platinum Electrode Sensor" Chemosensors 10, no. 5: 180. https://doi.org/10.3390/chemosensors10050180