
Effects of Individualized Low-Intensity Exercise and Its Duration on Recovery Ability in Adults


Abstract
:1. Introduction
2. Materials and Methods
2.1. Subjects
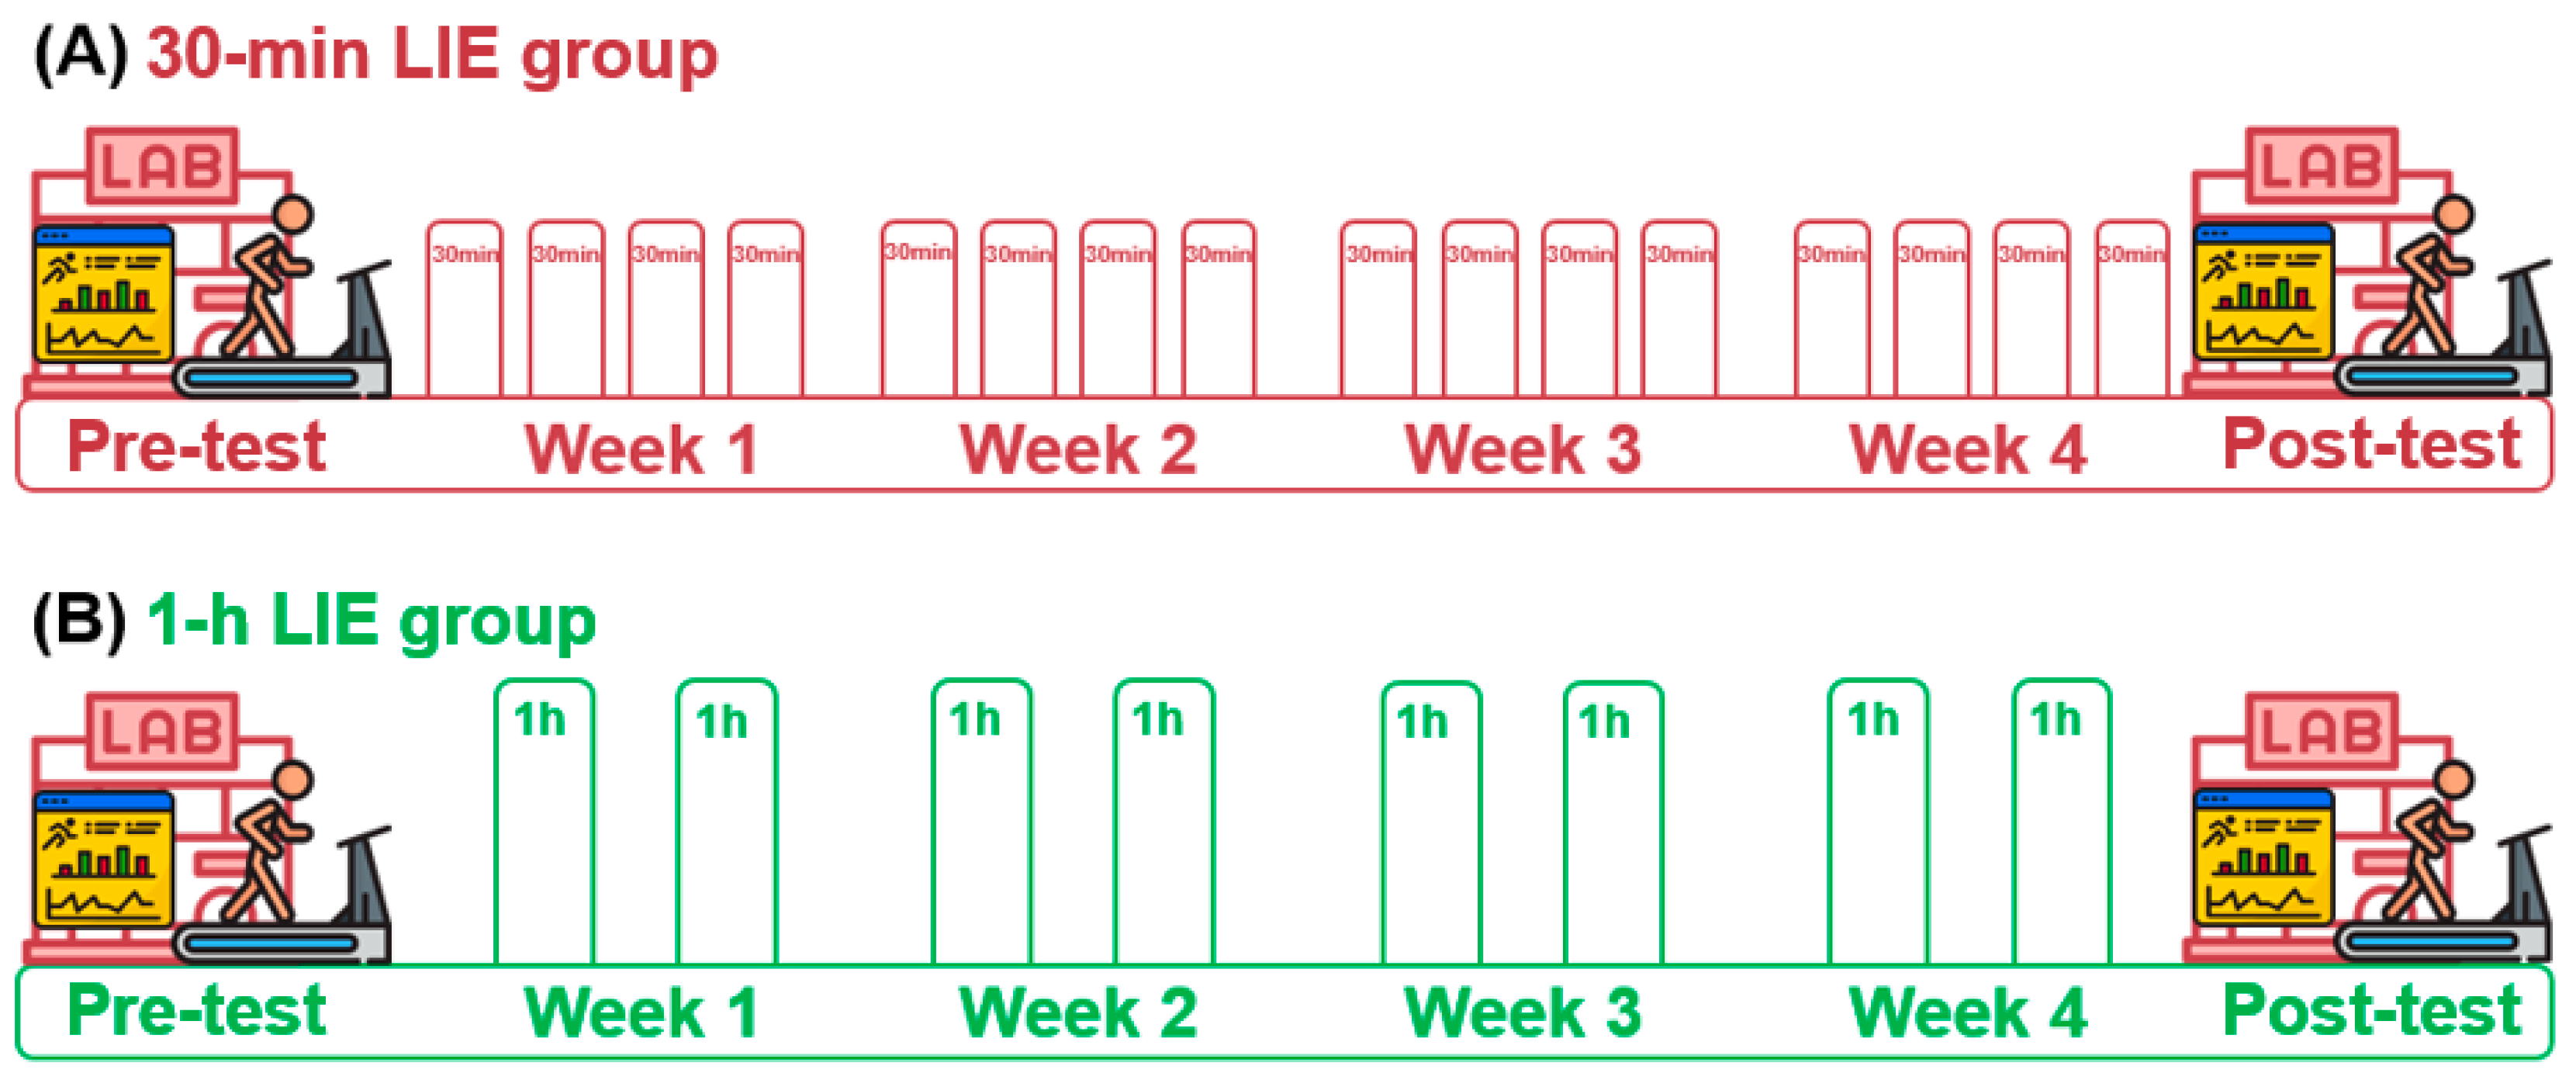
2.2. Study Design
2.3. Intervention of Low-Intensity Exercise
2.4. Laboratory Pre- and Post-Test
2.5. Statistical Analyses
3. Results
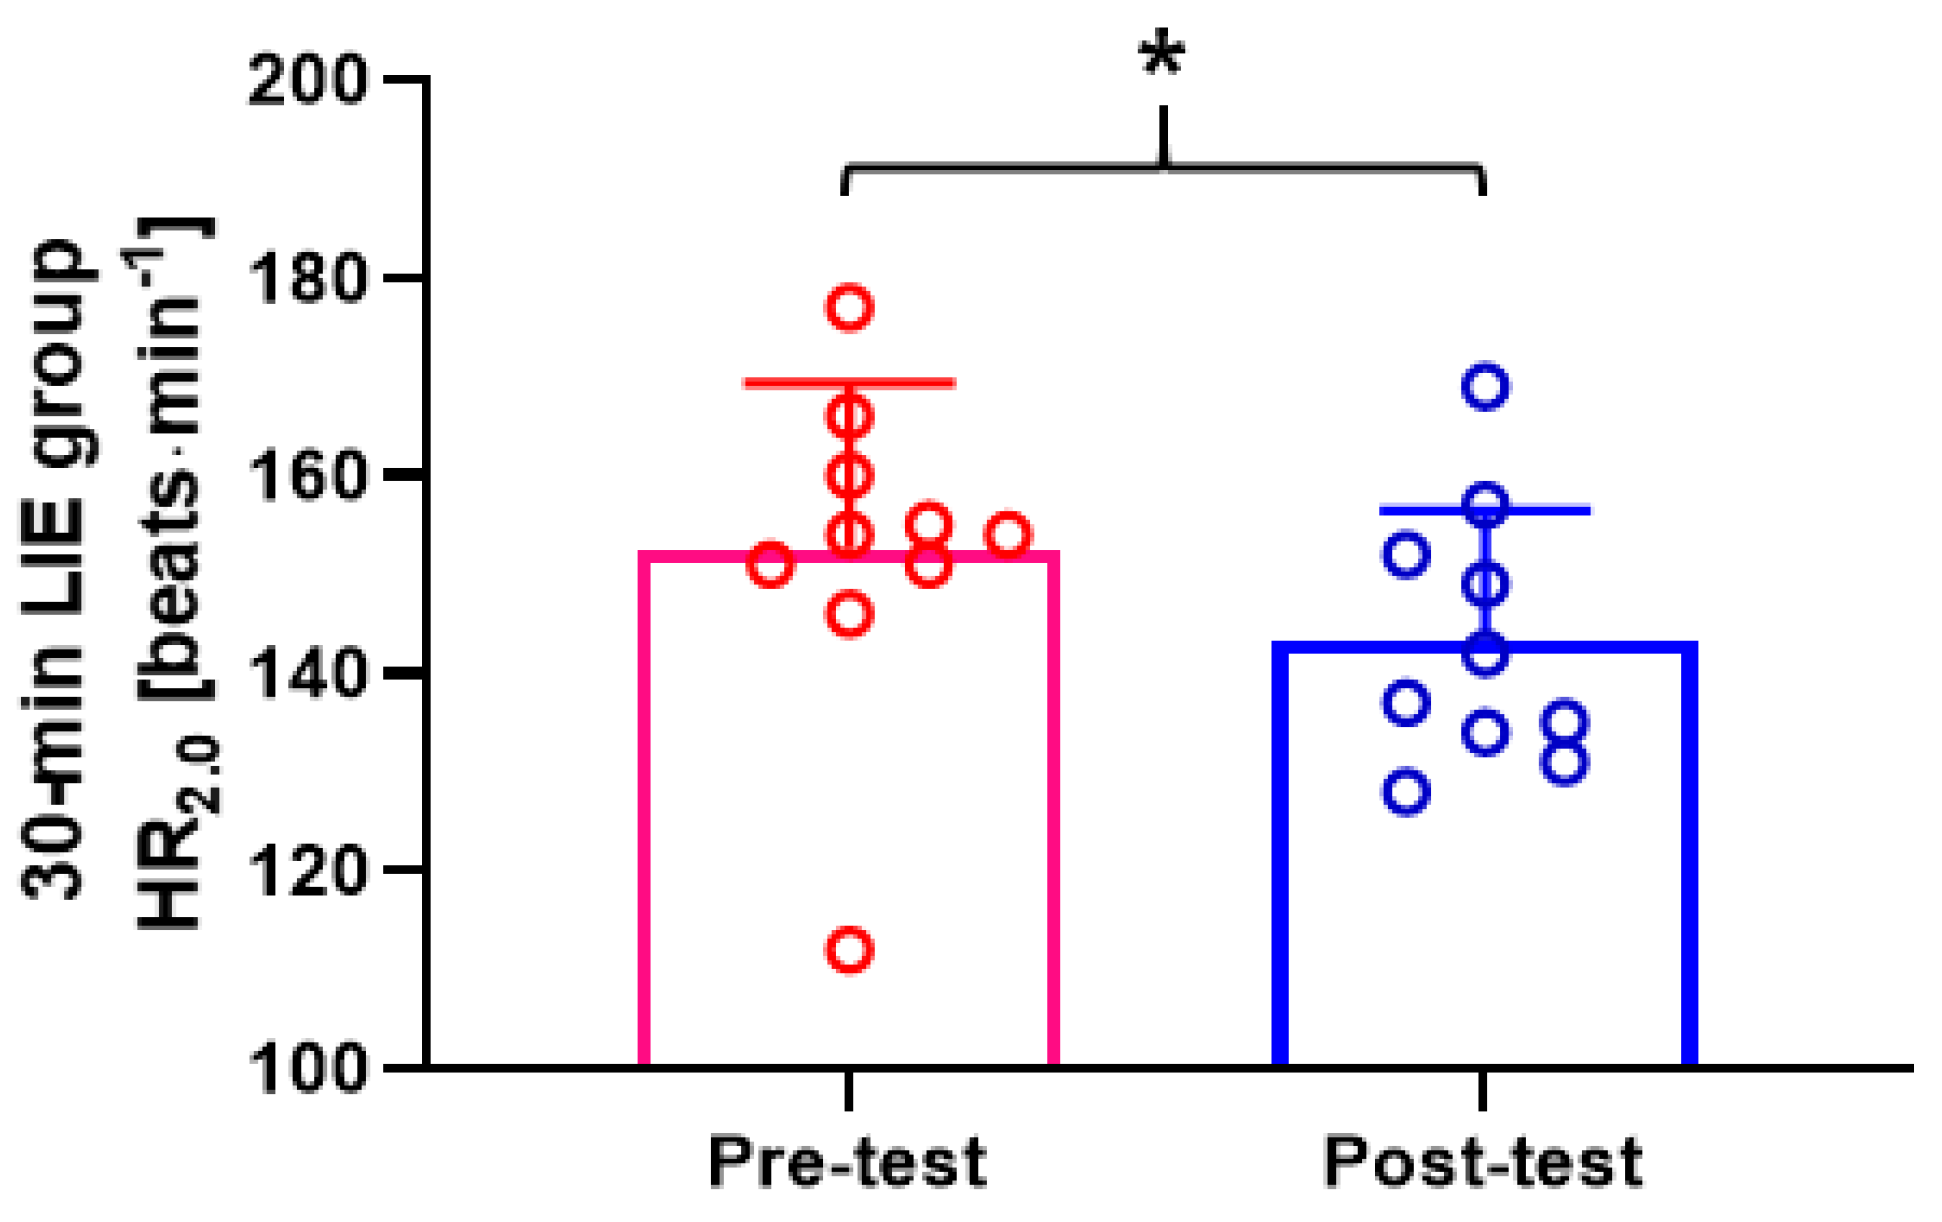
3.1. Comparison of Pre- and Post-Test HR and Jogging/Running Speed of 30-min LIE Group
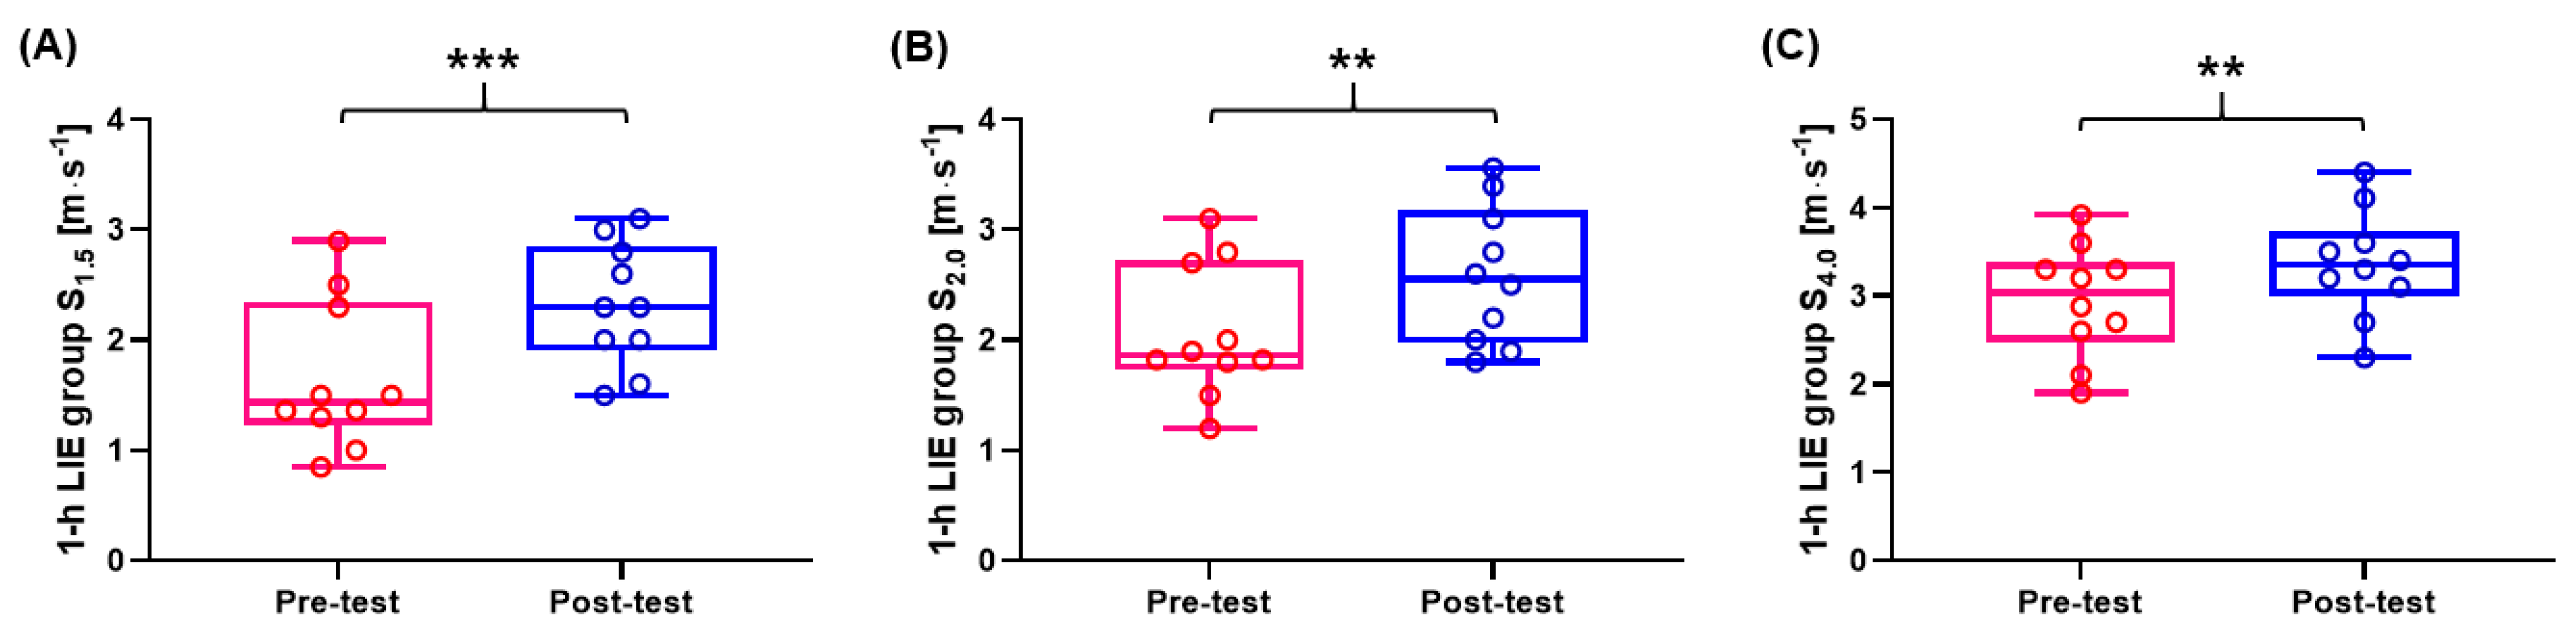
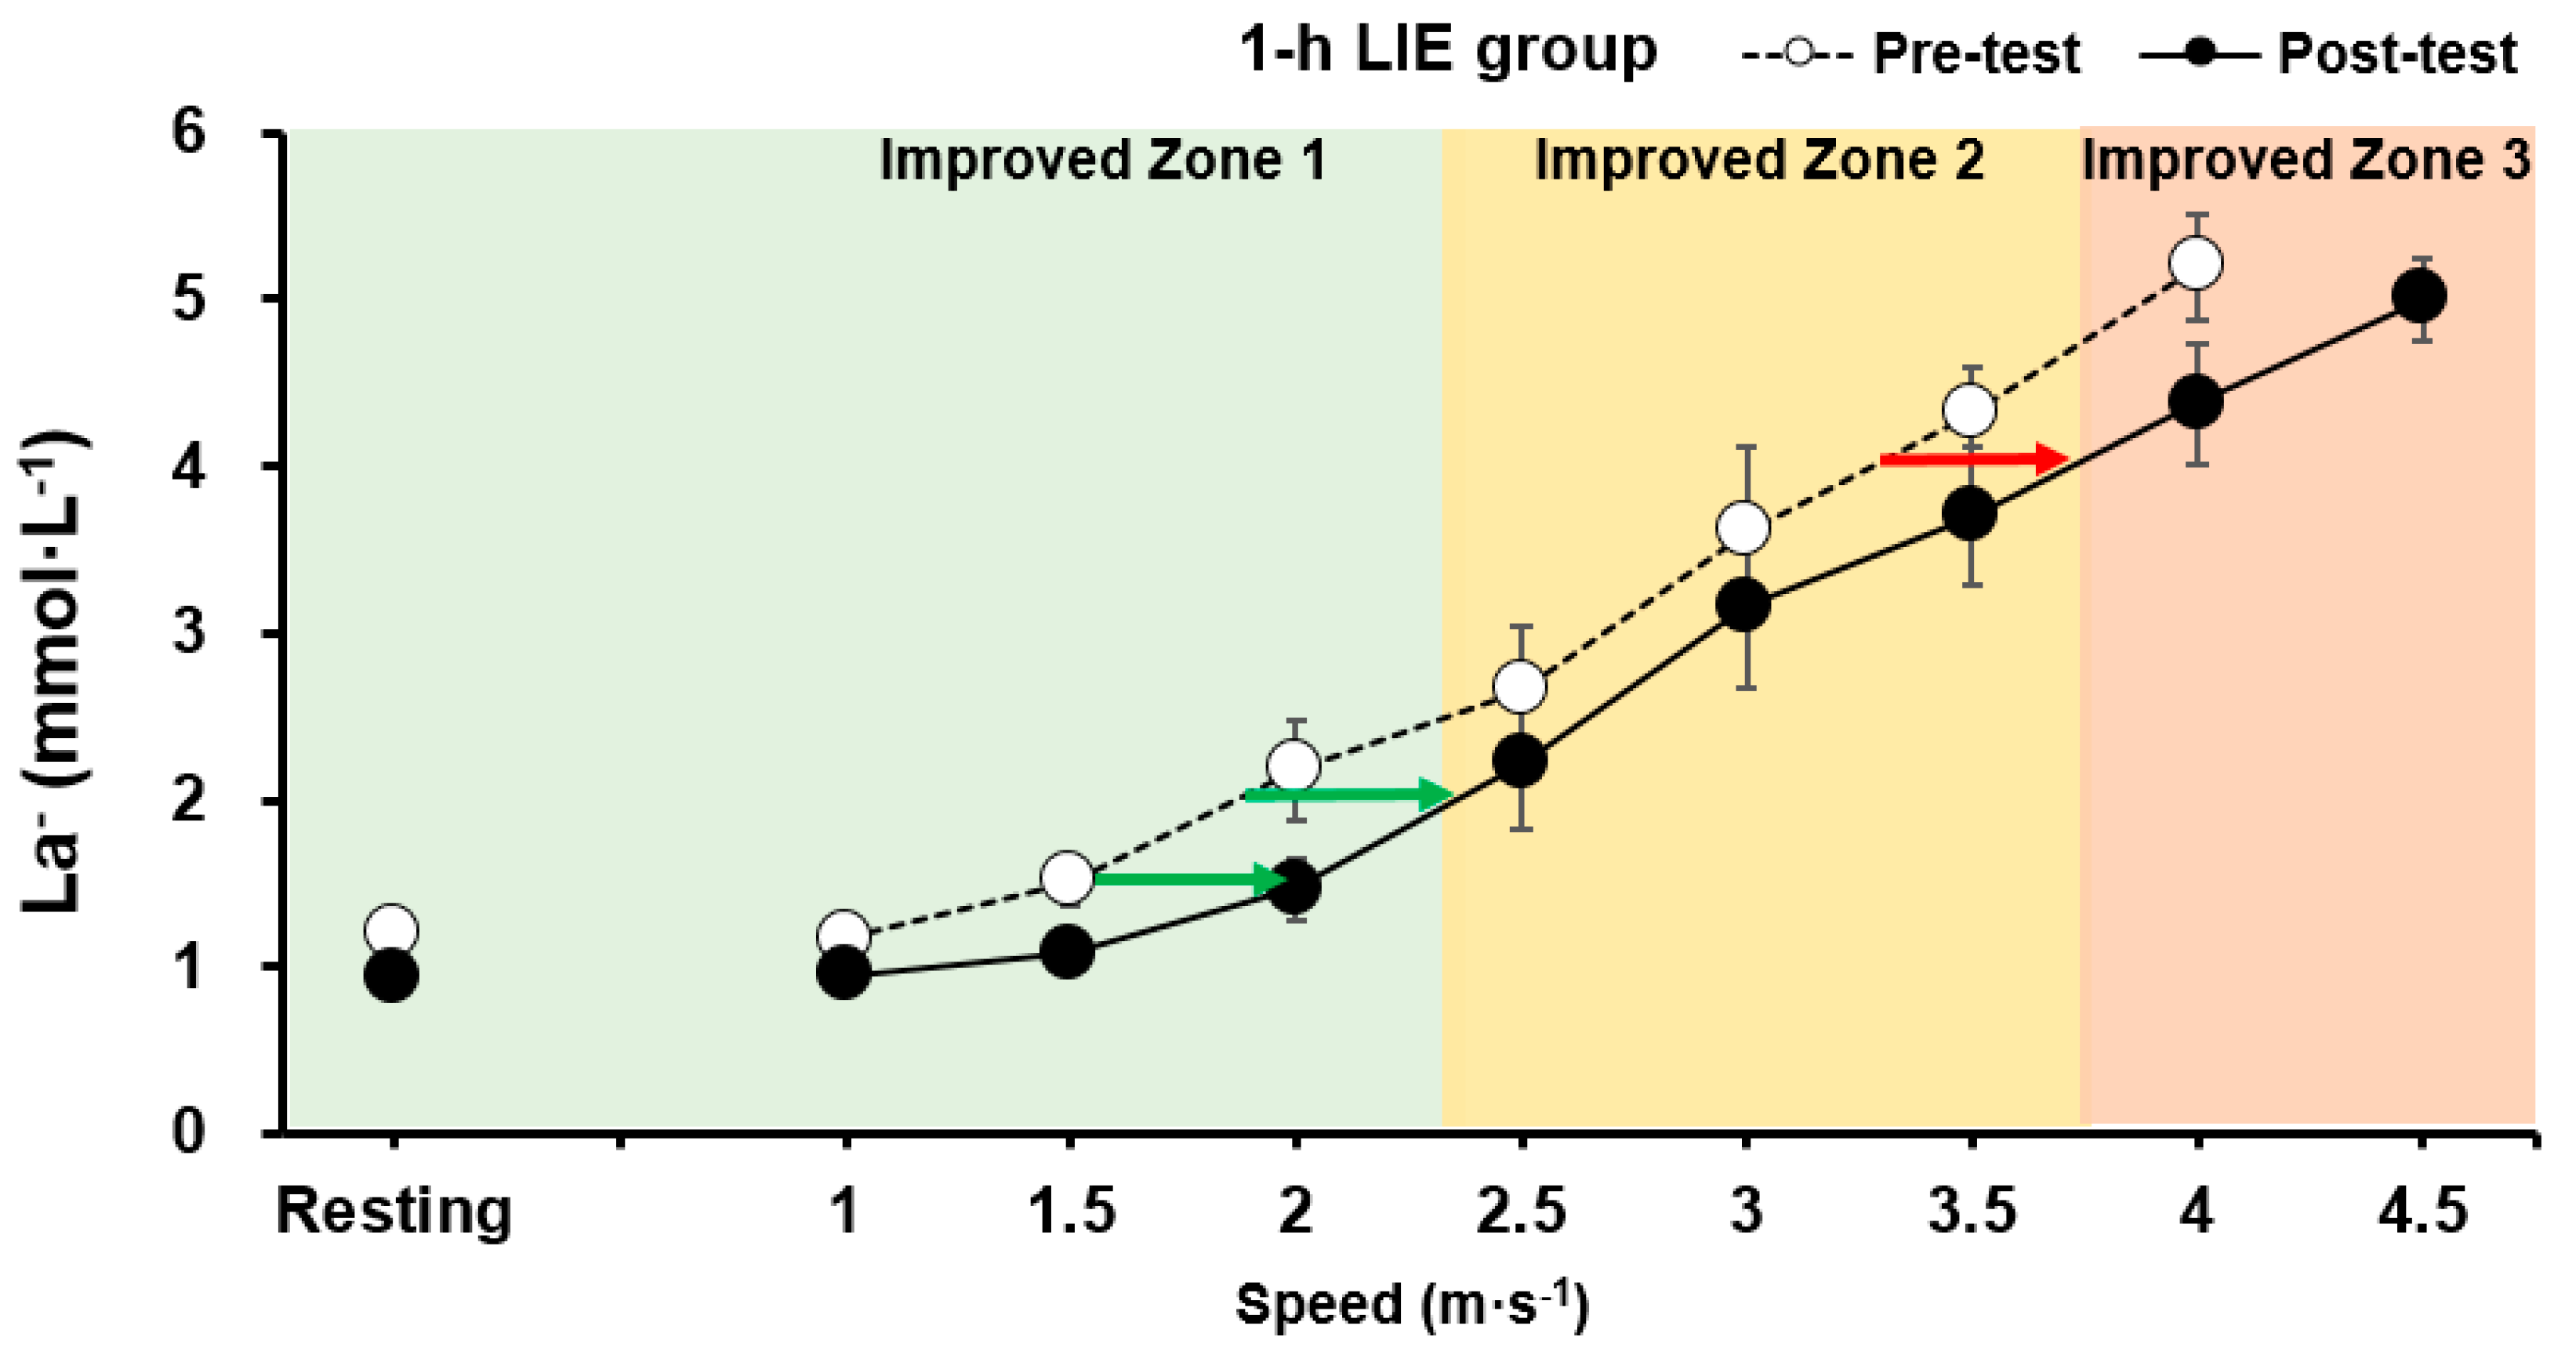
3.2. Comparison of Pre- and Post-Test HR and Jogging/Running Speed of 1-h LIE Group
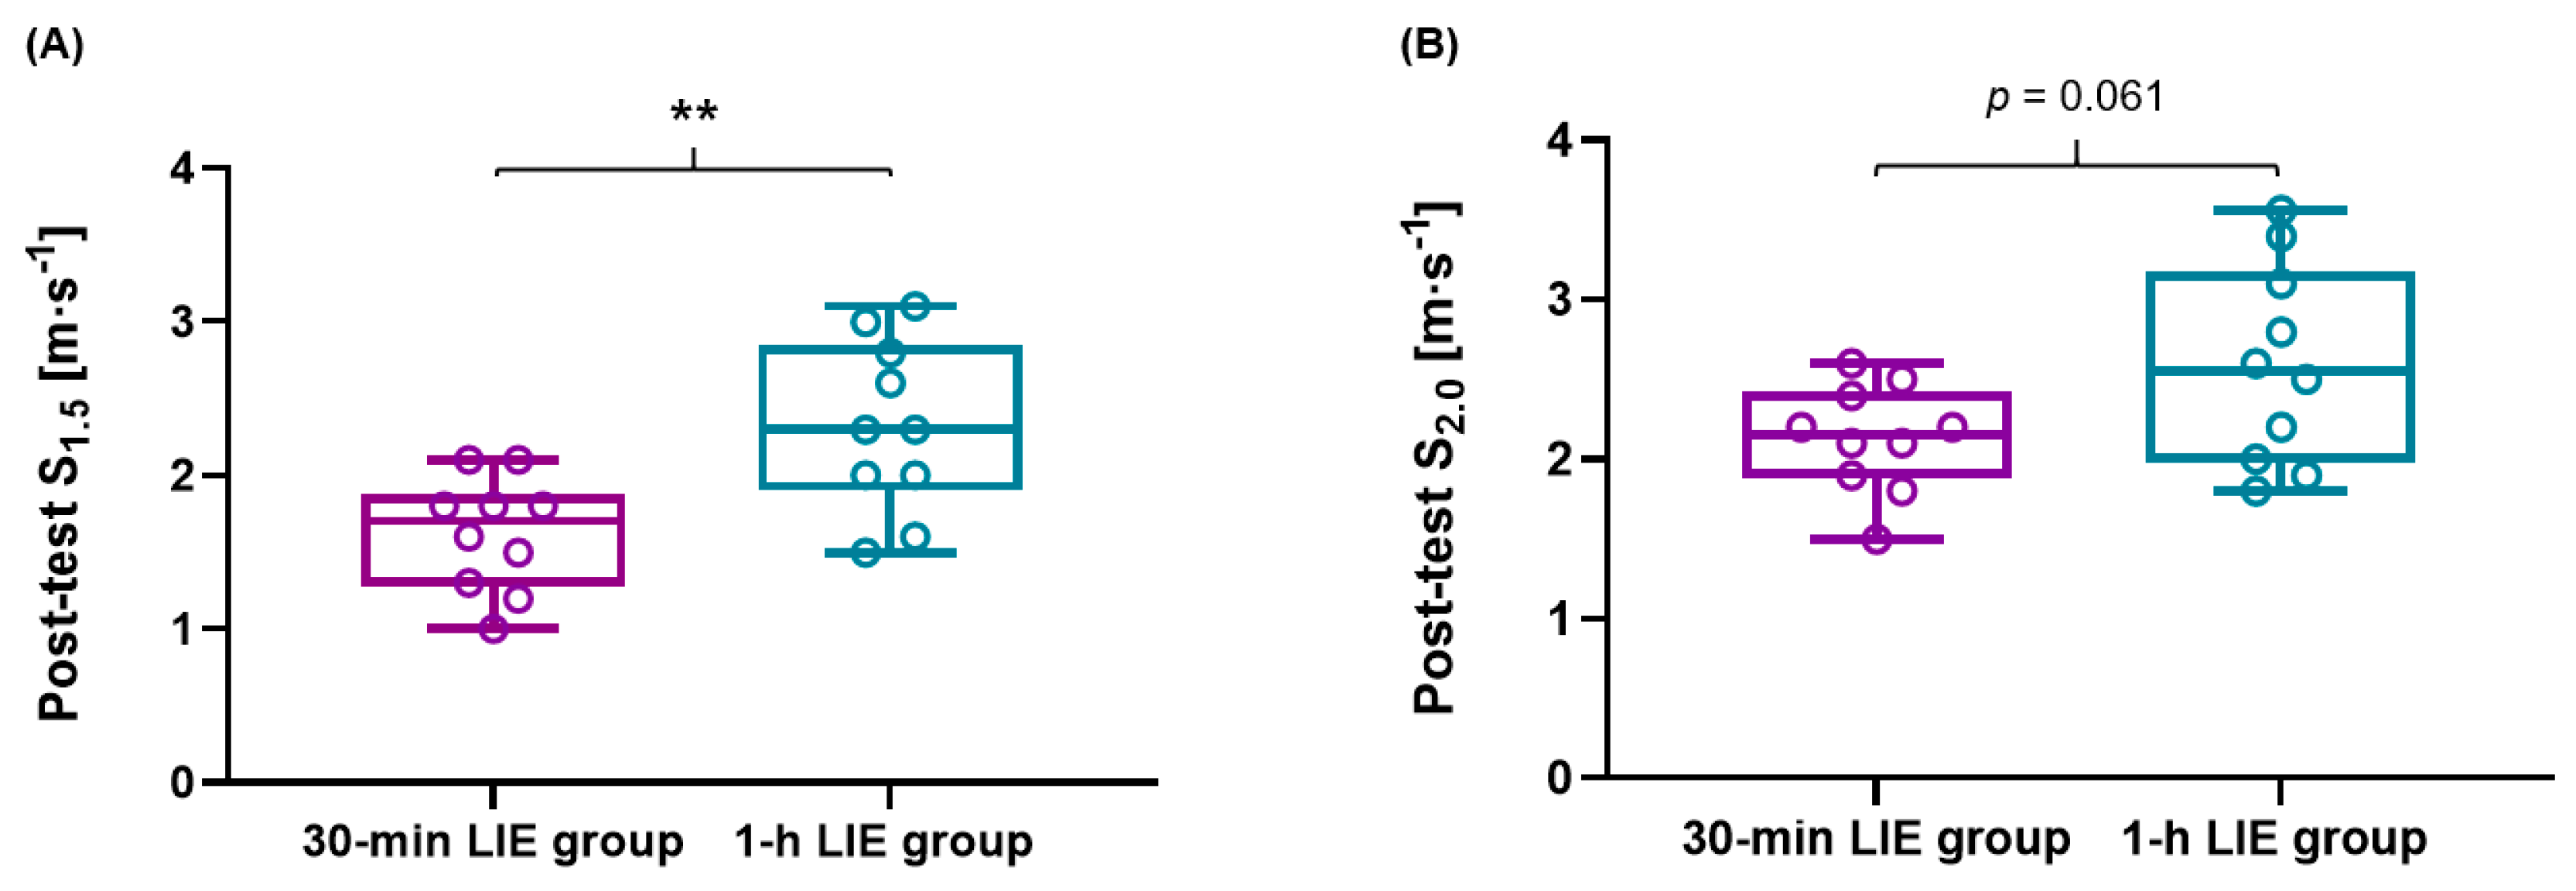
3.3. Comparison of HR, Jogging/Running Speed, ∆HR, and ∆Jogging/Running Speed between 30-min and 1-h LIE Group
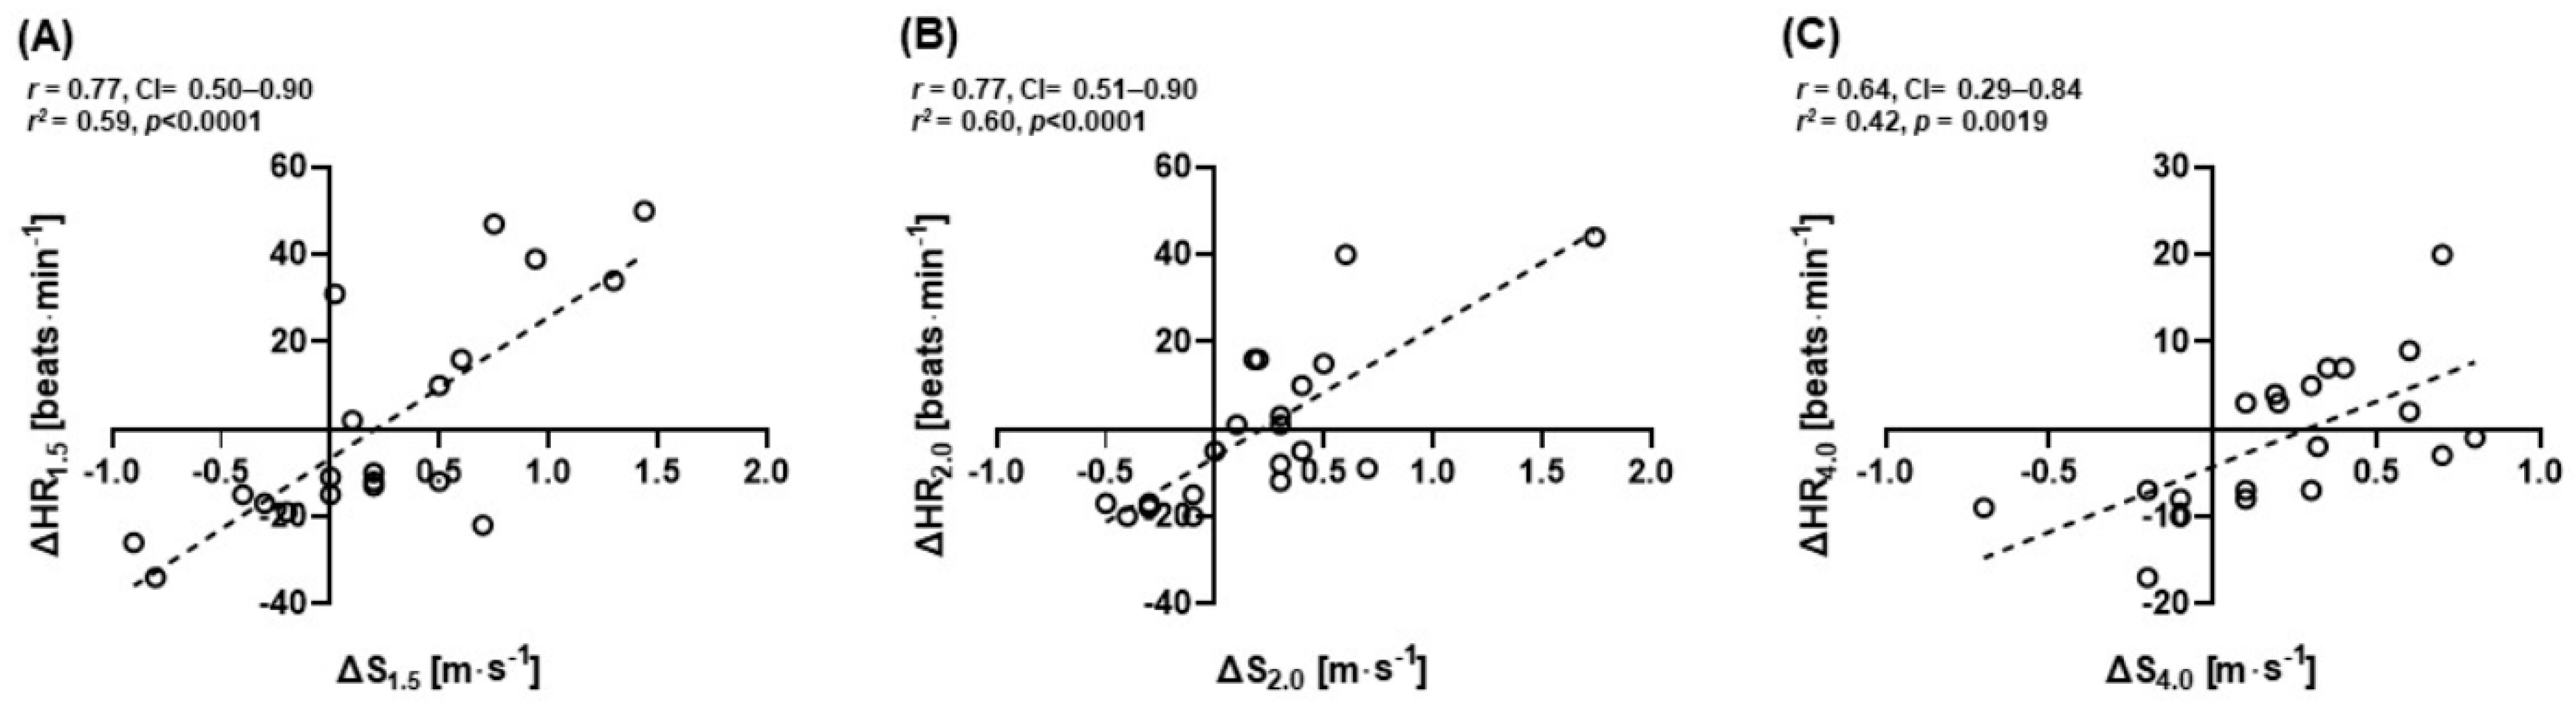
3.4. Correlations between ∆HR and ∆S of All Subjects at 1.5, 2.0, and 4.0 mmol·L−1 La−
4. Discussion
5. Conclusions
Author Contributions
Funding
Institutional Review Board Statement
Informed Consent Statement
Data Availability Statement
Conflicts of Interest
References
- MacInnis, M.J.; Gibala, M.J. Physiological adaptations to interval training and the role of exercise intensity. J. Physiol. 2017, 595, 2915–2930. [Google Scholar] [CrossRef] [PubMed] [Green Version]
- Kiviniemi, A.M.; Hautala, A.J.; Kinnunen, H.; Tulppo, M.P. Endurance training guided individually by daily heart rate variability measurements. Eur. J. Appl. Physiol. 2007, 101, 743–751. [Google Scholar] [CrossRef]
- Messias, L.H.D.; Polisel, E.E.C.; Manchado-Gobatto, F.B. Advances of the reverse lactate threshold test: Non-invasive proposal based on heart rate and effect of previous cycling experience. PLoS ONE 2018, 13, e0194313. [Google Scholar] [CrossRef] [Green Version]
- Faude, O.; Kindermann, W.; Meyer, T. Lactate threshold concepts. Sports Med. 2009, 39, 469–490. [Google Scholar] [CrossRef] [PubMed]
- Wasserman, K.; McIlroy, M.B. Detecting the threshold of anaerobic metabolism in cardiac patients during exercise. Am. J. Cardiol. 1964, 14, 844–852. [Google Scholar] [CrossRef]
- Yoshida, T.; Udo, M.; Chida, M.; Ichioka, M.; Makiguchi, K.; Yamaguchi, T. Specificity of physiological adaptation to endurance training in distance runners and competitive walkers. Eur. J. Appl. Physiol. Occup. Physiol. 1990, 61, 197–201. [Google Scholar] [CrossRef]
- Acevedo, E.O.; Goldfarb, A.H. Increased training intensity effects on plasma lactate, ventilatory threshold, and endurance. Med. Sci. Sports Exerc. 1989, 21, 563–568. [Google Scholar] [CrossRef]
- Bosquet, L.; Léger, L.; Legros, P. Methods to determine aerobic endurance. Sports Med. 2002, 32, 675–700. [Google Scholar] [CrossRef] [PubMed]
- Yang, W.H.; Park, H.; Grau, M.; Heine, O. Decreased Blood Glucose and Lactate: Is a Useful Indicator of Recovery Ability in Athletes? Int. J. Environ. Res. Public Health 2020, 17, 5470. [Google Scholar] [CrossRef]
- Hill, A.; Lupton, H. Muscular exercise, lactic acid, and the supply and utilization of oxygen. QJM An. Int. J. Med. 1923, 16, 135–171. [Google Scholar] [CrossRef]
- Peterman, J.E.; Harber, M.P.; Imboden, M.T.; Whaley, M.H.; Fleenor, B.S.; Myers, J.; Arena, R.; Kaminsky, L.A. Accuracy of Exercise-based Equations for Estimating Cardiorespiratory Fitness. Med. Sci. Sports Exerc. 2021, 53, 74–82. [Google Scholar] [CrossRef] [PubMed]
- Mader, A. Zur beurteilung der sportartspezifischen ausdauerleistungsfahigkeit im labor. Sportarzt Sportmed 1976, 27, 80–88. [Google Scholar]
- Sjödin, B.; Jacobs, I.; Svedenhag, J. Changes in onset of blood lactate accumulation (OBLA) and muscle enzymes after training at OBLA. Eur. J. Appl. Physiol. Occup. Physiol. 1982, 49, 45–57. [Google Scholar] [CrossRef]
- Wahl, P.; Manunzio, C.; Vogt, F.; Strütt, S.; Volmary, P.; Bloch, W.; Mester, J. Accuracy of a Modified Lactate Minimum Test and Reverse Lactate Threshold Test to Determine Maximal Lactate Steady State. J. Strength Cond. Res. 2017, 31, 3489–3496. [Google Scholar] [CrossRef]
- Jamnick, N.A.; Pettitt, R.W.; Granata, C.; Pyne, D.B.; Bishop, D.J. An Examination and Critique of Current Methods to Determine Exercise Intensity. Sports Med. 2020, 50, 1729–1756. [Google Scholar] [CrossRef]
- Heck, H.; Mader, A.; Hess, G.; Muecke, S.; Mueller, R.; Hollmann, W. Justification of the 4mmol/l lactate threshold. Int. J. Sports Med. 1985, 6, 117–130. [Google Scholar] [CrossRef] [PubMed]
- Gonzalez, J.T.; Fuchs, C.J.; Betts, J.A.; Van Loon, L.J. Liver glycogen metabolism during and after prolonged endurance-type exercise. Am. J. Physiol. Endocrinol. Metab. 2016, 311, E543–E553. [Google Scholar] [CrossRef]
- Treff, G.; Winkert, K.; Sareban, M.; Steinacker, J.M.; Sperlich, B. The Polarization-Index: A Simple Calculation to Distinguish Polarized From Non-polarized Training Intensity Distributions. Front. Physiol. 2019, 10, 707. [Google Scholar] [CrossRef] [Green Version]
- Stöggl, T.L.; Sperlich, B. The training intensity distribution among well-trained and elite endurance athletes. Front. Physiol. 2015, 6, 295. [Google Scholar] [CrossRef] [Green Version]
- Barstow, T.J.; Casaburi, R.; Wasserman, K. O2 uptake kinetics and the O2 deficit as related to exercise intensity and blood lactate. J. Appl. Physiol. 1993, 75, 755–762. [Google Scholar] [CrossRef]
- Katz, A.; Sahlin, K. Role of oxygen in regulation of glycolysis and lactate production in human skeletal muscle. Exerc. Sport Sci. Rev. 1990, 18, 1–28. [Google Scholar] [CrossRef]
- Parolin, M.L.; Chesley, A.; Matsos, M.P.; Spriet, L.L.; Jones, N.L.; Heigenhauser, G.J. Regulation of skeletal muscle glycogen phosphorylase and PDH during maximal intermittent exercise. Am. J. Physiol.-Endocrinol. Metab. 1999, 277, E890–E900. [Google Scholar] [CrossRef]
- Vanhatalo, A.; Black, M.I.; DiMenna, F.J.; Blackwell, J.R.; Schmidt, J.F.; Thompson, C.; Wylie, L.J.; Mohr, M.; Bangsbo, J.; Krustrup, P.; et al. The mechanistic bases of the power-time relationship: Muscle metabolic responses and relationships to muscle fibre type. J. Physiol. 2016, 594, 4407–4423. [Google Scholar] [CrossRef] [PubMed]
- Romijn, J.A.; Coyle, E.F.; Sidossis, L.S.; Gastaldelli, A.; Horowitz, J.F.; Endert, E.; Wolfe, R.R. Regulation of endogenous fat and carbohydrate metabolism in relation to exercise intensity and duration. Am. J. Physiol. 1993, 265, E380–E391. [Google Scholar] [CrossRef] [Green Version]
- Hargreaves, M.; Spriet, L.L. Skeletal muscle energy metabolism during exercise. Nat. Metab. 2020, 2, 1–12. [Google Scholar] [CrossRef]
- Zapata-Lamana, R.; Henríquez-Olguín, C.; Burgos, C.; Meneses-Valdés, R.; Cigarroa, I.; Soto, C.; Fernández-Elías, V.E.; García-Merino, S.; Ramirez-Campillo, R.; García-Hermoso, A.; et al. Effects of Polarized Training on Cardiometabolic Risk Factors in Young Overweight and Obese Women: A Randomized-Controlled Trial. Front. Physiol. 2018, 9, 1287. [Google Scholar] [CrossRef] [Green Version]
- Coyle, E.F. Substrate utilization during exercise in active people. Am. J. Clin. Nutr. 1995, 61, 968S–979S. [Google Scholar] [CrossRef] [PubMed]
- Bülow, J.; Madsen, J. Influence of blood flow on fatty acid mobilization from lipolytically active adipose tissue. Pflug. Arch. 1981, 390, 169–174. [Google Scholar] [CrossRef]
- Beneke, R.; Leithäuser, R.M.; Ochentel, O. Blood lactate diagnostics in exercise testing and training. Int. J. Sports Physiol. Perform. 2011, 6, 8–24. [Google Scholar] [CrossRef] [PubMed] [Green Version]
- van Loon, L.J.; Koopman, R.; Stegen, J.H.; Wagenmakers, A.J.; Keizer, H.A.; Saris, W.H. Intramyocellular lipids form an important substrate source during moderate intensity exercise in endurance-trained males in a fasted state. J. Physiol. 2003, 553, 611–625. [Google Scholar] [CrossRef] [Green Version]
- Van Aggel-Leijssen, D.P.; Saris, W.H.; Hul, G.B.; Van Baak, M.A. Long-term effects of low-intensity exercise training on fat metabolism in weight-reduced obese men. Metabolism 2002, 51, 1003–1010. [Google Scholar] [CrossRef] [Green Version]
- van Aggel-Leijssen, D.P.; Saris, W.H.; Hul, G.B.; van Baak, M.A. Short-term effects of weight loss with or without low-intensity exercise training on fat metabolism in obese men. Am. J. Clin. Nutr. 2001, 73, 523–531. [Google Scholar] [CrossRef] [PubMed] [Green Version]
- Brooks, G.A. The lactate shuttle during exercise and recovery. Med. Sci. Sports Exerc. 1986, 18, 360–368. [Google Scholar] [CrossRef] [Green Version]
- Brooks, G.A. Current concepts in lactate exchange. Med. Sci. Sports Exerc. 1991, 23, 895–906. [Google Scholar] [CrossRef] [PubMed]
- Clore, J.N.; Glickman, P.S.; Helm, S.T.; Nestler, J.E.; Blackard, W.G. Evidence for dual control mechanism regulating hepatic glucose output in nondiabetic men. Diabetes Care 1991, 40, 1033–1040. [Google Scholar] [CrossRef]
- Chen, X.; Iqbal, N.; Boden, G. The effects of free fatty acids on gluconeogenesis and glycogenolysis in normal subjects. J. Clin. Investig. 1999, 103, 365–372. [Google Scholar] [CrossRef] [Green Version]
- Stöggl, T.; Sperlich, B. Polarized training has greater impact on key endurance variables than threshold, high intensity, or high volume training. Front. Physiol. 2014, 5, 33. [Google Scholar] [CrossRef] [PubMed] [Green Version]
- Stöggl, T.L. What is the best way to train to become a star endurance athlete. Front. Young Minds 2018, 6, 1–9. [Google Scholar] [CrossRef] [Green Version]
- Hommel, J.; Öhmichen, S.; Rudolph, U.M.; Hauser, T.; Schulz, H. Effects of six-week sprint interval or endurance training on calculated power in maximal lactate steady state. Biol. Sport 2019, 36, 47–54. [Google Scholar] [CrossRef] [PubMed]
- Tanaka, H.; Monahan, K.D.; Seals, D.R. Age-predicted maximal heart rate revisited. J. Am. Coll. Cardiol. 2001, 37, 153–156. [Google Scholar] [CrossRef] [Green Version]
- Abel, T.; Burkett, B.; Schneider, S.; Lindschulten, R.; Strüder, H.K. The exercise profile of an ultra-long handcycling race: The Styrkeprøven experience. Spinal Cord 2010, 48, 894–898. [Google Scholar] [CrossRef] [Green Version]
- Zeller, S.; Abel, T.; Smith, P.M.; Strueder, H.K. Influence of noncircular chainring on male physiological parameters in hand cycling. J. Rehabil. Res. Dev. 2015, 52, 211–220. [Google Scholar] [CrossRef]
- Quittmann, O.J.; Abel, T.; Zeller, S.; Foitschik, T.; Strüder, H.K. Lactate kinetics in handcycling under various exercise modalities and their relationship to performance measures in able-bodied participants. Eur. J. Appl. Physiol. 2018, 118, 1493–1505. [Google Scholar] [CrossRef]
- Bonaventura, J.M.; Sharpe, K.; Knight, E.; Fuller, K.L.; Tanner, R.K.; Gore, C.J. Reliability and accuracy of six hand-held blood lactate analysers. J. Sports Sci. Med. 2015, 14, 203–214. [Google Scholar]
- Tanner, R.K.; Fuller, K.L.; Ross, M.L. Evaluation of three portable blood lactate analysers: Lactate Pro, Lactate Scout and Lactate Plus. Eur. J. Appl. Physiol. 2010, 109, 551–559. [Google Scholar] [CrossRef]
- Cohen, J. A power primer. Psychol. Bull. 1992, 112, 155. [Google Scholar] [CrossRef]
- Tulppo, M.P.; Mäkikallio, T.H.; Takala, T.E.; Seppänen, T.; Huikuri, H.V. Quantitative beat-to-beat analysis of heart rate dynamics during exercise. Am. J. Physiol. 1996, 271, H244–H252. [Google Scholar] [CrossRef] [PubMed]
- Rezk, C.C.; Marrache, R.C.; Tinucci, T.; Mion, D., Jr.; Forjaz, C.L. Post-resistance exercise hypotension, hemodynamics, and heart rate variability: Influence of exercise intensity. Eur. J. Appl. Physiol. 2006, 98, 105–112. [Google Scholar] [CrossRef]
- Carter, J.B.; Banister, E.W.; Blaber, A.P. Effect of endurance exercise on autonomic control of heart rate. Sports Med. 2003, 33, 33–46. [Google Scholar] [CrossRef] [PubMed]
- Malfatto, G.; Branzi, G.; Riva, B.; Sala, L.; Leonetti, G.; Facchini, M. Recovery of cardiac autonomic responsiveness with low-intensity physical training in patients with chronic heart failure. Eur. J. Heart Fail. 2002, 4, 159–166. [Google Scholar] [CrossRef] [Green Version]
- Brenner, I.K.M.; Brown, C.A.; Hains, S.J.M.; Tranmer, J.; Zelt, D.T.; Brown, P.M. Low-Intensity Exercise Training Increases Heart Rate Variability in Patients With Peripheral Artery Disease. Biol. Res. Nurs. 2020, 22, 24–33. [Google Scholar] [CrossRef]
- Hua, L.P.; Brown, C.A.; Hains, S.J.; Godwin, M.; Parlow, J.L. Effects of low-intensity exercise conditioning on blood pressure, heart rate, and autonomic modulation of heart rate in men and women with hypertension. Biol. Res. Nurs. 2009, 11, 129–143. [Google Scholar] [CrossRef]
- Beneke, R.; Hütler, M. The effect of training on running economy and performance in recreational athletes. Med. Sci. Sports Exerc. 2005, 37, 1794–1799. [Google Scholar] [CrossRef] [PubMed] [Green Version]
- Kenneally, M.; Casado, A.; Gomez-Ezeiza, J.; Santos-Concejero, J. Training intensity distribution analysis by race pace vs. physiological approach in world-class middle- and long-distance runners. Eur. J. Sport Sci. 2020, 1–8. [Google Scholar] [CrossRef] [PubMed]
- Bergman, B.C.; Butterfield, G.E.; Wolfel, E.E.; Casazza, G.A.; Lopaschuk, G.D.; Brooks, G.A. Evaluation of exercise and training on muscle lipid metabolism. Am. J. Physiol. 1999, 276, E106–E117. [Google Scholar] [CrossRef]
- Bergman, B.C.; Butterfield, G.E.; Wolfel, E.E.; Lopaschuk, G.D.; Casazza, G.A.; Horning, M.A.; Brooks, G.A. Muscle net glucose uptake and glucose kinetics after endurance training in men. Am. J. Physiol. 1999, 277, E81–E92. [Google Scholar] [CrossRef]
- Bergman, B.C.; Wolfel, E.E.; Butterfield, G.E.; Lopaschuk, G.D.; Casazza, G.A.; Horning, M.A.; Brooks, G.A. Active muscle and whole body lactate kinetics after endurance training in men. J. Appl. Physiol. 1999, 87, 1684–1696. [Google Scholar] [CrossRef] [Green Version]
- Brooks, G.A.; Mercier, J. Balance of carbohydrate and lipid utilization during exercise: The “crossover” concept. J. Appl. Physiol. 1994, 76, 2253–2261. [Google Scholar] [CrossRef] [Green Version]
- Nielsen, H.B.; Clemmesen, J.O.; Skak, C.; Ott, P.; Secher, N.H. Attenuated hepatosplanchnic uptake of lactate during intense exercise in humans. J. Appl. Physiol. 2002, 92, 1677–1683. [Google Scholar] [CrossRef] [Green Version]
- Nielsen, H.B.; Febbraio, M.A.; Ott, P.; Krustrup, P.; Secher, N.H. Hepatic lactate uptake versus leg lactate output during exercise in humans. J. Appl. Physiol. 2007, 103, 1227–1233. [Google Scholar] [CrossRef] [PubMed] [Green Version]
- Flory, W.; Peczon, B.D.; Koeppe, R.E.; Spivey, H.O. Kinetic properties of rat liver pyruvate kinase at cellular concentrations of enzyme, substrates and modifiers. Biochem. J. 1974, 141, 127–131. [Google Scholar] [CrossRef] [Green Version]
- Oh, K.-J.; Han, H.-S.; Kim, M.-J.; Koo, S.-H. CREB and FoxO1: Two transcription factors for the regulation of hepatic gluconeogenesis. BMB Rep. 2013, 46, 567. [Google Scholar] [CrossRef] [PubMed] [Green Version]
- Williamson, J.R. Mechanism for the stimulation in vivo of hepatic gluconeogenesis by glucagon. Biochem. J. 1966, 101, 11C. [Google Scholar] [CrossRef] [Green Version]
- Henning, H.; Stumpf, B.; Ohly, B.; Seubert, W. On the mechanism of gluconeogenesis and its regulation. 3. The glucogenic capacity and the activities of pyruvate carboxylase and PEP-carboxylase of rat kidney and rat liver after cortisol treatment and starvation. Biochem. Z. 1966, 344, 274. [Google Scholar] [PubMed]
- Jungas, R.L.; Halperin, M.L.; Brosnan, J.T. Quantitative analysis of amino acid oxidation and related gluconeogenesis in humans. Physiol. Rev. 1992, 72, 419–448. [Google Scholar] [CrossRef]
- San-Millán, I.; Brooks, G.A. Assessment of Metabolic Flexibility by Means of Measuring Blood Lactate, Fat, and Carbohydrate Oxidation Responses to Exercise in Professional Endurance Athletes and Less-Fit Individuals. Sports Med. 2018, 48, 467–479. [Google Scholar] [CrossRef] [PubMed] [Green Version]
- Bosma, M. Lipid droplet dynamics in skeletal muscle. Exp. Cell Res. 2016, 340, 180–186. [Google Scholar] [CrossRef] [PubMed]


| Parameters | 30-min LIE Group (Mean ± SD) | 1-h LIE Group (Mean ± SD) | ||
|---|---|---|---|---|
| Pre-Test | Post-Test | Pre-Test | Post-Test | |
| Age (years) | 28.3 ± 2.0 | 28.8 ± 6.9 | ||
| Height (cm) | 173.5 ± 4.4 | 173.4 ± 3.9 | ||
| Body weight (kg) | 75.9 ± 9.9 | 76.1 ± 11.2 | 75.4 ± 8.9 | 75.7 ± 9.56 |
| Body fat (%) | 16.3 ± 3.9 | 16.4 ± 4.3 | 17.7 ± 5.9 | 17.8 ± 6.3 |
| BMI (kg∙m2) | 25.1 ± 2.2 | 25.2 ± 2.6 | 25.0 ± 2.3 | 25.1 ± 2.5 |
| Group | HR (Beats∙min−1) | % of HRmax | Jogging Speed (m∙s−1) |
|---|---|---|---|
| 30-min LIE group (n = 10) | 117 ± 10 | 66.6 ± 8.71 | 1.50 ± 0.31 |
| 1-h LIE group (n = 10) | 127 ± 16 | 62.2 ± 5.75 | 1.53 ± 0.14 |
| Parameters | 30-min LIE Group | % of 30-min G | 1-h LIE Group | % of 1-h G | Significance | Effect Size |
|---|---|---|---|---|---|---|
| Mean ± SD | Mean ± SD | Mean ± SD | Mean ± SD | p | d | |
| ∆HR1.5 (beats∙min−1) | −10.00 ± 19.35 | −5.20 ± 17.56 | 12.30 ± 27.72 | 14.99 ± 27.21 | 0.052 | 0.93 |
| ∆HR2.0 (beats∙min−1) | −9.20 ± 12.34 | −5.45 ± 8.79 | 9.20 ± 19.95 | 8.50 ± 16.58 | 0.023 * | 1.11 |
| ∆HR4.0 (beats∙min−1) | −2.70 ± 7.31 | −1.38 ± 4.18 | 0.80 ± 9.65 | 0.65 ± 5.80 | 0.37 | 0.41 |
| ∆S1.5 (m∙s−1) | −0.17 ± 0.45 | −6.76 ± 24.04 | 0.66 ± 0.45 | 51.66 ± 44.01 | <0.001 *** | 1.85 |
| ∆S2.0 (m∙s−1) | −0.09 ± 0.28 | −2.35 ± 14.20 | 0.52 ± 0.46 | 29.03 ± 27.32 | 0.002 ** | 1.58 |
| ∆S4.0 (m∙s−1) | 0.03 ± 0.34 | −1.93 ± 10.73 | 0.41 ± 0.29 | 15.31 ± 11.36 | 0.019 * | 1.16 |
Publisher’s Note: MDPI stays neutral with regard to jurisdictional claims in published maps and institutional affiliations. |
© 2021 by the authors. Licensee MDPI, Basel, Switzerland. This article is an open access article distributed under the terms and conditions of the Creative Commons Attribution (CC BY) license (http://creativecommons.org/licenses/by/4.0/).
Share and Cite
Lee, D.; Son, J.-Y.; Ju, H.-M.; Won, J.-H.; Park, S.-B.; Yang, W.-H. Effects of Individualized Low-Intensity Exercise and Its Duration on Recovery Ability in Adults. Healthcare 2021, 9, 249. https://doi.org/10.3390/healthcare9030249
Lee D, Son J-Y, Ju H-M, Won J-H, Park S-B, Yang W-H. Effects of Individualized Low-Intensity Exercise and Its Duration on Recovery Ability in Adults. Healthcare. 2021; 9(3):249. https://doi.org/10.3390/healthcare9030249
Chicago/Turabian StyleLee, Doowon, Ju-Yeon Son, Hyo-Myeong Ju, Ji-Hee Won, Seung-Bo Park, and Woo-Hwi Yang. 2021. "Effects of Individualized Low-Intensity Exercise and Its Duration on Recovery Ability in Adults" Healthcare 9, no. 3: 249. https://doi.org/10.3390/healthcare9030249