
The Effect of Using Participatory Working Time Scheduling Software on Employee Well-Being and Workability: A Cohort Study Analysed as a Pseudo-Experiment

 , , ,
, , ,
Abstract
:1. Introduction
2. Methods and Material
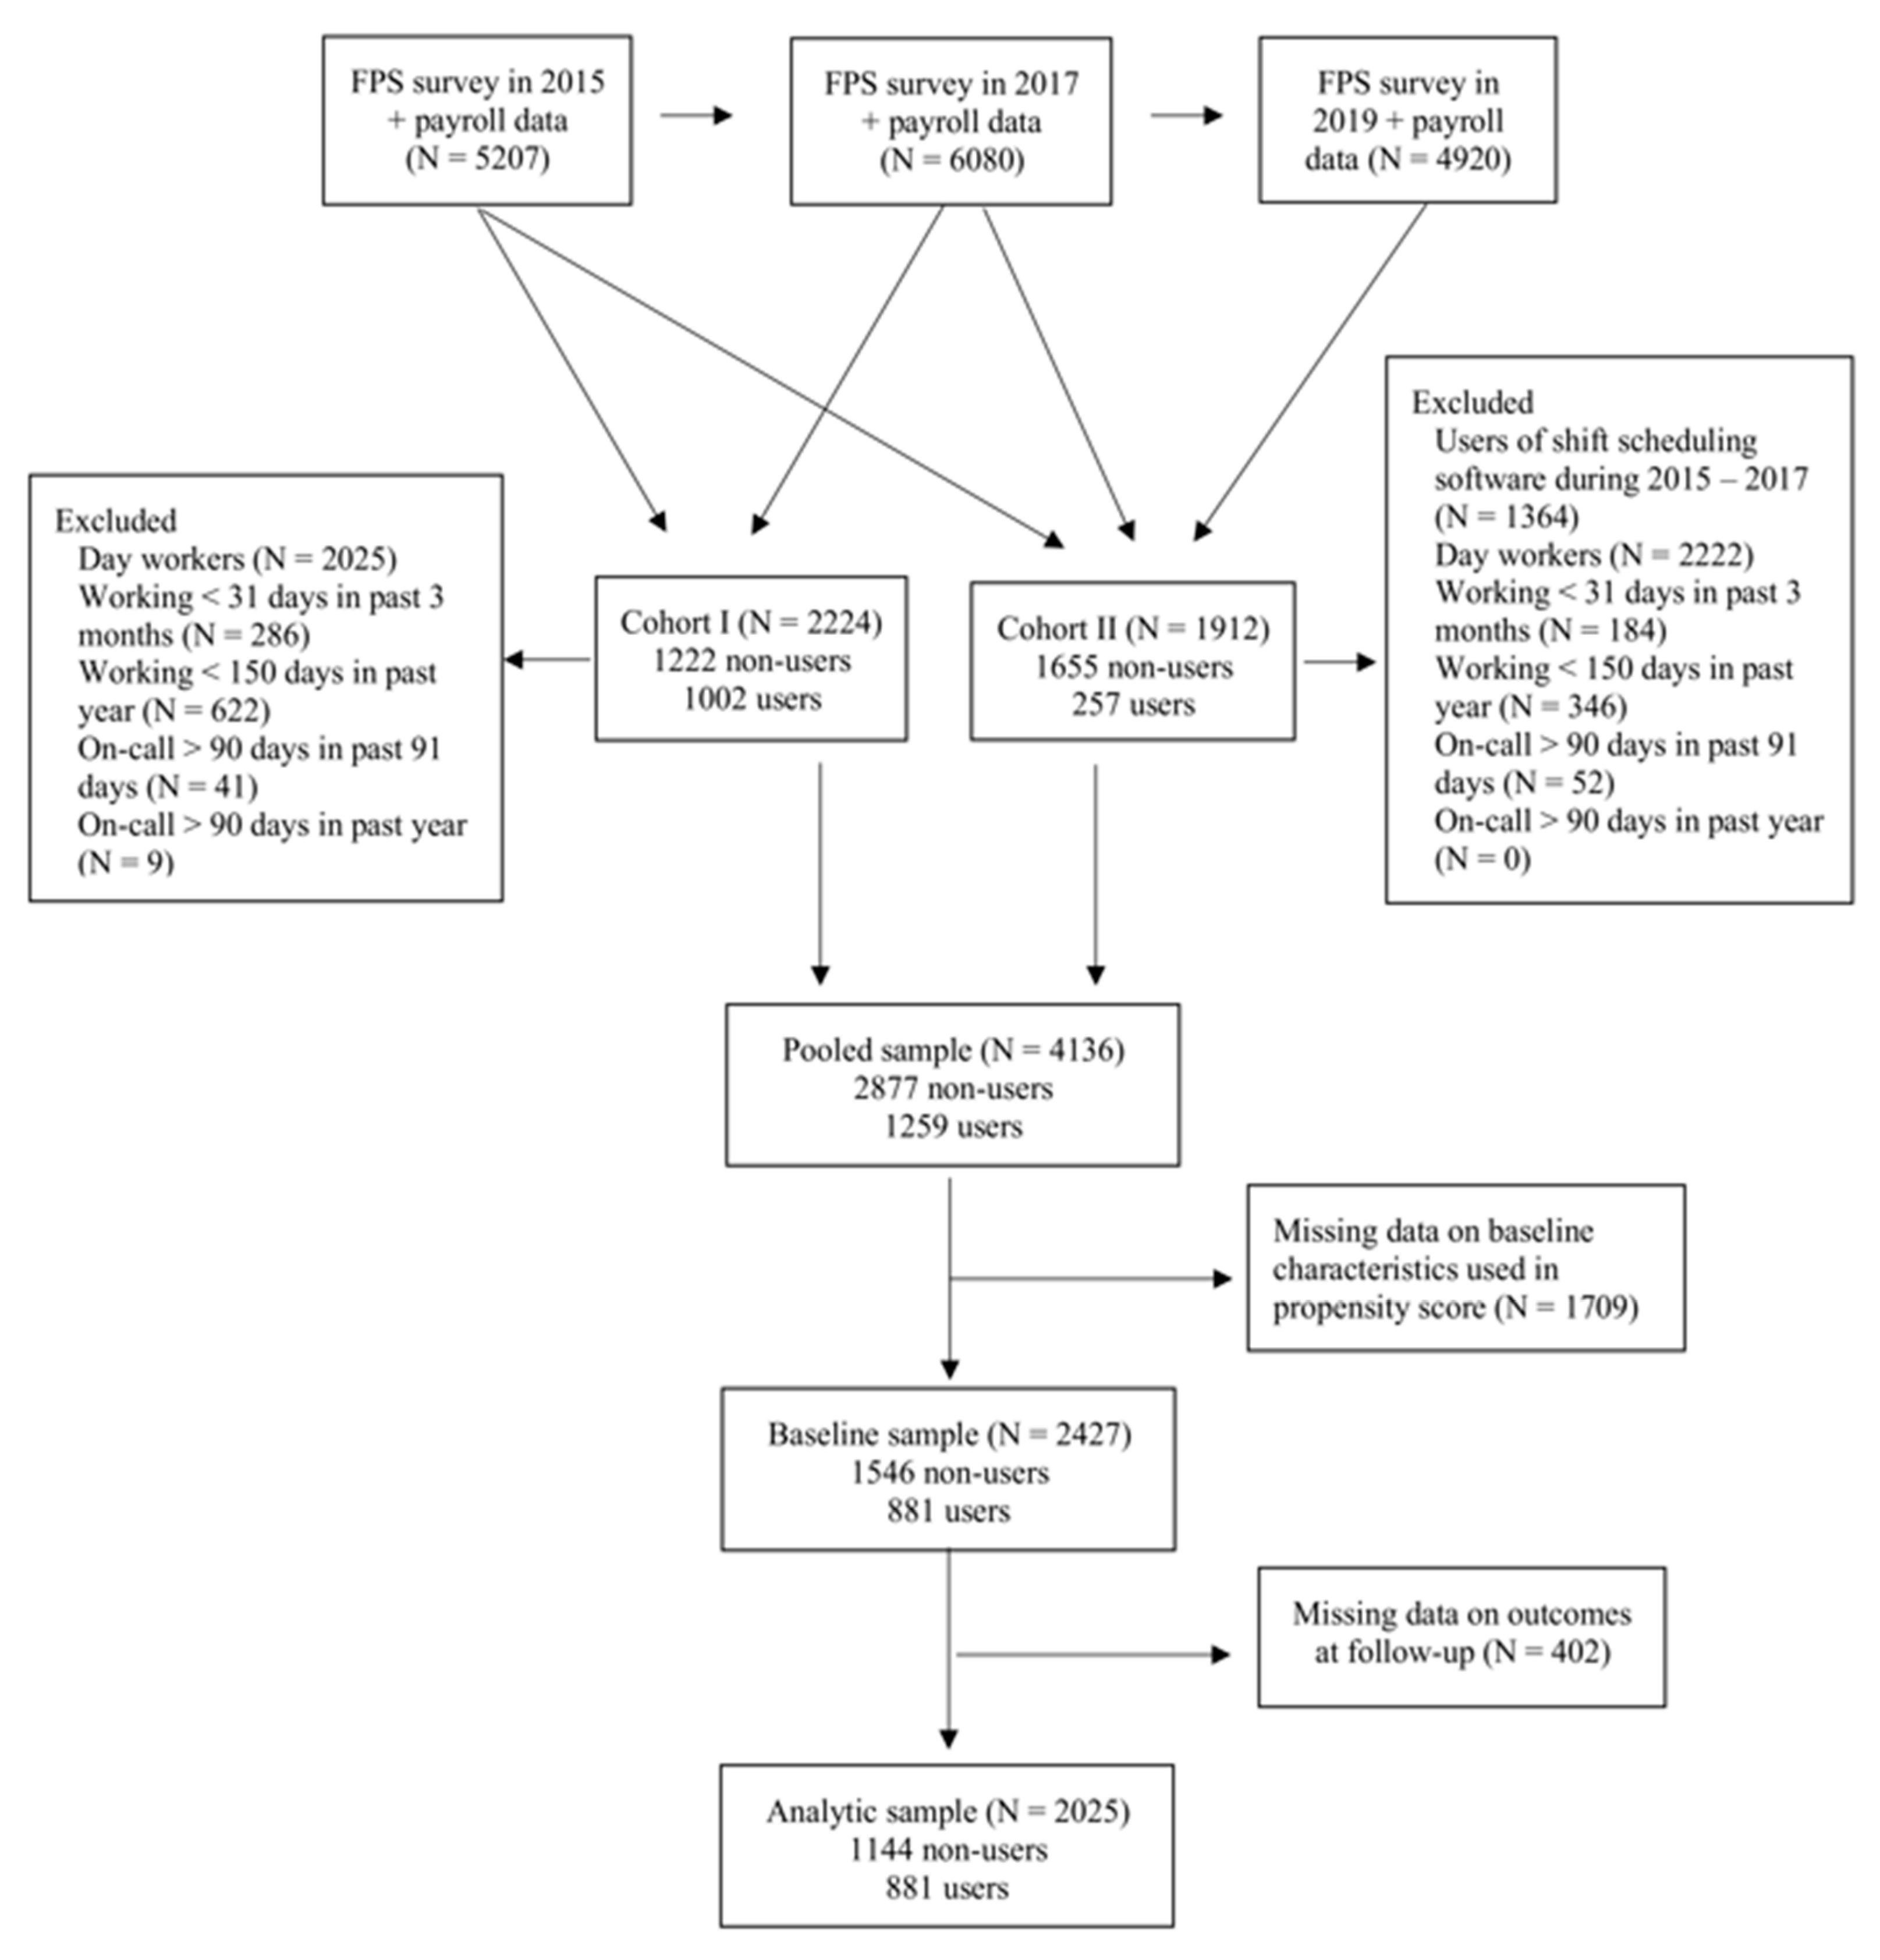
2.1. Population
2.2. Outcomes
2.3. Use of the Participatory Working Time Scheduling Software
2.4. Baseline Characteristics
2.5. Statistical Analysis
3. Results
4. Discussion
5. Conclusions
Author Contributions
Funding
Institutional Review Board Statement
Informed Consent Statement
Data Availability Statement
Conflicts of Interest
Appendix A

| Scale or Question | Items | Response Alternatives | Note |
|---|---|---|---|
| Control over scheduling of shifts [46] | How much are you able to influence your working hours? the scheduling of the shifts? | (1) very much (2) fairly much (3) to some extent (4) fairly little (5) very little | One item selected from the Ala-Mursula scale [46] |
| Workability [47] | Let’s assume that your workability at its all-time best would be given 10 points, and 0 points would indicate that you are completely unable to work. What point would you give to your current workability? | Scale from 0 to 10 | |
| Perceived health [48] | How is your health? | (1) good (2) fairly good (3) average (4) fairly poor (5) poor | |
| Work-life conflict [49] | How often you feel that your work takes too much time or energy from your family-life or life? | (1) does not apply/no family (2) never (3) rarely (4) sometimes (5) often (6) very often | Modified from the original questionnaire |
| Medical conditions [50] | Has a doctor ever treated you for, or told you that you had: (1) allergy (2) asthma (3) bronchitis (4) hypertension (5) heart disease (6) cerebrovascular disease (7) osteoarthritis (8) rheumatoid arthritis (9) low back pain (10) sciatica (11) peptic ulcer (12) migraine (13) depression (14) other mental disorders (15) diabetes (16) high cholesterol level (17) sleep apnoea | yes/no | 12 conditions were used in the current study. |
| Sleep duration [51] | How many hours do you usually sleep during a 24-h period? | (1) 6 h or less, (2) 6.5 h (3) 7 h (4) 7.5 h (5) 8 h (6) 8.5 h (7) 9 h (8) 9.5 h (9) 10 h or more | |
| Job strain [52] | Karasek Job Content Questionnaire (JCQ) was utilised. The questionnaire consists of 12 items. | (1) completely agree (2) somewhat agree (3) do not agree or disagree (4) somewhat disagree (5) completely disagree | |
| Retirement intention [53] | If you had the possibility to choose between continuing at work and retiring, what would you do? | (1) I would continue working (2) I would retire (3) I don´t know | Modified from the original questions |
| Stressful life-events [54] | The following section includes a list of life events anyone can be forced to face. Have any of them ever happened to you? If an event has occurred within the past 12 months, please indicate the month in which the event happened (use a corresponding number of the month). (1) divorce or separation (2) significant complications in personal finances (3) serious illness of spouse/partner (4) serious illness of own child (5) serious illness of mother or father (6) serious illness of another family member (7) death of spouse/partner (8) death of own child (9) death of mother or father (10) death of another family member (11) psychological violence (12) physical or sexual violence | yes/no | Eight items on serious illnesses and deaths are used in the current study. |
| Uncertainty at work | Are any of the following uncertainties connected to your work? (1) suspension of someone/some job duties (2) involuntary transfer to other tasks (3) the possibility of involuntary, temporary dismissal (4) the possibility dismissal (5) increase in workload beyond tolerance | (1) very little (2) fairly little (3) to some extent (4) quite a lot (5) very much | |
| Changes at work | When you think about the changes that have occurred at your workplace in the past year, how would you characterise your own situation from your point of view? | Scale from (1) the changes have been small and insignificant to (7) the changes have been large and significant | |
| Do you have an opportunity to be involved when changes affecting your work are planned? | (1) I can influence changes very much (2) I can influence some (3) changes usually take place unexpectedly without my ability to influence them | ||
| Discrimination at workplace | Is there discrimination in your workplace on the grounds of age, sex, education, opinion, status, origin, nationality, language, religion, belief, political activity, trade union activity, health, disability or sexual orientation? If so, has it targeted you in the last 12 months | yes/no yes/no | It was developed for the Finnish Public Sector study. |
| Outcome | <50 Years | ≥50 Years | ||||||
|---|---|---|---|---|---|---|---|---|
| Non-Users | Users | RR | 95% CI | Non-Users | Users | RR | 95% CI | |
| Control over scheduling of shifts | ||||||||
| Good | 242 | 350 | 1 | 121 | 130 | 1 | ||
| Intermediate or low | 428 | 223 | 0.64 | 0.51–0.80 | 347 | 175 | 0.80 | 0.70–0.91 |
| Control over scheduling of shifts | ||||||||
| Good or intermediate | 513 | 515 | 1 | 311 | 265 | 1 | ||
| Low | 157 | 58 | 0.34 | 0.24–0.48 | 157 | 40 | 0.47 | 0.31–0.73 |
| Perceived workability | ||||||||
| Good | 595 | 514 | 1 | 388 | 262 | 1 | ||
| Poor | 74 | 55 | 0.71 | 0.48–1.03 | 82 | 45 | 0.91 | 0.58–1.43 |
| Self-rated health | ||||||||
| Good | 645 | 553 | 1 | 445 | 287 | 1 | ||
| Poor | 24 | 20 | 0.66 | 0.36–1.21 | 27 | 17 | 1.11 | 0.55–2.24 |
| Work-life conflict | ||||||||
| No | 327 | 272 | 1 | 259 | 158 | 1 | ||
| Yes | 342 | 300 | 0.97 | 0.81–1.16 | 214 | 148 | 1.23 | 0.93–1.62 |
| Psychological distress | ||||||||
| No | 412 | 356 | 1 | 315 | 212 | 1 | ||
| Yes | 240 | 200 | 0.91 | 0.70–1.17 | 138 | 85 | 0.92 | 0.65–1.30 |
| Short sleep (≤6 h) | ||||||||
| No | 587 | 523 | 1 | 388 | 260 | 1 | ||
| Yes | 81 | 49 | 0.70 | 0.47–1.05 | 82 | 46 | 0.90 | 0.59–1.39 |
References
- Wilson, J.L. The impact of shift patterns on healthcare professionals. J. Nurs. Manag. 2002, 10, 211–219. [Google Scholar] [CrossRef]
- Qiu, D.; Yu, Y.; Li, R.Q.; Li, Y.L.; Xiao, S.Y. Prevalence of sleep disturbances in Chinese healthcare professionals: A systematic review and meta-analysis. Sleep Med. 2020, 67, 258–266. [Google Scholar] [CrossRef]
- Tucker, P.; Peristera, P.; Leineweber, C.; Kecklund, G. Can psychosocial working conditions help to explain the impact of shiftwork on health in male- and female-dominated occupations? A prospective cohort study. Chronobiol. Int. 2020, 37, 1348–1356. [Google Scholar] [CrossRef]
- Zhao, Y.; Richardson, A.; Poyser, C.; Butterworth, P.; Strazdins, L.; Leach, L.S. Shift work and mental health: A systematic review and meta-analysis. Int. Arch. Occup. Environ. Health 2019, 92, 763–793. [Google Scholar] [CrossRef] [PubMed]
- Karhula, K.; Koskinen, A.; Ojajärvi, A.; Ropponen, A.; Puttonen, S.; Kivimaki, M.; Harma, M. Are changes in objective working hour characteristics associated with changes in work-life conflict among hospital employees working shifts? A 7-year follow-up. Occup. Environ. Med. 2018, 75, 407–411. [Google Scholar] [CrossRef] [Green Version]
- Cheng, W.J.; Cheng, Y. Night shift and rotating shift in association with sleep problems, burnout and minor mental disorder in male and female employees. Occup. Environ. Med. 2017, 74, 483–488. [Google Scholar] [CrossRef] [PubMed]
- Winwood, P.C.; Winefield, A.H.; Lushington, K. Work-related fatigue and recovery: The contribution of age, domestic responsibilities and shiftwork. J. Adv. Nurs. 2006, 56, 438–449. [Google Scholar] [CrossRef] [PubMed]
- Bonnefond, A.; Härmä, M.; Hakola, T.; Sallinen, M.; Kandolin, I.; Virkkala, J. Interaction of age with shift-related sleep-wakefulness, sleepiness, performance, and social life. Exp. Aging Res. 2006, 32, 185–208. [Google Scholar] [CrossRef] [PubMed]
- Nijp, H.H.; Beckers, D.G.; Geurts, S.A.; Tucker, P.; Kompier, M.A. Systematic review on the association between employee worktime control and work–non-work balance, health and well-being, and job-related outcomes. Scand. J. Work. Environ. Health 2012, 38, 299–313. [Google Scholar] [CrossRef] [PubMed] [Green Version]
- Beckers, D.G.J.; Kompier, M.A.J.; Kecklund, G.; Härmä, M. Worktime control: Theoretical conceptualization, current empirical knowledge, and research agenda. Scand. J. Work. Environ. Health 2012, 38, 291–297. [Google Scholar] [CrossRef] [PubMed] [Green Version]
- Karasek, R. Job demands, job decision latitude, and mental strain: Implications for job redesign. Adm. Sci. Q. 1979, 24, 285–308. [Google Scholar] [CrossRef]
- Ray, T.K.; Pana-Cryan, R. Work flexibility and work-related well-being. Int. J. Environ. Res. Public Health 2021, 18, 3254. [Google Scholar] [CrossRef]
- Joyce, K.; Pabayo, R.; Critchley, J.A.; Bambra, C. Flexible working conditions and their effects on employee health and wellbeing. Cochrane Database Syst. Rev. 2010, 2010, CD008009. [Google Scholar] [CrossRef]
- Wynendaele, H.; Gemmel, P.; Peeters, E.; Myny, D.; Trybou, J. The effect of self-scheduling on organizational justice and work attitudes through leader-member exchange: A cross-sectional study using propensity scores. Int. J. Nurs. Stud. 2021, 122, 104032. [Google Scholar] [CrossRef]
- Ala-Mursula, L.; Vahtera, J.; Pentti, J.; Kivimäki, M. Effect of employee worktime control on health: A prospective cohort study. Occup. Environ. Med. 2004, 61, 254–261. [Google Scholar] [CrossRef] [Green Version]
- Schneider, D.; Harknett, K. Consequences of routine work-schedule instability for worker health and well-being. Am. Sociol. Rev. 2019, 84, 82–114. [Google Scholar] [CrossRef]
- Albrecht, S.C.; Kecklund, G.; Rajaleid, K.; Leineweber, C. The longitudinal relationship between control over working hours and depressive symptoms: Results from SLOSH, a population-based cohort study. J. Affect. Disord. 2017, 215, 143–151. [Google Scholar] [CrossRef] [PubMed]
- Takahashi, M.; Iwasaki, K.; Sasaki, T.; Kubo, T.; Mori, I.; Otsuka, Y. Sleep, fatigue, recovery, and depression after change in work time control: A one-year follow-up study. J. Occup. Environ. Med. 2012, 54, 1078–1085. [Google Scholar] [CrossRef] [PubMed]
- Yun, S.; Kim, M.; Lee, W.T.; Yoon, J.H.; Won, J.U. Irregular work hours and the risk of sleep disturbance among Korean service workers required to suppress emotion. Int. J. Environ. Res. Public Health 2021, 18, 1517. [Google Scholar] [CrossRef] [PubMed]
- Fusz, K.; Kívés, Z.; Pakai, A.; Kutfej, N.; Deák, A.; Olah, A. Health behavior, sleep quality and subjective health status among Hungarian nurses working varying shifts. Work 2021, 68, 171–180. [Google Scholar] [CrossRef] [PubMed]
- Hill, E.J.; Erickson, J.J.; Holmes, E.K.; Ferris, M. Workplace flexibility, work hours, and work-life conflict: Finding an extra day or two. J. Fam. Psychol. 2010, 24, 349–358. [Google Scholar] [CrossRef]
- Karhula, K.; Turunen, J.; Hakola, T.; Ojajarvi, A.; Puttonen, S.; Ropponen, A.; Kivimaki, M.; Harma, M. The effects of using participatory working time scheduling software on working hour characteristics and wellbeing: A quasi-experimental study of irregular shift work. Int. J. Nurs. Stud. 2020, 112, 103696. [Google Scholar] [CrossRef]
- Turunen, J.; Karhula, K.; Ropponen, A.; Koskinen, A.; Hakola, T.; Puttonen, S.; Hämäläinen, K.; Pehkonen, J.; Harma, M. The effects of using participatory working time scheduling software on sickness absence: A difference-in-differences study. Int. J. Nurs. Stud. 2020, 112, 103716. [Google Scholar] [CrossRef]
- Nabe-Nielsen, K.; Garde, A.H.; Diderichsen, F. The effect of work-time influence on health and well-being: A qua-si-experimental intervention study among eldercare workers. Int. Arch. Occup. Environ. Health 2011, 84, 683–695. [Google Scholar] [CrossRef]
- Garde, A.H.; Nabe-Nielsen, K.; Aust, B. Influence on working hours among shift workers and effects on sleep quality—An intervention study. Appl. Ergon. 2011, 42, 238–243. [Google Scholar] [CrossRef] [PubMed]
- Lu, C.Y. Observational studies: A review of study designs, challenges and strategies to reduce confounding. Int. J. Clin. Pract. 2009, 63, 691–697. [Google Scholar] [CrossRef] [PubMed]
- Austin, P.C.; Stuart, E.A. Moving towards best practice when using inverse probability of treatment weighting (IPTW) using the propensity score to estimate causal treatment effects in observational studies. Stat. Med. 2015, 34, 3661–3679. [Google Scholar] [CrossRef] [PubMed]
- King, G.; Nielsen, R. Why propensity scores should not be used for matching. Political Anal. 2019, 27, 435–454. [Google Scholar] [CrossRef] [Green Version]
- Ahlstrom, L.; Grimby-Ekman, A.; Hagberg, M.; Dellve, L. The work ability index and single-item question: Associations with sick leave, symptoms, and health—A prospective study of women on long-term sick leave. Scand. J. Work. Environ. Health 2010, 36, 404–412. [Google Scholar] [CrossRef] [PubMed] [Green Version]
- Robine, J.-M.; Jagger, C.; The Euro-Reves Group. Creating a coherent set of indicators to monitor health across Europe: The Euro-REVES 2 project. Eur. J. Public Health 2003, 13, 6–14. [Google Scholar] [CrossRef] [Green Version]
- Hankins, M. The reliability of the twelve-item general health questionnaire (GHQ-12) under realistic assumptions. BMC Public Health 2008, 8, 355. [Google Scholar] [CrossRef] [Green Version]
- Anjara, S.G.; Bonetto, C.; Van Bortel, T.; Brayne, C. Using the GHQ-12 to screen for mental health problems among primary care patients: Psychometrics and practical considerations. Int. J. Ment. Health Syst. 2020, 14, 62. [Google Scholar] [CrossRef]
- Leskinen, T.; Stenholm, S.; Pulakka, A.; Pentti, J.; Kivimäki, M.; Vahtera, J. Comparison between recent and long-term physical activity levels as predictors of cardiometabolic risk: A cohort study. BMJ Open 2020, 10, e033797. [Google Scholar] [CrossRef] [Green Version]
- Ainsworth, B.E.; Haskell, W.L.; Herrmann, S.D.; Meckes, N.; Bassett, D.R., Jr.; Tudor-Locke, C.; Greer, J.L.; Vezina, J.; Whitt-Glover, M.C.; Leon, A.S. 2011 Compendium of Physical Activities: A second update of codes and MET values. Med. Sci. Sports Exerc. 2011, 43, 1575–1581. [Google Scholar] [CrossRef] [Green Version]
- Shiri, R.; Lallukka, T.; Rahkonen, O.; Leino-Arjas, P. Excess body mass and leisure time physical activity in the incidence and persistence of chronic pain. Pain Med. 2020, 21, 3094–3101. [Google Scholar] [CrossRef] [PubMed]
- Laine, S.; Gimeno, D.; Virtanen, M.; Oksanen, T.; Vahtera, J.; Elovainio, M.; Koskinen, A.; Pentti, J.; Kivimaki, M. Job strain as a predictor of disability pension: The Finnish Public Sector Study. J. Epidemiol. Community Health 2009, 63, 24–30. [Google Scholar] [CrossRef] [PubMed]
- Gluschkoff, K.; Elovainio, M.; Hintsa, T.; Pentti, J.; Salo, P.; Kivimaki, M.; Vahtera, J. Organisational justice protects against the negative effect of workplace violence on teachers’ sleep: A longitudinal cohort study. Occup. Environ. Med. 2017, 74, 511–516. [Google Scholar] [CrossRef] [PubMed]
- Xu, S.; Ross, C.; Raebel, M.A.; Shetterly, S.; Blanchette, C.; Smith, D. Use of stabilized inverse propensity scores as weights to directly estimate relative risk and its confidence intervals. Value Health 2010, 13, 273–277. [Google Scholar] [CrossRef] [PubMed] [Green Version]
- Dong, J.; Zhang, J.L.; Zeng, S.; Li, F. Subgroup balancing propensity score. Stat. Methods Med Res. 2020, 29, 659–676. [Google Scholar] [CrossRef] [PubMed] [Green Version]
- Lian, Y.; Xiao, J.; Liu, Y.; Ning, L.; Guan, S.; Ge, H.; Li, F.; Liu, J. Associations between insomnia, sleep duration and poor work ability. J. Psychosom. Res. 2015, 78, 45–51. [Google Scholar] [CrossRef]
- Magnavita, N.; Garbarino, S. Sleep, health and wellness at work: A scoping review. Int. J. Environ. Res. Public Health 2017, 14, 1347. [Google Scholar] [CrossRef] [PubMed] [Green Version]
- Albrecht, S.C.; Kecklund, G.; Leineweber, C. The mediating effect of work-life interference on the relationship between work-time control and depressive and musculoskeletal symptoms. Scand. J. Work. Environ. Heal. 2020, 46, 469–479. [Google Scholar] [CrossRef] [Green Version]
- Lebreton, J.M.; Senter, J.L. Answers to 20 questions about interrater reliability and interrater agreement. Organ. Res. Methods 2008, 11, 815–852. [Google Scholar] [CrossRef]
- Li, F.; Zaslavsky, A.M.; Landrum, M.B. Propensity score weighting with multilevel data. Stat. Med. 2013, 32, 3373–3387. [Google Scholar] [CrossRef]
- Kahlert, J.; Gribsholt, S.B.; Gammelager, H.; Dekkers, O.M.; Luta, G. Control of confounding in the analysis phase—An over-view for clinicians. Clin. Epidemiol. 2017, 9, 195–204. [Google Scholar] [CrossRef] [Green Version]
- Ala-Mursula, L.; Vahtera, J.; Kivimaki, M.; Kevin, M.V.; Pentti, J. Employee control over working times: associations with subjective health and sickness absences. J. Epidemiology Community Heal. 2002, 56, 272–278. [Google Scholar] [CrossRef] [Green Version]
- Virtanen, M.; Kivimäki, M.; Elovainio, M.; Vahtera, J.; Ferrie, J.E. From insecure to secure employment: Changes in work, health, health related behaviours, and sickness absence. Occup. Environ. Med. 2003, 60, 948–953. [Google Scholar] [CrossRef] [PubMed]
- Blaxter, M. Evidence on inequality in health from a national survey. Lancet 1987, 2, 30–33. [Google Scholar] [CrossRef]
- Mårdberg, B.; Lundberg, U.; Frankenhaeuser, M. The total workload of parents employed in white-collar jobs: Construction of a questionnaire and a scoring system. Scand. J. Psychol. 1991, 32, 233–239. [Google Scholar] [CrossRef]
- Koskenvuo, M.; Kaprio, J.; Rose, R.J.; Kesaniemi, A.; Sarna, S.; Heikkilä, K.; Langinvainio, H. Hostility as a risk factor for mortality and ischemic heart disease in men. Psychosom. Med. 1988, 50, 330–340. [Google Scholar] [CrossRef] [PubMed]
- Härmä, M.; Karhula, K.; Puttonen, S.; Ropponen, A.; Koskinen, A.; Ojajärvi, A.; Kivimäki, M. Shift work with and without night work as a risk factor for fatigue and changes in sleep length: A cohort study with linkage to records on daily working hours. J. Sleep Res. 2019, 28, e12658. [Google Scholar] [CrossRef] [PubMed]
- Karasek, R.; Brisson, C.; Kawakami, N.; Houtman, I.; Bongers, P.; Amick, B. The Job Content Questionnaire (JCQ): An instrument for internationally comparative assessments of psychosocial job characteristics. J. Occup. Health Psychol. 1998, 3, 322–355. [Google Scholar] [CrossRef] [PubMed]
- Muurinen, C.; Laine, M.; Pentti, J.; Virtanen, M.; Salo, P.; Kivimäki, M.; Vahtera, J.; Oksanen, T. Vertical and Horizontal trust at work as predictors of retirement intentions: The Finnish Public Sector Study. PLoS ONE 2014, 9, e106956. [Google Scholar] [CrossRef] [PubMed]
- Dohrenwend, B.S.; Krasnoff, L.; Askenasy, A.R.; Dohrenwend, B.P. Exemplification of a method for scaling life events: The Peri Life Events Scale. J. Heal. Soc. Behav. 1978, 19, 205–229. [Google Scholar] [CrossRef]

| Characteristic | <50 Years (1499) | ≥50 Years (N = 928) | All (N = 2427) | |||
|---|---|---|---|---|---|---|
| N | % | N | % | N | % | |
| Female sex | 1330 | 88.7 | 849 | 91.5 | 2179 | 89.8 |
| Education | ||||||
| Primary or civic school | 2 | 0.1 | 100 | 10.8 | 102 | 4.2 |
| Middle or comprehensive school | 530 | 35.4 | 440 | 47.4 | 970 | 40.0 |
| Matriculation examination certificate | 967 | 64.5 | 388 | 41.8 | 1355 | 55.8 |
| Types of usual shift | ||||||
| Shift work without night shifts (two-shift work) | 392 | 26.1 | 381 | 41.1 | 773 | 31.8 |
| Shift work with night work (three-shift work) | 1019 | 68.0 | 464 | 50.0 | 1483 | 61.1 |
| Regular night work | 34 | 2.3 | 29 | 3.1 | 63 | 2.6 |
| Other irregular work | 54 | 3.6 | 54 | 5.8 | 108 | 4.5 |
| Smoking | ||||||
| Past | 401 | 26.8 | 224 | 24.1 | 625 | 25.8 |
| Current | 240 | 16.0 | 112 | 12.1 | 352 | 14.5 |
| Body mass index | ||||||
| Overweight | 468 | 31.2 | 359 | 38.7 | 827 | 34.1 |
| Obese | 295 | 19.7 | 225 | 24.3 | 520 | 21.4 |
| Job strain | 518 | 34.6 | 358 | 38.6 | 876 | 36.1 |
| Duration of sleep (hours) | ||||||
| Short (≤6) | 171 | 11.4 | 181 | 19.5 | 352 | 14.5 |
| Long (≥9) | 60 | 4.0 | 24 | 2.6 | 84 | 3.5 |
| Control over scheduling of shifts | ||||||
| Intermediate | 608 | 40.6 | 383 | 41.3 | 991 | 40.8 |
| Low | 281 | 18.8 | 271 | 29.2 | 552 | 22.7 |
| Poor perceived workability | 106 | 7.1 | 145 | 15.6 | 251 | 10.3 |
| Poor self-rated health | 23 | 1.5 | 33 | 3.6 | 56 | 2.3 |
| Work-life conflict | 677 | 45.2 | 384 | 41.4 | 1061 | 43.7 |
| Psychological distress (GHQ12 score ≥ 3) | 449 | 30.0 | 262 | 28.2 | 711 | 29.3 |
| Outcome | <50 Years (N = 1245) | ≥50 Years (N = 780) | All (N = 2025) | |||
|---|---|---|---|---|---|---|
| N | % | N | % | N | % | |
| Control over scheduling of shifts | ||||||
| High | 592 | 47.6 | 251 | 32.5 | 843 | 41.8 |
| Intermediate | 436 | 35.1 | 325 | 42.0 | 761 | 37.8 |
| Low | 215 | 17.3 | 197 | 25.5 | 412 | 20.4 |
| Perceived workability | ||||||
| Poor | 129 | 10.4 | 127 | 16.3 | 256 | 12.7 |
| Moderate or high | 1109 | 89.6 | 650 | 83.7 | 1759 | 87.3 |
| Self-rated health | ||||||
| Poor | 44 | 3.5 | 44 | 5.7 | 88 | 4.4 |
| Moderate or good | 1198 | 96.5 | 732 | 94.3 | 1930 | 95.6 |
| Work-life conflict | ||||||
| Yes | 642 | 51.7 | 362 | 46.5 | 1004 | 49.7 |
| No | 599 | 48.3 | 417 | 53.5 | 1016 | 50.3 |
| Psychological distress | ||||||
| Yes | 440 | 36.4 | 223 | 29.7 | 663 | 33.9 |
| No | 768 | 63.6 | 527 | 70.3 | 1295 | 66.1 |
| Sleep per night | ||||||
| ≤6 h | 130 | 10.5 | 128 | 16.5 | 258 | 12.8 |
| >6 h | 1110 | 89.5 | 648 | 83.5 | 1758 | 87.2 |
| Characteristic | Unweighted | Weighted | ||||||
|---|---|---|---|---|---|---|---|---|
| Users (%) | Non-Users (%) | Standardised Difference (%) | p | Users (%) | Non-Users (%) | Standardised Difference (%) | p | |
| Female sex | 89.2 | 90.1 | −2.9 | 0.48 | 89.2 | 90.6 | –4.4 | 0.28 |
| Age (years), mean | 43.3 | 45.0 | −15.8 | < 0.001 | 43.3 | 43.4 | −0.7 | 0.86 |
| Age ≥ 50 | 34.8 | 40.2 | −11.0 | 0.009 | 34.8 | 34.9 | −0.2 | 0.95 |
| Education | ||||||||
| Middle or comprehensive school | 30.5 | 45.3 | −30.9 | < 0.001 | 30.5 | 41.8 | −23.4 | < 0.001 |
| Matriculation examination certificate | 67.4 | 49.2 | 37.5 | < 0.001 | 67.4 | 54.3 | 27.0 | < 0.001 |
| Part-time job | 6.4 | 11.8 | −18.9 | < 0.001 | 6.4 | 9.4 | −10.5 | 0.010 |
| Being a supervisor | 2.3 | 3.0 | −4.8 | 0.26 | 2.3 | 2.4 | −0.5 | 0.89 |
| Types of usual shift | ||||||||
| Shift work with night work (three-shift work) | 75.0 | 53.2 | 46.8 | < 0.001 | 75.0 | 64.6 | 22.3 | < 0.001 |
| Other shifts | 6.0 | 7.6 | −6.5 | 0.13 | 6.0 | 6.1 | −0.6 | 0.96 |
| Current smoking | 14.6 | 14.4 | 0.6 | 0.88 | 14.6 | 13.5 | 3.3 | 0.42 |
| Alcohol consumption | 46.3 | 42.9 | 6.9 | 0.10 | 46.3 | 44.2 | 4.2 | 0.32 |
| Leisure time physical activity | ||||||||
| Moderate | 29.9 | 33.6 | −8.1 | 0.055 | 29.9 | 30.0 | −0.3 | 0.95 |
| Strenuous | 37.1 | 33.1 | 8.4 | 0.046 | 37.1 | 38.1 | −2.1 | 0.62 |
| Body mass index, mean | 26.2 | 26.9 | −13.4 | 0.002 | 26.2 | 26.4 | −4.1 | 0.32 |
| Job demands | 65.0 | 64.1 | 2.0 | 0.64 | 65.0 | 65.5 | −0.9 | 0.82 |
| Job strain | 31.9 | 38.5 | −13.8 | 0.001 | 31.9 | 35.3 | −7.2 | 0.087 |
| Procedural justice | ||||||||
| Intermediate | 38.8 | 35.3 | 7.4 | 0.079 | 38.8 | 36.8 | 4.1 | 0.32 |
| Low | 41.7 | 35.2 | 13.3 | 0.002 | 41.7 | 37.1 | 9.4 | 0.026 |
| Control over scheduling of shifts | ||||||||
| Intermediate | 39.4 | 41.7 | −4.6 | 0.27 | 39.4 | 42.0 | −5.3 | 0.20 |
| Low | 16.2 | 26.5 | −25.1 | < 0.001 | 16.2 | 21.2 | −12.1 | 0.003 |
| Poor perceived workability | 9.3 | 10.9 | −5.4 | 0.20 | 9.3 | 9.4 | −0.3 | 0.95 |
| Poor self-rated health | 2.2 | 2.4 | −1.6 | 0.70 | 2.2 | 2.4 | −1.5 | 0.73 |
| Work-life conflict | 45.3 | 42.8 | 5.0 | 0.23 | 45.3 | 44.2 | 2.2 | 0.60 |
| Psychological distress | 29.5 | 29.2 | 0.7 | 0.86 | 29.5 | 28.2 | 2.8 | 0.50 |
| Duration of sleep (hours) | ||||||||
| Short (≤6) | 13.1 | 15.3 | −6.5 | 0.12 | 13.1 | 14.4 | −3.9 | 0.34 |
| Long (≥9) | 4.5 | 2.8 | 9.0 | 0.028 | 4.5 | 3.4 | 5.9 | 0.17 |
| Chronic diseases | ||||||||
| Allergy | 32.7 | 28.2 | 9.8 | 0.020 | 32.7 | 30.6 | 4.5 | 0.29 |
| Bronchitis | 2.2 | 3.9 | −10.1 | 0.021 | 2.2 | 3.2 | −6.0 | 0.14 |
| Hypertension | 15.9 | 21.3 | −13.9 | 0.001 | 15.9 | 17.8 | −5.0 | 0.22 |
| Rheumatoid arthritis | 1.4 | 1.8 | −3.1 | 0.46 | 1.4 | 1.3 | 0.3 | 0.93 |
| Low back pain or sciatica | 17.3 | 17.2 | 0.3 | 0.94 | 17.3 | 17.8 | −1.3 | 0.75 |
| Migraine | 20.9 | 17.5 | 8.7 | 0.038 | 20.9 | 21.9 | −2.7 | 0.54 |
| Mental disorders | 11.8 | 10.3 | 4.8 | 0.24 | 11.8 | 10.8 | 3.1 | 0.46 |
| Diabetes | 2.6 | 3.1 | −3.0 | 0.48 | 2.6 | 2.8 | −1.2 | 0.76 |
| Sleep apnea | 0.8 | 2.1 | −10.7 | 0.016 | 0.8 | 1.5 | −6.0 | 0.127 |
| Changes at work | ||||||||
| Medium | 44.7 | 40.2 | 9.1 | 0.031 | 44.7 | 45.1 | −0.8 | 0.85 |
| Large | 39.5 | 41.8 | −4.7 | 0.27 | 39.5 | 39.5 | 0.1 | 0.98 |
| Employee’s influence on changes at work | ||||||||
| Small | 47.7 | 45.7 | 4.0 | 0.34 | 47.7 | 48.0 | −0.6 | 0.87 |
| None | 49.3 | 51.7 | −4.8 | 0.25 | 49.3 | 49.7 | −0.9 | 0.83 |
| Outcome | <50 Years | ≥50 Years | All | |||||||||
|---|---|---|---|---|---|---|---|---|---|---|---|---|
| Non-Users | Users | RR | 95% CI | Non-Users | Users | RR | 95% CI | Non-Users | Users | RR | 95% CI | |
| Control over scheduling of shifts | ||||||||||||
| Good | 242 | 350 | 1 | 121 | 130 | 1 | 363 | 480 | 1 | |||
| Intermediate or low | 428 | 223 | 0.70 | 0.53–0.91 | 347 | 175 | 0.79 | 0.69–0.91 | 775 | 398 | 0.72 | 0.60–0.85 |
| Control over scheduling of shifts | ||||||||||||
| Good or intermediate | 513 | 515 | 1 | 311 | 265 | 1 | 824 | 780 | 1 | |||
| Low | 157 | 58 | 0.30 | 0.20–0.44 | 157 | 40 | 0.44 | 0.29–0.69 | 314 | 98 | 0.34 | 0.25–0.46 |
| Perceived workability | ||||||||||||
| Good | 595 | 514 | 1 | 388 | 262 | 1 | 983 | 776 | 1 | |||
| Poor | 74 | 55 | 0.73 | 0.48–1.10 | 82 | 45 | 0.84 | 0.56–1.25 | 156 | 100 | 0.74 | 0.55–0.99 |
| Perceived health | ||||||||||||
| Good | 645 | 553 | 1 | 445 | 287 | 1 | 1090 | 840 | 1 | |||
| Poor | 24 | 20 | 0.72 | 0.39–1.33 | 27 | 17 | 1.21 | 0.51–2.91 | 51 | 37 | 0.88 | 0.51–1.52 |
| Work-life conflict | ||||||||||||
| No | 327 | 272 | 1 | 259 | 158 | 1 | 586 | 430 | 1 | |||
| Yes | 342 | 300 | 0.95 | 0.76–1.19 | 214 | 148 | 1.18 | 0.98–1.43 | 556 | 448 | 1.03 | 0.87–1.23 |
| Psychological distress | ||||||||||||
| No | 412 | 356 | 1 | 315 | 212 | 1 | 727 | 568 | 1 | |||
| Yes | 240 | 200 | 0.79 | 0.58–1.06 | 138 | 85 | 0.87 | 0.66–1.14 | 378 | 285 | 0.83 | 0.66–1.05 |
| Short sleep (≤6 h) | ||||||||||||
| No | 587 | 523 | 1 | 388 | 260 | 1 | 975 | 783 | 1 | |||
| Yes | 81 | 49 | 0.65 | 0.42–0.99 | 82 | 46 | 0.86 | 0.58–1.26 | 163 | 95 | 0.70 | 0.52–0.95 |
Publisher’s Note: MDPI stays neutral with regard to jurisdictional claims in published maps and institutional affiliations. |
© 2021 by the authors. Licensee MDPI, Basel, Switzerland. This article is an open access article distributed under the terms and conditions of the Creative Commons Attribution (CC BY) license (https://creativecommons.org/licenses/by/4.0/).
Share and Cite
Shiri, R.; Karhula, K.; Turunen, J.; Koskinen, A.; Ropponen, A.; Ervasti, J.; Kivimäki, M.; Härmä, M. The Effect of Using Participatory Working Time Scheduling Software on Employee Well-Being and Workability: A Cohort Study Analysed as a Pseudo-Experiment. Healthcare 2021, 9, 1385. https://doi.org/10.3390/healthcare9101385
Shiri R, Karhula K, Turunen J, Koskinen A, Ropponen A, Ervasti J, Kivimäki M, Härmä M. The Effect of Using Participatory Working Time Scheduling Software on Employee Well-Being and Workability: A Cohort Study Analysed as a Pseudo-Experiment. Healthcare. 2021; 9(10):1385. https://doi.org/10.3390/healthcare9101385
Chicago/Turabian StyleShiri, Rahman, Kati Karhula, Jarno Turunen, Aki Koskinen, Annina Ropponen, Jenni Ervasti, Mika Kivimäki, and Mikko Härmä. 2021. "The Effect of Using Participatory Working Time Scheduling Software on Employee Well-Being and Workability: A Cohort Study Analysed as a Pseudo-Experiment" Healthcare 9, no. 10: 1385. https://doi.org/10.3390/healthcare9101385