Article

EASY-NET Program: Effectiveness of an Audit and Feedback Intervention in the Emergency Care for Acute Conditions in the Lazio Region

1
Department of Epidemiology, Regional Health Service–Lazio, Via Cristoforo Colombo, 112, 00147 Rome, Italy
2
Management and Health Laboratory, Institute of Management, Department Embeds, Sant’Anna School of Advanced Studies, Scuola Superiore Sant’Anna, 56127 Pisa, Italy
3
Critical Pathways and Evaluation Outcome Unit, Fondazione Policlinico Universitario “A. Gemelli”—IRCCS, 00168 Rome, Italy
4
Faculty of Economics, Università Cattolica del Sacro Cuore, 00168 Rome, Italy
5
Area Rete Ospedaliera E Specialistica, Direzione Regionale Salute E Integrazione Sociosanitaria Regione Lazio, 00168 Rome, Italy
*
Author to whom correspondence should be addressed.
Healthcare 2024, 12(7), 733; https://doi.org/10.3390/healthcare12070733
Submission received: 22 February 2024 / Revised: 19 March 2024 / Accepted: 25 March 2024 / Published: 27 March 2024

Abstract

:
The EASY-NET network program (NET-2016-02364191)—effectiveness of audit and feedback (A&F) strategies to improve health practice and equity in various clinical and organizational settings), piloted a novel and more structured A&F strategy. This study compared the effectiveness of the novel strategy against the sole periodic dissemination of indicators in enhancing the appropriateness and timeliness of emergency health interventions for patients diagnosed with acute myocardial infarction (AMI) and ischemic stroke in the Lazio Region. The efficacy of the intervention was assessed through a prospective quasi-experimental design employing a pre- and post-intervention (2021–2022) comparison with a control group. Participating hospitals in the Lazio Region, where professional teams voluntarily engaged in the intervention, constituted the exposed group, while the control group exclusively engaged in routine reporting activities. Effectiveness analysis was conducted at the patient level, utilizing regional health information systems to compute process and outcome indicators. The effectiveness of the intervention was evaluated using difference-in-difference models, comparing pre- and post-intervention periods between exposed and control groups. Estimates were calculated in terms of the difference in percentage points (PP) between absolute risks. Sixteen facilities for the AMI pathway and thirteen for the stroke pathway participated in the intervention. The intervention yielded a reduction in the proportion of 30-day readmissions following hospitalization for ischemic stroke by 0.54 pp in the exposed patients demonstrating a significant difference of −3.80 pp (95% CI: −6.57; −1.03; 5453 patients, 63.7% cases) in the exposed group compared to controls. However, no statistically significant differences attributable to the implemented A&F intervention were observed in other indicators considered. These results represent the first evidence in Italy of the impact of A&F interventions in an emergency setting, utilizing aggregated data from hospitals involved in the Lazio Region’s emergency network.

1. Introduction

There is extensive evidence from every country that there is a gap between the healthcare that patients receive and the recommended practice. Specifically, in Italy there is clear evidence of wide variability among health facilities in health processes and outcomes [1,2].
Audit and feedback (A&F) is a proven and widely used methodology for improving the continuous quality of healthcare. It is essentially based on two aspects: audit, a systematic review of the quality of processes and outcomes of care aimed at identifying and measuring critical issues through the definition of criteria, indicators, and standards to compare, and feedback, returning the summary reports of the results of performance evaluation to health professionals involved to promote change [3,4,5,6,7].
A&F interventions produce improvements in the professional practice to varying degrees [3,4,5]. A Cochrane review published in 2012 concludes that A&F is effective with an absolute improvement of 4.3% (range interquartile 0.5; 16%) in adherence to evidence-based clinical practice recommendations. The change seems modest in absolute terms, but the cumulative gain resulting from repeated cycles of A&F can lead to large transformations. The ways in which A&F is implemented are widely varied among different studies and contexts, [8,9,10] and, moreover, the scientific progress on these important aspects over the last 20 years has been minimal [11,12,13].
The effectiveness of A&F can be increased if the feedback is posed by a colleague or supervisor, if it is performed more than once, if it is offered in both verbal and written form, and if it includes specific goals to achieve and an action plan to implement the changes. These and other recommendations on how to perform A&F optimally were the subject of a recent paper published by Brehaut et al. [14].
The experience of the ASPIRE (Action to Support Practice Implement Research Evidence) project in the UK provided concrete evidence of effectiveness on a high burden disease and applied to larger populations through recommendation packages also based on the A&F tool, as it resulted in the management of chronic pain in primary care [15].
The evidence on how well these recommendations is actually applied in A&F practice is still scarce [16].
In Italy, the utilization of A&F strategies remains limited in certain contexts and is infrequently documented in scientific studies. Remarkably, among the 140 studies scrutinized in the 2012 Cochrane review [11], merely one was conducted in Italy. This stark discrepancy poses significant challenges regarding the transferability of meta-analysis efficacy findings to the Italian context. Consequently, there is a pressing need to conduct experimental studies that delve into both general and context-specific barriers and facilitators.
As part of the EASY-NET project (NET-2016-02364191) [17,18], Work Package 1 (WP1) Lazio Emergency, led by the Department of Epidemiology of the Regional Health Service (RHS)—known as DEP Lazio—conducted a comparative analysis of the effectiveness in enhancing the appropriateness and timeliness of emergency healthcare interventions for acute myocardial infarction (AMI) and ischemic stroke. This comparison was between a structured A&F strategy and the voluntary consultation of numerous process and outcome indicators, updated annually (referred to as the “standard strategy”), facilitated through a dedicated regional web platform named P.Re.Val.E (Programma Regionale Valutazione Esiti—Regional Program for Outcomes and Processes Evaluation) [2].
In the “standard strategy”, feedback is provided to providers through web publications, with no additional initiatives offered by DEP Lazio. Within the WP1 Lazio Emergency project, a structured A&F intervention has been developed, incorporating the latest evidence in the field to optimize these strategies [14,19,20].
In 2021, Lazio reported 7766 hospitalizations for acute myocardial infarction (AMI) and 3249 for ST-elevation myocardial infarction (STEMI) [2]. The number of hospitalizations for AMI and STEMI appear to have been progressively declining over the past decade, aligning with national and international trends [1]. Furthermore, 30-day mortality, an indicator reflecting, at least in part, the quality of patient care provided, seems to have decreased in recent years for both AMI and STEMI cases [21]. Updated analyses for the Lazio Region up to 2021 indicate a reduction from 9.7 percent to 7.6 percent and from 11.1 percent to 8.8 percent, respectively, compared to 2012 [2,22].
The objective of this study is to conduct a quantitative assessment of the effectiveness of an experimental A&F intervention compared to the “standard strategy” in enhancing the appropriateness and timeliness of emergency healthcare interventions for patients with AMI and stroke in the Lazio Region.

2. Materials and Methods

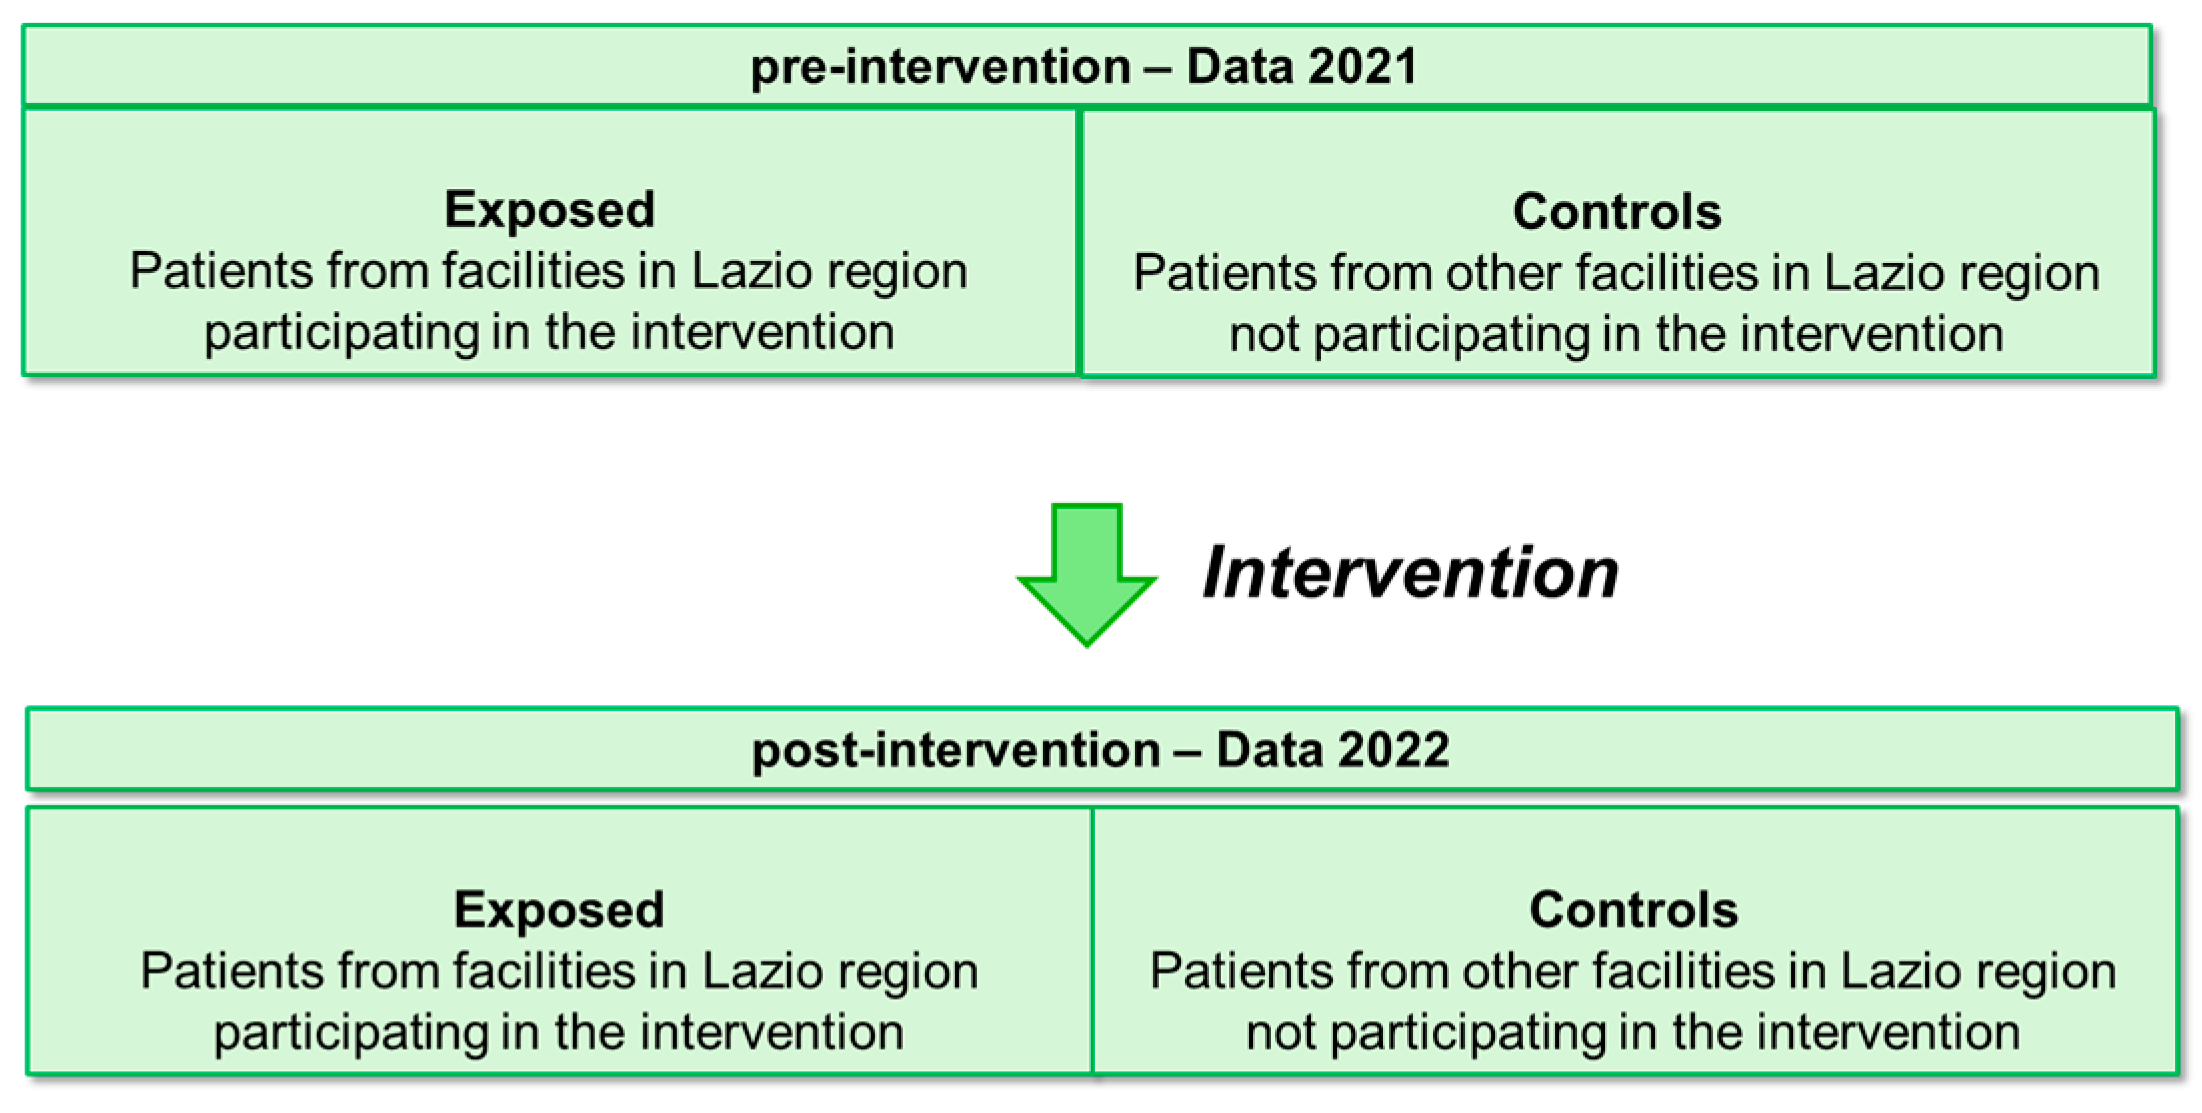
2.1. Study Design, Participants, and Patients

The quantitative assessment of effectiveness was carried out through a prospective quasi-experimental pre- and post-intervention study with a control group. The pre- and post-intervention periods considered were the years 2021 and 2022, respectively.
The participants in the intervention, commonly referred to as “recipients”, are teams of professionals, including clinical specialists and healthcare managers, engaged in emergency care for patients with AMI or stroke at hospitals in the Lazio Region. The hospitals exposed to the intervention voluntarily participated in the following formal invitations. The control group engaged in standard reporting activities.
The effectiveness analysis was conducted at the patient level. Thus, during the two periods, before and after the intervention, patients admitted for AMI and/or stroke to hospitals participating in the intervention were considered exposed, while patients admitted for AMI and stroke to hospitals not participating in the intervention served as controls (see Figure 1).
The pre- and post-intervention periods were compared between the exposed group and the controls using two process and/or outcome indicators of greatest interest per condition, as listed below:
-
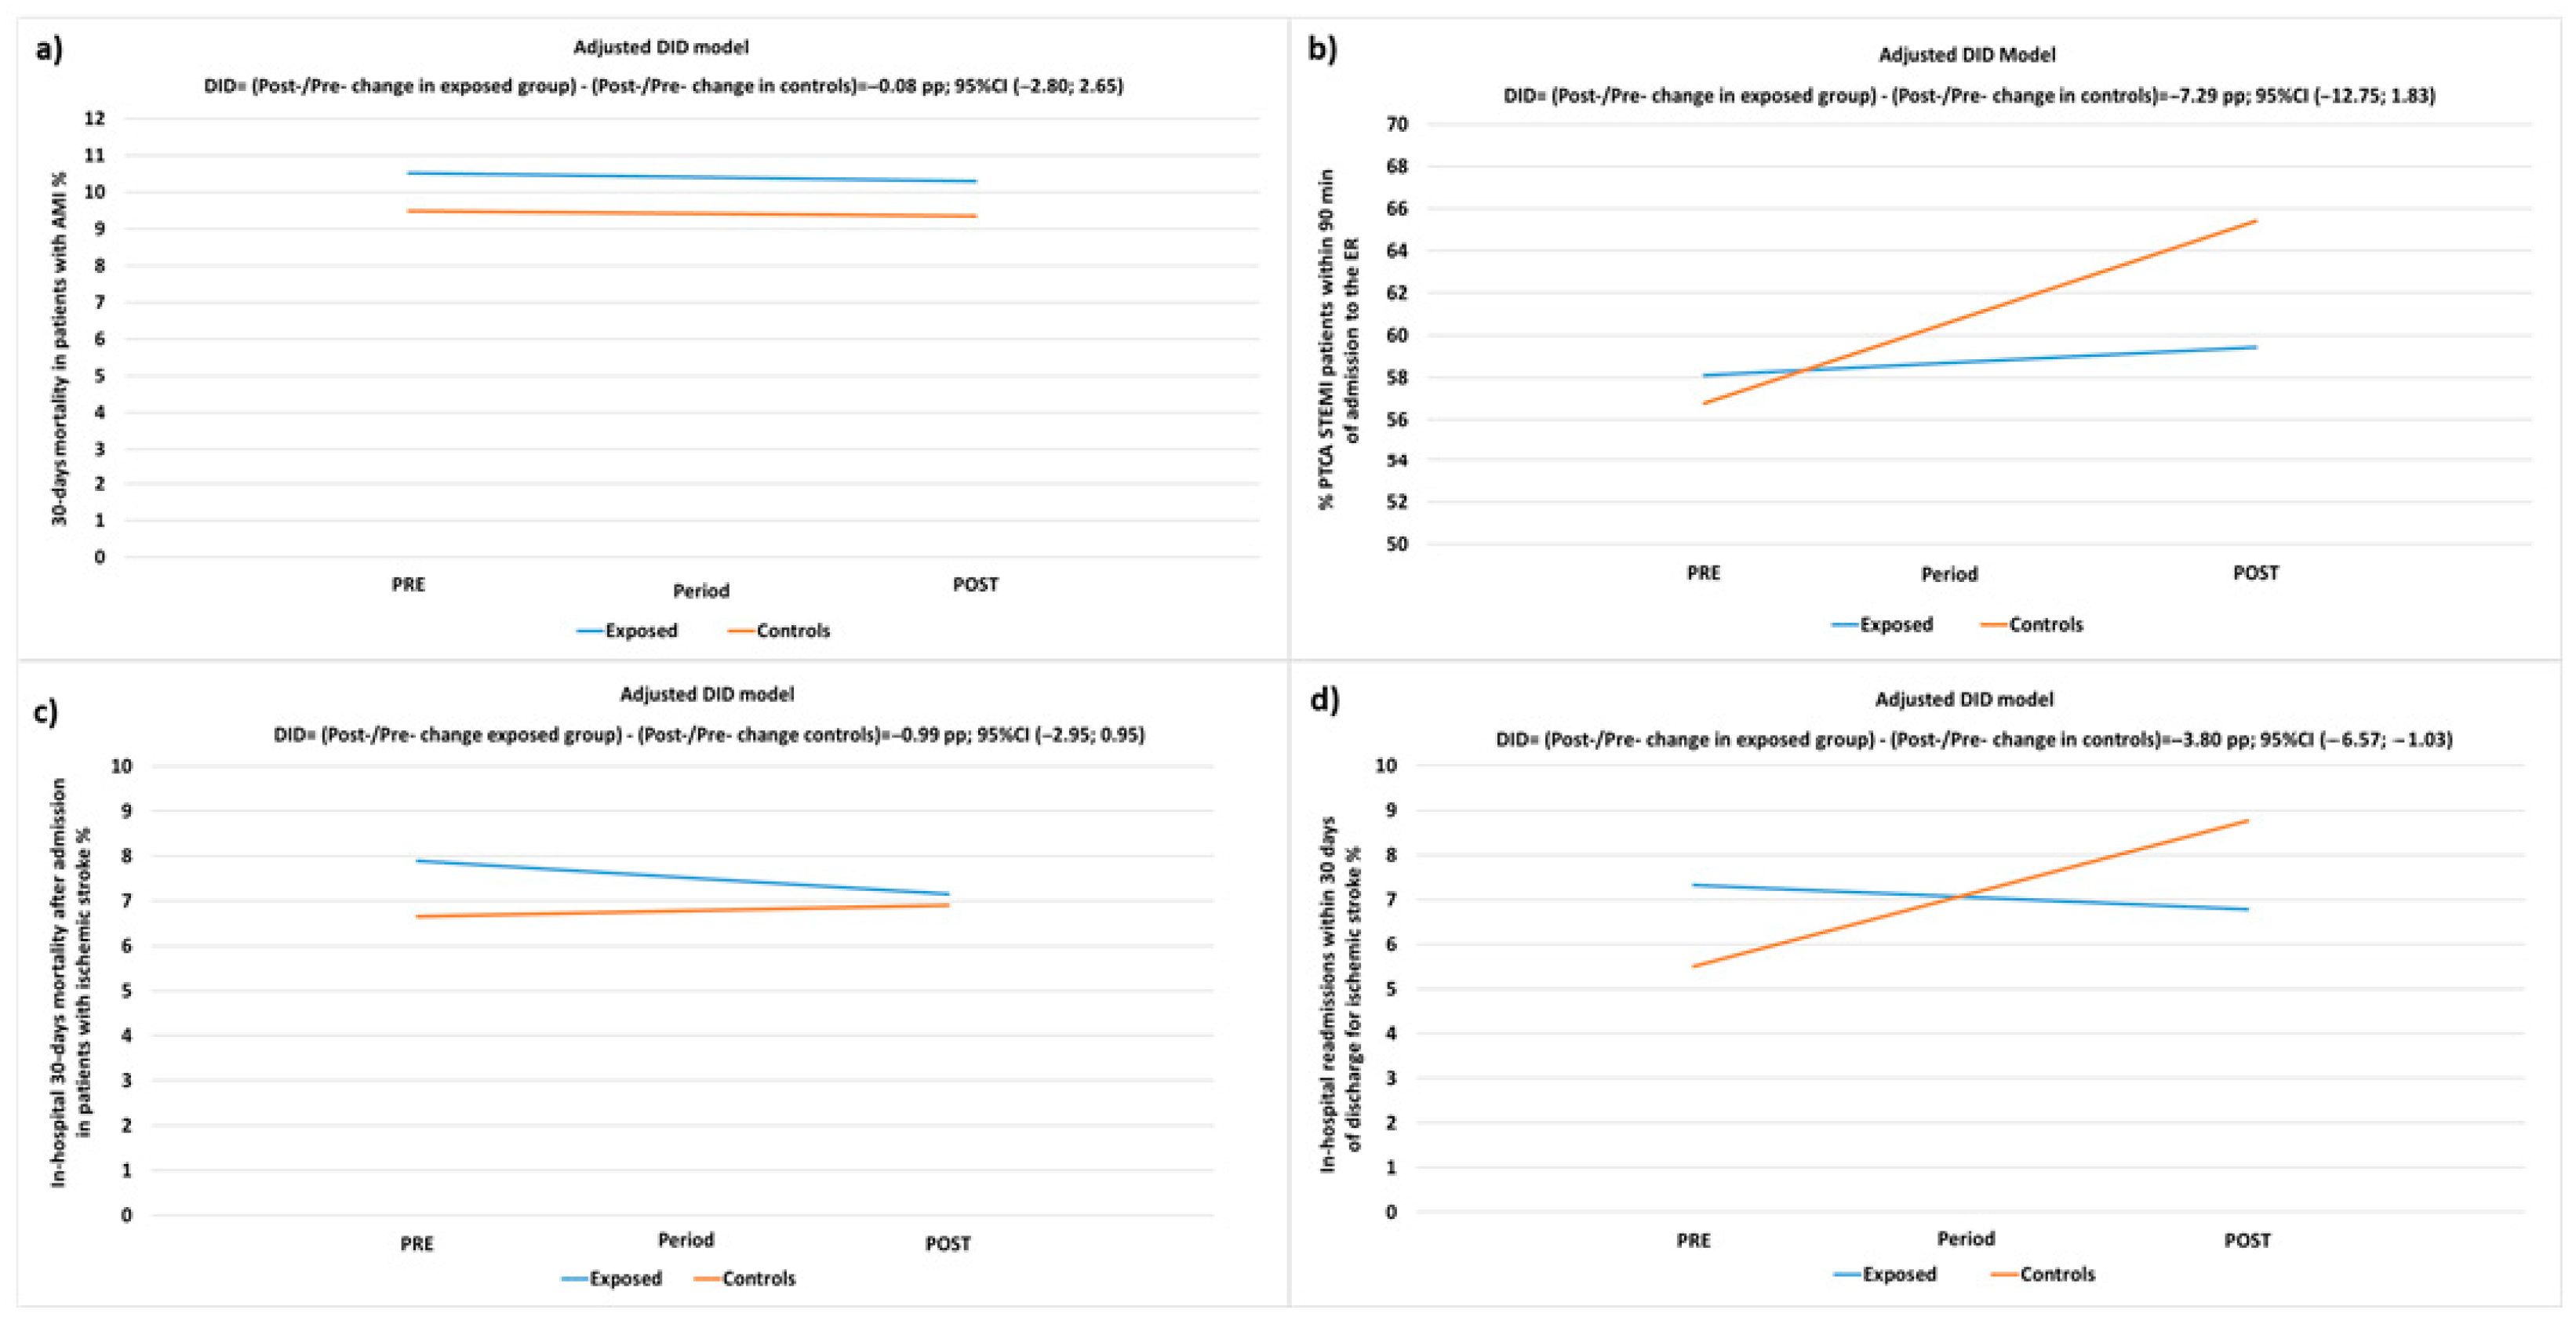
A 30-day mortality rate after hospital admission in patients with AMI;
-
Proportion of PTCA (percutaneous transluminal coronary angioplasty) performed in STEMI (ST-elevation myocardial infarction) patients within 90 min of admittance to the hospital emergency room (ER);
-
In-hospital mortality in patients with ischemic stroke;
-
Proportion of hospital readmissions within 30 days of discharge in patients with ischemic stroke.
Detailed information regarding these indicators, including calculation formulas, dimensions, rationale, calculation periods, and links to the calculation protocols, are provided in the relevant Supplementary Materials (Tables S1 and S2).

2.2. A&F Intervention and Control Group

Hospitals engaged in the intervention undertook the following periodic activities over a span of six months:
-
Arranging regular meetings to update on project activities, as well as to present and discuss the contents of the feedback;
-
Subsequent to each meeting, the feedback report was disseminated via email in various formats (comprising a comprehensive main document and a hospital-specific PowerPoint presentation) to the designated contact person within the hospital (pertaining to AMI and/or stroke, respectively). Simultaneously, a form was provided to gather information on audit meetings conducted after the feedback;
-
Issuing formal invitations to plan and execute audit meetings after each feedback session;
-
Returning the completed form containing details on the characteristics of the conducted audits (such as date, participants, discussion points on indicators, identification of improvement activities, audit minutes, etc.) to the research group.
Further specifics regarding the implementation of the A&F intervention can be found in Angelici et al. [17].
Control groups were provided with web access to the outcomes of the Regional Program for the Evaluation of Outcomes of Health Interventions (P.Re.Val.E.) [2], overseen by DEP. This program annually publishes process and outcome indicators pertaining to various chronic and acute conditions, including AMI and stroke. Through a specific function accessible via the platform, healthcare entities have the option to initiate an audit procedure involving Lazio DEP. Consultation is initiated by professionals, and the lowest level of aggregation available is at the facility level. Additionally, other comparative data available include information from other facilities, previous time periods, and regional-level metrics.

2.3. Data Sources

Pseudo-anonymized data retrieved from the health information systems (HIS) of the Lazio Region were utilized to compute the indicators and to gather variables used as adjustment covariates in the analysis.
Specifically, the data were sourced from the Italian Hospital Discharge Registry (HDR), the Healthcare Emergency Information System (HEIS), and the Tax Registry. The HDR information system contains sociodemographic and clinical data systematically recorded during each hospital admission and discharge across facilities within the Lazio Region. This includes primary and secondary diagnoses as well as all procedures performed. Eligibility and exclusion criteria for the selection of the cohort of interest were determined based on the International Classification of Diseases, Ninth Revision, and Clinical Modification (ICD-9-CM) codes (2019). Codes corresponding to each indicator are provided in Supplementary Materials, Table S3.
An anonymous identification code, generated by the HIS, served as the reference for the record-linkage process, which was conducted using a deterministic methodology. Data from the HDR were linked with information collected through the Health Emergency Information System (HEIS), which routinely gathers sociodemographic and clinical data pertaining to treatments and visits to all Emergency Departments within Lazio hospitals. Additionally, data from the Tax Registry, which includes information on deaths, and the 2011 Census (Lazio Region Longitudinal Study), containing details on patients’ educational qualifications, were incorporated [23].
By integrating data from these different data sources, a comprehensive socio-demographic and health-related profile was established, enabling the tracing of patients’ clinical histories for the five years preceding the relevant admission.

2.4. Variables in Analysis

At patient level, demographic, socioeconomic, and clinical variables were analyzed. Demographic data included sex and age categories. Socioeconomic status was approximated using education level, categorized based on the 2011 census or, if unavailable from this source, from the information documented in the HDR. Education was categorized as follows: Bachelor’s degree, lower-middle high school, middle high school, elementary school or none, and not stated.
The integration of different information sources facilitated the tracing of patients’ clinical histories for the five years leading up to the hospitalization incident of interest (referred to as the hospitalization index). Clinical data, including comorbidities and medications, were retrieved from the hospitalization index, admission to the hospital ER index, or from all hospitalizations or ER admissions within the preceding five years. Further details are provided in Tables S1 and S2 of the Supplementary Materials.
Additionally, contextual variables at the hospital level were analyzed, specifically the type of hospital, according to the Lazio Region adult emergency network [24]. This variable comprised the following categories: Emergency Admission Department level I (EADI), Emergency Admission Department level II (EADII), and hospitals with Emergency Room (ER) for AMI [24] and Neurovascular Treatment Unit level I (NTUI), Neurovascular Treatment Unit level II (NTUII), hospitals with a Neurovascular Treatment Team (NVT), and hospitals without a Neurovascular Treatment Team (noNVT) for stroke [25].

2.5. Data Management and Statistical Analysis

Analyses were conducted at patient level, with each analyzed indicator defined as a dichotomous outcome variable (Yes/No) (e.g., death or no death within 30 days of hospital admission for AMI).
Patients admitted to hospitals with a volume of activities lower than 50 were excluded from the analyses to consider the relationship between volumes and outcomes [26] and to ensure more reliable results.
The descriptive analyses of demographic, socioeconomic, and clinical characteristics of patients were performed according to their exposed/control status and outcome, both pre- and post-intervention. Chi-square tests were utilized to calculate p-values of association.
The effectiveness of the intervention was assessed using difference-in-difference (DID) models [16,17,18,19,20] to compare changes in outcomes from pre- to post-intervention periods between exposed and control groups. These models accounted for changes in secular trends and controlled for measured and unmeasured confounding factors. DID models were implemented through generalized linear models with a binomial probability distribution and identity as the link function. Estimates from DID models were presented as the difference in absolute risks measured in percentage points (PP).
Hospital and patient level characteristics were expected to confound or to modify the relationship between intervention and outcomes and were evaluated as potential confounding factors or effect modifiers.
The univariate association of each demographic, socioeconomic, clinical, and contextual variable with the outcome of interest was tested, and a stepwise procedure was employed to identify the set of covariates entering the final multivariate model.
All data were analyzed using SAS version 9.4 (SAS Institute, Cary, NC, USA).

3. Results

A total of 18 out of 70 (25.7%) hospitals in the Lazio Region participated in the intervention for a total of 29 clinical pathways: 16 were dedicated to AMI and 13 were focused on stroke management. The list of participating hospitals can be found in the Supplementary Materials, Table S4.

3.1. Participating Hospitals

Out of the 70 hospitals surveyed, 31 (44.3%) reported admitting at least one patient with AMI in 2021 and 2022, with activity volumes of 50 admissions or more. Among these, 15 hospitals (48.4%) were exposed to the A&F intervention while 16 (51.6%) were not. Detailed descriptive information for both exposed and control groups is provided in the Supplementary Materials, Table S5.
A total of 12196 AMI patients were analyzed, with 5986 (49.1%) admissions in 2021 and 6210 (50.9%) in 2022. Of these, 7002 (57.4%) were admitted to exposed hospitals, and 5194 (42.6%) to non-exposed hospitals (Table S5). Of the 59 hospitals that admitted at least one patient with STEMI during the same period, 20 had activity volumes of at least 50, with 12 (60%) exposed to the intervention and 8 (40%) not exposed. A total of 5084 STEMI patients were included in the analysis, with 2433 (47.8%) admissions in 2021 and 2651 (52.5%) in 2022. Among these, 3272 (64%) were admitted to exposed hospitals and 1812 (36%) to non-exposed hospitals (Table S6).
Similarly, 18 out of the 70 hospitals (25.7%) reported admitting at least one patient with ischemic stroke during the same period, with activity volumes of 50 admissions or more. Among these, 10 hospitals (66.6%) were exposed to the A&F intervention, while 8 (44.4%) were not. The descriptive details for both exposed and control groups are available in Supplementary Materials, Table S7. A total of 5949 ischemic stroke patients were included for calculating in-hospital mortality, with 2954 (49.7%) admissions in 2021 and 2995 (50.3%) in 2022. Among these, 3793 (63.8%) were admitted to exposed hospitals and 2156 (36.2%) to non-exposed hospitals (Table S7a). Additionally, 5453 ischemic stroke patients were analyzed for 30-day readmissions following an ischemic stroke, with 2685 (49.2%) admissions in 2021 and 2768 (50.8%) in 2022. Among these, 3471 (63.7%) were admitted to exposed hospitals and 1982 (36.3%) to non-exposed hospitals (Table S7b).

3.2. Patient Populations

3.2.1. AMI Patient Cohort

Out of the total 12196 AMI patients admitted to the hospitals analyzed over a span of two years (2021 and 2022), 70% were male, with an average age of 69 years. Detailed demographic information is provided in Supplementary Materials, Table S8.
No significant differences were observed in terms of demographic and socioeconomic characteristics between exposed and control patients, either in total or when comparing the individual years of 2021 and 2022. However, statistically significant differences were noted in the frequency of certain clinical conditions between exposed and control groups, including arterial hypertension (p = 0.007), chronic kidney disease (p = 0.006), previous coronary angioplasty (p = 0.003), and previous coronary artery bypass grafting (p = 0.026). Additionally, there were significant differences in the type of hospital admission (p < 0.001) (refer to Supplementary Materials, Table S8).
In total, 839 (6.9%) patients admitted for AMI died within 30 days of the initial hospital contact, with 51.3% of these deaths occurring in the post-intervention year of 2022 (see Table 1 and Supplementary Materials, Tables S9 and S10). The descriptive findings are presented in Table 1. Higher 30-day mortality rates were significantly associated with lower education levels, female gender, and older age groups. Additionally, several clinical conditions showed associations with the outcome (refer to Table 1).

3.2.2. STEMI Patient Cohort

Out of the total 5984 STEMI patients admitted to the hospitals analyzed over the two-year period, 74% were male, with an average age of 66 years. The detailed descriptive information can be found in the Supplementary Materials, Table S11.
There were no significant differences observed in terms of demographic and socioeconomic characteristics between exposed and control patients, either when considering the total cohort or when analyzing the years 2021 and 2022 separately. However, statistically significant associations were found between the frequency of certain clinical conditions among exposed and control groups, including obesity at indexed admission (p = 0.009), previous myocardial infarction (p = 0.017), cardiomyopathies at indexed admission (p = 0.001), and prior coronary angioplasty (p < 0.001). Moreover, significant differences were noted in the type of hospital admission (p < 0.001) (refer to Supplementary Materials, Table S11).
In total (over 2021 and 2022), 3077 (60.5%) patients underwent PTCA within 90 min of admission to the ER, with 52% of these procedures occurring in the post-intervention year of 2022. The descriptive results are presented in Table 2. A higher proportion of STEMI patients undergoing PTCA within 90 min of ER admission was significantly associated with lower education levels, male gender, and the age group of 58–65. Furthermore, several clinical conditions were associated with this outcome (refer to Table 2 and Supplementary Materials, Tables S12 and S13).

3.2.3. Ischemic Stroke Patient Cohort

The eligibility criteria for including patients in the stroke cohorts for calculating the two considered indicators differ; hence, each cohort is described separately.

Thirty-Day In-Hospital Mortality after First Hospital Admission in Patients with Ischemic Stroke

Out of the total 5949 ischemic stroke patients admitted to the hospitals analyzed over the two-year period, 54% were male, with an average age of 74 years. The detailed descriptive information is provided in the Supplementary Materials, Table S14.
No significant differences were found in terms of demographic and socioeconomic characteristics between exposed and control patients, either when considering the total cohort or when analyzing the years 2021 and 2022 separately, except for educational qualification (p < 0.001). However, statistically significant differences were observed in the frequency of certain clinical conditions between exposed and control groups, including obesity and anemia at indexed admission (p = 0.038 and p < 0.001), coagulation defects at indexed admission (p = 0.001), other forms of ischemic heart disease previously (p = 0.002), previous not well-defined forms and complications of heart disease (p = 0.004), rheumatic heart disease (p = 0.001), and other previous cardiac conditions (p = 0.003). Furthermore, the type of emergency stroke network hospital of admission was also associated with exposure status (p < 0.001) (refer to Supplementary Materials, Table S14).
In total (over 2021 and 2022), 432 (7.3%) patients died in hospital within 30 days of first admission, with 46% of these deaths occurring in 2022. The descriptive results are presented in Table 3. Higher 30-day mortality following the first hospital admission was significantly associated with lower education levels, female gender, and older age groups. Additionally, several clinical conditions were associated with this outcome (refer to Table 3 and Supplementary Materials, Tables S15 and S16).

Proportion of Hospital Readmission within 30 Days of Discharge for Ischemic Stroke

Out of the total 12.196 AMI patients admitted to the hospitals included in the analyses over the two-year period (2021 and 2022), 70% were male, with an average age of 69 years. The detailed descriptive information is provided in the Supplementary Materials, Table S17.
There were no significant differences observed in terms of demographic and socioeconomic characteristics between exposed and control patients, either when considering the total cohort or when analyzing the years 2021 and 2022 separately, except for educational qualification (p < 0.001). However, statistically significant differences were found in the frequency of certain clinical conditions between exposed and control groups, including anemia and coagulation defects at indexed admission (p < 0.001), prior myocardial infarction (p = 0.034), other forms of ischemic heart disease (p = 0.006), heart failure (p = 0.019), rheumatic heart disease at indexed admission (p = 0.001), and other cardiac conditions (p = 0.019). Additionally, the type of emergency stroke network hospital of admission was also associated with exposure status (p < 0.001) (refer to Supplementary Materials, Table S17).
In total (over 2021 and 2022), 392 (7.2%) patients experienced hospital readmission within 30 days of discharge for ischemic stroke, with 54% of these readmissions occurring in the post-intervention year of 2022. The descriptive results are presented in Table 4. A higher proportion of hospital readmissions within 30 days of discharge for ischemic stroke was significantly associated with being in the older age group (p = 0.005). Additionally, several clinical conditions were associated with this outcome (refer to Table 4 and Supplementary Materials, Tables S18 and S19).

3.3. Intervention Effectiveness Evaluation

The unadjusted and adjusted results of DID models applied to compare each indicator between exposed and control patients in the pre- and post-intervention periods are presented in Table 5 and Table 6 and Figure 2.
For the AMI/STEMI pathway, the adjusted analyses of the 30-day mortality following the first hospital contact of AMI patients indicated a reduction of 0.22 pp from 2021 to 2022 in the exposed group and 0.14 PP in the control group, with a DID estimate of −0.08 PP (95% CI −2.80; 2.65, p-value = 0.956), demonstrating a non-significant difference in favor of the exposed group.
The proportion of STEMI patients treated with PTCA within 90 min of ER access increased by 1.31 PP from 2021 to 2022 in the exposed group and by 8.63 PP in the control group, resulting in a DID estimate of −7.29 PP (95% CI −12.75; −1.83, p-value = 0.009), indicating a significant difference in favor of the control group.
This result contrasts with the expected higher improvement in the exposed group due to the A&F intervention. Consequently, sensitivity analyses were conducted, excluding one facility that, despite receiving periodic feedback, never provided information on conducted audits and failed to adhere to the A&F intervention protocol, either through the proposed method, verbal communication, or meetings. The results of the sensitivity analysis confirm a trend for greater improvement in the control group, although the estimate loses significance: −4.38 (−10.0; 1.23), p-value = 0.1259.
For ischemic stroke patients, the adjusted DID model indicated a reduction in in-hospital mortality by 0.74 from 2021 to 2022 in exposed patients and was increased by 0.26 PP in controls with a non-significant difference in favor of the exposed patients of −0.99 PP (95% CI: −2.93; 0.95, p-value = 0.315).
Furthermore, 30-day readmissions after hospitalization for ischemic stroke decreased by 0.54 PP from 2021 to 2022 in the exposed group, while there was an increase of 3.25 PP in the control group. This resulted in a significant difference in favor of the exposed group, with a DID estimate of −3.80 PP (95% CI: −6.57; −1.03, p-value = 0.007) (refer to Table 6, Figure 2).

4. Discussion

This study assessed the effectiveness of an experimental audit and feedback (A&F) intervention compared to the “usual reporting strategy” (P.Re.Val.E) in enhancing the appropriateness and timeliness of emergency health interventions for patients with AMI and ischemic stroke, utilizing process and outcome indicators. While the intervention primarily targeted in-hospital emergency pathways, all organizations within the regional time-dependent network of Lazio [27] were invited to participate.
The findings demonstrate heterogeneity. In terms of AMI/STEMI conditions, the percentage of PTCA performed in STEMI patients within 90 min improved in both exposed and unexposed groups. However, although the improvement was significantly greater in the latter, this difference was not significant in sensitivity analyses conducted after excluding hospitals that did not effectively implement the intervention. No significant differences were observed in 30-day mortality rates following an AMI admission. Conversely, for ischemic stroke, the percentage of patients readmitted within 30 days of discharge showed a significant reduction in the exposed group compared to an increase in the unexposed group. However, there was no significant effect on in-hospital mortality among patients with ischemic stroke. In general, and consistent with the existing literature, changes in mortality may require longer follow-up periods to demonstrate the effectiveness of quality improvement interventions [3].
The heterogeneity observed could be attributed to various factors that represent potential limitations of the study. Firstly, the post-intervention period analyzed was relatively short. The intervention started in February 2022 and continued until September 2023. For the present analyses, only the first 11 months of the post-intervention period (2022) were included. Additionally, participating hospitals conducted their initial audit meetings within the first six months, subsequent improvement actions were implemented after this. Consequently, changes might have begun to manifest during the final five months of the year.
Another factor contributing to the observed heterogeneity, which could constitute a limitation of the study, is the discrepancy between 2021 and 2022 regarding COVID-19 patient care in some hospitals. Unlike in 2022, in 2021, certain hospitals—both exposed and unexposed—allocated entire wards to the care of COVID-19 patients. This disparity strongly influenced internal processes and patient outcomes in a variable manner. Consequently, there may have been improvements in certain indicators in these hospitals between 2021 and 2022, independent of the intervention, due to their reduced exposure to infection control measures. Unfortunately, the lack of information regarding which hospitals and wards were affected by this situation prevented the correction of these data associations.
Another plausible explanation could be that certain hospitals in the non-exposed group might have implemented other quality improvement initiatives independently of the EASY-NET project. Consequently, this could have influenced the analysis. However, due to the unavailability of this information, it was not possible to adjust the analyses for this factor.
Additionally, as a further limitation, it is important to acknowledge that the intervention solely focused on the in-hospital aspect of the pathway, without considering the broader functioning of the entire network. Within this network, the emergency service (ARES118- Regional Health Emergency Company-Rome, Italy) transports patients to the most suitable hospital emergency room based on their clinical severity. This dynamic could potentially affect the comparison between exposed facilities (which include a large proportion of hospitals providing emergency care of higher intensity) and controls (e.g., Supplementary Materials, Table S8). Nevertheless, to mitigate this limitation, the analyses were adjusted according to hospital type.
Despite the quantitative results not being conclusive and requiring further analysis over a longer follow-up period, it is important to highlight additional valuable findings regarding the positive impact of the intervention on fostering connections and facilitating discussions and benchmarking among professionals from various disciplines (such as cardiology, neurology, emergency care, health management, and epidemiology), as well as across different hospitals and settings. These interactions significantly contributed to enhancing the quality of data collected within participating institutions, thus enriching the overall health information flow.
In fact, during the periodic meetings, professionals, researchers, and regional representatives engaged in discussions about the indicator results that did not align with their expectations. This discrepancy often stemmed from errors such as incorrect code usage or inaccuracies in recording procedure times during data entry. Consequently, specific audits targeting data quality were initiated [28]. It is important to note that these quality assessments could potentially influence the evaluation of effectiveness, as the follow-up period did not encompass the phase subsequent to the implementation of actions aimed at improving data quality.
Another notable benefit stemming from the intervention was the collective contribution of all participants towards the development of audit support materials, including reports and audit forms, which were collaboratively agreed upon by professionals and regional representatives. These materials have the potential to extend beyond the confines of the research project and be utilized in daily practice. As suggested by recent publications [14,19], involving recipients from the outset of the audit and feedback (A&F) process—including in the selection and definition of indicators, the design of feedback materials, and the determining of the timing of feedback delivery—can enhance engagement. The integration of both verbal and written feedback, such as through report documentation and in-person meetings, provides recipients with opportunities to discuss their results, challenges, and potential solutions periodically, even in informal social settings. This approach fosters peer collaboration and can bolster motivation, thus mitigating the risk of discontinuation.
Another significant benefit stemming from the intervention was the active involvement of all participants in the development of audit support materials, including reports and audit forms, which were collectively agreed upon by professionals and regional stakeholders. These materials hold enduring utility beyond the conclusion of the research project, aligning with recent publications advocating for recipient involvement at every stage of audit and feedback (A&F) implementation [14,19]. Engaging recipients in the design phase of A&F, encompassing indicator selection and definition, as well as feedback material creation and timing, alongside integrating both verbal and written feedback, has been highlighted as crucial [14,19]. Providing opportunities for periodic discussions in informal settings to review results, address challenges, and foster peer collaboration has been shown to bolster motivation and mitigate discontinuation risks. Notably, all but one hospital participated enthusiastically in all scheduled activities, actively contributing to meeting discussions. Moreover, hospitals were empowered to independently organize periodic audit meetings, thereby enabling the customization of activities to suit the specific contexts of hospitals that varied in size, complexity, volume of activities, and organizational processes. This decentralized approach fosters adaptability and ensures that audit processes remain tailored to the unique needs of each healthcare setting.
In an era marked by increasing complexity and a growing emphasis on value-driven healthcare, the insights derived from this study are poised to enhance evidence-based practice and contribute to the ongoing evolution of healthcare delivery models. Through the provision of feedback and the establishment of cyclical audit processes, this study aims to bolster the effective implementation of networks designed to enhance the appropriateness and timeliness of emergency health interventions, particularly for patients with time-sensitive conditions.
The proposed intervention involved all actors of the time-dependent emergency network in the context of the Lazio Region, although the focus of the activities was the in-hospital pathway. There is evidence that clinical networks can improve the delivery of healthcare, although there are few high-quality quantitative studies of their effectiveness [29]. Organizations in such networks need to collaborate and coordinate their actions to achieve their common purpose. They also need to align goals, balance power, manage conflict, monitor performance, and hold members accountable for network-level outcomes [30].
Although current performance measurement systems in Italy provide feedback on time-dependent care conditions [1,2,31,32], they often fall short in evaluating interventions at the network level. Therefore, there is a pressing need for further research endeavors to adopt a network-centric approach. Such initiatives would enable the comprehensive evaluation and improvement of the entire emergency care pathway, thereby exerting a significant influence on critical junctures across patients’ healthcare journeys. This holistic perspective is crucial for optimizing healthcare delivery and enhancing patient outcomes.

5. Conclusions

The findings show, for the first time in Italy, the effects of A&F interventions within an emergency setting, leveraging aggregated data from hospitals participating in the Lazio Region emergency network. The delivery of feedback and the implementation of cyclical audit processes have the potential to facilitate the efficient establishment of networks aimed at enhancing the appropriateness and promptness of emergency healthcare interventions for patients with time-dependent conditions.

Supplementary Materials

The following supporting information can be downloaded at: https://www.mdpi.com/article/10.3390/healthcare12070733/s1. Table S1: Detailed cardiovascular area (AMI/STEMI) indicators sheets. Table S2: Detailed cerebrovascular area indicators sheet. Table S3: ICD-9 cm codes. Table S4: List of participating facilities. Figure S1: Flow chart of included Lazio facilities with AMI patients. Figure S2: Flow chart of included Lazio facilities with STEMI patients. Figure S3: Flow chart of included Lazio facilities with ischemic stroke patients. Table S5: Distribution of patients belonging to the AMI cohorts by year of analysis and facility. Table S6: Distribution of patients belonging to the STEMI cohorts by year of analysis and facility. Table S7: Distribution of patients belonging to stroke cohorts by year of analysis and facility (a and b). Table S8: Characteristics of patients included in the AMI cohort in 2021 and 2022 from participating facilities according to A&F intervention exposure status. Table S9: Characteristics of patients included in the AMI cohort in 2021 (PRE) from participating facilities by 30-day mortality after first hospital admission in patients with AMI (Yes/No). Table S10: Characteristics of patients included in the AMI cohort in 2022 (POST) from participating facilities by 30-day mortality after first hospital admission in patients with AMI (Yes/No). Table S11: Characteristics of patients included in the STEMI cohort in 2021 and 2022 from participating facilities according to A&F intervention exposure status. Table S12: Characteristics of patients included in the STEMI cohort in 2021 (PRE) from participating facilities according to performing of PTCA within 90 min of admission to the ER (Yes/No). Table S13: Characteristics of patients included in the STEMI cohort in 2022 (POST) from participating facilities according to the performance of PTCA within 90 min of admission to the ER (Yes/No). Table S14: Characteristics of patients included in the ischemic stroke cohort (in-hospital mortality) in 2021 and 2022 from participating facilities according to A&F intervention exposure status. Table S15: Characteristics of patients included in the ischemic stroke cohort in 2021 (PRE) from participating facilities by 30-day in-hospital mortality since first hospital admission in patients with ischemic stroke (Yes/No). Table S16: Characteristics of patients included in the ischemic stroke cohort in 2022 (POST) from participating facilities by 30-day in-hospital mortality since first hospital admission in patients with ischemic stroke (Yes/No). Table S17: Characteristics of patients included in the ischemic stroke cohort (hospital readmissions) in 2021 and 2022 from participating facilities according to A&F intervention exposure status. Table S18: Characteristics of patients included in the stroke cohort in 2021 (PRE) from participating facilities according to hospital readmissions within 30 days of discharge for ischemic stroke (Yes/No). Table S19: Characteristics of patients included in the stroke cohort in 2022 (POST) from participating facilities according to hospital readmissions within 30 days of discharge for ischemic stroke (Yes/No).

Author Contributions

Conceptualization, L.A., A.A. and N.A.; methodology, L.A., A.A., L.P., P.C. and N.A.; data curation, L.A., A.A. and A.M.; formal analysis, L.A.; writing—original draft, L.A., A.A. and N.A.; writing—review and editing, L.A., A.A., C.A., L.P., P.C., A.G.d.B., E.L.G., A.M., S.F., M.D. and N.A.; supervision, A.A., M.D. and N.A.; project administration, L.A., A.A., C.A., M.D. and N.A.; funding acquisition, S.F., M.D. and N.A. All authors read and approved the final manuscript and accepted personal responsibility for their contributions and ensured the accuracy and integrity of all parts of the work, even those in which they were not personally involved. All authors have read and agreed to the published version of the manuscript.

Funding

This study was supported by the Italian Ministry of Health and Lazio Region (EASY-NET project code: NET-2016-02364191). The funding sources had no role in the design and conduct of the study; collection, management, analysis, and interpretation of the data; preparation, review, or approval of the manuscript; and decision to submit the manuscript for publication.

Institutional Review Board Statement

This study was carried out by the Department of Epidemiology (DEP), which is regulated by the Lazio Regional Health Service, managing and analyzing data from the administrative information systems for epidemiological research, according to the current Italian national privacy laws (national legislative decree on privacy policy n° 196/30 June 2003) and with the Declaration of Helsinki. The DEP has access to anonymized data taken from the Regional Health Information Systems, and it is not possible to trace patient identity. The DEP works in synergy with the Directorate for Health and Social Care Integration of the Lazio Regional Health Service. As a result, the DEP is entitled to use the data provided by the Health Information System Unit of the Lazio Region for health and scientific purposes. This article reports on research developed within the P.Re.Val.E. [2]. Furthermore, the DEP has been identified as being responsible for the development of the P.Re.Val.E. and for all aspects related to its technical and scientific implementation, according to current regional law. The study is exempt from the requirement for official approval by an institutional review board because it did not include a clinical trial phase; however, in accordance with the rules of observational research, we notified the Lazio 1 Ethics Committee—Azienda Ospedaliera San Camillo-Forlanini and ethical approval and informed consent were waived.

Informed Consent Statement

Not applicable.

Data Availability Statement

Data related to the findings reported in our manuscript are available to all interested researchers upon reasonable request and with the permission of the Regional Department because of stringent legal restrictions regarding the privacy policy on personal information in Italy (national legislative decree on privacy policy no. 196/30 June 2003). For these reasons our dataset cannot be made available in a public data deposition.

Acknowledgments

This work was produced as part of the activities of the EASY-NET research group “Audit & Feedback. Effectiveness of audit and feedback strategies to improve healthcare practice and equity in various clinical and organizational settings (EASY-NET)” (project code: NET-2016-02364191), funded by the Ministry of Health and co-funded by the participating regions (Lazio, Friuli Venezia Giulia, Piedmont, Emilia-Romagna, Lombardy, and Calabria). We thank all researchers involved in the EASY-NET network program (http://easy-net.info/progetto-easy-net-migliorare-la-qualita-di-assistenza-con-audit-feedback/ accessed on 6 July 2023) and, in particular, all Members of the EASY-NET: WP1 Lazio research group: Anna Acampora, Nera Agabiti (PI); Michela Alagna, Laura Angelici, Carmen Angioletti, Maria Balducci, Giulia Cesaroni, Paola Colais, Marina Davoli, Melissa D’Agostino, Antonio Giulio de Belvis, Mirko Di Martino, Danilo Fusco, Domenico Antonio Ientile, Adele Lallo, Francesca Mataloni, Ursula Kirchmayer, Amina Pasquarella, Luigi Pinnarelli, Chiara Sorge, Salvatore Soldati, Sara Farchi, and Sergio Ribaldi. Finally, we also thank all participating facilities.

Conflicts of Interest

The authors declare no conflict of interest.

References

  1. Programma Nazionale Esiti—Edition 2021. Available online: https://www.agenas.gov.it/comunicazione/primo-piano/2005-pne-2021-agenas-presenta-i-risultati-al-ministero-della-salute (accessed on 10 September 2022).
  2. P.Re.Val.E. (Programma Regionale Valutazione Esiti”—Regional Program for Outcomes and Processes Evaluation) Edition 2022 Web Sites. Available online: https://www.dep.lazio.it/prevale2022/ (accessed on 15 September 2023).
  3. Ivers, N.; Jamtvedt, G.; Flottorp, S.; Young, J.M.; Odgaard-Jensen, J.; French, S.D.; O’Brien, M.A.; Johansen, M.; Grimshaw, J.; Oxman, A.D. Audit and feedback: Effects on professional practice and healthcare outcomes. Cochrane Database Syst. Rev. 2012, 6, 1465–1858. [Google Scholar] [CrossRef] [PubMed]
  4. Desveaux, L.; Ivers, N.M.; Devotta, K.; Ramji, N.; Weyman, K.; Kiran, T. Unpacking the intention to action gap: A qualitative study understanding how physicians engage with audit and feedback. Implement. Sci. 2021, 16, 19. [Google Scholar] [CrossRef]
  5. Moore, L.; Guertin, J.R.; Tardif, P.-A.; Ivers, N.M.; Hoch, J.; Conombo, B.; Antony, J.; Stelfox, H.T.; Berthelot, S.; Archambault, P.; et al. Economic evaluations of audit and feedback interventions: A systematic review. BMJ Qual. Saf. 2022, 31, 754–767. [Google Scholar] [CrossRef] [PubMed]
  6. Schondelmeyer, A.C.; Bettencourt, A.P.; Xiao, R.; Beidas, R.S.; Wolk, C.B.; Landrigan, C.P.; Brady, P.W.; Brent, C.R.; Parthasarathy, P.; Kern-Goldberger, A.S.; et al. Evaluation of an Educational Outreach and Audit and Feedback Program to Reduce Continuous Pulse Oximetry Use in Hospitalized Infants with Stable Bronchiolitis: A Nonrandomized Clinical Trial. JAMA Netw. Open 2021, 4, e2122826. [Google Scholar] [CrossRef]
  7. Goulao, B.; Scott, C.; Black, I.; Clarkson, J.; McArthur, L.; Ramsay, C.; Young, L.; Duncan, E. Audit and feedback with or without training in-practice targeting antibiotic prescribing (TiPTAP): A study protocol of a cluster randomised trial in dental primary care. Implement. Sci. 2021, 16, 32. [Google Scholar] [CrossRef]
  8. Lau, R.; Stevenson, F.; Ong, B.N.; Dziedzic, K.; Treweek, S.; Eldridge, S.; Everitt, H.; Kennedy, A.; Qureshi, N.; Rogers, A.; et al. Achieving change in primary care-effectiveness of strategies for improving implementation of complex interventions: Systematic review of reviews. BMJ Open 2015, 5, e009993. [Google Scholar] [CrossRef]
  9. Tuti, T.; Nzinga, J.; Njoroge, M.; Brown, B.; Peek, N.; English, M.; Paton, C.; van der Veer, S.N. A systematic review of electronic audit and feedback: Intervention effectiveness and use of behaviour change theory. Implement. Sci. 2017, 12, 61. [Google Scholar] [CrossRef]
  10. Chatzopoulou, M.; Kyriakaki, A.; Reynolds, L. Review of antimicrobial resistance control strategies: Low impact of prospective audit with feedback on bacterial antibiotic resistance within hospital settings. Infect. Dis. 2021, 53, 159–168. [Google Scholar] [CrossRef] [PubMed]
  11. Ivers, N.M.; Grimshaw, J.M.; Jamtvedt, G.; Flottorp, S.; O’brien, M.A.; French, S.D.; Young, J.; Odgaard-Jensen, J. Growing literature, stagnant Science? Systematic review, meta-regression and cumulative analysis of audit and feedback interventions in health care. J. Gen. Intern. Med. 2014, 29, 1534–1541. [Google Scholar] [CrossRef]
  12. Grimshaw, J.; Ivers, N.; Linklater, S.; Foy, R.; Francis, J.J.; Gude, W.T.; Hysong, S.J. Reinvigorating stagnant science: Implementation laboratories and a meta-laboratory to efficiently advance the science of audit and feedback. BMJ Qual. Saf. 2019, 28, 416–423. [Google Scholar] [CrossRef]
  13. Foy, R.; Skrypak, M.; Alderson, S.; Ivers, N.M.; McInerney, B.; Stoddart, J.; Ingham, J.; Keenan, D. Revitalising audit and feedback to improve patient care. BMJ 2020, 368, m213. [Google Scholar] [CrossRef]
  14. Brehaut, J.C.; Colquhoun, H.L.; Eva, K.W.; Carroll, K.; Sales, A.; Michie, S.; Ivers, N.; Grimshaw, J.M. Practice feedback interventions: 15 suggestions for optimizing effectiveness. Ann. Intern. Med. 2016, 164, 435–441. [Google Scholar] [CrossRef] [PubMed]
  15. Willis, T.A.; Hartley, S.; Glidewell, L.; Farrin, A.J.; Lawton, R.; McEachan, R.R.C.; Ingleson, E.; Heudtlass, P.; Collinson, M.; Clamp, S.; et al. Action to Support Practices Implement Research Evidence (ASPIRE): Protocol for a cluster-randomised evaluation of adaptable implementation packages targeting ‘high impact’ clinical practice recommendations in general practice. Implement. Sci. 2016, 11, 25. [Google Scholar] [CrossRef] [PubMed]
  16. Foster, M.; Presseau, J.; Podolsky, E.; McIntyre, L.; Papoulias, M.; Brehaut, J.C. How well do critical care audit and feedback interventions adhere to best practice? Development and application of the REFLECT-52 evaluation tool. Implement. Sci. 2021, 16, 81. [Google Scholar] [CrossRef]
  17. Angelici, L.; Angioletti, C.; Pinnarelli, L.; Colais, P.; de Mattia, E.; Agabiti, N.; Davoli, M.; Acampora, A. EASY-NET Program: Methods and Preliminary Results of an Audit and Feedback Intervention in the Emergency Care for Acute Myocardial Infarction in the Lazio Region, Italy. Healthcare 2023, 11, 1651. [Google Scholar] [CrossRef] [PubMed]
  18. EASY-NET Project Web Site. Available online: https://easy-net.info/ (accessed on 15 July 2022).
  19. Colquhoun, H.L.; Carroll, K.; Eva, K.W.; Grimshaw, J.M.; Ivers, N.; Michie, S.; Sales, A.; Brehaut, J.C. Advancing the literature on designing audit and feedback interventions: Identifying theory-informed hypotheses. Implement. Sci. 2017, 12, 117. [Google Scholar] [CrossRef] [PubMed]
  20. Bourrée, F.; Michel, P.; Salmi, L. Méthodes de consensus: Revue des méthodes originales et de leurs grandes variantes utilisées en santé publique [Consensus methods: Review of original methods and their main alternatives used in public health]. Rev. Epidemiol. Sante Publique 2008, 56, 415–423. [Google Scholar] [CrossRef] [PubMed]
  21. Laforgia, P.L.; Auguadro, C.; Bronzato, S.; Durante, A. The reduction of mortality in acute myocardial infarction: From bed rest to future directions. Int. J. Prev. Med. 2022, 13, 56. [Google Scholar] [PubMed]
  22. P.Re.Val.E. Edition 2022 Web Site. Volume of Hospitalization for AMI from 2012 to 2021. Available online: https://www.dep.lazio.it/prevale2022/risultati/tipo5/home_tipo5.php?ind=122&tipo=5&area=1 (accessed on 15 September 2022).
  23. Angelici, L.; Sorge, C.; Di Martino, M.; Cappai, G.; Stafoggia, M.; Agabiti, N.; Girardi, E.; Lanini, S.; Nicastri, E.; Davoli, M.; et al. Incidence of SARS-CoV-2 Infection and Related Mortality by Education Level during Three Phases of the 2020 Pandemic: A Population-Based Cohort Study in Rome. J. Clin. Med. 2022, 11, 877. [Google Scholar] [CrossRef]
  24. Rete Emergenza Ospedaliera—Afferenze Rete Emergenza Ospedaliera Adulti. Available online: https://www.regione.lazio.it/enti/salute/sistemi-emergenza/rete-emergenza-ospedaliera (accessed on 15 September 2023).
  25. Rete ICTUS. Available online: https://www.regione.lazio.it/enti/salute/sistemi-emergenza/rete-ictus- (accessed on 15 September 2023).
  26. Amato, L.; Fusco, D.; Acampora, A.; Bontempi, K.; Rosa, A.C.; Colais, P.; Cruciani, F.; D’Ovidio, M.; Mataloni, F.; Minozzi, S.; et al. Volume and health outcomes: Evidence from systematic reviews and from evaluation of Italian hospital data. Epidemiol. Prev. 2017, 41 (Suppl. 2), 1–128. [Google Scholar] [CrossRef]
  27. Programmazione Della Rete Ospedaliera 2021–2023 in Conformità Agli Standard Previsti Nel DM 70/2015. Available online: https://www.regione.lazio.it/sites/default/files/documentazione/SAL_DD_G01328_10_02_2022_Allegato_1.pdf (accessed on 28 December 2023).
  28. P.Re.Val.E. (Programma Regionale Valutazione Esiti”—Regional Program for Outcomes and Processes Evaluation-Strumenti per Audit) Edition 2022 Web Sites. Available online: https://www.dep.lazio.it/prevale2022/audit/audit_qualita1.php?ind=1 (accessed on 16 September 2023).
  29. The BC Emergency Medicine Network: Evaluation Approach and Early Findings. British Columbia Medical Journal. Available online: https://bcmj.org/articles/bc-emergency-medicine-network-evaluation-approach-and-early-findings (accessed on 27 December 2023).
  30. Evans, J.M.; Commisso, E.; Grudniewicz, A.; Im, J.; Veillard, J.; Richards, G. Managing the performance of healthcare networks: A ‘dance’ between control and collaboration. Public Manag. Rev. 2023. [Google Scholar] [CrossRef]
  31. Vola, F.; Benedetto, V.; Vainieri, M.; Nuti, S. The Italian interregional performance evaluation system. Res. Health Serv. Reg. 2022, 1, 1–14. [Google Scholar] [CrossRef]
  32. Il Sistema di Monitoraggio. Available online: https://www.salute.gov.it/portale/lea/dettaglioContenutiLea.jsp?lingua=italiano&id=4744&area=Lea&menu=monitoraggioLea (accessed on 28 December 2023).
Figure 1. Summary diagram of pre–post intervention design with control group.
Healthcare 12 00733 g001
Figure 2. DID-adjusted model for the evaluation of pre-/post-intervention (PP) changes in: (a) 30-day mortality after first hospital admission of AMI patients; (b) proportion of PTCA performed in STEMI patients within 90 min of admission to the ER; (c) in-hospital mortality within 30 days of first hospital admission in patients with ischemic stroke; (d) proportion of hospital readmissions within 30 days of discharge for ischemic stroke in exposed patients and controls.
Healthcare 12 00733 g002
Table 1. Characteristics of patients included in the AMI cohort in 2021 and 2022 from participating facilities by 30-day mortality after first hospital admission (Yes/No).
Thirty-Day Mortality after First Hospital Admission in Patients with AMIχ2
p-Value
YesNoTotal
NRow %NRow %N
Total839 11,357 12,196
A&F intervention 0.011
Exposed Groups5177.4648592.67002
Control Groups3226.2487293.85194
Year 0.842
20214096.8557793.25986
20224306.9578093.16210
Sex <0.0001
Female3549.8325190.23605
Male4855.6810694.48591
Age (years) <0.0001
19–59601.9303398.13093
60–69923.0297697.03068
70–792207.3279592.73015
80–10046715.5255384.53020
Education level <0.0001
Degree695.5117594.51244
Lower-middle high school2155.4373194.63946
Middle high school1765.1329294.93468
None or elementary school34011.2269288.83032
Not stated397.746792.3506
Concomitant clinical conditions
Cancer9714.457785.6674<0.0001
Diabetes8912.363387.7722<0.0001
Lipid metabolism disorders257.132992.93540.890
Obesity57.66192.4660.823
Obesity at indexed admission132.452597.6538<0.0001
Anemia6219.026481.0326<0.0001
Anemia at indexed admission549.750490.35580.008
Coagulation defects116.7583.360.343
Coagulation defects at indexed admission__3100.030.638
Other hematological diseases26.52993.5310.925
Other hematological diseases at indexed admission48.74291.3460.626
Arterial hypertension1129.1112590.912370.001
Previous myocardial infarction545.789594.39490.132
Other forms of ischemic heart disease909.090591.09950.005
Heart failure9016.645283.4542<0.0001
Not well-defined forms and complications of heart disease68.06992.0750.701
Rheumatic heart disease614.03786.0430.066
Rheumatic heart disease at indexed admission2716.913383.1160<0.0001
Cardiomyopathies814.54785.5550.024
Cardiomyopathies at indexed admission85.813194.21390.599
Acute endocarditis and myocarditis__6100.060.506
Other cardiac conditions1413.39186.71050.009
Other cardiac conditions at indexed admission3510.828989.23240.005
Conduction disorders and arrhythmias7513.149986.9574<0.0001
Cerebrovascular diseases4711.436688.64130.000
Cerebrovascular diseases at indexed admission3410.230089.83340.016
Vascular diseases4013.326086.7300<0.0001
Vascular diseases at indexed admission246.534893.53720.741
Chronic obstructive pulmonary disease (COPD)3813.224986.8287<0.0001
Chronic nephropathy6815.736484.3432<0.0001
Chronic kidney disease11610.994589.11061<0.0001
Chronic diseases (liver, pancreas, intestines)913.25986.8680.038
Chronic diseases (liver, pancreas, intestines) at indexed admission710.06390.0700.301
Previous coronary artery bypass grafting319.728790.33180.041
Previous coronary angioplasty655.3116894.712330.019
Cerebrovascular revascularization67.97092.1760.726
Other heart surgery1317.66182.4740.000
Other vessel surgery3011.423388.62630.003
Type of hospital * 0.120
EADI5546.8757593.28129
EADII2627.3332792.73589
ER234.845595.2478
* EADI: Emergency Admission Department level I; EADII: Emergency Admission Department level II; ER: Hospital Emergency Room.
Table 2. Characteristics of patients included in the STEMI cohort in 2021 and 2022 from participating facilities according to performing of PTCA within 90 min of admission to the ER (Yes/No).
% PTCA STEMI Patients within 90 min of Admission to the ERχ2
p-Value
YesNoTotal
NRow %NRow %N
Total3077 2007 5084
A&F intervention 0.069
Exposed Groups195059.6132240.43272
Control Groups112762.268537.81812
Year 0.003
2021142058.4101341.62433
2022165762.599437.52651
Sex <0.0001
Female70154.558645.51287
Male237662.6142137.43797
Age (years) <0.0001
21–5787967.342832.71307
58–6580866.540733.51215
66–7578160.151939.91300
76–10060948.365351.71262
Education level <0.0001
Degree33958.823841.2577
Lower-middle high school103162.262637.81657
Middle high school98863.058137.01569
None or elementary school54854.046746.01015
Not stated17164.39535.7266
Concomitant clinical conditions
Cancer10944.913455.1243<0.0001
Diabetes6741.69458.4161<0.0001
Lipid metabolism disorders3645.04455.0800.004
Obesity743.8956.3160.169
Obesity at indexed admission12656.89643.22220.240
Anemia1626.74473.360<0.0001
Anemia at indexed admission6037.79962.3159<0.0001
Coagulation defects1100.0__10.419
Coagulation defects at indexed admission1100.0__10.419
Other hematological diseases533.31066.7150.031
Other hematological diseases at indexed admission1164.7635.3170.724
Arterial hypertension16651.115948.93250.000
Previous myocardial infarction8138.413061.6211<0.0001
Other forms of ischemic heart disease9644.212155.8217<0.0001
Heart failure2732.55667.583<0.0001
Not well-defined forms and complications of heart disease430.8969.2130.028
Rheumatic heart disease450.0450.080.542
Rheumatic heart disease at indexed admission1841.92558.1430.012
Cardiomyopathies318.81381.3160.001
Cardiomyopathies at indexed admission2339.73560.3580.001
Acute endocarditis and myocarditis__1100.010.216
Other cardiac conditions215.41184.6130.001
Other cardiac conditions at indexed admission2131.84568.266<0.0001
Conduction disorders and arrhythmias4536.97763.1122<0.0001
Cerebrovascular diseases5445.06655.01200.000
Cerebrovascular diseases at indexed admission4234.48065.6122<0.0001
Vascular diseases2835.05265.080<0.0001
Vascular diseases at indexed admission4239.66460.4106<0.0001
Chronic obstructive pulmonary disease (COPD)2338.33761.7600.000
Chronic nephropathy3738.16061.997<0.0001
Chronic kidney disease13144.316555.7296<0.0001
Chronic diseases (liver, pancreas, intestines)947.41052.6190.240
Chronic diseases (liver, pancreas, intestines) at indexed admission1348.11451.9270.187
Previous coronary artery bypass grafting1941.32758.7460.007
Previous coronary angioplasty15950.615549.43140.000
Cerebrovascular revascularization1062.5637.5160.871
Other heart surgery628.61571.4210.003
Other vessel surgery2537.94162.1660.000
Type of hospital * 0.142
EADI190961.3120438.73113
EADII116859.380340.71971
* EADI: Emergency Admission Department level I; EADII: Emergency Admission Department level II.
Table 3. Characteristics of patients included in the ischemic stroke cohort in 2021 and 2022 from participating facilities by in-hospital mortality within 30 days of first hospital admission in patients with ischemic stroke (Yes/No).
Thirty-Day In-Hospital Mortality after Admission in Patients with Ischemic Strokeχ2
p-Value
YesNoTotal
NRow %NRow %N
Total432 5517 5949
A&F intervention 0.006
Exposed Groups2498.2280391.83052
Control Groups1836.3271493.72897
Year 0.081
20212327.9272292.12954
20222006.7279593.32995
Sex <0.0001
Female2438.8251291.22755
Male1895.9300594.13194
Age (years) <0.0001
35–66261.7148298.31508
67–76714.8140195.21472
77–831117.8131892.21429
84–10022414.5131685.51540
Education level <0.0001
Degree244.254395.8567
Lower-middle high school1076.7149293.31599
Middle high school765.5130494.51380
None or elementary21110.0190190.02112
Not stated144.827795.2291
Concomitant clinical conditions
Cancer219.919290.12130.137
Diabetes3411.825488.22880.002
Lipid metabolism disorders76.410393.61100.714
Obesity411.13288.9360.372
Obesity at indexed admission96.513093.51390.718
Anemia2313.514786.51700.001
Anemia at indexed admission116.116993.91800.546
Coagulation defects__3100.030.628
Coagulation defects at indexed admission18.31191.7120.886
Other hematological diseases16.71493.3150.929
Other hematological diseases at indexed admission49.33990.7430.605
Arterial hypertension7112.052088.0591<0.0001
Previous myocardial infarction1411.111288.91260.092
Other forms of ischemic heart disease2710.722689.32530.033
Heart failure5017.423782.6287<0.0001
Not well-defined forms and complications of heart disease49.83790.2410.537
Rheumatic heart disease817.83782.2450.006
Rheumatic heart disease at indexed admission23.35896.7600.239
Cardiomyopathies310.02790.0300.562
Cardiomyopathies at indexed admission38.33391.7360.804
Acute endocarditis and myocarditis__3100.030.628
Other cardiac conditions1214.67085.4820.010
Other cardiac conditions at indexed admission83.522096.52280.026
Conduction disorders and arrhythmias5514.632185.4376<0.0001
Cerebrovascular diseases409.637890.44180.059
Vascular diseases118.012692.01370.726
Vascular diseases at indexed admission156.023394.02480.452
Chronic obstructive pulmonary disease (COPD)2116.910383.1124<0.0001
Chronic nephropathy2616.413383.6159<0.0001
Chronic nephropathy at indexed admission2913.219186.82200.001
Chronic kidney disease38.63291.4350.765
Diseases chronic diseases (liver, pancreas, intestines)24.84095.2420.531
Diseases chronic diseases (liver, pancreas, intestines) at indexed admission96.313593.81440.636
Cerebrovascular revascularization__27100.0270.145
Other heart surgery1319.45480.667<0.0001
Other vessel surgery118.511991.51300.594
Type of hospital * 0.207
noNVT1512.011088.0125
NVT116.316493.7175
NTUI2097.1274292.92951
NTUII1977.3250192.72698
* noNVT: Hospital without Neurovascular Treatment Team; NVT: Hospital with a Neurovascular Treatment Team; NTUI: Neurovascular Treatment Unit level I; NTUII: Neurovascular Treatment Unit level II.
Table 4. Characteristics of patients included in the stroke cohort in 2021 and 2022 from participating facilities according to hospital readmissions within 30 days of discharge for ischemic stroke (Yes/No).
% of Hospital Readmissions within 30 days of Discharge for Ischemic Strokeχ2
p-Value
YesNoTotal
NRow %NRow %N
Total392 5061 5453
A&F intervention 0.910
Exposed Groups2017.8258092.82781
Control Groups1917.7248192.92672
Year 0.248
20211827.3250393.22685
20222108.2255892.42768
Sex 0.062
Female1596.9232193.62480
Male2338.5274092.22973
Age (years) 0.005
35–66715.5129694.81367
67–761018.1124092.51341
77–831259.4132391.41448
84–100957.9120292.71297
Education level 0.432
Degree418.249892.4539
Lower-middle high school966.9138493.51480
Middle high school907.5120293.01292
None or elementary school1498.7171992.01868
Not stated166.225894.2274
Concomitant clinical conditions
Cancer169.117591.61910.518
Diabetes187.823292.82500.994
Lipid metabolism disorders77.59393.01000.941
Obesity414.32887.5320.243
Obesity at indexed admission43.212596.91290.069
Anemia129.013391.71450.608
Anemia at indexed admission128.114992.51610.895
Coagulation defects150.0266.730.080
Coagulation defects at indexed admission111.1990.0100.731
Other hematological diseases17.71392.9140.995
Other hematological diseases at indexed admission25.63694.7380.645
Arterial hypertension357.348193.25160.708
Previous myocardial infarction76.710493.71110.716
Other forms of ischemic heart disease178.320592.32220.782
Heart failure2713.020788.52340.009
Not well-defined forms and complications of heart disease412.13389.2370.392
Rheumatic heart disease516.13186.1360.118
Rheumatic heart disease at indexed admission1021.34782.5570.002
Cardiomyopathies13.82696.3270.482
Cardiomyopathies at indexed admission310.03090.9330.671
Acute endocarditis and myocarditis__3100.030.630
Other cardiac conditions813.36088.2680.142
Other cardiac conditions at indexed admission167.920392.72190.945
Conduction disorders and arrhythmias3010.528690.53160.102
Cerebrovascular diseases329.434091.43720.274
Vascular diseases119.611491.21250.481
Vascular diseases at indexed admission115.022195.32320.140
Chronic obstructive pulmonary disease (COPD)1010.89390.31030.318
Chronic nephropathy1815.911386.31310.003
Chronic nephropathy at indexed admission2313.916687.81890.007
Chronic kidney disease623.12681.3320.011
Diseases chronic diseases (liver, pancreas, intestines)38.33692.3390.903
Diseases chronic diseases (liver, pancreas, intestines) at indexed admission97.312393.21320.868
Cerebrovascular revascularization__27100.0270.147
Other heart surgery715.24686.8530.088
Other vessel surgery1110.510590.51160.334
Type of hospital * 0.551
noNVT87.810292.7110
NVT1611.014690.1162
NTUI1977.9250692.72703
NTUII1717.4230793.12478
* noNVT: Hospital without Neurovascular Treatment Team; NVT: Hospital with a Neurovascular Treatment Team; NTUI: Neurovascular Treatment Unit level I; NTUII: Neurovascular Treatment Unit level II.
Table 5. Unadjusted and adjusted DID model results for the assessment of change (PP; 95% CI) pre-/post-intervention for indicators in AMI/STEMI pathway.
AMI/STEMI Pathway
IndicatorsFacilities (Patients)30-Day Mortality after First Hospital Admission in Patients with AMIFacilities
(Patients)
% PTCA-STEMI Patients within 90 min of Admission to the ER
UnadjustedAdjusted * UnadjustedAdjusted **
Exposed Group
“Pre-”—2021 (%)12 (3393)7.4010.5112 (1541)58.6658.12
“Post-”—2022 (%)15 (3609)7.3710.2912 (1731)60.4359.43
Difference Post-/Pre- (PP) −0.03−0.22 1.771.31
Control Group
“Pre-”—2021 (%)15 (2593)6.099.488 (892)57.8556.79
“Post”—2022 (%)16 (2601)6.319.348 (920)66.4165.42
Difference Post-/Pre- (PP) 0.22−0.14 8.568.63
DID PP −0.24−0.08 −6.80−7.29
(95% CI) (−2.03; 1.56)(−2.80; 2.65) (−12.38; −1.22)(−12.75; −1.83)
p-value for interaction 0.7940.956 0.0170.009
DID: Post-/Pre-intervention changes in the exposed groups and post-/pre-intervention changes in controls in percentage points (PP). After a stepwise procedure on all variables associated with the outcome: * the model was adjusted for sex, age in classes, cancer, anemia, prior myocardial infarction, heart failure, diabetes, and prior systolic coronary angioplasty; ** the model was adjusted for sex, age in classes, cancer, anemia present at the STEMI episode, prior myocardial infarction, prior conduction disorders, prior arrhythmias, and chronic nephropathy present at the STEMI episode.
Table 6. Unadjusted and adjusted DID model results for assessment of change (PP; 95% CI) pre/post-intervention for indicators in ischemic stroke pathway.
Ischemic Stroke Pathway
IndicatorsFacilities
(Patients)
Thirty-Day In-Hospital Mortality after Admission in Patients with Ischemic StrokeFacilities
(Patients)
% of Hospital Readmissions within 30 days of Discharge for Ischemic Stroke
UnadjustedAdjusted * UnadjustedAdjusted **
Exposed Group
“Pre-”—2021 (%)8 (1885)8.547.898 (1711)7.367.33
“Post-”—2022 (%)8 (1908)6.877.158 (1760)6.886.79
Difference Post-/Pre- (PP) −1.67−0.74 −0.48−0.54
Control Group
“Pre-”—2021 (%)8 (1069)6.646.658 (974)5.755.51
“Post-”—2022 (%)9 (1087)6.356.919 (1008)8.838.76
Difference Post-/Pre- (PP) −0.290.26 3.083.25
DID PP −1.38−0.99 −3.57−3.80
(95% CI) (−4.07; 1.30)(−2.93; 0.95) (−6.42; −0.72)(−6.57; −1.03)
p-value for interaction 0.3130.315 0.0140.007
DID: Changes in exposed groups post-/pre-intervention and changes in controls post-/pre-intervention in percentage points (PP). After a stepwise procedure on all variables associated with the outcome: * the model was adjusted for gender, age in classes, chronic nephropathy, and rheumatic heart disease at admission for ischemic stroke; ** the model was adjusted for gender, age in classes, heart failure, cerebrovascular disease at the time of admission for ischemic stroke, and hypertension.
Disclaimer/Publisher’s Note: The statements, opinions and data contained in all publications are solely those of the individual author(s) and contributor(s) and not of MDPI and/or the editor(s). MDPI and/or the editor(s) disclaim responsibility for any injury to people or property resulting from any ideas, methods, instructions or products referred to in the content.

