

The Healthspan Project: A Retrospective Pilot of Biomarkers and Biometric Outcomes after a 6-Month Multi-Modal Wellness Intervention
 ,
,
Abstract
:1. Introduction
2. Materials and Methods
2.1. Participants
2.2. Healthspan Therapies
2.3. Serum Biomarkers
2.4. Body Composition
2.5. Heart Rate Variability
2.6. Statistical Analysis
3. Results
3.1. Participants
3.2. Biomarkers
3.3. Body Composition
3.4. Heart Rate Variability
4. Discussion
5. Conclusions
Author Contributions
Funding
Institutional Review Board Statement
Informed Consent Statement
Data Availability Statement
Conflicts of Interest
References
- Glob Wellness Institute. Wellness Economy Statistics & Facts. Available online: https://globalwellnessinstitute.org/press-room/statistics-and-facts/ (accessed on 12 December 2023).
- Kinsella, K. Changes in life expectancy 1900–1990. Am. J. Clin. Nutr. 1992, 55, 1196S–1202S. [Google Scholar] [CrossRef]
- Jaul, E.; Barron, J. Age-Related Diseases and Clinical and Public Health Implications for the 85 Years Old and Over Population. Front. Public Health 2017, 5, 335. [Google Scholar] [CrossRef] [PubMed]
- Garmany, A.; Yamada, S.; Terzic, A. Longevity leap: Mind the healthspan gap. NPJ Regen. Med. 2021, 6, 57. [Google Scholar] [CrossRef] [PubMed]
- Tinetti, M.E.; Fried, T. The end of the disease era. Am. J. Med. 2004, 116, 179–185. [Google Scholar] [CrossRef] [PubMed]
- Beltrán-Sánchez, H.; Soneji, S.; Crimmins, E.M. Past, Present, and Future of Healthy Life Expectancy. Cold Spring Harb. Perspect. Med. 2015, 5, a025957. [Google Scholar] [CrossRef] [PubMed]
- Gruber, J.; Halliwell, B. Approaches for extending human healthspan: From antioxidants to healthspan pharmacology. Essays Biochem. 2017, 61, 389–399. [Google Scholar] [CrossRef]
- Fischer, F.H.; Lewith, G.; Witt, C.M.; Linde, K.; von Ammon, K.; Cardini, F.; Falkenberg, T.; Fønnebø, V.; Johannessen, H.; Reiter, B.; et al. High prevalence but limited evidence in complementary and alternative medicine: Guidelines for future research. BMC Complement. Altern. Med. 2014, 14, 46. [Google Scholar] [CrossRef]
- Oura Help. Heart Rate Variability. Available online: https://support.ouraring.com/hc/en-us/articles/360025441974-Heart-Rate-Variability (accessed on 17 October 2023).
- Nuuttila, O.-P.; Seipäjärvi, S.; Kyröläinen, H.; Nummela, A. Reliability and Sensitivity of Nocturnal Heart Rate and Heart-Rate Variability in Monitoring Individual Responses to Training Load. Int. J. Sports Physiol. Perform. 2022, 17, 1296–1303. [Google Scholar] [CrossRef]
- Mishica, C.; Kyröläinen, H.; Hynynen, E.; Nummela, A.; Holmberg, H.-C.; Linnamo, V. Evaluation of nocturnal vs. morning measures of heart rate indices in young athletes. PLoS ONE 2022, 17, e0262333. [Google Scholar] [CrossRef]
- R Core Team. R: A Language and Environment for Statistical Computing; R Foundation for Statistical Computing: Vienna, Austria, 2023. [Google Scholar]
- Wickham, H.; Averick, M.; Bryan, J.; Chang, W.; McGowan, L.D.A.; François, R.; Grolemund, G.; Hayes, A.; Henry, L.; Hester, J.; et al. Welcome to the tidyverse. J. Open Source Softw. 2019, 4, 1686. [Google Scholar] [CrossRef]
- Pinheiro, J.; Bates, D.; R Core Team. nlme: Linear and Nonlinear Mixed Effects Models. 2023. Available online: https://cran.r-project.org/web/packages/nlme/nlme.pdf (accessed on 5 June 2023).
- Myers, G.L.; Rifai, N.; Tracy, R.P.; Roberts, W.L.; Alexander, R.W.; Biasucci, L.M.; Catravas, J.D.; Cole, T.G.; Cooper, G.R.; Khan, B.V.; et al. CDC/AHA Workshop on Markers of Inflammation and Cardiovascular Disease. Circulation 2004, 110, e545–e549. [Google Scholar] [CrossRef]
- Echouffo-Tcheugui, J.B.; Perreault, L.; Ji, L.; Dagogo-Jack, S. Diagnosis and Management of Prediabetes: A Review. JAMA 2023, 329, 1206–1216. [Google Scholar] [CrossRef] [PubMed]
- Expert Panel on Detection E and Treatment of High Blood Cholesterol in Adults. Executive Summary of the Third Report of the National Cholesterol Education Program (NCEP) Expert Panel on Detection, Evaluation, and Treatment of High Blood Cholesterol in Adults (Adult Treatment Panel III). JAMA 2001, 285, 2486–2497. [Google Scholar] [CrossRef] [PubMed]
- Little, R.R.; Rohlfing, C.L.; Sacks, D.B.; National Glycohemoglobin Standardization Program (NGSP) Steering Committee. Status of Hemoglobin A1c Measurement and Goals for Improvement: From Chaos to Order for Improving Diabetes Care. Clin. Chem. 2011, 57, 205–214. [Google Scholar] [CrossRef] [PubMed]
- Luca, A.C.; David, S.G.; David, A.G.; Țarcă, V.; Pădureț, I.-A.; Mîndru, D.E.; Roșu, S.T.; Roșu, E.V.; Adumitrăchioaiei, H.; Bernic, J.; et al. Atherosclerosis from Newborn to Adult-Epidemiology, Pathological Aspects, and Risk Factors. Life 2023, 13, 2056. [Google Scholar] [CrossRef] [PubMed]
- Silverman, M.G.; Ference, B.A.; Im, K.; Wiviott, S.D.; Giugliano, R.P.; Grundy, S.M.; Braunwald, E.; Sabatine, M.S. Association between Lowering LDL-C and Cardiovascular Risk Reduction among Different Therapeutic Interventions: A Systematic Review and Meta-analysis. JAMA 2016, 316, 1289–1297. [Google Scholar] [CrossRef] [PubMed]
- Penson, P.E.; Long, D.L.; Howard, G.; Toth, P.P.; Muntner, P.; Howard, V.J.; Safford, M.M.; Jones, S.R.; Martin, S.S.; Mazidi, M.; et al. Associations between very low concentrations of low density lipoprotein cholesterol, high sensitivity C-reactive protein, and health outcomes in the Reasons for Geographical and Racial Differences in Stroke (REGARDS) study. Eur. Heart J. 2018, 39, 3641–3653. [Google Scholar] [CrossRef]
- Shuster, A.; Patlas, M.; Pinthus, J.H.; Mourtzakis, M. The clinical importance of visceral adiposity: A critical review of methods for visceral adipose tissue analysis. Br. J. Radiol. 2012, 85, 1–10. [Google Scholar] [CrossRef]
- Neeland, I.J.; Ross, R.; Després, J.-P.; Matsuzawa, Y.; Yamashita, S.; Shai, I.; Seidell, J.; Magni, P.; Santos, R.D.; Arsenault, B.; et al. Visceral and ectopic fat, atherosclerosis, and cardiometabolic disease: A position statement. Lancet Diabetes Endocrinol. 2019, 7, 715–725. [Google Scholar] [CrossRef]
- Duren, D.L.; Sherwood, R.J.; Czerwinski, S.A.; Lee, M.; Choh, A.C.; Siervogel, R.M.; Chumlea, W.C. Body Composition Methods: Comparisons and Interpretation. J. Diabetes Sci. Technol. 2008, 2, 1139–1146. [Google Scholar] [CrossRef]
- Achamrah, N.; Colange, G.; Delay, J.; Rimbert, A.; Folope, V.; Petit, A.; Grigioni, S.; Déchelotte, P.; Coëffier, M. Comparison of body composition assessment by DXA and BIA according to the body mass index: A retrospective study on 3655 measures. PLoS ONE 2018, 13, e0200465. [Google Scholar] [CrossRef]
- McLester, C.N.; Nickerson, B.S.; Kliszczewicz, B.M.; McLester, J.R. Reliability and Agreement of Various InBody Body Composition Analyzers as Compared to Dual-Energy X-ray Absorptiometry in Healthy Men and Women. J. Clin. Densitom. 2020, 23, 443–450. [Google Scholar] [CrossRef]
- Tiwari, R.; Kumar, R.; Malik, S.; Raj, T.; Kumar, P. Analysis of Heart Rate Variability and Implication of Different Factors on Heart Rate Variability. Curr. Cardiol. Rev. 2021, 17, e160721189770. [Google Scholar] [CrossRef] [PubMed]
- Jarczok, M.N.; Weimer, K.; Braun, C.; Williams, D.P.; Thayer, J.F.; Gündel, H.O.; Balint, E.M. Heart rate variability in the prediction of mortality: A systematic review and meta-analysis of healthy and patient populations. Neurosci. Biobehav. Rev. 2022, 143, 104907. [Google Scholar] [CrossRef]
- Hill, L.K.; Siebenbrock, A. Are all measures created equal? Heart rate variability and respiration—Biomed 2009. Biomed. Sci. Instrum. 2009, 45, 71–76. [Google Scholar] [PubMed]
- Billman, G. Heart Rate Variability—A Historical Perspective. Front. Physiol. 2011, 2, 86. [Google Scholar] [CrossRef] [PubMed]
- Kinnunen, H.; Rantanen, A.; Kenttä, T.; Koskimäki, H. Feasible assessment of recovery and cardiovascular health: Accuracy of nocturnal HR and HRV assessed via ring PPG in comparison to medical grade ECG. Physiol. Meas. 2020, 41, 04NT01. [Google Scholar] [CrossRef]
- Buchheit, M. Monitoring training status with HR measures: Do all roads lead to Rome? Front. Physiol. 2014, 5, 73. [Google Scholar] [CrossRef]
- Rose, C.; Edwards, K.; Siegler, J.; Graham, K.; Caillaud, C. Whole-body Cryotherapy as a Recovery Technique after Exercise: A Review of the Literature. Int. J. Sports Med. 2017, 38, 1049–1060. [Google Scholar] [CrossRef]
- Iwen, K.A.; Backhaus, J.; Cassens, M.; Waltl, M.; Hedesan, O.C.; Merkel, M.; Heeren, J.; Sina, C.; Rademacher, L.; Windjäger, A.; et al. Cold-Induced Brown Adipose Tissue Activity Alters Plasma Fatty Acids and Improves Glucose Metabolism in Men. J. Clin. Endocrinol. Metab. 2017, 102, 4226–4234. [Google Scholar] [CrossRef]
- Behzadi, P.; Gravel, H.; Neagoe, P.-E.; Barry, H.; Sirois, M.G.; Gagnon, D. Impact of Finnish sauna bathing on circulating markers of inflammation in healthy middle-aged and older adults: A crossover study. Complement. Ther. Med. 2020, 52, 102486. [Google Scholar] [CrossRef] [PubMed]
- Laukkanen, J.A.; Laukkanen, T. Sauna bathing and systemic inflammation. Eur. J. Epidemiol. 2018, 33, 351–353. [Google Scholar] [CrossRef]
- Brunt, V.E.; Eymann, T.M.; Francisco, M.A.; Howard, M.J.; Minson, C.T. Passive heat therapy improves cutaneous microvascular function in sedentary humans via improved nitric oxide-dependent dilation. J. Appl. Physiol. 2016, 121, 716–723. [Google Scholar] [CrossRef]
- Pilch, W.; Szyguła, Z.; Klimek, A.; Pałka, T.; Cisoń, T.; Pilch, P.; Torii, M. Changes in the lipid profile of blood serum in women taking sauna baths of various duration. Int. J. Occup. Med. Environ. Health 2010, 23, 167–174. [Google Scholar] [CrossRef]
- Hamblin, M.R. Traditional or Infrared Saunas and Photobiomodulation: What Do They Have in Common? Photobiomodulation Photomed. Laser Surg. 2022, 40, 595–596. [Google Scholar] [CrossRef] [PubMed]
- Padoin, S.; Zeffa, A.C.; Corrêa, J.C.M.; de Angelis, T.R.; Moreira, T.B.; Barazetti, L.K.; de Paula Ramos, S. Phototherapy Improves Muscle Recovery and Does Not Impair Repeated Bout Effect in Plyometric Exercise. J. Strength. Cond. Res. 2022, 36, 3301–3310. [Google Scholar] [CrossRef]
- Barrett, D.W.; Gonzalez-Lima, F. Transcranial infrared laser stimulation produces beneficial cognitive and emotional effects in humans. Neuroscience 2013, 230, 13–23. [Google Scholar] [CrossRef]
- Liebert, A.; Bicknell, B.; Laakso, E.-L.; Heller, G.; Jalilitabaei, P.; Tilley, S.; Mitrofanis, J.; Kiat, H. Improvements in clinical signs of Parkinson’s disease using photobiomodulation: A prospective proof-of-concept study. BMC Neurol. 2021, 21, 256. [Google Scholar] [CrossRef]
- Martins, J.P.S.; de Lima, C.J.; Fernandes, A.B.; Alves, L.P.; Neto, O.P.; Villaverde, A.B. Analysis of pain relief and functional recovery in patients with rotator cuff tendinopathy through therapeutic ultrasound and photobiomodulation therapy: A comparative study. Lasers Med. Sci. 2022, 37, 3155–3167. [Google Scholar] [CrossRef]
- Martin, J.S.; Borges, A.R.; Beck, D.T. Peripheral conduit and resistance artery function are improved following a single, 1-h bout of peristaltic pulse external pneumatic compression. Eur. J. Appl. Physiol. 2015, 115, 2019–2029. [Google Scholar] [CrossRef]
- Zaleska, M.; Olszewski, W.L.; Durlik, M. The effectiveness of intermittent pneumatic compression in long-term therapy of lymphedema of lower limbs. Lymphat. Res. Biol. 2014, 12, 103–109. [Google Scholar] [CrossRef] [PubMed]
- Heapy, A.M.; Hoffman, M.D.; Verhagen, H.H.; Thompson, S.W.; Dhamija, P.; Sandford, F.J.; Cooper, M.C. A randomized controlled trial of manual therapy and pneumatic compression for recovery from prolonged running—An extended study. Res. Sports Med. 2018, 26, 354–364. [Google Scholar] [CrossRef]
- Haun, C.T.; Roberts, M.D.; Romero, M.A.; Osburn, S.C.; Mobley, C.B.; Anderson, R.G.; Goodlett, M.D.; Pascoe, D.D.; Martin, J.S. Does external pneumatic compression treatment between bouts of overreaching resistance training sessions exert differential effects on molecular signaling and performance-related variables compared to passive recovery? An exploratory study. PLoS ONE 2017, 12, e0180429. [Google Scholar] [CrossRef]
- Ried, K.; Travica, N.; Sali, A. The acute effect of high-dose intravenous vitamin C and other nutrients on blood pressure: A cohort study. Blood Press. Monit. 2016, 21, 160–167. [Google Scholar] [CrossRef]
- Buijs, N.; Brinkmann, S.J.; Oosterink, J.E.; Luttikhold, J.; Schierbeek, H.; Wisselink, W.; Beishuizen, A.; van Goudoever, J.B.; Houdijk, A.P.; van Leeuwen, P.A.; et al. Intravenous glutamine supplementation enhances renal de novo arginine synthesis in humans: A stable isotope study. Am. J. Clin. Nutr. 2014, 100, 1385–1391. [Google Scholar] [CrossRef]
- Cui, Y.; Hu, L.; Liu, Y.; Wu, Y.; Jing, L. Intravenous alanyl-L-glutamine balances glucose-insulin homeostasis and facilitates recovery in patients undergoing colonic resection: A randomised controlled trial. Eur. J. Anaesthesiol. 2014, 31, 212–218. [Google Scholar] [CrossRef]
- Tanzilli, G.; Truscelli, G.; Arrivi, A.; Carnevale, R.; Placanica, A.; Viceconte, N.; Raparelli, V.; Mele, R.; Cammisotto, V.; Nocella, C.; et al. Glutathione infusion before primary percutaneous coronary intervention: A randomised controlled pilot study. BMJ Open 2019, 9, e025884. [Google Scholar] [CrossRef]
- Sechi, G.; Deledda, M.G.; Bua, G.; Satta, W.M.; Deiana, G.A.; Pes, G.M.; Rosati, G. Reduced intravenous glutathione in the treatment of early Parkinson’s disease. Prog. Neuro-Psychopharmacol. Biol. Psychiatry 1996, 20, 1159–1170. [Google Scholar] [CrossRef]
- de Brito, E.; de Oliveira Teixeira, A.; Righi, N.C.; da Silva Paulitcth, F.; da Silva AM, V.; Signori, L.U. Vitamins C and E Associated with Cryotherapy in the Recovery of the Inflammatory Response after Resistance Exercise: A Randomized Clinical Trial. J. Strength. Cond. Res. 2022, 36, 135–141. [Google Scholar] [CrossRef]
- Waterman, B.; Walker, J.J.; Swaims, C.; Shortt, M.; Todd, M.S.; Machen, S.M.; Owens, B.D. The Efficacy of Combined Cryotherapy and Compression Compared with Cryotherapy Alone Following Anterior Cruciate Ligament Reconstruction. J. Knee Surg. 2012, 25, 155–160. [Google Scholar] [CrossRef]
- Berisha-Muharremi, V.; Tahirbegolli, B.; Phypers, R.; Hanna, R. Efficacy of Combined Photobiomodulation Therapy with Supplements versus Supplements alone in Restoring Thyroid Gland Homeostasis in Hashimoto Thyroiditis: A Clinical Feasibility Parallel Trial with 6-Months Follow-Up. J. Pers. Med. 2023, 13, 1274. [Google Scholar] [CrossRef]


| Therapy | Summary Mean (SD) |
|---|---|
| WBC | 46.88 (44.97) |
| IR Sauna | 17.69 (19.96) |
| PBM | 40.31 (49.30) |
| Compression | 13.50 (16.80) |
| mHbOT | 21.13 (18.92) |
| IV * | 27.06 (16.47) |
| IM * | 15.63 (10.54) |
| n | 16 |
| Days in intervention | 213.88 (115.32) |
| Variable | Before Mean (SD) | After Mean (SD) | Paired Difference Mean (SD) a | Paired Test p-Value b | |
|---|---|---|---|---|---|
| Healthspan Overall | n | 25 | 15 | NA | NA |
| Sex | 12F/13M | 8F/7M | NA | NA | |
| Age (years) | 46.3 (10.1) | 49.8 (9.35) | NA | NA | |
| HbA1c (%) | 5.10 (0.32) | 5.29 (0.30) | 0.12 (0.13) | 0.012 * | |
| Fasting glucose (mg/dL) | 96.91 (13.71) | 98.00 (14.61) | −1.62 (15.62) | 0.716 | |
| hsCRP (mg/L) | 2.87 (3.19) | 1.79 (1.93) | −1.75 (2.66) | 0.043 * | |
| LDL (mg/dL) | 124.08 (51.13) | 107.08 (38.86) | −9.77 (15.43) | 0.041 * | |
| HDL (mg/dL) | 58.24 (13.20) | 57.31 (14.04) | −0.46 (7.56) | 0.829 | |
| Triglycerides (mg/dL) | 131.24 (99.48) | 110.46 (57.54) | −10.15 (43.49) | 0.416 | |
| Body Composition Subset | n | 10 | 8 | NA | NA |
| Sex | 5F/5M | 4F/4M | NA | NA | |
| Age (years) | 44.7 (8.16) | 42.9 (8.25) | NA | NA | |
| Weight (kg) | 88.83 (14.33) | 86.61 (14.75) | −3.29 (3.75) | 0.042 * | |
| HRV Subset | n | 7 | 7 | NA | NA |
| Sex | 2F/5M | 2F/5M | NA | NA | |
| Age (years) | 43.3 (7.8) | 43.9 (7.7) | NA | NA |
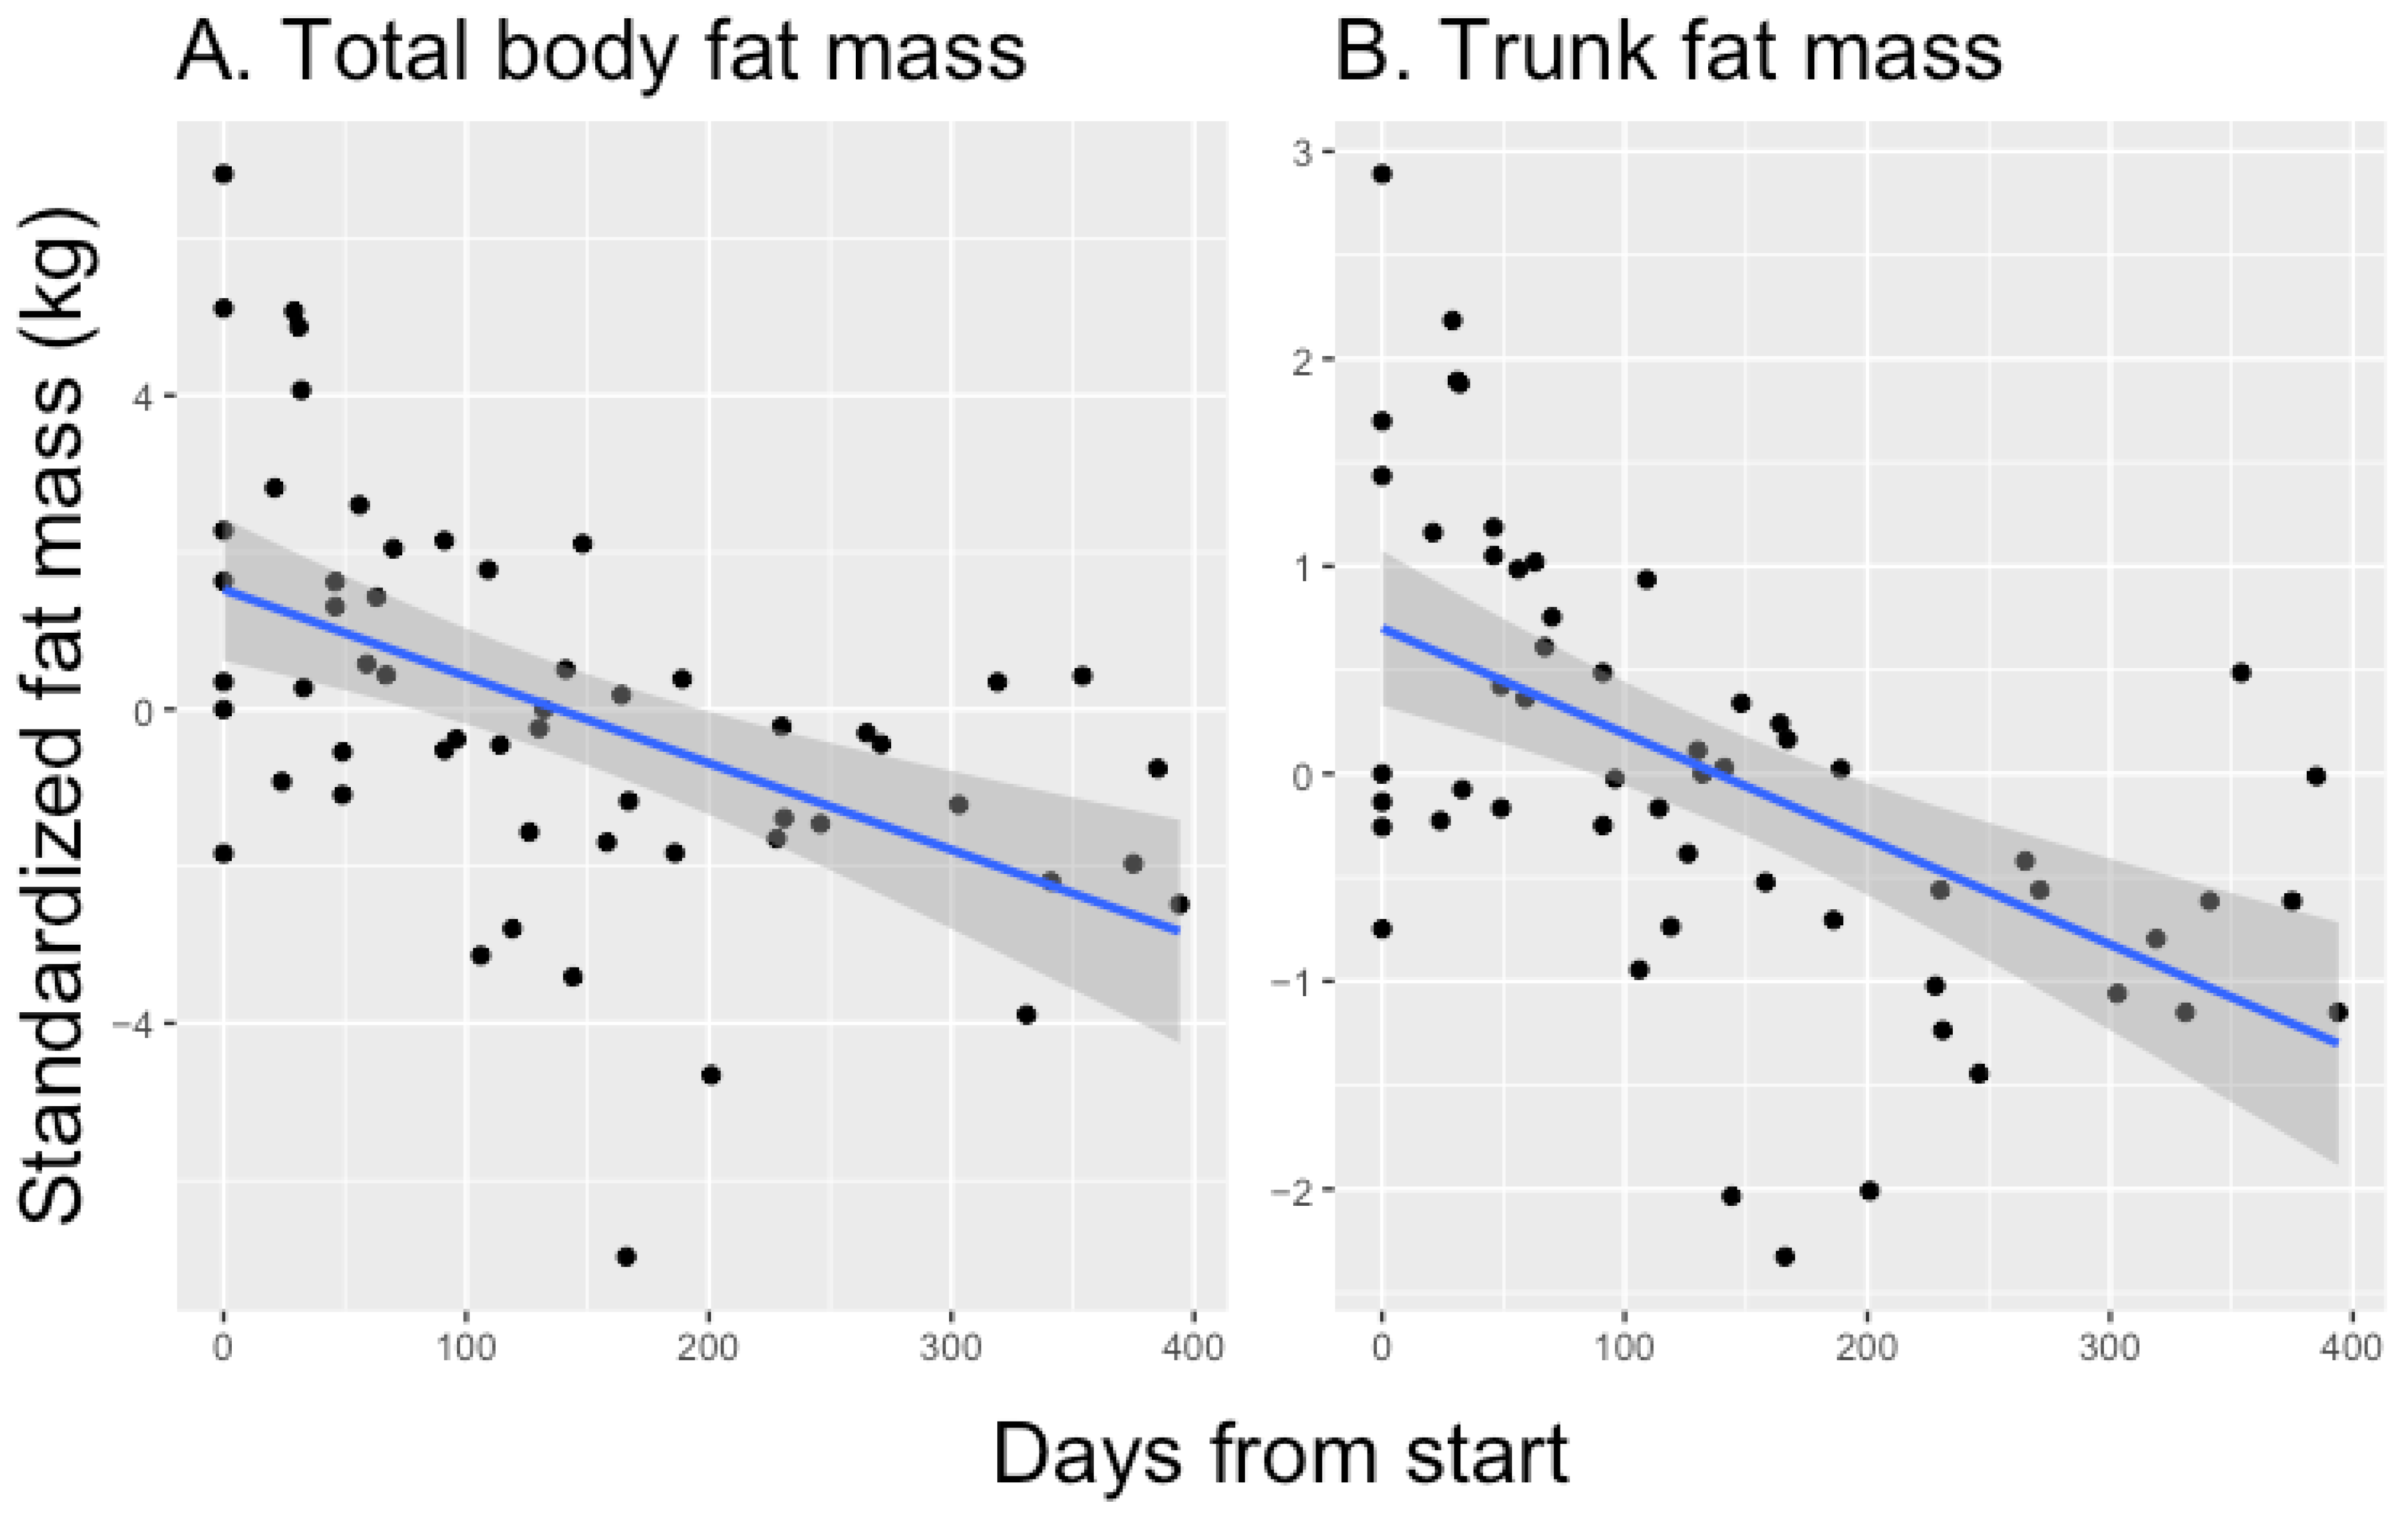
| Metric | Model Estimate (units/day) | 6-Month Scaled Estimate | Adjusted p-Value |
|---|---|---|---|
| Weight (kg) | −0.0127 | −2.2861 | 0.0000 |
| Body fat mass (BFM) (kg) | −0.0129 | −2.3270 | 0.0000 |
| Body mass index (BMI) (kg/m2) | −0.0050 | −0.9000 | 0.0000 |
| BFM right arm (kg) | −0.0018 | −0.3184 | 0.0000 |
| BFM left arm (kg) | −0.0018 | −0.3184 | 0.0000 |
| BFM trunk (kg) | −0.0059 | −1.0533 | 0.0000 |
| BFM left leg (kg) | −0.0016 | −0.2939 | 0.0003 |
| Arm circumference (cm) | −0.0043 | −0.7772 | 0.0005 |
| BFM right leg (kg) | −0.0015 | −0.2694 | 0.0010 |
| Visceral fat (levels) | −0.0042 | −0.7560 | 0.0018 |
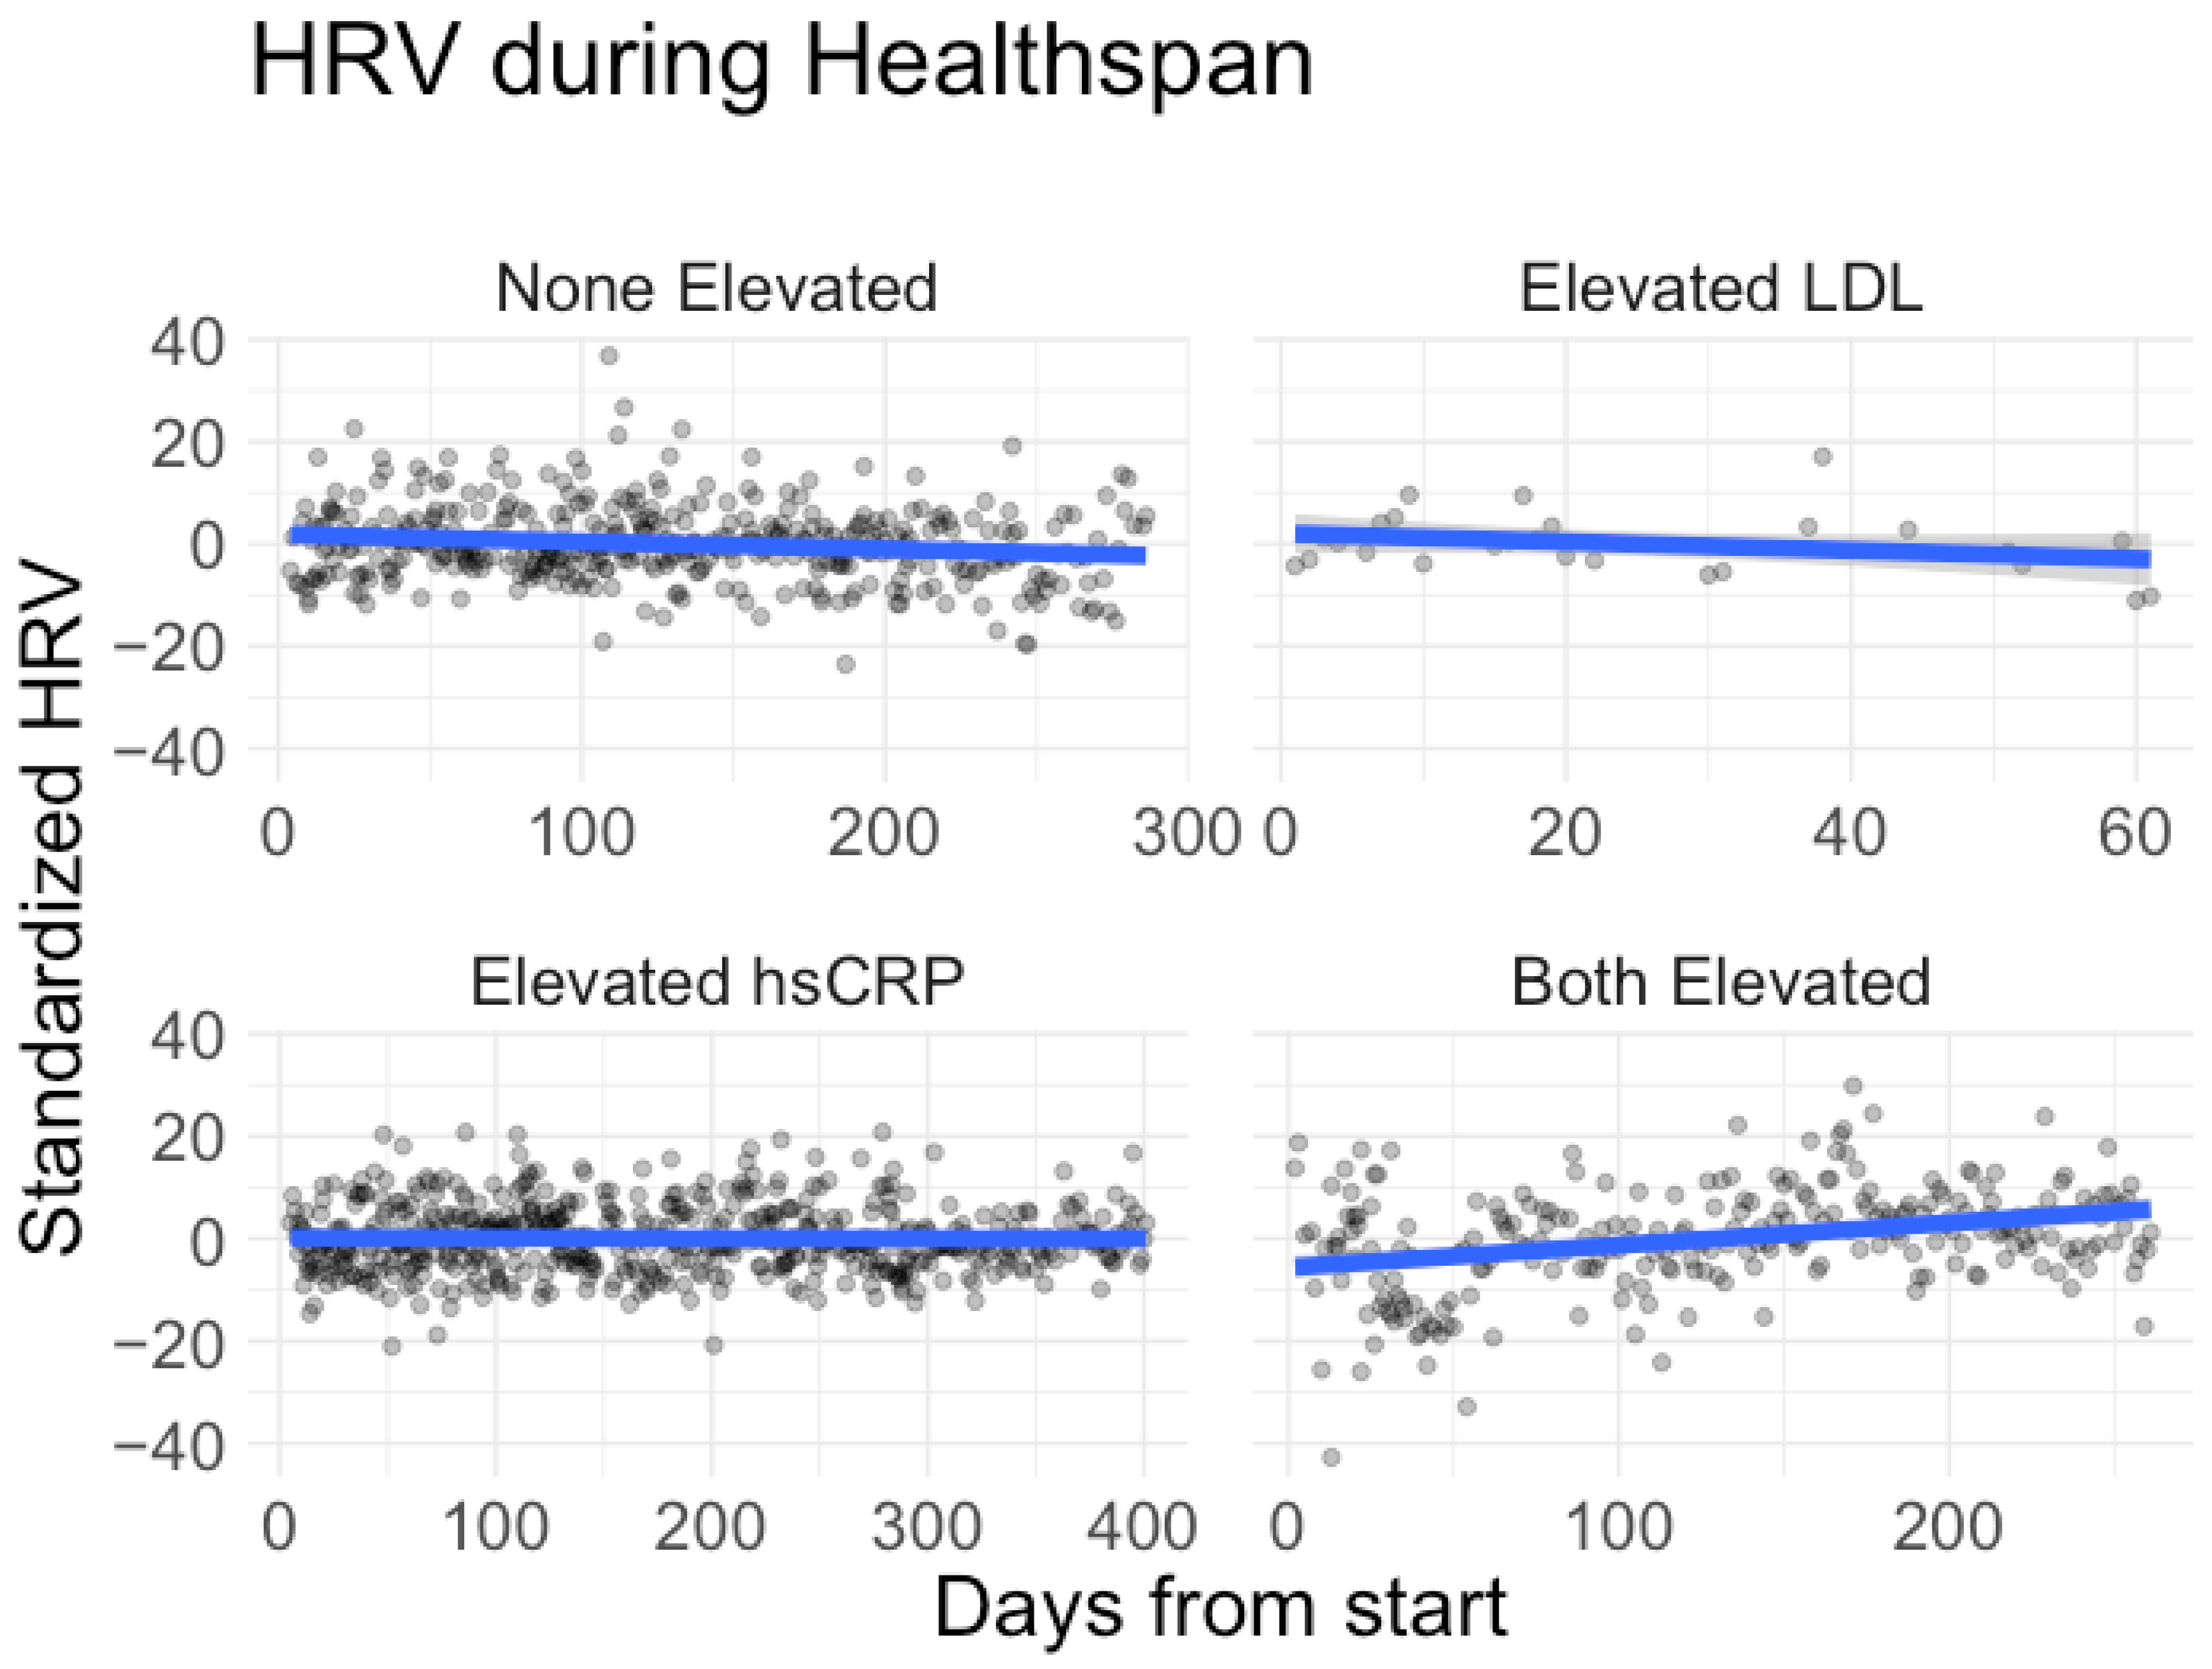
| Group | Model Estimate (ms/day) | 6-Month Scaled Estimate (ms/day) | Scaled Estimate as % Increase | p-Value |
|---|---|---|---|---|
| Elevated LDL a | 0.0509 | 9.1665 | 35.00% | 0.0000 |
| Elevated hsCRP a | 0.0150 | 2.6970 | 10.30% | 0.0088 |
| Both elevated b | 0.0518 | 9.3273 | 35.61% | 0.0000 |
Disclaimer/Publisher’s Note: The statements, opinions and data contained in all publications are solely those of the individual author(s) and contributor(s) and not of MDPI and/or the editor(s). MDPI and/or the editor(s) disclaim responsibility for any injury to people or property resulting from any ideas, methods, instructions or products referred to in the content. |
© 2024 by the authors. Licensee MDPI, Basel, Switzerland. This article is an open access article distributed under the terms and conditions of the Creative Commons Attribution (CC BY) license (https://creativecommons.org/licenses/by/4.0/).
Share and Cite
Chun, E.; Crete, A.; Neal, C.; Joseph, R.; Pojednic, R. The Healthspan Project: A Retrospective Pilot of Biomarkers and Biometric Outcomes after a 6-Month Multi-Modal Wellness Intervention. Healthcare 2024, 12, 676. https://doi.org/10.3390/healthcare12060676
Chun E, Crete A, Neal C, Joseph R, Pojednic R. The Healthspan Project: A Retrospective Pilot of Biomarkers and Biometric Outcomes after a 6-Month Multi-Modal Wellness Intervention. Healthcare. 2024; 12(6):676. https://doi.org/10.3390/healthcare12060676
Chicago/Turabian StyleChun, Elizabeth, Annie Crete, Christopher Neal, Richard Joseph, and Rachele Pojednic. 2024. "The Healthspan Project: A Retrospective Pilot of Biomarkers and Biometric Outcomes after a 6-Month Multi-Modal Wellness Intervention" Healthcare 12, no. 6: 676. https://doi.org/10.3390/healthcare12060676