
Absenteeism, Presenteeism, and the Economic Costs of Alcohol Hangover in The Netherlands
 , , , and
Abstract
:1. Introduction
2. Materials and Methods
Statistical Analysis
3. Results
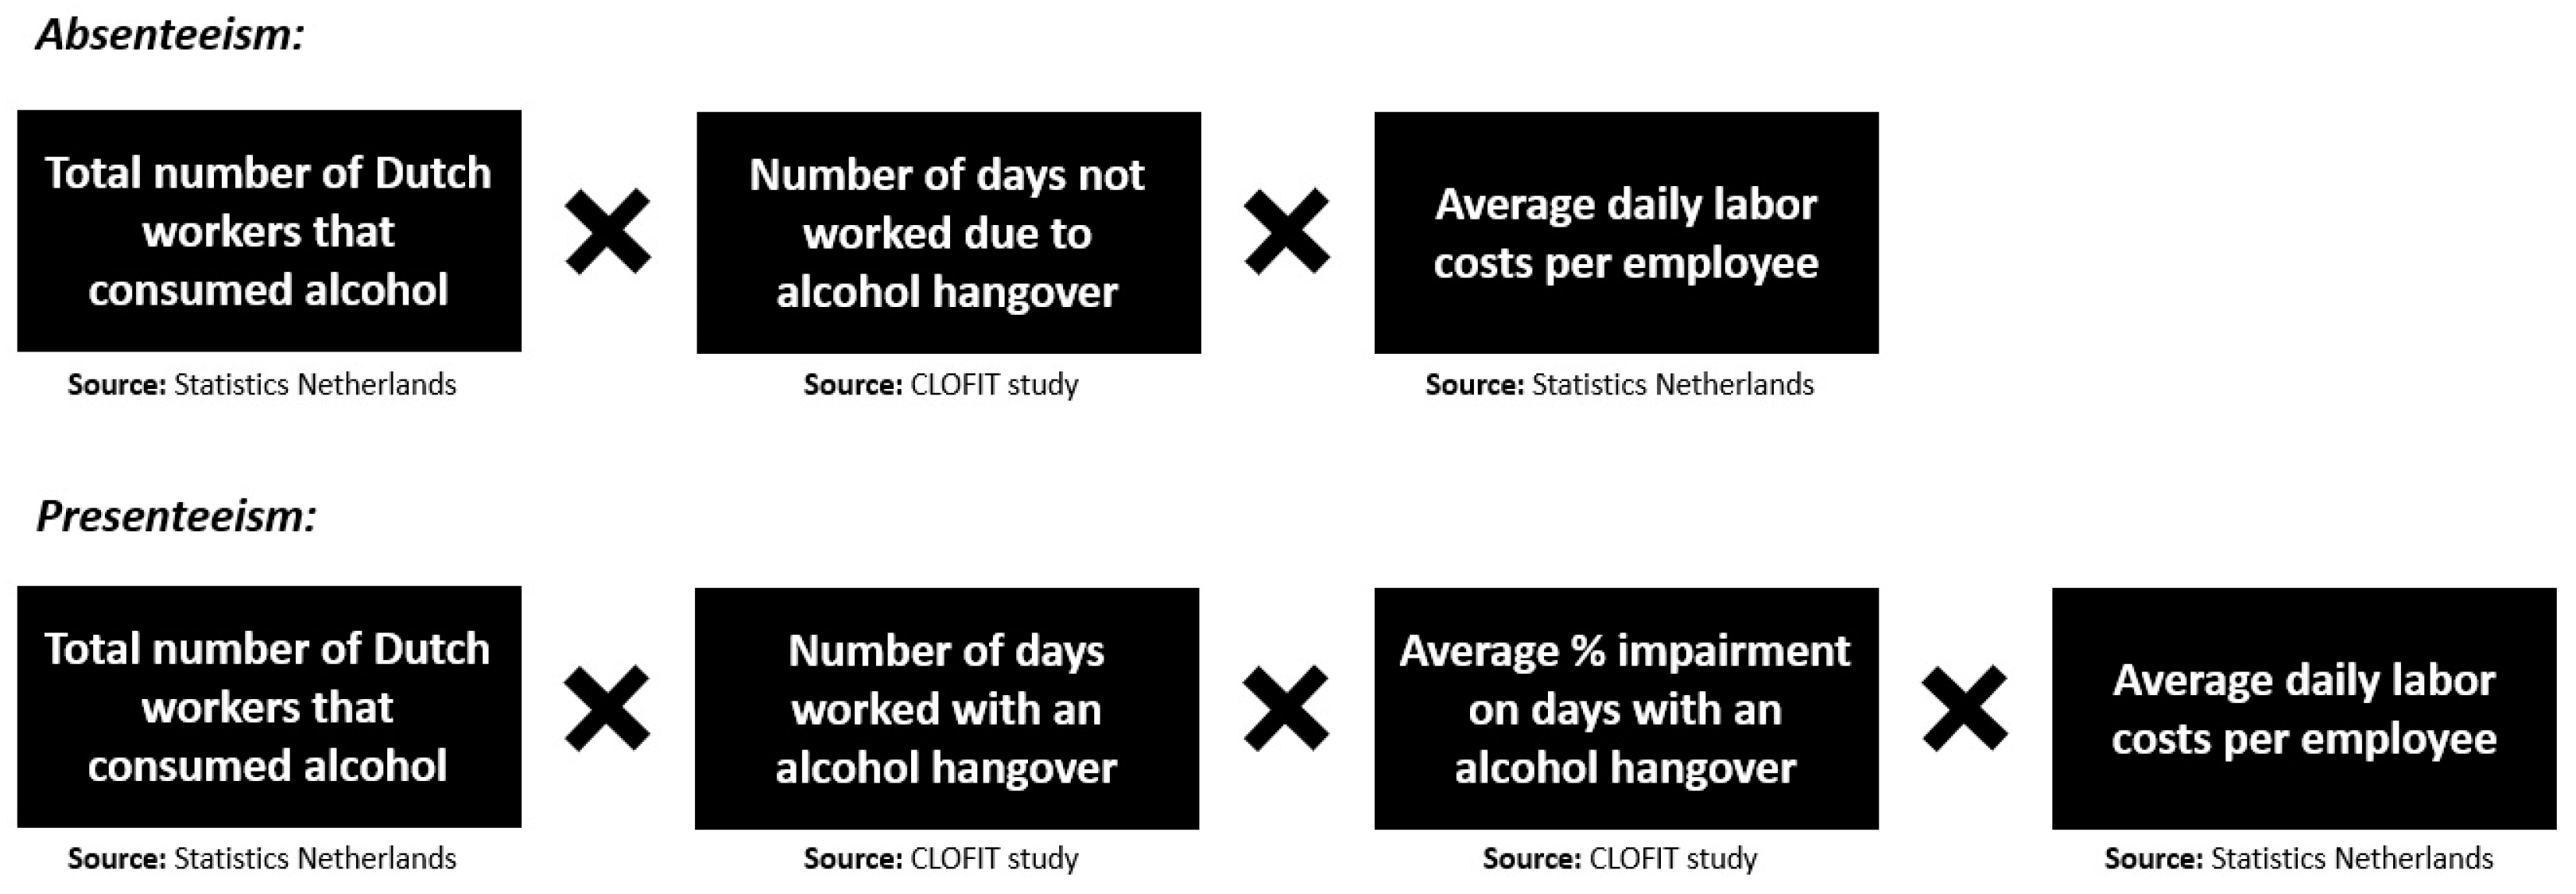
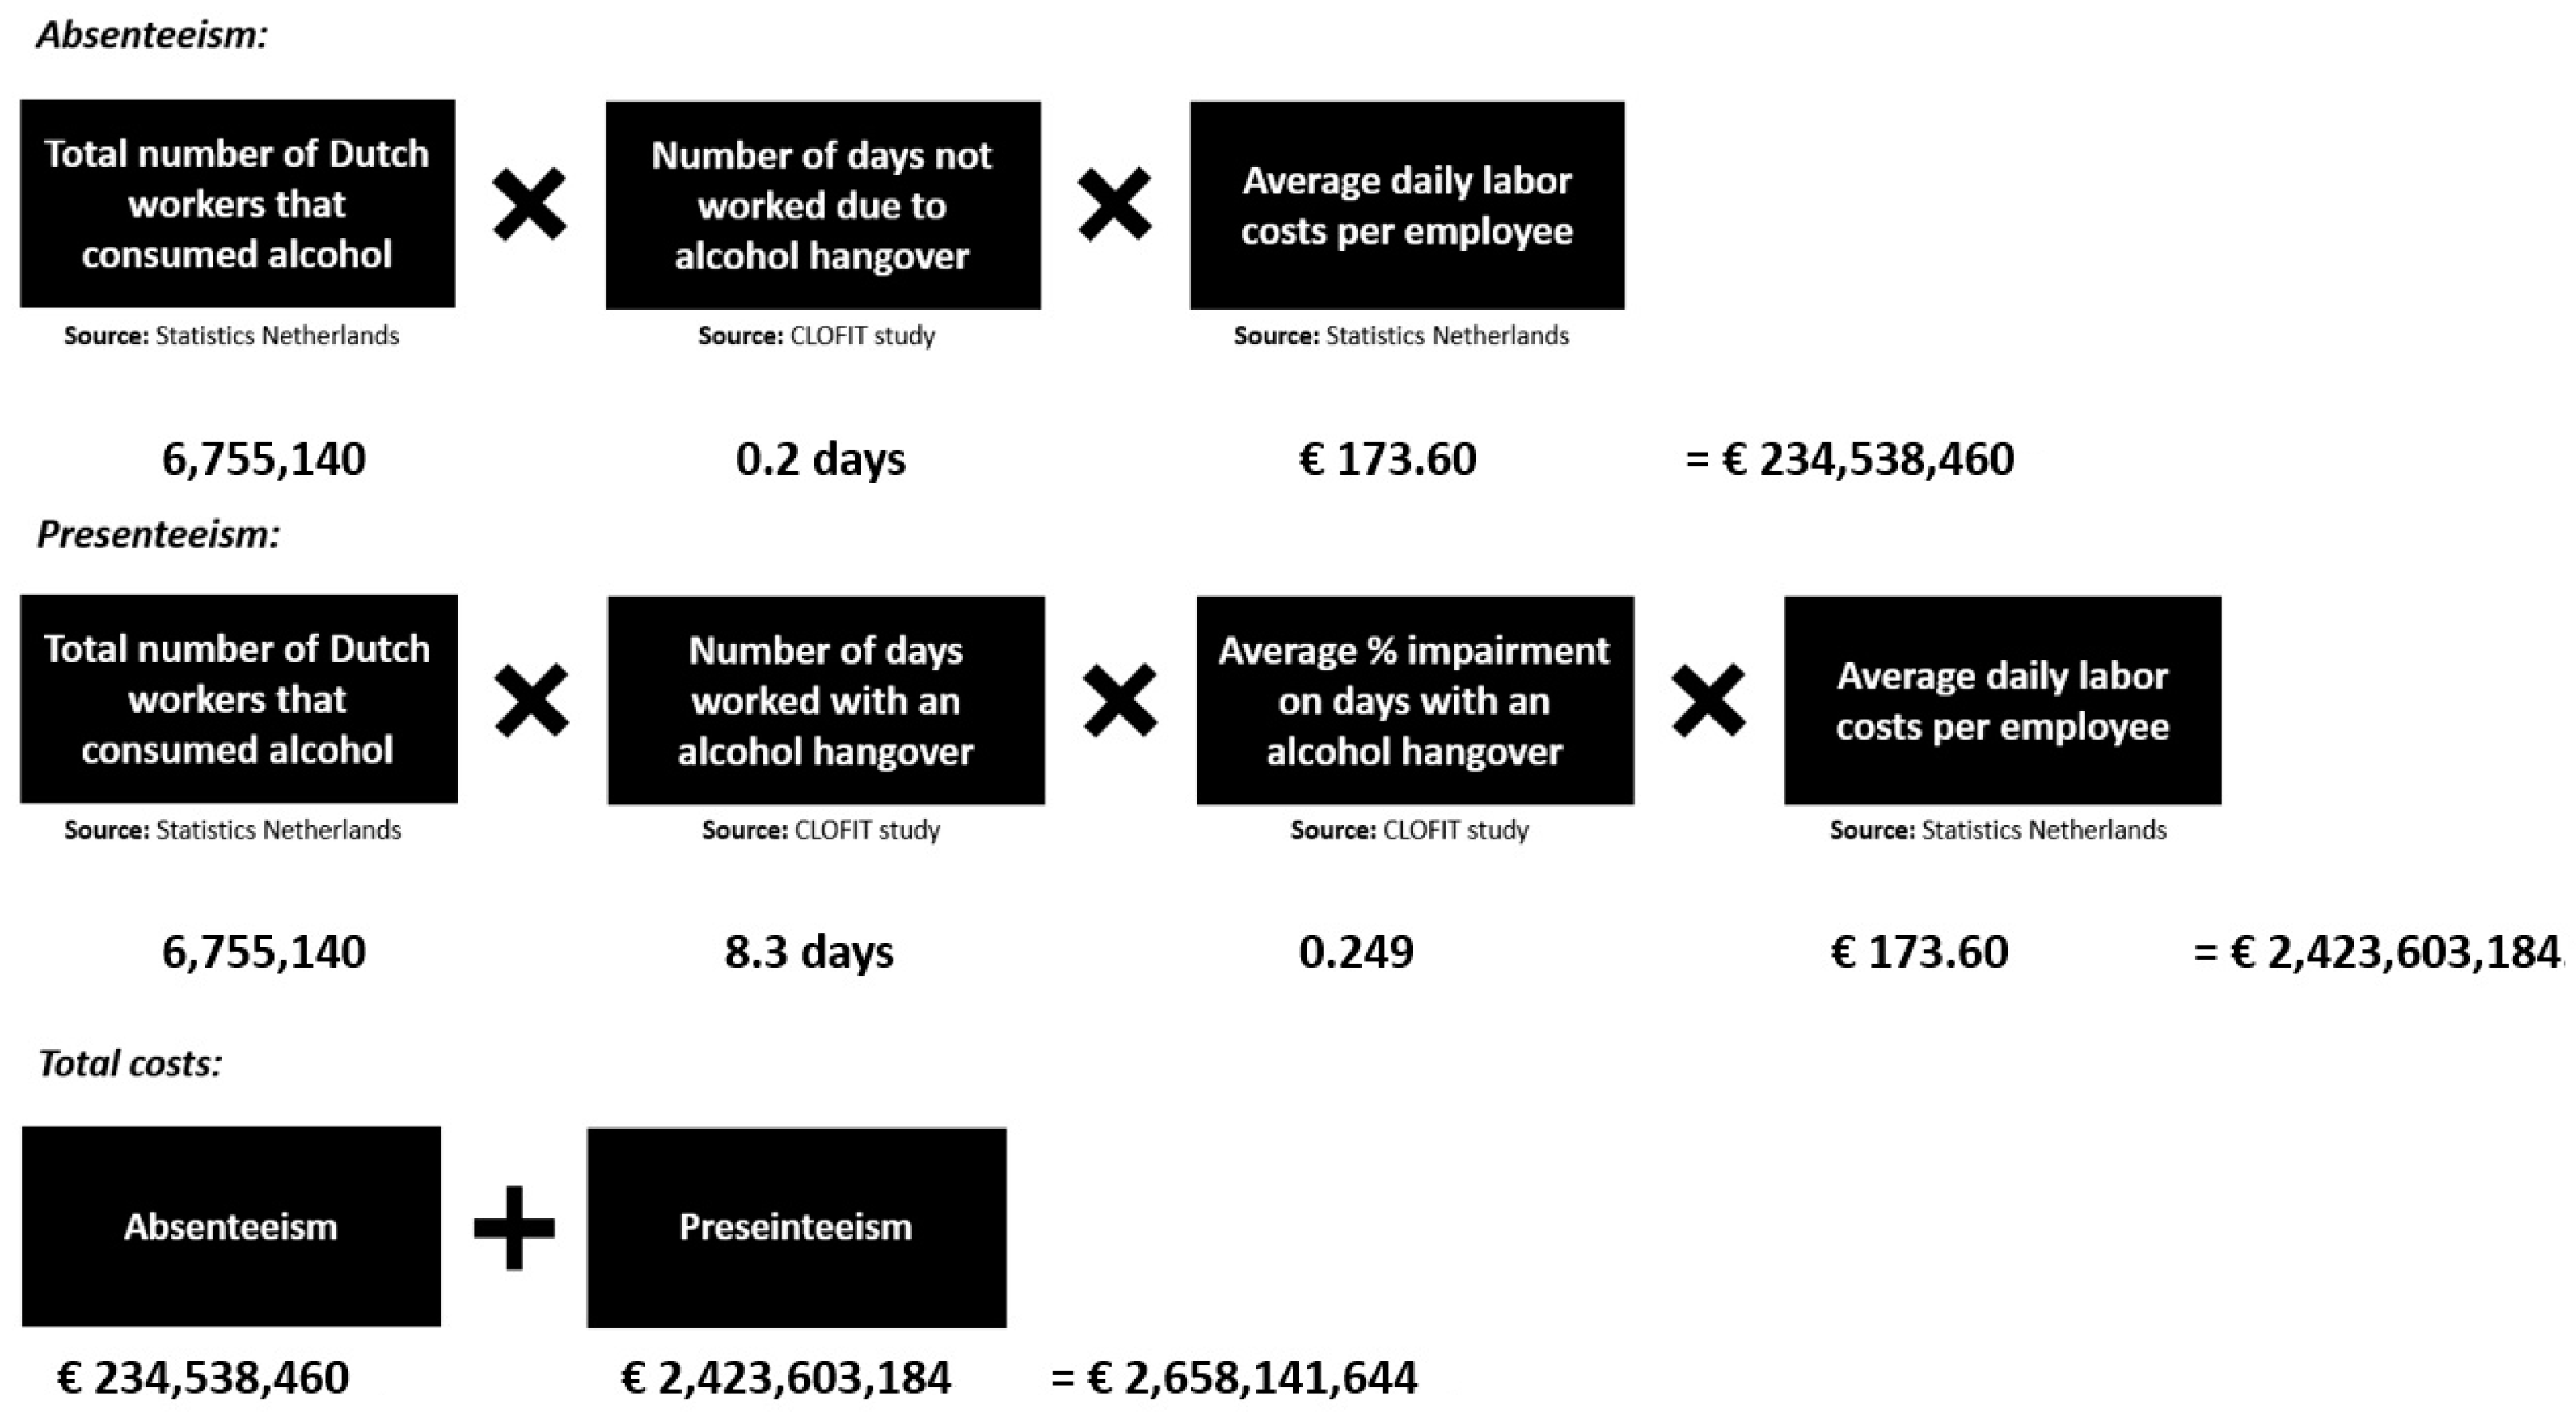
Estimated Costs
4. Discussion
5. Conclusions
Author Contributions
Funding
Institutional Review Board Statement
Informed Consent Statement
Data Availability Statement
Conflicts of Interest
References
- Verster, J.C.; Scholey, A.; van de Loo, A.J.A.E.; Benson, S.; Stock, A.-K. Updating the definition of the alcohol hangover. J. Clin. Med. 2020, 9, 823. [Google Scholar] [CrossRef]
- Mackus, M.; Van de Loo, A.J.A.E.; Van Neer, R.H.P.; Vermeulen, S.A.; Terpstra, C.; Brookhuis, K.A.; Garssen, J.; Scholey, A.; Verster, J.C. Differences in next-day adverse effects and impact on mood of an evening of heavy alcohol consumption between hangover-sensitive drinkers and hangover-resistant drinkers. J. Clin. Med. 2023, 12, 2090. [Google Scholar] [CrossRef]
- Gunn, C.; Mackus, M.; Griffin, C.; Munafò, M.R.; Adams, S. A systematic review of the next-day effects of heavy alcohol consumption on cognitive performance. Addiction 2018, 113, 2182–2193. [Google Scholar] [CrossRef] [PubMed]
- Verster, J.C.; Bervoets, A.C.; de Klerk, S.; Vreman, R.A.; Olivier, B.; Roth, T.; Brookhuis, K.A. Effects of alcohol hangover on simulated highway driving performance. Psychopharmacology 2014, 231, 2999–3008. [Google Scholar] [CrossRef] [PubMed]
- Van Lawick van Pabst, A.E.; Devenney, L.E.; Verster, J.C. Sex differences in the presence and severity of alcohol hangover symptoms. J. Clin. Med. 2019, 8, 867. [Google Scholar] [CrossRef]
- Verster, J.C.; Severeijns, N.R.; Sips, A.S.M.; Saeed, H.M.; Benson, S.; Scholey, A.; Bruce, G. Alcohol hangover across the lifespan: Impact of sex and age. Alcohol Alcohol. 2021, 56, 589–598. [Google Scholar] [CrossRef] [PubMed]
- Verster, J.C.; van Rossum, C.J.I.; Scholey, A. Unknown safety and efficacy of alcohol hangover treatments puts consumers at risk. Addict. Behav. 2021, 122, 107029. [Google Scholar] [CrossRef] [PubMed]
- McFarlin, S.K.; Fals-Stewart, W. Workplace absenteeism and alcohol use: A sequential analysis. Psychol. Addict. Behav. 2002, 16, 17–21. [Google Scholar] [CrossRef]
- Roche, A.M.; Pidd, K.; Berry, J.G.; Harrison, J.E. Workers’ drinking patterns: The impact on absenteeism in the Australian work-place. Addiction 2008, 103, 738–748. [Google Scholar] [CrossRef]
- Streufert, S.; Pogash, R.; Braig, D.; Gingrich, D.; Kantner, A.; Landis, R.; Lonardi, L.; Roache, J.; Severs, W. Alcohol hangover and managerial effectiveness. Alcohol. Clin. Exp. Res. 1995, 19, 1141–1146. [Google Scholar] [CrossRef] [PubMed]
- Ames, G.M.; Grube, J.W.; Moore, R.S. The relationship of drinking and hangovers to workplace problems: An empirical study. J. Stud. Alcohol 1997, 58, 37–47. [Google Scholar] [CrossRef]
- Miller, T.R.; Zaloshnja, E.; Spicer, R.S. Effectiveness and benefit-cost of peer-based workplace substance abuse prevention coupled with random testing. Accid. Anal. Prev. 2007, 39, 565–573. [Google Scholar] [CrossRef]
- Anderson, P. Alcohol and the workplace. In Alcohol in the European Union: Consumption, Harm and Policy Approaches; Anderson, P., Møller, L., Galea, G., Eds.; World Health Organization: Geneva, Switzerland, 2012. Available online: https://www.drugsandalcohol.ie/17242/1/Alcohol-in-the-European-Union-2012.pdf (accessed on 11 October 2023).
- Thørrisen, M.M.; Bonsaksen, T.; Hashemi, N.; Kjeken, I.; Van Mechelen, W.; Aas, R.W. Association between alcohol consumption and impaired work performance (presenteeism): A systematic review. BMJ Open 2019, 9, e029184. [Google Scholar] [CrossRef]
- Bhattacharya, A. Financial Headache. The Cost of Workplace Hangovers and Intoxication to the UK Economy; IAS: London, UK, 2019; Available online: http://www.ias.org.uk/uploads/pdf/IAS%20reports/rp35062019.pdf (accessed on 5 October 2020).
- Mastekaasa, A.; Olsen, K.M. Gender, absenteeism, and job characteristics: A fixed effects approach. Work Occup. 1998, 25, 195–228. [Google Scholar] [CrossRef]
- Ichino, A.; Moretti, E. Biological gender differences, absenteeism, and the earnings gap. Am. Econ. J. Appl. Econ. 2009, 1, 183–218. [Google Scholar] [CrossRef]
- Patton, E.; Johns, G. Women’s absenteeism in the popular press: Evidence for a gender-specific absence culture. Hum. Relat. 2007, 60, 1579–1612. [Google Scholar] [CrossRef]
- Mandiracioglu, A.; Bolukbas, O.; Demirel, M.; Gumeli, F. Factors related to presenteeism among employees of the private sector. Int. J. Occup. Saf. Ergon. 2015, 21, 80–85. [Google Scholar] [CrossRef]
- Aronsson, G.; Gustafsson, K.; Dallner, M. Sick but yet at work. An empirical study of sickness presenteeism. J. Epidemiol. Commun. Health 2000, 54, 502–509. [Google Scholar] [CrossRef]
- Johansen, V.; Aronsson, G.; Marklund, S. Positive and negative reasons for sickness presenteeism in Norway and Sweden: A cross-sectional survey. BMJ Open 2014, 4, e004123. [Google Scholar] [CrossRef]
- Taimela, S.; Läärä, E.; Malmivaara, A.; Tiekso, J.; Sintonen, H.; Justn, S.; Aro, T. Self-reported health problems and sickness absence in different age groups predominantly engaged in physical work. Occup. Environ. Med. 2007, 64, 739–746. [Google Scholar] [CrossRef]
- Böckerman, P.; Laukkanen, E. Presenteeism in Finland: Determinants by gender and the sector of economy. Ege Acad. Rev. 2009, 9, 1007–1016. [Google Scholar] [CrossRef]
- Raghupathi, V.; Raghupathi, W. The influence of education on health: An empirical assessment of OECD countries for the period 1995–2015. Arch. Public Health 2020, 78, 20. [Google Scholar] [CrossRef]
- Kiani, P.; Merlo, A.; Saeed, H.M.; Benson, S.; Bruce, G.; Hoorn, R.; Kraneveld, A.D.; Severeijns, N.R.; Sips, A.S.M.; Scholey, A.; et al. Immune fitness, and the psychosocial and health consequences of the COVID-19 pandemic lockdown in The Netherlands: Methodology and design of the CLOFIT study. Eur. J. Investig. Health Psychol. Educ. 2021, 11, 199–218. [Google Scholar] [CrossRef]
- Centraal Bureau Voor de Statistiek (CBS). Opleidingsniveau. Available online: https://www.cbs.nl/nl-nl/nieuws/2019/33/verschil-levensverwachting-hoog-en-laagopgeleid-groeit/opleidingsniveau (accessed on 5 October 2020).
- Centraal Bureau Voor de Statistiek (CBS). Uurlonen van Werknemers Naar Beroepsgroep. Available online: https://www.cbs.nl/nl-nl/maatwerk/2017/48/uurlonen-van-werknemers-naar-beroepsgroep-2016 (accessed on 5 October 2020).
- Verster, J.C.; van de Loo, A.J.A.E.; Benson, S.; Scholey, A.; Stock, A.-K. The assessment of overall hangover severity. J. Clin. Med. 2020, 9, 786. [Google Scholar] [CrossRef]
- Campbell, I. Chi-squared and Fisher-Irwin tests of two-by-two tables with small sample recommendations. Stat. Med. 2007, 26, 3661–3675. [Google Scholar] [CrossRef]
- Richardson, J.T.E. The analysis of 2 × 2 contingency tables—Yet again. Stat. Med. 2011, 30, 890. [Google Scholar] [CrossRef]
- Sips, A.S.M.; Severeijns, N.R.; Kraneveld, A.D.; Garssen, J.; Verster, J.C. Reduced immune fitness: Related absenteeism from work, presenteeism, and estimated costs for the Dutch economy. Int. J. Environ. Res. Public Health 2023, 20, 1761. [Google Scholar] [CrossRef]
- Centraal Bureau Voor de Statistiek (CBS). (13 November 2020). Arbeidsdeelname; Kerncijfers. Available online: https://opendata.cbs.nl/statline/?dl=6CBD5#/CBS/nl/dataset/85264NED/table (accessed on 11 October 2022).
- Statistics Netherlands. Gezondheidsenquête/Leefstijlmonitor 2019. Available online: https://www.cbs.nl/nl-nl/nieuws/2020/11/41-procent-van-de-volwassenen-drinkt-niet-of-hooguit-1-glas-alcohol-per-dag (accessed on 8 October 2022).
- Centraal Bureau Voor de Statistiek (CBS). Werkzame Beroepsbevolking; Gemiddeld Inkomen. Available online: https://opendata.cbs.nl/statline/#/CBS/nl/dataset/83686NED/table?dl=3451A (accessed on 11 October 2022).
- Media, T. Inflatie Nederland. 2019. Available online: https://www.inflation.eu/nl/inflatiecijfers/nederland/historische-inflatie/cpi-inflatie-nederland-2019.aspx (accessed on 11 October 2022).
- Centraal Bureau Voor de Statistiek (CBS). Meer dan de Helft Werkt Voltijds. Available online: https://www.cbs.nl/nl-nl/nieuws/2020/08/meer-dan-de-helft-werkt-voltijds (accessed on 11 October 2022).
- Roehrs, T.; Yoon, J.; Roth, T. Nocturnal and next-day effects of ethanol and basal level of sleepiness. Hum. Psychopharmacol. Clin. Exp. 1991, 6, 307–311. [Google Scholar] [CrossRef]
- Kim, D.J.; Yoon, S.J.; Lee, H.P.; Choi, B.M.; Go, H.J. The effects of alcohol hangover on cognitive functions in healthy participants. Int. J. Neurosci. 2003, 113, 581–594. [Google Scholar] [CrossRef]
- McKinney, A.; Coyle, K. Next day effects of a normal night’s drinking on memory and psychomotor performance. Alcohol Alcohol. 2004, 39, 509–513. [Google Scholar] [CrossRef] [PubMed]
- Rohsenow, D.J.; Howland, J.; Arnedt, J.T.; Almeida, A.B.; Greece, J.; Minsky, S.; Kempler, C.S.; Sales, S. Intoxication with bourbon versus vodka: Effects on hangover, sleep, and next-day neurocognitive performance in young adults. Alcohol. Clin. Exp. Res. 2010, 34, 509–518. [Google Scholar] [CrossRef]
- Howland, J.; Rohsenow, D.J.; Greece, J.A.; Littlefield, C.A.; Almeida, A.; Heeren, T.; Winter, M.; Bliss, C.A.; Hunt, S.; Hermos, J. The Effects of Binge Drinking on College Students’ Next-Day Academic Test-Taking Performance and Mood State. Addiction 2010, 105, 655–665. [Google Scholar] [CrossRef]
- Verster, J.C.; Van Der Maarel, M.A.; McKinney, A.; Olivier, B.; De Haan, L. Driving during alcohol hangover among Dutch professional truck drivers. Traffic Inj. Prev. 2014, 15, 434–438. [Google Scholar] [CrossRef]
- Rijksoverheid. Budget. 2019. Available online: www.rijksfinancien.nl/begroting/uitgaven (accessed on 13 October 2023).
- Verster, J.C.; Kraneveld, A.D.; Garssen, J. The assessment of immune fitness. J. Clin. Med. 2022, 12, 22. [Google Scholar] [CrossRef]
- Hingson, R.; Zha, W.; Smyth, D. Magnitude and trends in heavy episodic drinking, alcohol-impaired driving, and alcohol-related mortality and overdose hospitalizations among emerging adults of college ages 18–24 in the United States, 1998–2014. J. Stud. Alcohol Drugs 2017, 78, 540–548. [Google Scholar] [CrossRef] [PubMed]
- Piasecki, T.M.; Sher, K.J.; Slutske, W.S.; Jackson, K.M. Hangover frequency and risk for alcohol use disorders: Evidence from a longitudinal high-risk study. J. Abnorm. Psychol. 2005, 114, 223–234. [Google Scholar] [CrossRef] [PubMed]
- Tolstrup, J.S.; Stephens, R.; Grønbaek, M. Does the severity of hangovers decline with age? Survey of the incidence of hangover in different age groups. Alcohol. Clin. Exp. Res. 2014, 38, 466–470. [Google Scholar] [CrossRef] [PubMed]
- Gill, J.S. Reported levels of alcohol consumption and binge drinking within the UK undergraduate student population over the last 25 years. Alcohol Alcohol. 2002, 37, 109–120. [Google Scholar] [CrossRef] [PubMed]
- Wilsnack, R.W.; Vogeltanz, N.D.; Wilsnack, S.C.; Harris, T.R. Gender differences in alcohol consumption and adverse drinking consequences: Cross-cultural patterns. Addiction 2000, 95, 251–265. [Google Scholar] [CrossRef]
- Kypri, K.Y.P.; Cronin, M.; Wright, C.S. Do university students drink more hazardously than their non-student peers? Addiction 2005, 100, 713–714. [Google Scholar] [CrossRef] [PubMed]
- Liu, S.; Bamberger, P.; Wang, M.; Nahum-Shani, I.; Larimer, M.; Bacharach, S.B. Behavior change versus stability during the college-to-work transition: Life course and the “stickiness” of alcohol misuse at career entry. Pers. Psychol. 2023, 76, 945–975. [Google Scholar] [CrossRef] [PubMed]
- Moan, I.S.; Halkjelsvik, T. Socio-demographic differences in alcohol-related work impairment. Addiction 2021, 116, 771–779. [Google Scholar] [CrossRef] [PubMed]
- Frone, M.R. Alcohol and Illicit Drug Use in the Workforce and Workplace; American Psychological Association: Washington, DC, USA, 2013. [Google Scholar] [CrossRef]
- Dale, C.E.; Livingston, M.J. The burden of alcohol drinking on co-workers in the Australian workplace. Med. J. Aust. 2010, 193, 138–140. [Google Scholar] [CrossRef] [PubMed]


| Variables Assessed | Overall | Men | Women | p-Value |
|---|---|---|---|---|
| n (%) | 347 (100%) | 127 (36.6%) | 220 (63.4%) | <0.001 * |
| Age (Mean, SD) | 35.5 (14.6) | 39.6 (15.2) | 33.1 (13.7) | <0.001 * |
| Career level | ||||
| Junior (18–34 years old), n (%) | 214 (61.7%) | 62 (48.8%) | 152 (69.1%) | 0.005 * |
| Middle (35–50 years old), n (%) | 58 (16.7%) | 26 (20.5%) | 32 (14.5%) | 0.550 |
| Senior (51–65 years old), n (%) | 75 (21.6%) | 39 (30.7%) | 36 (16.4%) | 0.149 |
| Education level, n (%) | ||||
| Low | 36 (10.4%) | 11 (8.7%) | 25 (11.4%) | 0.811 |
| Middle | 77 (22.2%) | 29 (22.8%) | 48 (21.8%) | 0.919 |
| High | 234 (67.4%) | 87 (68.5%) | 147 (66.8%) | 0.789 |
| Job category, n (%) | ||||
| Agriculture, forestry, fishing | 7 (2%) | 2 (1.6%) | 5 (2.3%) | 0.698 |
| Industry | 17 (4.9%) | 9 (7.1%) | 8 (3.6%) | 0.758 |
| Production and distribution of electricity, natural gas, steam, and cooled air trade | 1 (0.3%) | 0 (0.0%) | 1 (0.5%) | - |
| Construction industry | 5 (1.4%) | 2 (1.6%) | 3 (1.4%) | 0.987 |
| Wholesale and retail trade, repair of cars | 17 (4.9%) | 11 (8.7%) | 6 (2.7%) | 0.644 |
| Transportation and storage | 16 (4.6%) | 13 (10.2%) | 3 (1.4%) | 0.634 |
| Hospitality, catering industry | 33 (9.5%) | 12 (9.4%) | 21 (9.5%) | 0.993 |
| Information and communication | 27 (7.8%) | 11 (8.7%) | 16 (7.3%) | 0.896 |
| Financial services | 14 (4.0%) | 7 (5.5%) | 7 (3.2%) | 0.839 |
| Rental and trade of real estate | 1 (0.3%) | 0 (0.0%) | 1 (0.5%) | - |
| Advice, research, and other specialist business services | 19 (5.5%) | 4 (3.1%) | 15 (6.8%) | 0.788 |
| Rental of movable property and other business services | 1 (0.3%) | 1 (0.8%) | 0 (0.0%) | - |
| Public administration, government, social insurance | 15 (4.3%) | 5 (3.9%) | 10 (4.5%) | 0.789 |
| Education | 36 (10.4%) | 14 (11.0%) | 22 (10.0%) | 0.925 |
| Health and welfare care | 80 (23.1%) | 17 (13.4%) | 63 (28.6%) | 0.204 |
| Culture, sports, and recreation | 22 (6.3%) | 6 (4.7%) | 16 (7.3%) | 0.831 |
| Households as employees | 1 (0.3%) | 0 (0.0%) | 1 (0.5%) | - |
| Other services | 35 (10.1%) | 13 (10.2%) | 22 (10.0%) | 0.985 |
| Work characteristics, mean (SD) | ||||
| Hours worked per week | 29.0 (14.3) | 32.8 (15.9) | 26.8 (12.7) | <0.001 * |
| Days worked per week | 4.2 (1.9) | 4.6 (2.3) | 4.0 (1.6) | 0.028 * |
| Days worked on location per week | 3.7 (1.6) | 3.9 (1.8) | 3.5 (1.5) | 0.020 * |
| Days worked from home per week | 0.6 (1.4) | 0.7 (1.6) | 0.5 (1.3) | 0.889 |
| Variables Assessed | Overall | Men | Women | p-Value |
|---|---|---|---|---|
| Hangover severity on absenteeism days | 6.6 (3.2) | 6.4 (3.2) | 6.8 (3.2) | 0.729 |
| Hangover severity on presenteeism days | 4.3 (1.9) | 4.0 (1.8) | 4.5 (2.0) | 0.130 |
| Number of absenteeism days | 0.2 (0.9) | 0.4 (1.5) | 0.1 (0.4) | 0.215 |
| Number of presenteeism days | 8.3 (39.1) | 7.6 (34.4) | 8.7 (41.6) | 0.323 |
| Performance level when hungover (%) | 75.1 (35.3) | 73.4 (36.5) | 76.1 (34.6) | 0.599 |
| Career Level | Junior | Middle | Senior |
|---|---|---|---|
| Age range (years) | 18–34 | 35–50 | 51–65 |
| n | 214 | 58 | 78 |
| Hangover severity on absenteeism day | 6.8 (3.1) | 3.8 (4.3) | 7.4 (2.4) |
| Hangover severity on presenteeism day | 4.3 (1.9) | 3.8 (2.1) | 5.0 (2.5) |
| Number of absenteeism days | 0.3 (1.1) | 0.1 (0.7) * | 0.1 (0.5) |
| Number of presenteeism days | 4.3 (19.5) | 11.9 (50.3) * | 16.9 (62.9) * |
| Performance level (%) when hungover | 72.8 (33.3) | 80.7 (37.6) * | 80.0 (37.9) * |
| Education Level | Low | Middle | High |
|---|---|---|---|
| n | 36 | 77 | 234 |
| Hangover severity on absenteeism days | 5.3 (3.8) | 4.3 (3.4) | 7.2 (2.9) |
| Hangover severity on presenteeism days | 4.7 (3.5) | 3.6 (1.8) | 4.3 (1.9) |
| Number of absenteeism days | 0.03 (0.2) | 0.05 (0.3) | 0.3 (1.1) |
| Number of presenteeism days | 27.6 (78.2) | 2.0 (7.0) | 7.4 (35.5) |
| Performance level (%) when hungover | 68.1 (46.1) | 79.6 (34.4) | 74.7 (33.6) |
Disclaimer/Publisher’s Note: The statements, opinions and data contained in all publications are solely those of the individual author(s) and contributor(s) and not of MDPI and/or the editor(s). MDPI and/or the editor(s) disclaim responsibility for any injury to people or property resulting from any ideas, methods, instructions or products referred to in the content. |
© 2024 by the authors. Licensee MDPI, Basel, Switzerland. This article is an open access article distributed under the terms and conditions of the Creative Commons Attribution (CC BY) license (https://creativecommons.org/licenses/by/4.0/).
Share and Cite
Severeijns, N.R.; Sips, A.S.M.; Merlo, A.; Bruce, G.; Verster, J.C. Absenteeism, Presenteeism, and the Economic Costs of Alcohol Hangover in The Netherlands. Healthcare 2024, 12, 335. https://doi.org/10.3390/healthcare12030335
Severeijns NR, Sips ASM, Merlo A, Bruce G, Verster JC. Absenteeism, Presenteeism, and the Economic Costs of Alcohol Hangover in The Netherlands. Healthcare. 2024; 12(3):335. https://doi.org/10.3390/healthcare12030335
Chicago/Turabian StyleSevereijns, Noortje R., Annabel S. M. Sips, Agnese Merlo, Gillian Bruce, and Joris C. Verster. 2024. "Absenteeism, Presenteeism, and the Economic Costs of Alcohol Hangover in The Netherlands" Healthcare 12, no. 3: 335. https://doi.org/10.3390/healthcare12030335