
Daily Moderate-to-Vigorous Activity of Native Hawaiians and Pacific Islanders and Seven Asian Subgroups by Types of Activities, American Time Use Survey, 2010–2019


Abstract
:
1. Introduction
2. Methods
2.1. Study Design
2.2. Study Population
2.3. Study Variables
2.4. Statistical Analysis
3. Results
4. Discussion
4.1. Limitations
4.2. Strengths
4.3. Implications
5. Conclusions
Author Contributions
Funding
Institutional Review Board Statement
Informed Consent Statement
Data Availability Statement
Conflicts of Interest
References
- Mukherjea, A.; Ivey, S.L.; Shariff-Marco, S.; Kapoor, N.; Allen, L. Overcoming Challenges in Recruitment of South Asians for Health Disparities Research in the USA. J. Racial. Ethn. Health Disparities 2018, 5, 195–208. [Google Scholar] [CrossRef] [PubMed]
- Randal, F.T.; Qi, S.; Lozano, P.; Mo, Y.; Oh, J.; Choi, S.; Hwang, A.; Lobo, A.; Hilton-Hayward, K.; Sun, H.; et al. Establishing a National Engagement Strategy for Recruiting Asian Americans and Other Minorities into Biomedical Research. Prog. Community Health Partnersh. 2022, 16, 349–359. [Google Scholar] [CrossRef] [PubMed]
- Kaholokula, J.K.; AuYoung, M.; Chau, M.; Sambamoorthi, U.; Carson, S.; Thao, C.; Nguyen, M.; Alo, A.; Riklon, S.; Lepule, T.; et al. Unified in Our Diversity to Address Health Disparities Among Asian Americans, Native Hawaiians, and Pacific Islanders. Health Equity 2022, 6, 540–545. [Google Scholar] [CrossRef] [PubMed]
- Uchima, O.; Wu, Y.Y.; Browne, C.; Braun, K.L. Disparities in Diabetes Prevalence Among Native Hawaiians/Other Pacific Islanders and Asians in Hawaii. Prev. Chronic. Dis. 2019, 16, E22. [Google Scholar] [CrossRef]
- Nakagawa, K.; Koenig, M.A.; Seto, T.B.; Asai, S.M.; Chang, C.W. Racial disparities among Native Hawaiians and Pacific Islanders with intracerebral hemorrhage. Neurology 2012, 79, 675–680. [Google Scholar] [CrossRef]
- Mau, M.K.; Sinclair, K.; Saito, E.P.; Baumhofer, K.N.; Kaholokula, J.K. Cardiometabolic health disparities in native Hawaiians and other Pacific Islanders. Epidemiol. Rev. 2009, 31, 113–129. [Google Scholar] [CrossRef]
- Daniels, S.P.; Kauahikaua, L.; Kaio, C.; Casson-Fisher, J.N.; Ku, T. Conceptualizing a New System of Care in Hawaii for Native Hawaiians and Substance Use. Hawaii J. Health Soc. Welf. 2022, 81 (Suppl. S3), 43–51. [Google Scholar]
- Riley, L.; Su‘esu‘e, A.; Hulama, K.; Neumann, S.K.; Chung-Do, J. Ke ala i ka Mauliola: Native Hawaiian Youth Experiences with Historical Trauma. Int. J. Environ. Res. Public Health 2022, 19, 12564. [Google Scholar] [CrossRef]
- Liu, C.Z.; Wang, E.; Nguyen, D.; Sun, M.D.; Jumreornvong, O. The Model Minority Myth, Data Aggregation, and the Role of Medical Schools in Combating Anti-Asian Sentiment. Acad. Med. 2022, 97, 797–803. [Google Scholar] [CrossRef]
- Akee, R.; Jones, M.R.; Porter, S.R. Race Matters: Income Shares, Income Inequality, and Income Mobility for All U.S. Races. Demography 2019, 56, 999–1021. [Google Scholar] [CrossRef]
- Zheng, R.; Li, M.; Xu, M.; Lu, J.; Wang, T.; Dai, M.; Zhang, D.; Chen, Y.; Zhao, Z.; Wang, S.; et al. Chinese Adults Are More Susceptible to Effects of Overall Obesity and Fat Distribution on Cardiometabolic Risk Factors. J. Clin. Endocrinol. Metab. 2021, 106, e2775–e2788. [Google Scholar] [CrossRef]
- Abate, N.; Chandalia, M. Risk of Obesity-Related Cardiometabolic Complications in Special Populations: A Crisis in Asians. Gastroenterology 2017, 152, 1647–1655. [Google Scholar] [CrossRef]
- WHO Expert Consultation. Appropriate body-mass index for Asian populations and its implications for policy and intervention strategies. Lancet 2004, 363, 157–163, Erratum in Lancet 2004, 363, 902. [Google Scholar] [CrossRef]
- Revisions to the Standards for the Classification of Federal Data on Race and Ethnicity. 1997. Available online: https://obamawhitehouse.archives.gov/omb/fedreg (accessed on 6 July 2023).
- Hixon, L.; Hepler, B.B.; Kim, M.; Shahid, H. The Native Hawaiian and Other Pacific Islander Population: 2010 Census Brief. U.S. Census Bureau. 2012. Available online: www.census.gov/history/pdf/2010nhopi-122016.pdf (accessed on 6 July 2023).
- Report of the Panel to Evaluate the U.S. Standard Certificates. Available online: www.cdc.gov/nchs/data/dvs/panelreport_acc.pdf (accessed on 6 July 2023).
- Hoeffel, E.; Rastogi, P.; Kim, M.O.; Shahid, H. The Asian population: 2010. In 2010 Censusbriefs; United States Census Bureau: Washington, DC, USA, 2012. Available online: www.census.gov/history/pdf/2010asian-122016.pdf (accessed on 6 July 2023).
- Holland, A.T.; Palaniappan, L.P. Problems with the collection and interpretation of Asian-American health data: Omission, aggregation, and extrapolation. Ann. Epidemiol. 2012, 22, 397–405. [Google Scholar]
- Noar, S.M.; Benac, C.N.; Harris, M.S. Does tailoring matter? Meta-analytic review of tailored print health behavior change interventions. Psychol. Bull. 2007, 133, 673–693. [Google Scholar] [CrossRef]
- Kaholokula, J.K.; Wilson, R.E.; Townsend, C.K.; Zhang, G.X.; Chen, J.; Yoshimura, S.R.; Dillard, A.; Yokota, J.W.; Palakiko, D.M.; Gamiao, S.; et al. Translating the Diabetes Prevention Program in Native Hawaiian and Pacific Islander communities: The PILI ‘Ohana Project. Transl. Behav. Med. 2014, 4, 149–159. [Google Scholar] [CrossRef]
- Kaholokula, J.K.; Look, M.; Mabellos, T.; Ahn, H.J.; Choi, S.Y.; Sinclair, K.A.; Wills, T.A.; Seto, T.B.; de Silva, M. A Cultural Dance Program Improves Hypertension Control and Cardiovascular Disease Risk in Native Hawaiians: A Randomized Controlled Trial. Ann. Behav. Med. 2021, 55, 1006–1018. [Google Scholar] [CrossRef]
- Garber, C.E.; Blissmer, B.; Deschenes, M.R.; Franklin, B.A.; Lamonte, M.J.; Lee, I.M.; Nieman, D.C.; Swain, D.P.; American College of Sports Medicine. American College of Sports Medicine position stand. Quantity and quality of exercise for developing and maintaining cardiorespiratory, musculoskeletal, and neuromotor fitness in apparently healthy adults: Guidance for prescribing exercise. Med. Sci. Sports Exerc. 2011, 43, 1334–1359. [Google Scholar] [CrossRef]
- Tudor-Locke, C.; Washington, T.L.; Ainsworth, B.E.; Troiano, R.P. Linking the American Time Use Survey (ATUS)and the Compendium of Physical Activities: Methods and rationale. J. Phys. Act. Health 2009, 6, 347–353. [Google Scholar]
- Cusatis, R.; Garbarski, D. Different domains of physical activity: The role of leisure, housework/care work, and paid work in socioeconomic differences in reported physical activity. SSM Popul. Health 2019, 7, 100387. [Google Scholar]
- Smith, L.P.; Ng, S.W.; Popkin, B.M. No time for the gym? Housework and other non-labor market time use patterns are associated with meeting physical activity recommendations among adults in full-time, sedentary jobs. Soc. Sci. Med. 2014, 120, 126–134. [Google Scholar]
- Flood, S.M.; Sayer, L.C.; Backman, D. American Time Use Survey Data Extract Builder: Version 3.1 [Dataset]; University of Maryland and Minneapolis: College Park, MD, USA, 2022. [Google Scholar] [CrossRef]
- R Core Team. R: A Language and Environment for Statistical Computing; R Foundation for Statistical Computing: Vienna, Austria, 2021. [Google Scholar]
- Lumley, T. Survey: Analysis of Complex Survey Samples; R Package Version 4.1; R Foundation for Statistical Computing: Vienna, Austria, 2022. [Google Scholar]
- Lawlor, D.A.; Taylor, M.; Bedford, C.; Ebrahim, S. Is housework good for your health? Levels of physical activity and factors associated with activity in elderly women. Results from the British Women’s Heart and Health Study. J. Epidemiol. Community Health 2002, 56, 473–478. [Google Scholar]
- Murphy, M.H.; Donnelly, P.; Breslin, G.; Shibli, S.; Nevill, A.M. Does doing housework keep you healthy? The contribution of domestic physical activity to meeting current recommendations for health. BMC Public Health 2013, 13, 966. [Google Scholar]
- Leopold, T.; Schulz, F. Health and Housework in Later Life: A Longitudinal Study of Retired Couples. J. Gerontol. B Psychol. Sci. Soc. Sci. 2020, 75, 184–194. [Google Scholar]
- Tanucan, J.C.M.; Garcia, M.; Bojos, T. Housework-based exercise versus conventional exercise on health-related fitness of adolescent learners. Pedagog. Phys. Cult. Sports 2022, 26, 364–373. [Google Scholar]
- Koeneman, M.A.; Chinapaw, M.J.; Verheijden, M.W.; van Tilburg, T.G.; Visser, M.; Deeg, D.J.; Hopman-Rock, M. Do major life events influence physical activity among older adults: The Longitudinal Aging Study Amsterdam. Int. J. Behav. Nutr. Phys. Act. 2012, 9, 147. [Google Scholar] [CrossRef]
- Van Dyck, D.; Cardon, G.; De Bourdeaudhuij, I. Longitudinal changes in physical activity and sedentary time in adults around retirement age: What is the moderating role of retirement status, gender and educational level? BMC Public Health 2016, 16, 1125. [Google Scholar] [CrossRef]
- Liu, X.; Zhang, D.; Liu, Y.; Sun, X.; Han, C.; Wang, B.; Ren, Y.; Zhou, J.; Zhao, Y.; Shi, Y.; et al. Dose-Response Association Between Physical Activity and Incident Hypertension: A Systematic Review and Meta-Analysis of Cohort Studies. Hypertension 2017, 69, 813–820. [Google Scholar] [CrossRef]
- Foong, Y.C.; Aitken, D.; Winzenberg, T.; Otahal, P.; Scott, D.; Jones, G. The association between physical activity and reduced body fat lessens with age—Results from a cross-sectional study in community-dwelling older adults. Exp. Gerontol. 2014, 55, 107–112. [Google Scholar] [CrossRef]
- Usagawa, T.; Look, M.; de Silva, M.; Stickley, C.; Kaholokula, J.K.; Seto, T.; Mau, M. Metabolic equivalent determination in the cultural dance of hula. Int. J. Sports Med. 2014, 35, 399–402. [Google Scholar] [CrossRef]
- Walter, C.S.; Narcisse, M.R.; Vincenxo, J.L.; McElfish, P.A.; Felix, H.C. Description of Variation in Age of Onset of Functional Limitations of Native Hawaiian and Pacific Islanders Compared to Other Racial and Ethnic Groups. Int. J. Environ. Res. Public Health 2021, 18, 2445. [Google Scholar] [CrossRef]
- Walter, C.S.; Narcisse, M.R.; Vincenzo, J.L.; Felix, H.C.; McElfish, P.A. Associations between physical activity and functional limitations in Native Hawaiian and Pacific Islander middle-aged and older adults in the United States. Ethn. Health 2022, 27, 1616–1629. [Google Scholar] [CrossRef]
- Bayog, M.L.; Waters, C.M. Cardiometabolic risks, lifestyle health behaviors and heart disease in Filipino Americans. Eur. J. Cardiovasc. Nurs. 2017, 16, 522–529. [Google Scholar] [CrossRef]
- Visaria, A.; Nagaraj, B.; Shah, M.; Kethidi, N.; Modak, A.; Shahani, J.; Chilakapati, R.; Raghuwanshi, M. Low Amount and Intensity of Leisure-time Physical Activity in Asian Indian Adults. Am. J. Health Promot. 2022, 36, 440–449. [Google Scholar] [CrossRef]
- Wang, C.C.; Li, K.; Gaylord, A.S. Trends and characteristics of Tai Chi and Qi Gong use among U.S. adults: Results from the 2007–2017 National Health Interview Survey. Complement. Ther. Med. 2022, 71, 102890. [Google Scholar] [CrossRef]
- Foong, Y.C.; Chherawala, N.; Aitken, D.; Scott, D.; Winzenberg, T.; Jones, G. Accelerometer-determined physical activity, muscle mass, and leg strength in community-dwelling older adults. J. Cachexia Sarcopenia Muscle 2016, 7, 275–283. [Google Scholar] [CrossRef]


| Variable | Category | Total | Sports and Recreation | Household Activities | ||
|---|---|---|---|---|---|---|
| N (%) | N (%) | p Value | N (%) | p Value | ||
| Ethnicity | Native Hawaiians | 214 (7.1%) | 26 (12.2%) | 0.038 | 69 (32.4%) | 0.385 |
| Chinese | 767 (25.5%) | 189 (24.0%) | 233 (26.5%) | |||
| Asian Indian | 600 (20.3%) | 130 (20.8%) | 200 (28.2%) | |||
| Filipino | 354 (13.6%) | 47 (14.7%) | 132 (32.1%) | |||
| Japanese | 176 (5.8%) | 34 (21.5%) | 63 (35.5%) | |||
| Korean | 172 (5.8%) | 34 (18.7%) | 51 (26.5%) | |||
| Vietnamese | 186 (7.1%) | 34 (16.0%) | 60 (32.9%) | |||
| Other Asian | 396 (14.8%) | 72 (18.7%) | 137 (33.2%) | |||
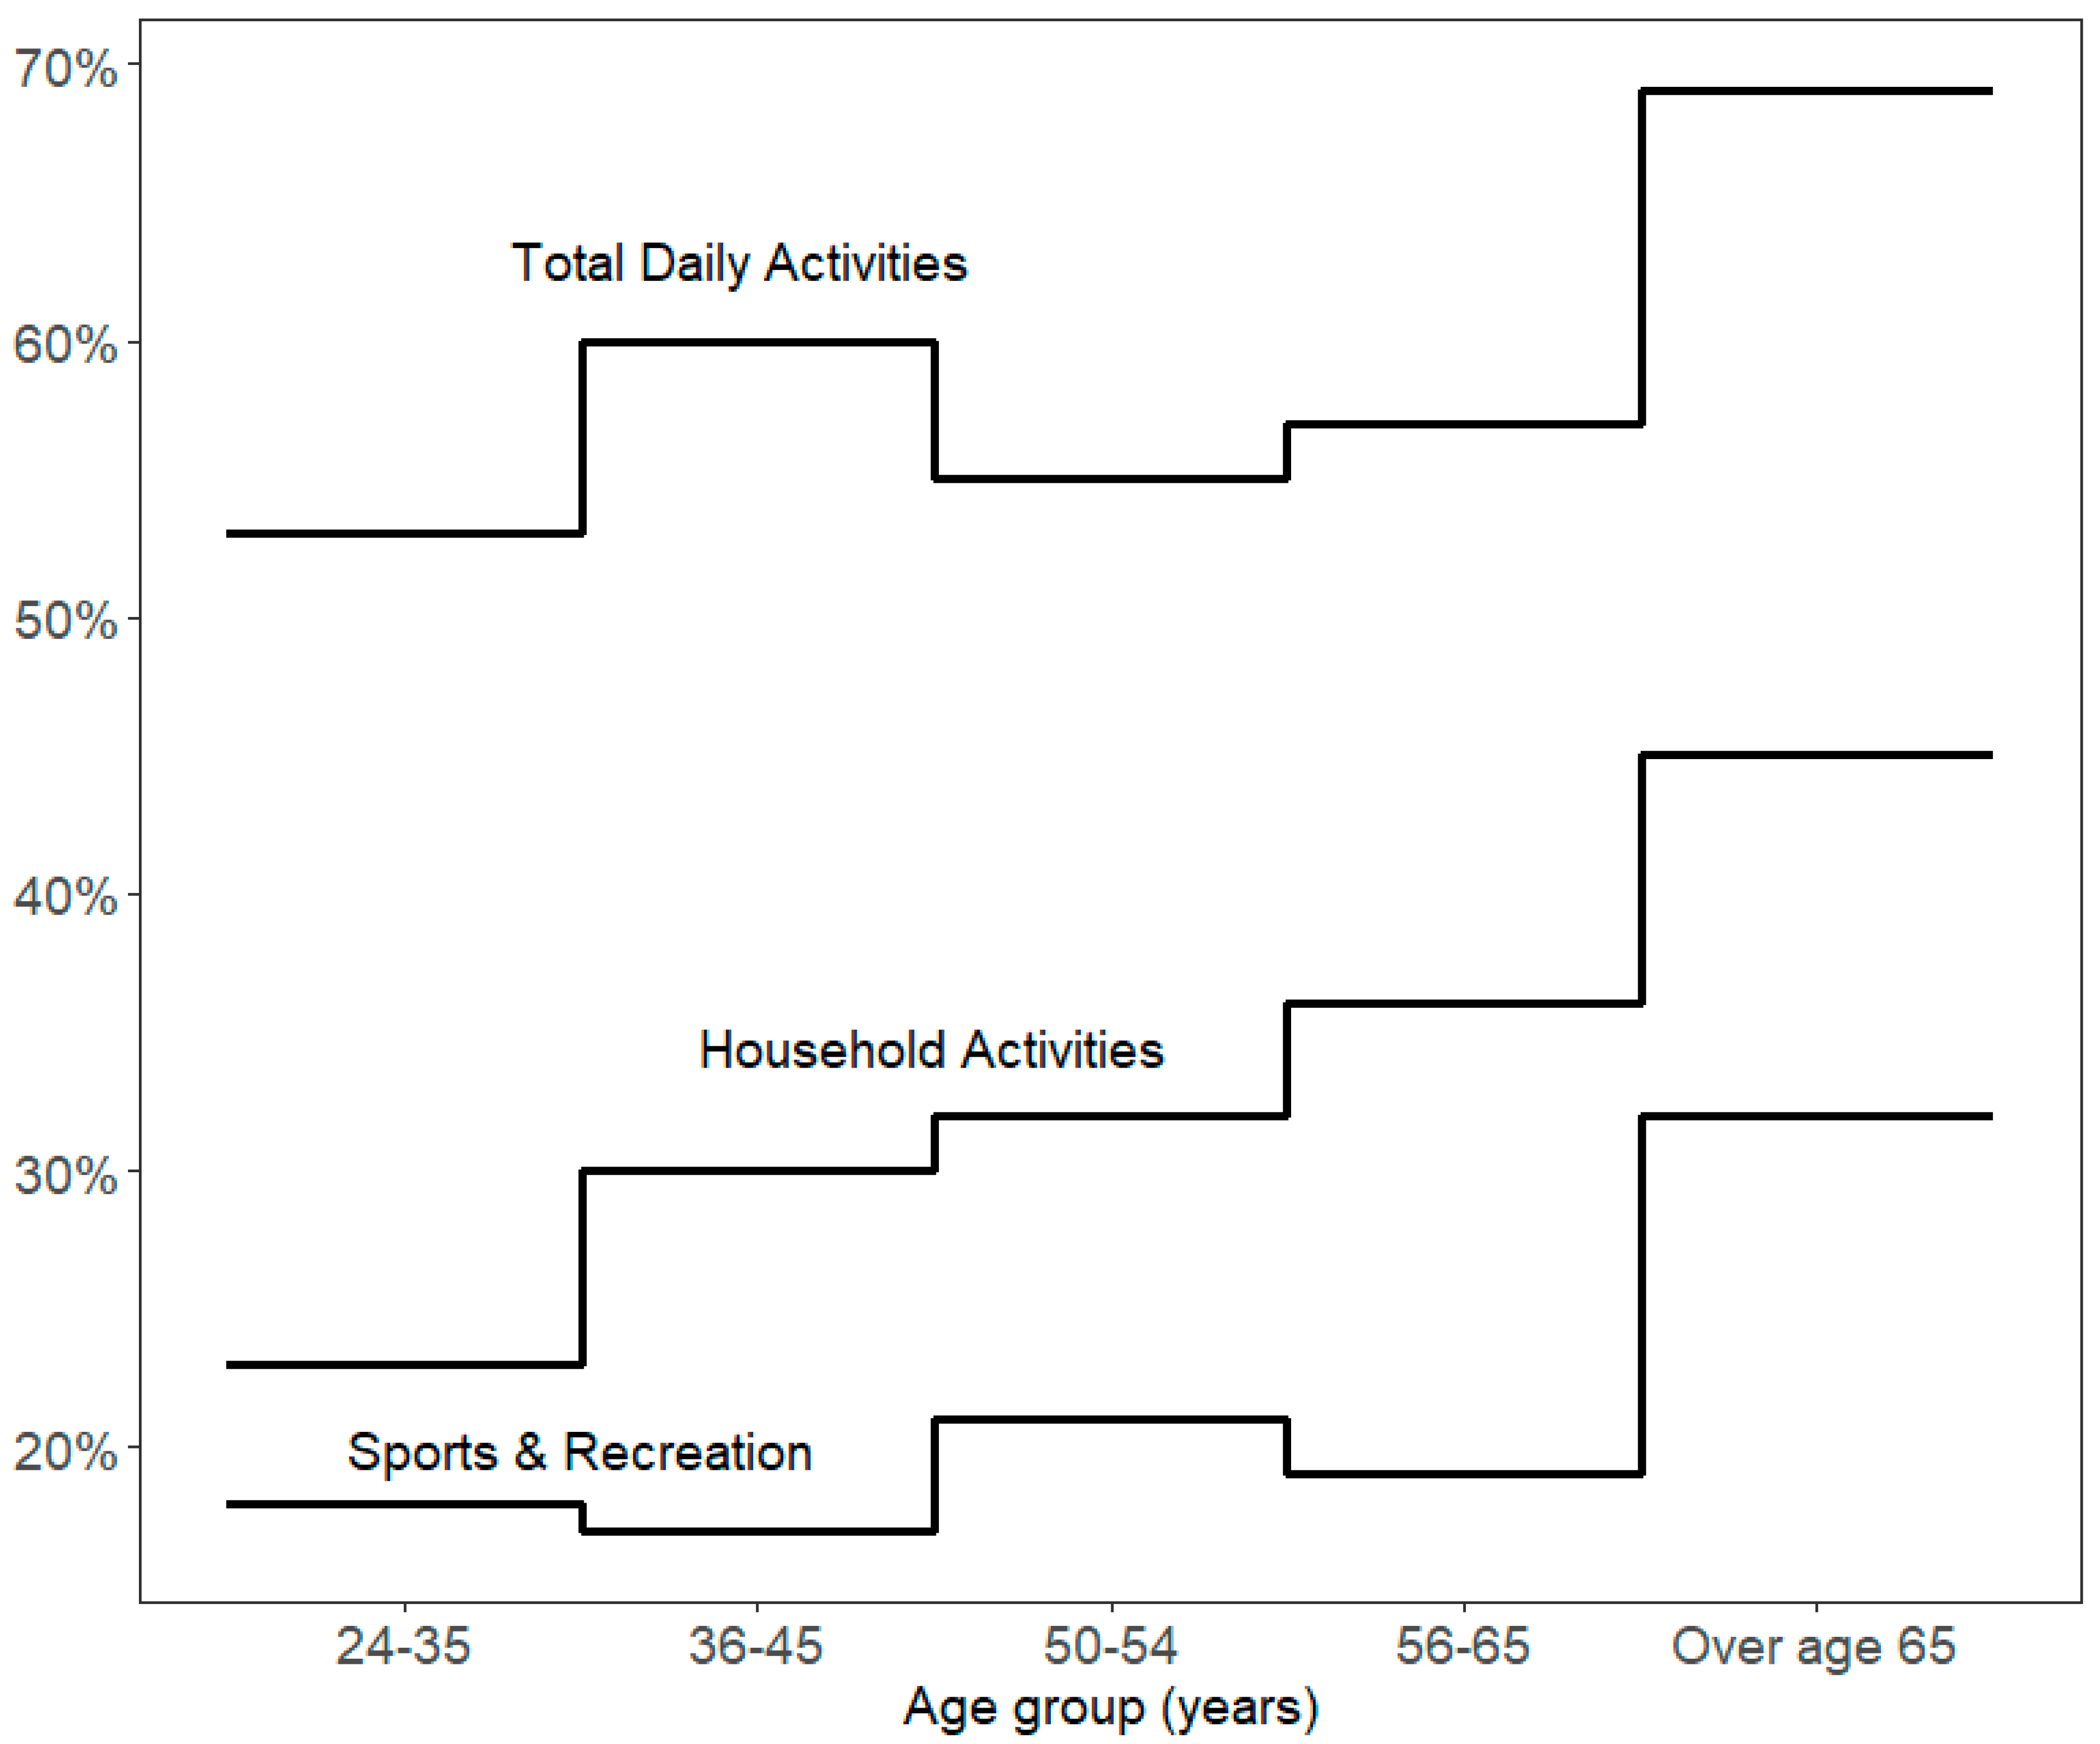
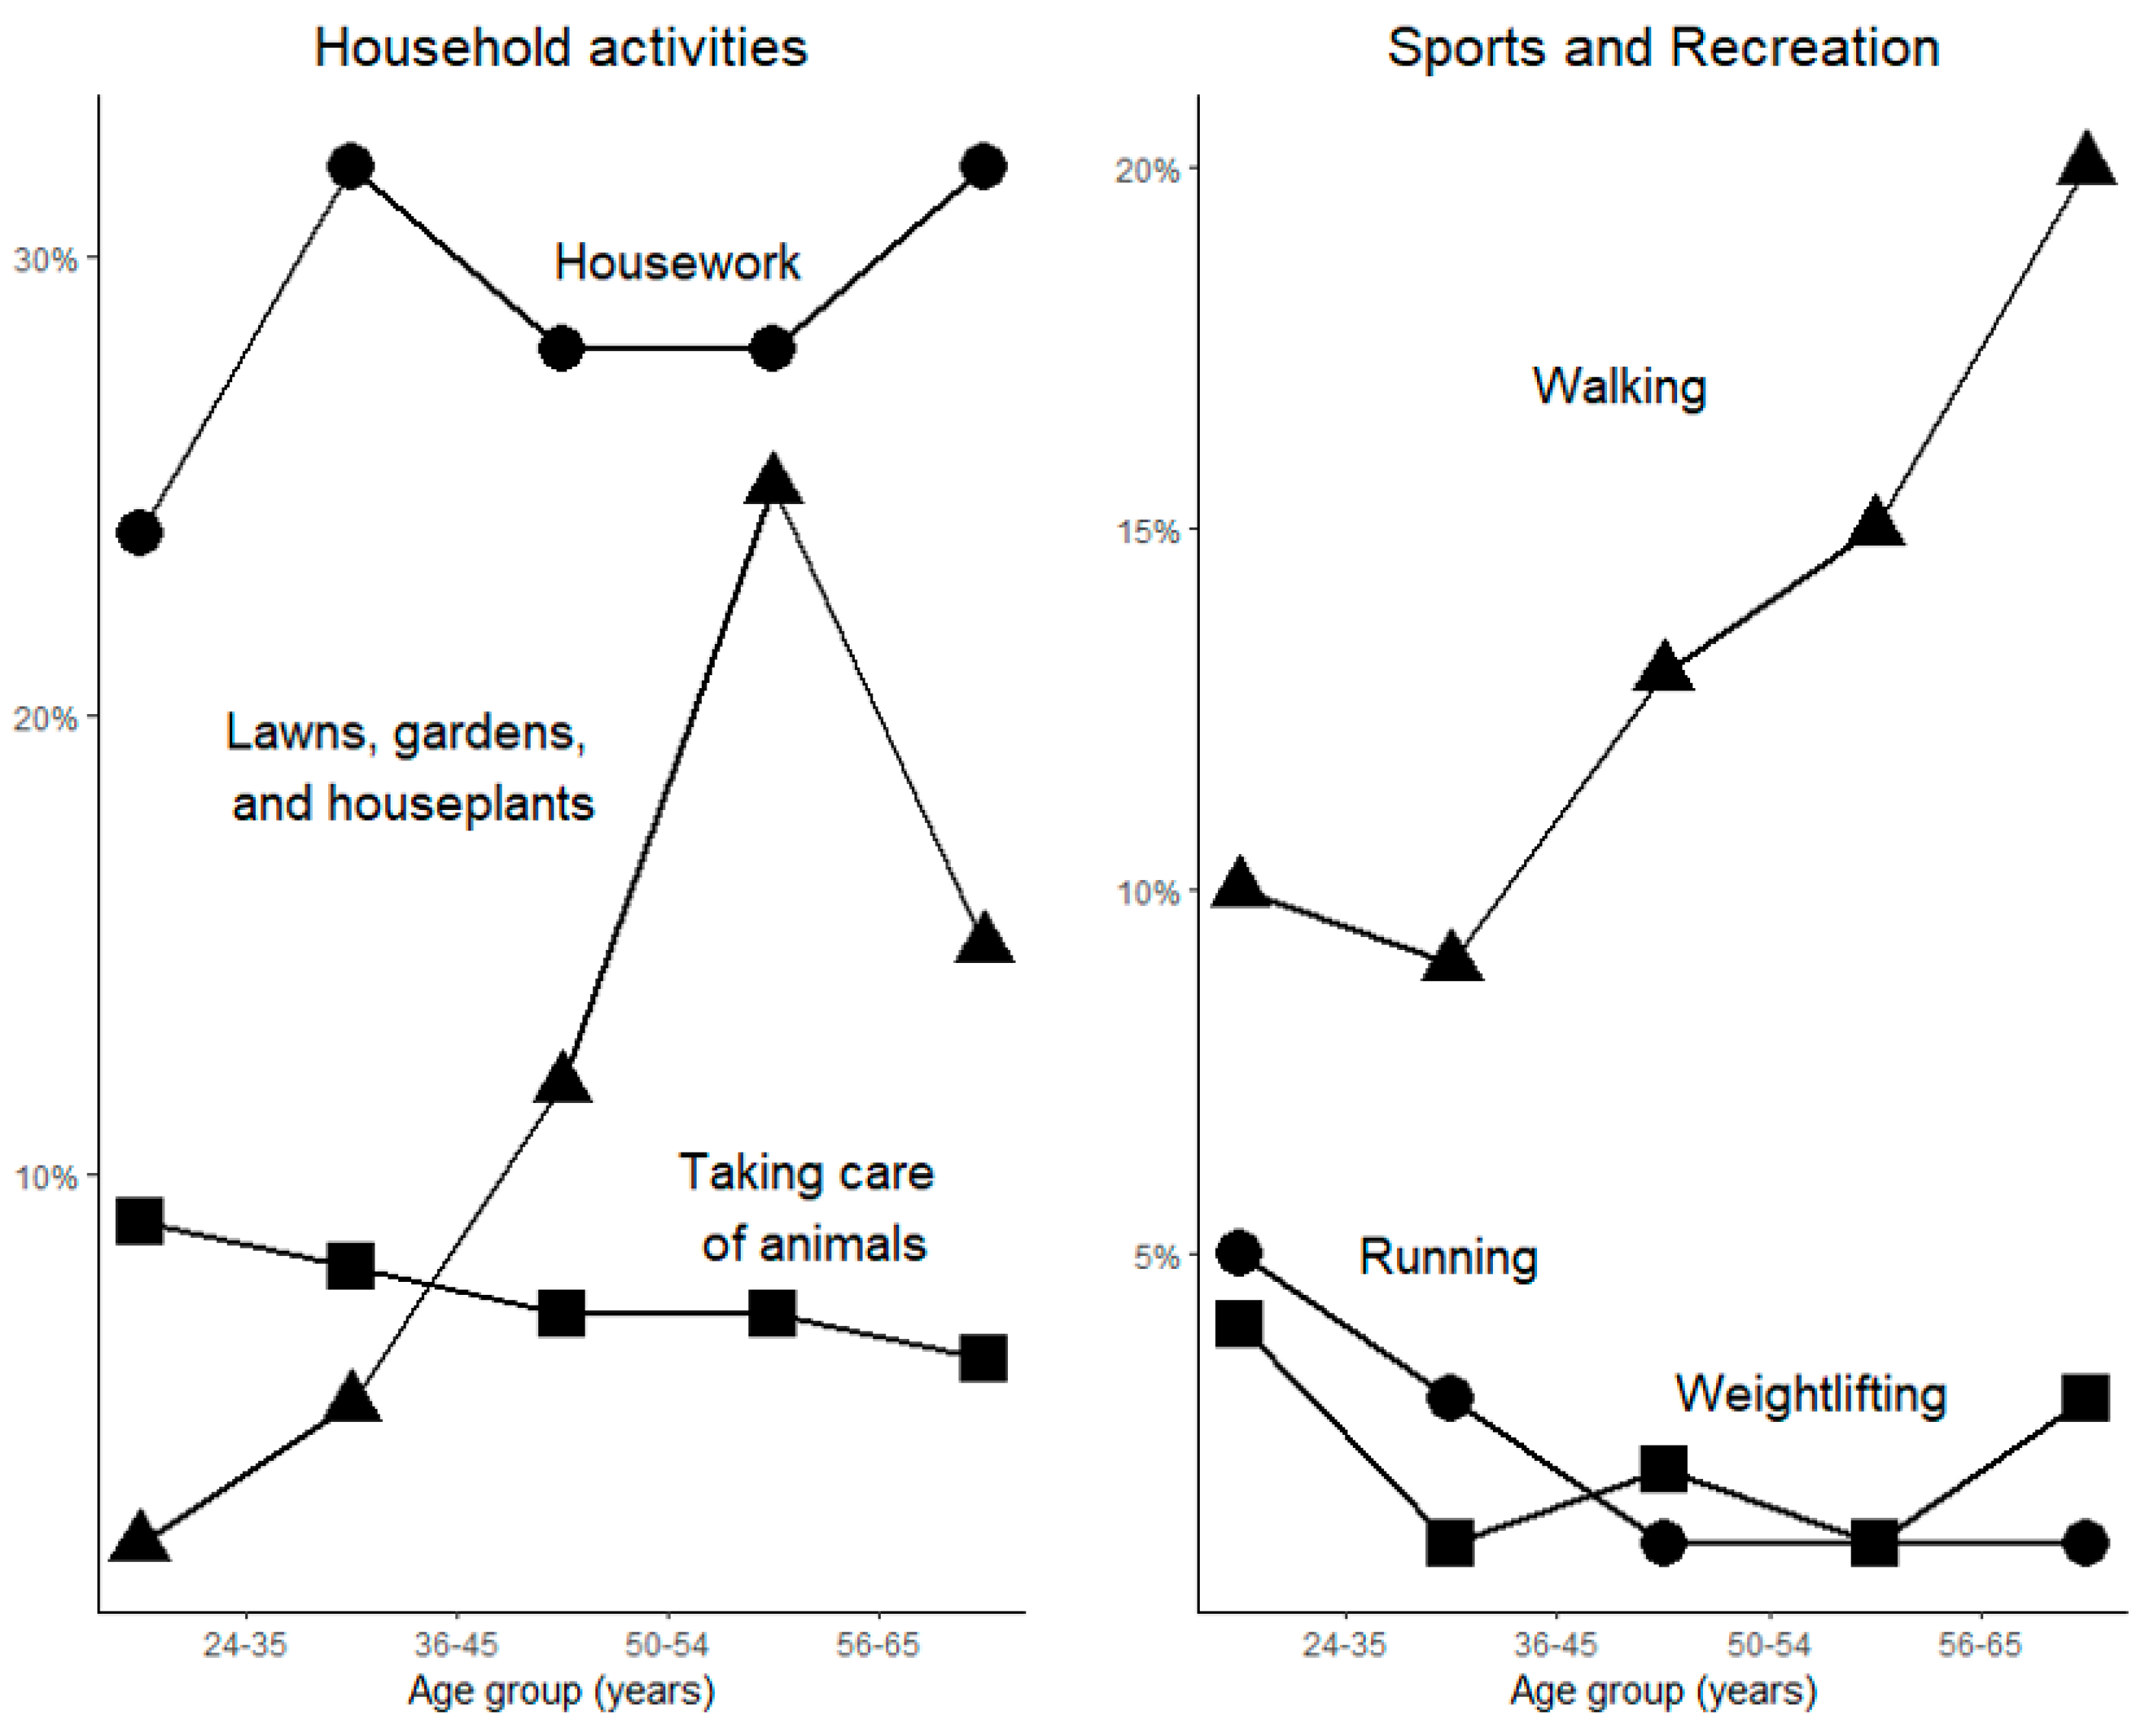
| Age group | Age 24–35 | 787 (34.3%) | 146 (17.7%) | 0.001 | 197 (22.7%) | 0.000 |
| Age 36–45 | 947 (26.3%) | 160 (16.7%) | 315 (29.6%) | |||
| Age 46–55 | 550 (18.7%) | 121 (20.5%) | 197 (32.4%) | |||
| Age 56–65 | 301 (11.4%) | 55 (19.0%) | 114 (36.5%) | |||
| Over age 65 | 280 (9.4%) | 84 (31.9%) | 122 (45.0%) | |||
| Sex | Male | 1277 (45.9%) | 282 (17.3%) | 0.015 | 614 (35.6%) | 0.000 |
| Female | 1588 (54.1%) | 284 (22.0%) | 331 (23.4%) | |||
| Health status | Very good/excellent | 854 (54.5%) | 184 (23.8%) | 0.021 | 282 (27.8%) | 0.400 |
| Good/fair/poor | 672 (45.5%) | 127 (17.3%) | 233 (30.2%) | |||
| Education | College | 1980 (66.4%) | 418 (21.5%) | 0.025 | 620 (27.6%) | 0.020 |
| High school | 764 (29.4%) | 131 (16.0%) | 279 (34.8%) | |||
| Less than high school | 103 (4.3%) | 15 (15.1%) | 36 (33.2%) | |||
| Weekday or weekend | Weekday | 1875 (71.4%) | 378 (19.5%) | 0.892 | 576 (28.3%) | 0.011 |
| Weekend day | 990 (28.6%) | 188 (19.3%) | 369 (34.3%) | |||
| Variable | Category | Sports and Recreation | Household Activities | ||
|---|---|---|---|---|---|
| OR (95% CI) | p Value | OR (95% CI) | p Value | ||
| Race/ethnicity | Native Hawaiians | 1 | 1 | ||
| Chinese | 2.24 (1.05, 4.79) | 0.038 | 0.93 (0.64, 1.33) | 0.680 | |
| Asian Indian | 2.46 (1.13, 5.34) | 0.023 | 1.05 (0.72, 1.52) | 0.810 | |
| Filipino | 0.83 (0.33, 2.14) | 0.707 | 0.81 (0.54, 1.21) | 0.302 | |
| Japanese | 1.19 (0.45, 3.12) | 0.727 | 1.10 (0.71, 1.00) | 0.668 | |
| Korean | 1.95 (0.79, 4.81) | 0.146 | 0.97 (0.58, 1.63) | 0.907 | |
| Vietnamese | 1.40 (0.57, 3.42) | 0.465 | 0.84 (0.52, 1.34) | 0.465 | |
| Other Asian | 1.54 (0.69, 3.44) | 0.290 | 1.16 (0.79, 1.70) | 0.451 | |
| Age group | 24–35 | 1 | 1 | ||
| 36–45 | 0.80 (0.51, 1.26) | 0.339 | 1.42 (1.08, 1.88) | 0.014 | |
| 46–55 | 0.95 (0.57, 1.60) | 0.850 | 1.44 (1.04, 2.00) | 0.027 | |
| 56–65 | 1.21 (0.66, 2.22) | 0.546 | 1.78 (1.27, 2.51) | 0.001 | |
| Over age 65 | 3.06 (1.71, 5.49) | 0.000 | 1.96 (1.38, 2.77) | 0.000 | |
| Sex | Female | 1 | 1 | ||
| Male | 1.38 (0.98, 1.95) | 0.066 | 0.66 (0.54, 0.81) | 0.000 | |
| Health status | Good/fair/poor | 1 | 1 | ||
| Very good or excellent | 1.60 (1.12, 2.30) | 0.010 | 1.00 (0.82, 1.21) | 0.967 | |
| Education | College degree | 1 | 1 | ||
| High school degree | 1.23 (0.80, 1.87) | 0.343 | 1.17 (0.93, 1.47) | 0.179 | |
| Less than high school | 1.18 (0.52, 2.65) | 0.694 | 1.13 (0.75, 1.69) | 0.573 | |
| Weekday or weekend | Weekday | 1 | 1 | ||
| Weekend | 1.13 (0.77, 1.65) | 0.540 | 1.28 (1.05, 1.56) | 0.013 | |
| Variable | Category | N (%) | p Value | OR (95% CI) | p Value |
|---|---|---|---|---|---|
| Race/ethnicity | Native Hawaiians | 121 (54.4%) | 0.011 | 1 | |
| Chinese | 488 (58.4%) | 1.04 (0.62, 1.74) | 0.895 | ||
| Asian Indian | 386 (57.7%) | 1.35 (0.80, 2.28) | 0.259 | ||
| Filipino | 198 (53.4%) | 0.58 (0.32, 1.03) | 0.063 | ||
| Japanese | 101 (55.1%) | 0.89 (0.45, 1.74) | 0.730 | ||
| Korean | 92 (45.1%) | 0.62 (0.31, 1.25) | 0.183 | ||
| Vietnamese | 104 (51.8%) | 0.55 (0.29, 1.06) | 0.076 | ||
| Other Asian | 257 (67.2%) | 1.33 (0.76, 2.33) | 0.323 | ||
| Age group | 24–35 | 464 (53.3%) | 0.005 | 1 | |
| 36–45 | 586 (60.0%) | 1.26 (0.89, 1.77) | 0.190 | ||
| 46–55 | 328 (54.6%) | 0.99 (0.67, 1.48) | 0.974 | ||
| 56–65 | 177 (56.7%) | 1.44 (0.89, 2.34) | 0.139 | ||
| Over age 65 | 192 (69.0%) | 2.98 (1.76, 5.07) | 0.000 | ||
| Sex | Female | 1004 (59.1%) | 0.101 | 0.83 (0.63, 1.08) | 0.168 |
| Male | 743 (54.9%) | 1 | |||
| Health status | Good, fair, or poor | 518 (57.3%) | 0.435 | 1.21 (0.91, 1.60) | 0.190 |
| Very good or excellent | 401 (54.6%) | 1 | |||
| Education | College degree | 469 (59.1%) | 0.633 | 1 | |
| High school | 1207 (56.3%) | 1.24 (0.90, 1.73) | 0.193 | ||
| Less than high school | 58 (58.3%) | 1.29 (0.67, 2.49) | 0.442 | ||
| Weekday or weekend | Weekday | 1118 (55.5%) | 0.034 | 1 | |
| Weekend | 629 (61.2%) | 1.28 (0.96, 1.69) | 0.089 |
| Variable | Category | Mean (SD) in Minutes | p Value | RR (95% CI) in Minutes | p Value |
|---|---|---|---|---|---|
| Exercising with someone | No | 111.2 (145.9) | 0.558 | 1 | |
| Yes | 78.1 (73.7) | 1.93 (1.63, 2.29) | 0.000 | ||
| Ethnicity | Native Hawaiians | 81.5 (83.7) | 1 | ||
| Chinese | 99.2 (107.5) | 0.52 (0.36, 0.76) | 0.001 | ||
| Asian Indian | 97.0 (96.1) | 0.58 (0.39, 0.85) | 0.006 | ||
| Filipino | 107.0 (144.5) | 0.59 (0.37, 0.95) | 0.029 | ||
| Japanese | 89.8 (150.8) | 0.94 (0.61, 1.44) | 0.764 | ||
| Korean | 108.0 (134.7) | 0.48 (0.30, 0.78) | 0.003 | ||
| Vietnamese | 94.1 (112.2) | 0.58 (0.32, 1.05) | 0.072 | ||
| Other Asian | 92.9 (122.4) | 0.72 (0.45, 1.16) | 0.177 | ||
| Age group | 24–35 | 92.2 (117.7) | 0.741 | 1 | |
| 36–45 | 85.8 (77.4) | 1.01 (0.77, 1.32) | 0.951 | ||
| 46–55 | 79.7 (52.0) | 1.02 (0.78, 1.34) | 0.874 | ||
| 56–65 | 95.5 (114.0) | 0.93 (0.68, 1.29) | 0.676 | ||
| Over age 65 | 84.9 (95.5) | 0.87 (0.67, 1.14) | 0.306 | ||
| Sex | Female | 90.0 (110.1) | 0.233 | 1 | |
| Male | 96.2 (102.6) | 1.24 (0.99, 1.55) | 0.067 | ||
| Health status | Good/fair/poor | 115.5 (156.3) | 1 | ||
| Very good or excellent | 81.6 (82.2) | 0.406 | 1.12 (0.90, 1.38) | 0.300 | |
| Education | College degree | 123.0 (113.7) | 0.017 | 1 | |
| High school | 60.0 (30.0, 95.0) | 1.17 (0.94, 1.47) | 0.154 | ||
| Less than High school | 60.0 (37.3, 122.7) | 1.32 (0.87, 1.99) | 0.189 | ||
| Weekday | Yes | 60.0 (30.0, 5.0) | 0.229 | 1 | |
| No | 60.0 (37.3, 122.7) | 1.42 (1.14, 1.77) | 0.002 |
Disclaimer/Publisher’s Note: The statements, opinions and data contained in all publications are solely those of the individual author(s) and contributor(s) and not of MDPI and/or the editor(s). MDPI and/or the editor(s) disclaim responsibility for any injury to people or property resulting from any ideas, methods, instructions or products referred to in the content. |
© 2024 by the authors. Licensee MDPI, Basel, Switzerland. This article is an open access article distributed under the terms and conditions of the Creative Commons Attribution (CC BY) license (https://creativecommons.org/licenses/by/4.0/).
Share and Cite
Davis, J.; Taira, D.A.; Lim, E.; Chen, J. Daily Moderate-to-Vigorous Activity of Native Hawaiians and Pacific Islanders and Seven Asian Subgroups by Types of Activities, American Time Use Survey, 2010–2019. Healthcare 2024, 12, 205. https://doi.org/10.3390/healthcare12020205
Davis J, Taira DA, Lim E, Chen J. Daily Moderate-to-Vigorous Activity of Native Hawaiians and Pacific Islanders and Seven Asian Subgroups by Types of Activities, American Time Use Survey, 2010–2019. Healthcare. 2024; 12(2):205. https://doi.org/10.3390/healthcare12020205
Chicago/Turabian StyleDavis, James, Deborah A. Taira, Eunjung Lim, and John Chen. 2024. "Daily Moderate-to-Vigorous Activity of Native Hawaiians and Pacific Islanders and Seven Asian Subgroups by Types of Activities, American Time Use Survey, 2010–2019" Healthcare 12, no. 2: 205. https://doi.org/10.3390/healthcare12020205