
Heterogeneous Mental Health Responses to the COVID-19 Pandemic in Germany: An Examination of Long-Term Trajectories, Risk Factors, and Vulnerable Groups
 , , , , and
Abstract
:1. Introduction
2. Materials and Methods
2.1. Sample
2.2. Measures
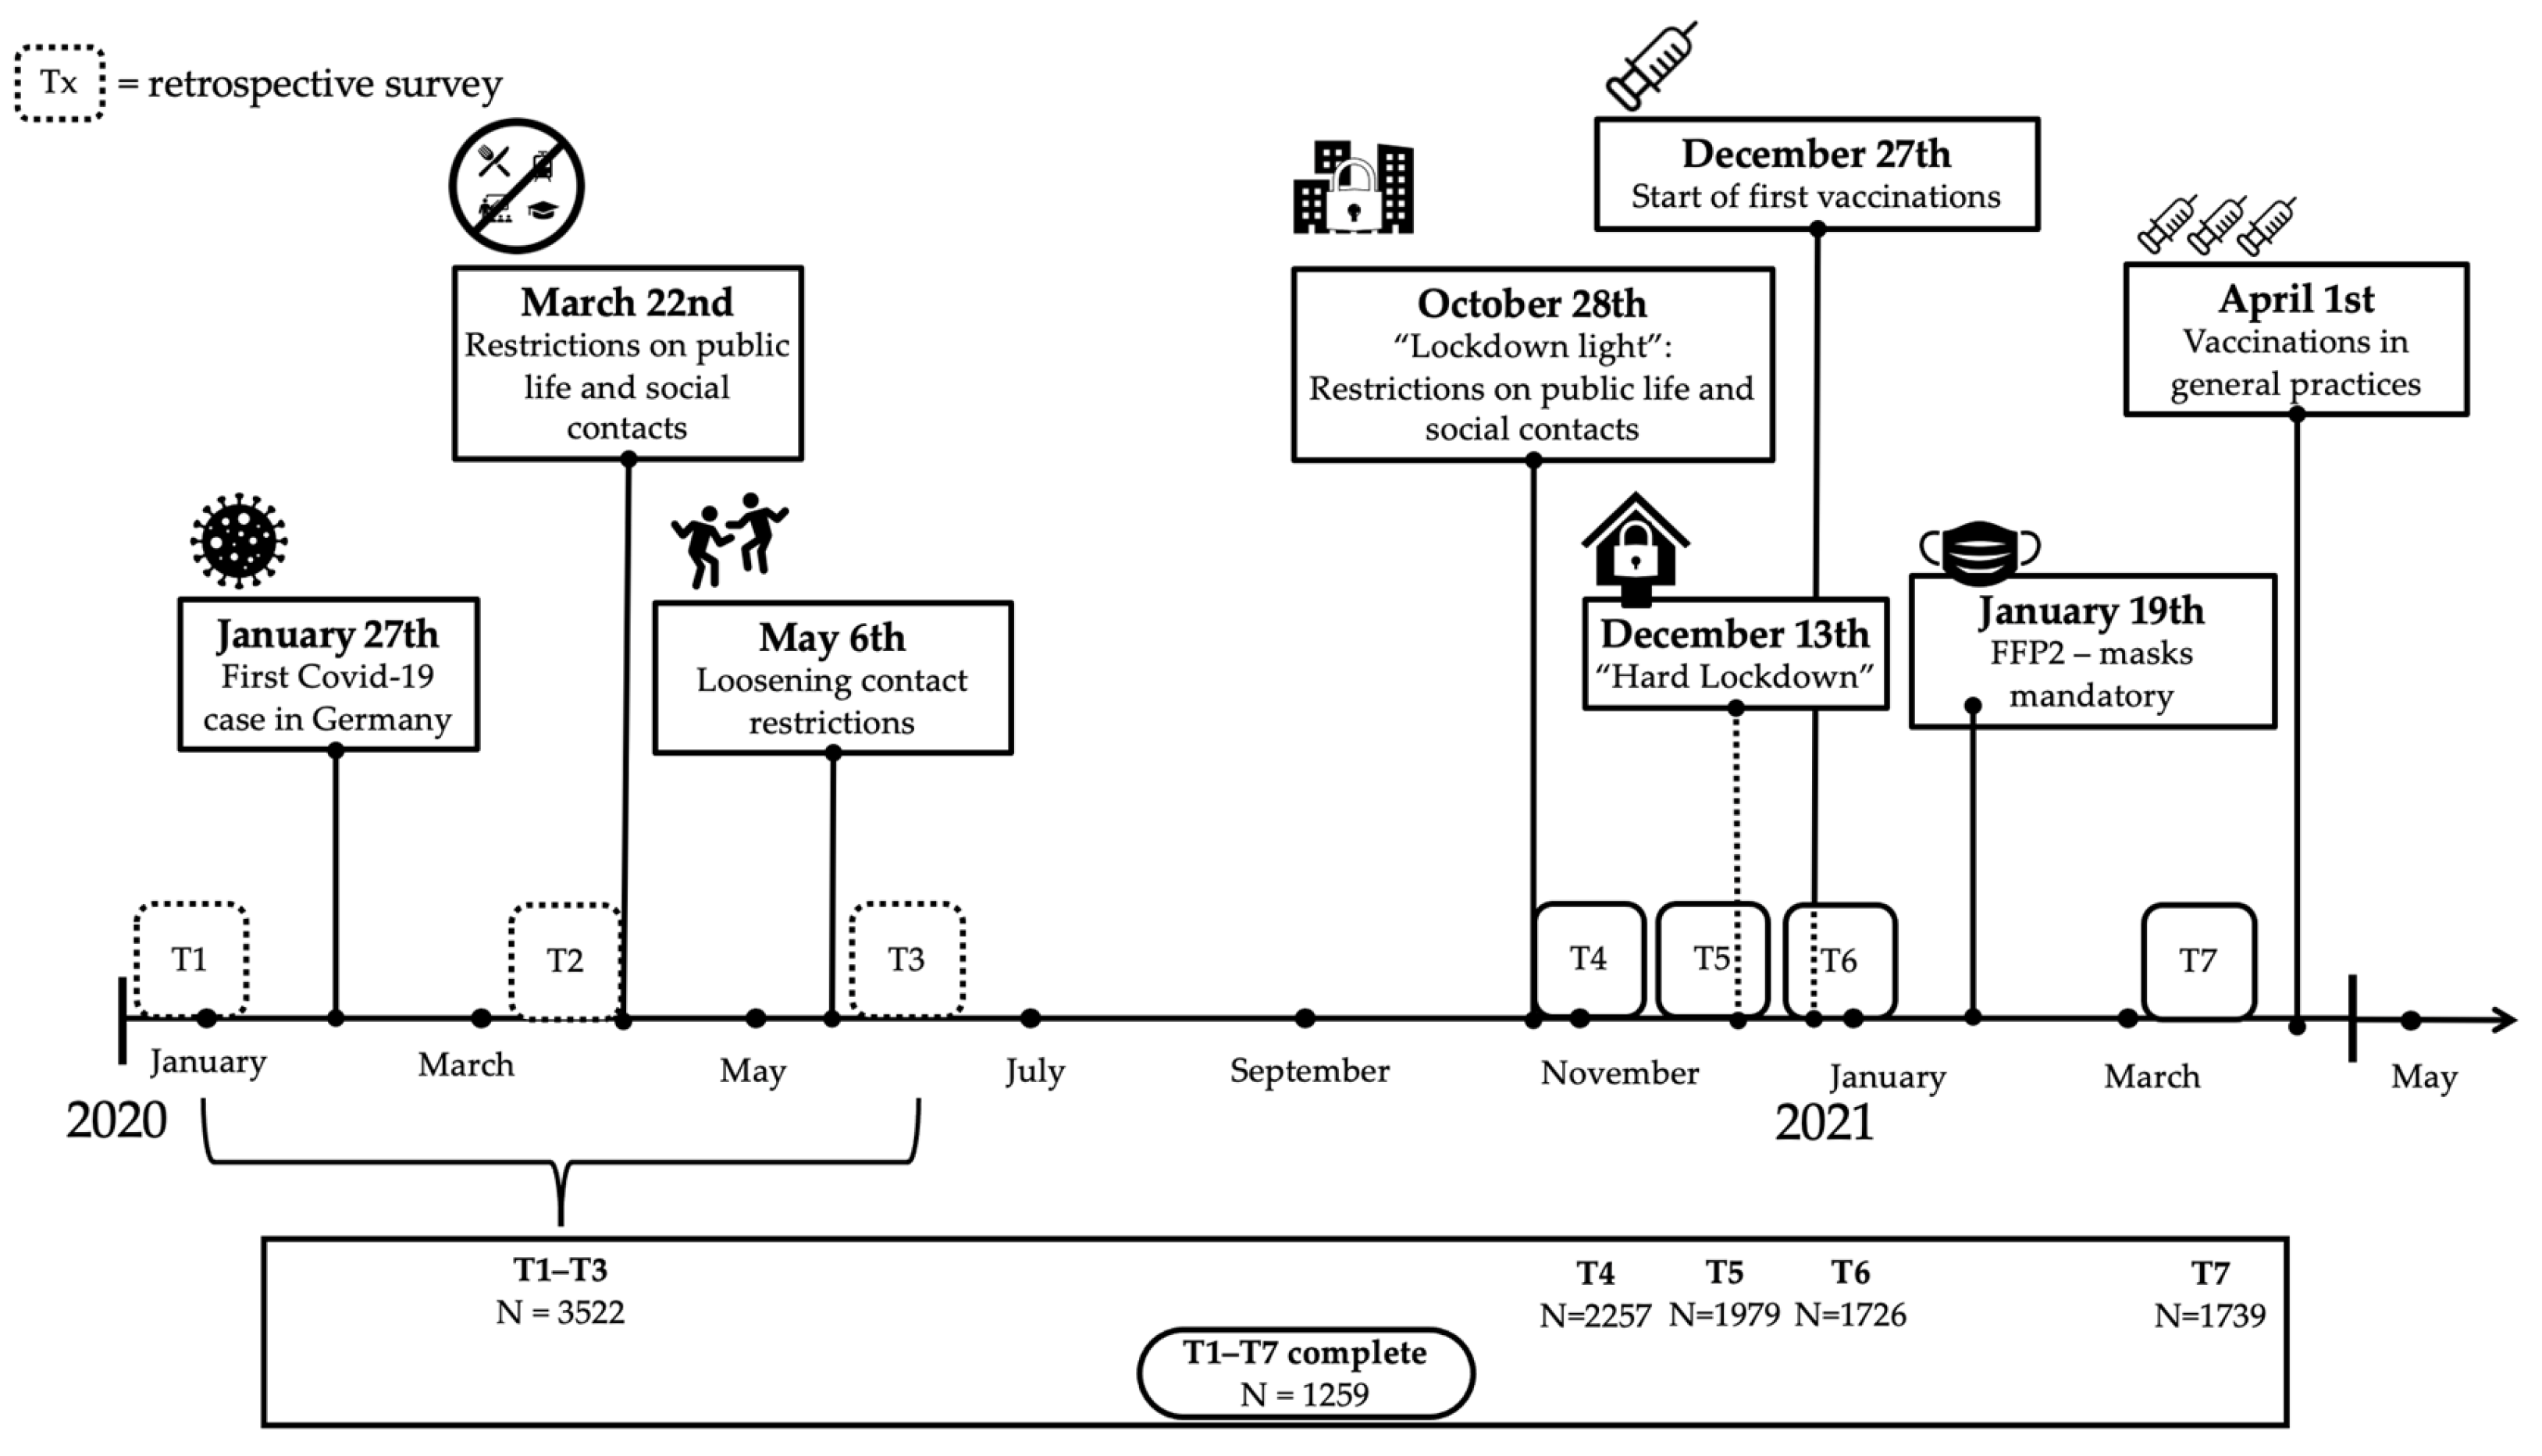
2.3. Study Design
2.4. Data Analysis
2.4.1. Missing Data Imputation
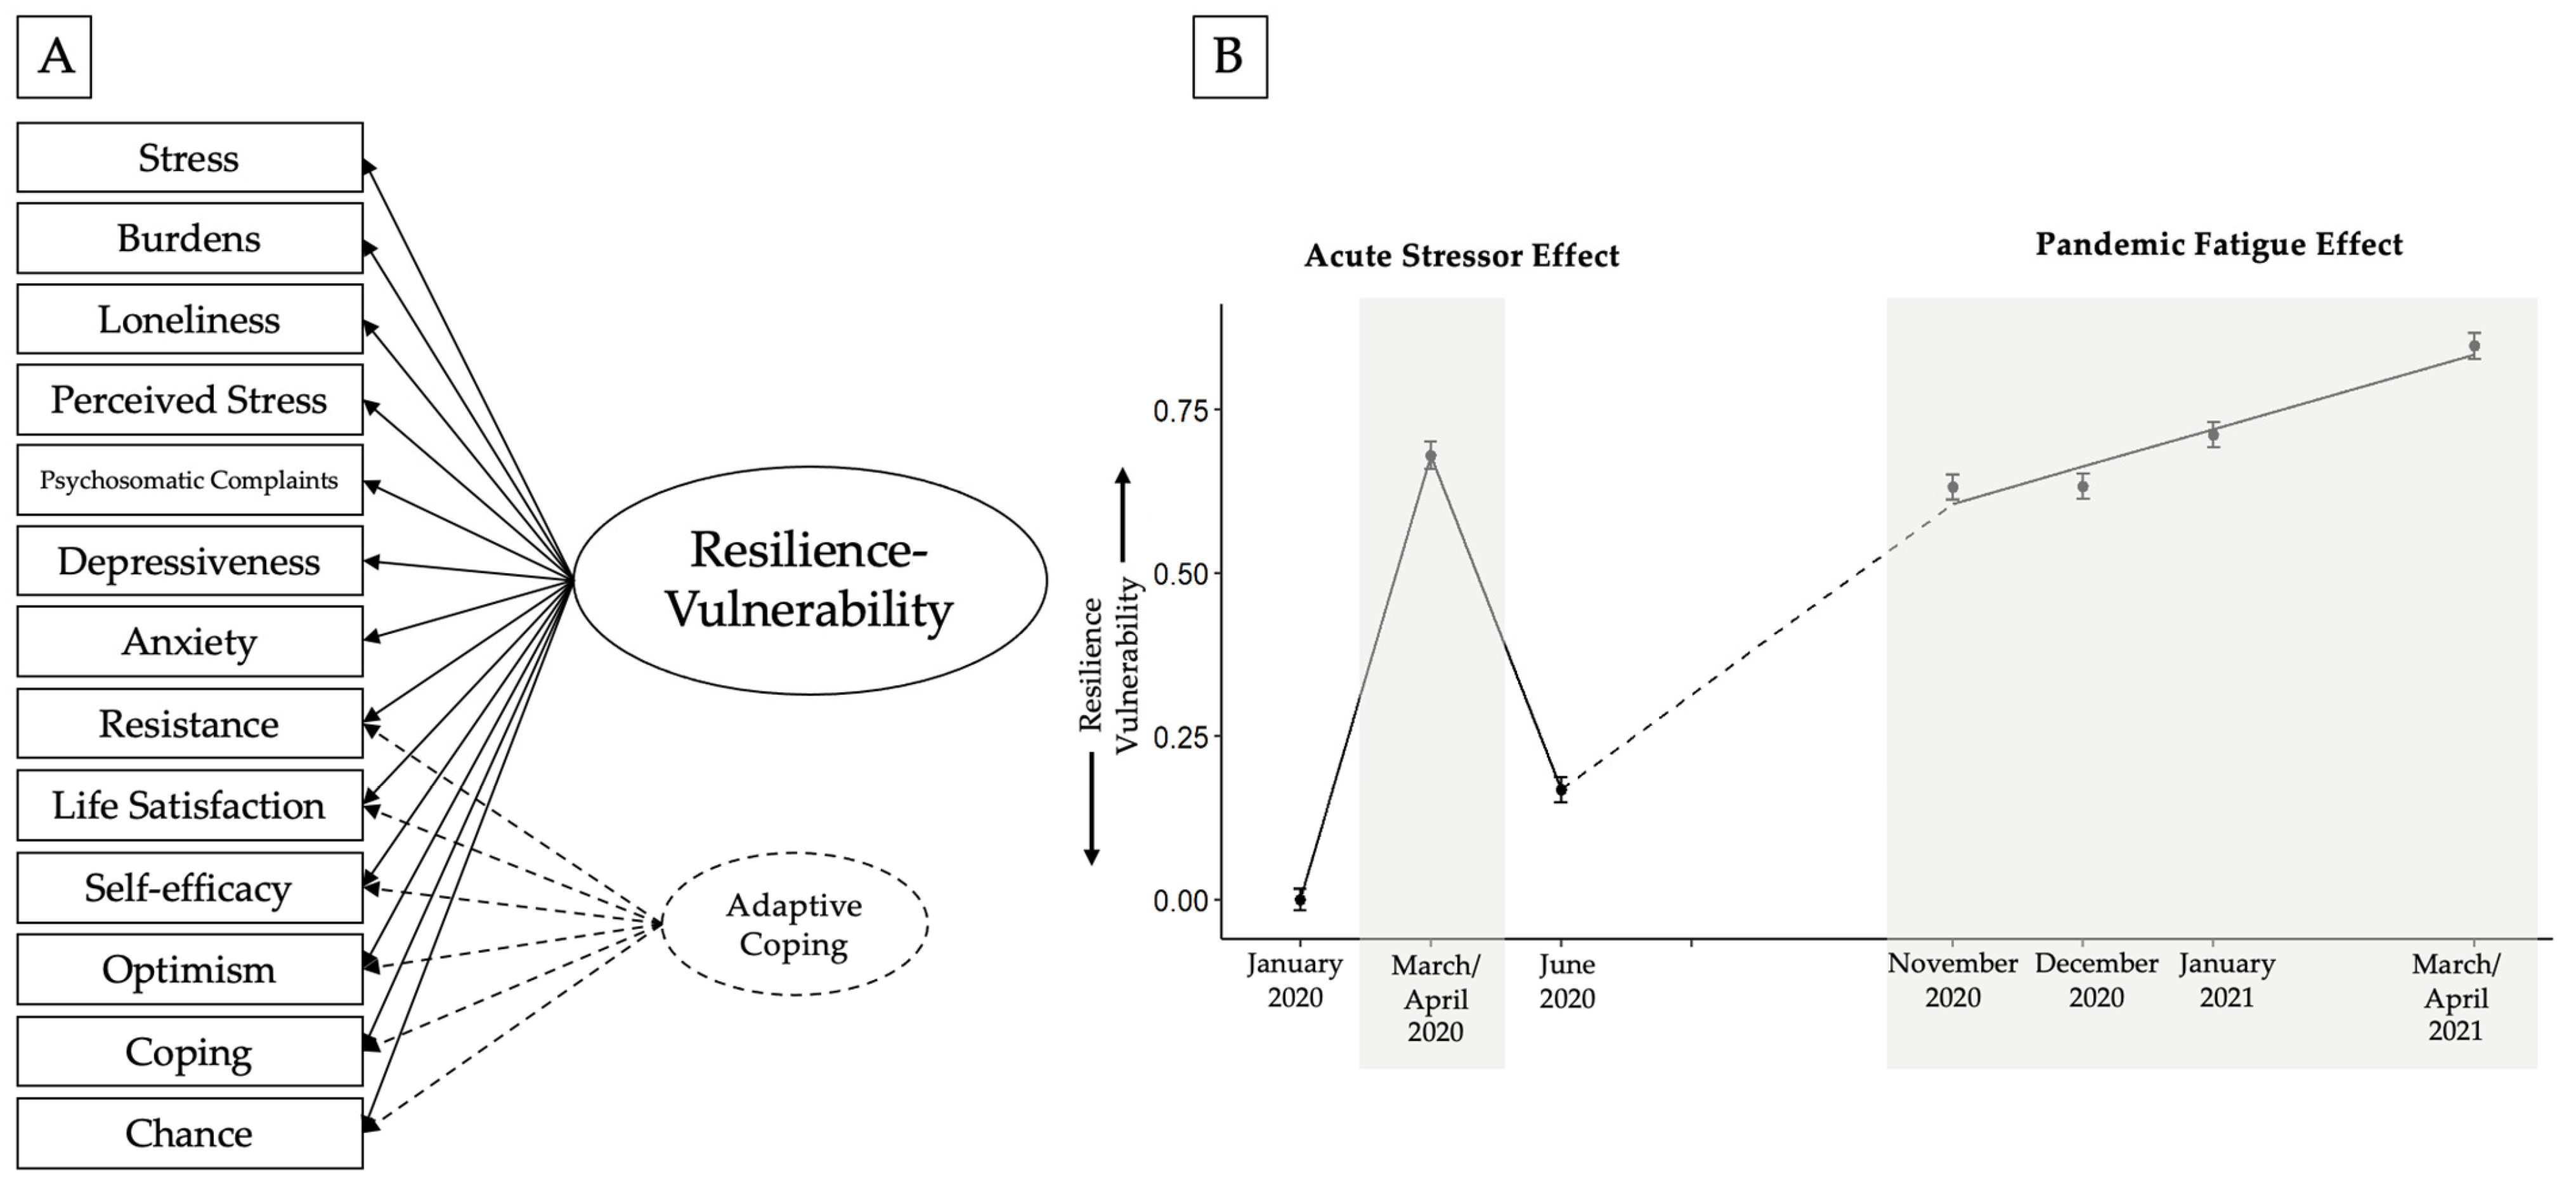
2.4.2. Measurement Model
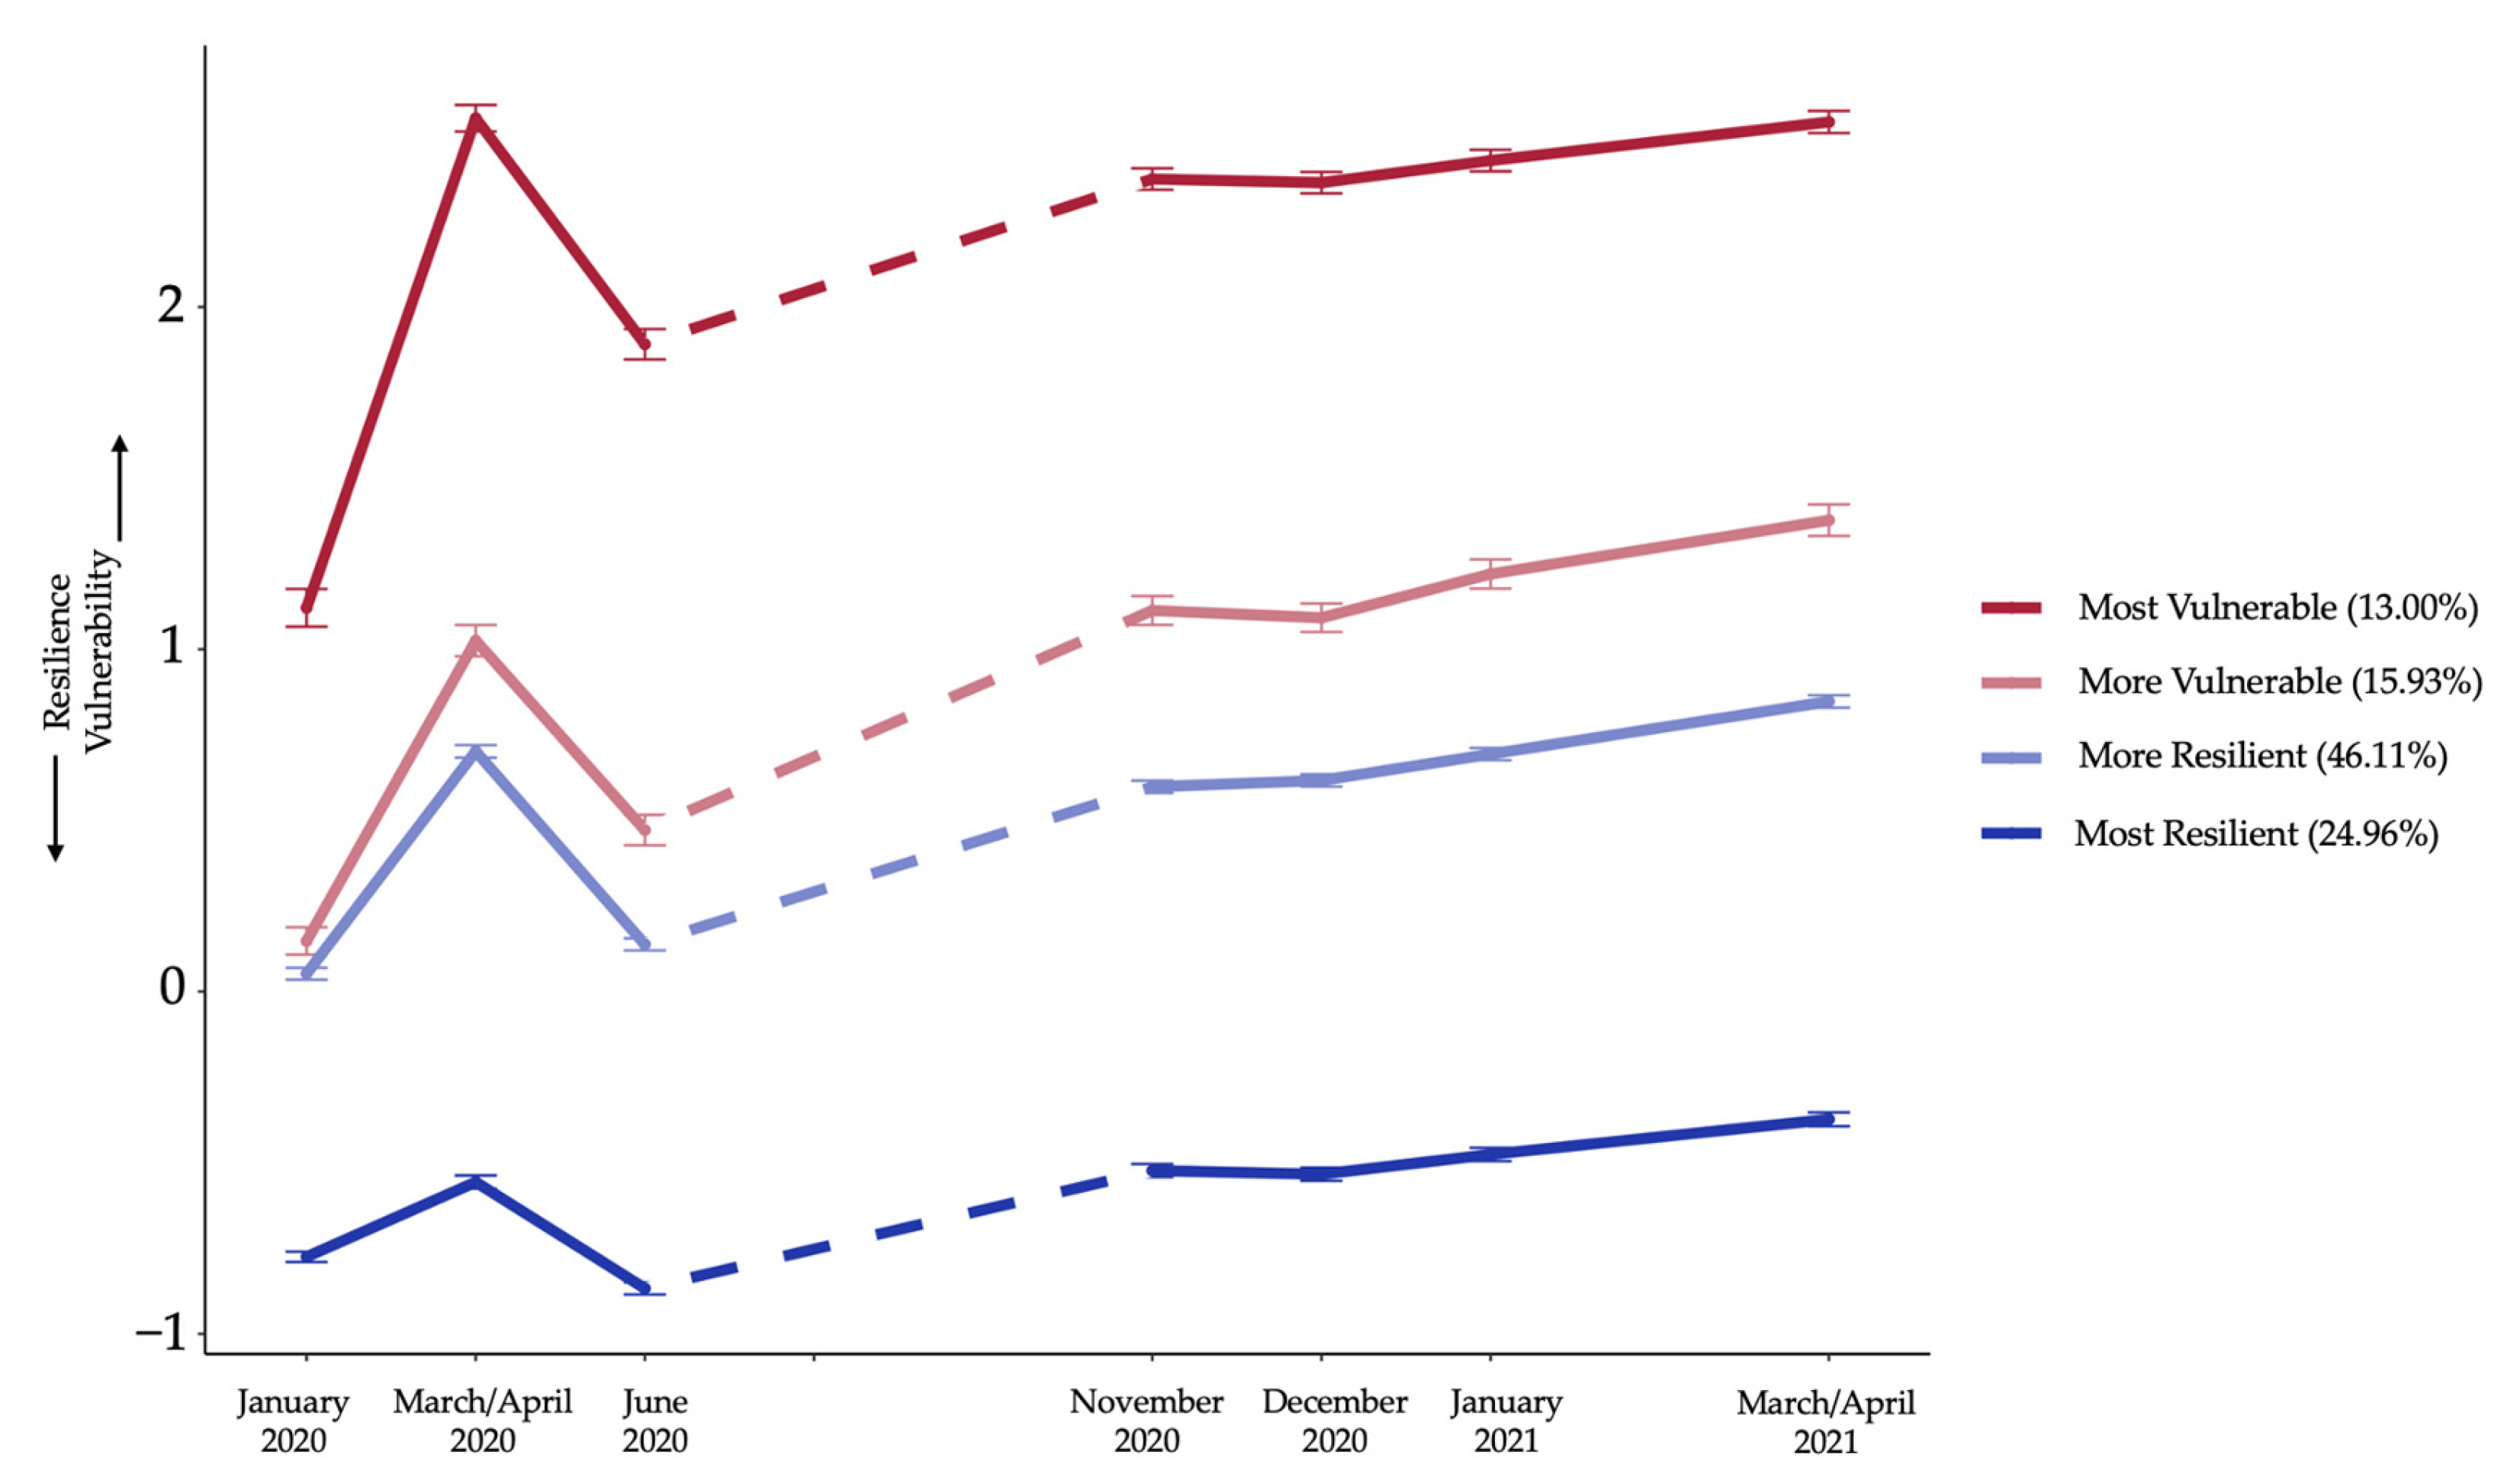
2.4.3. Growth Mixture Modeling
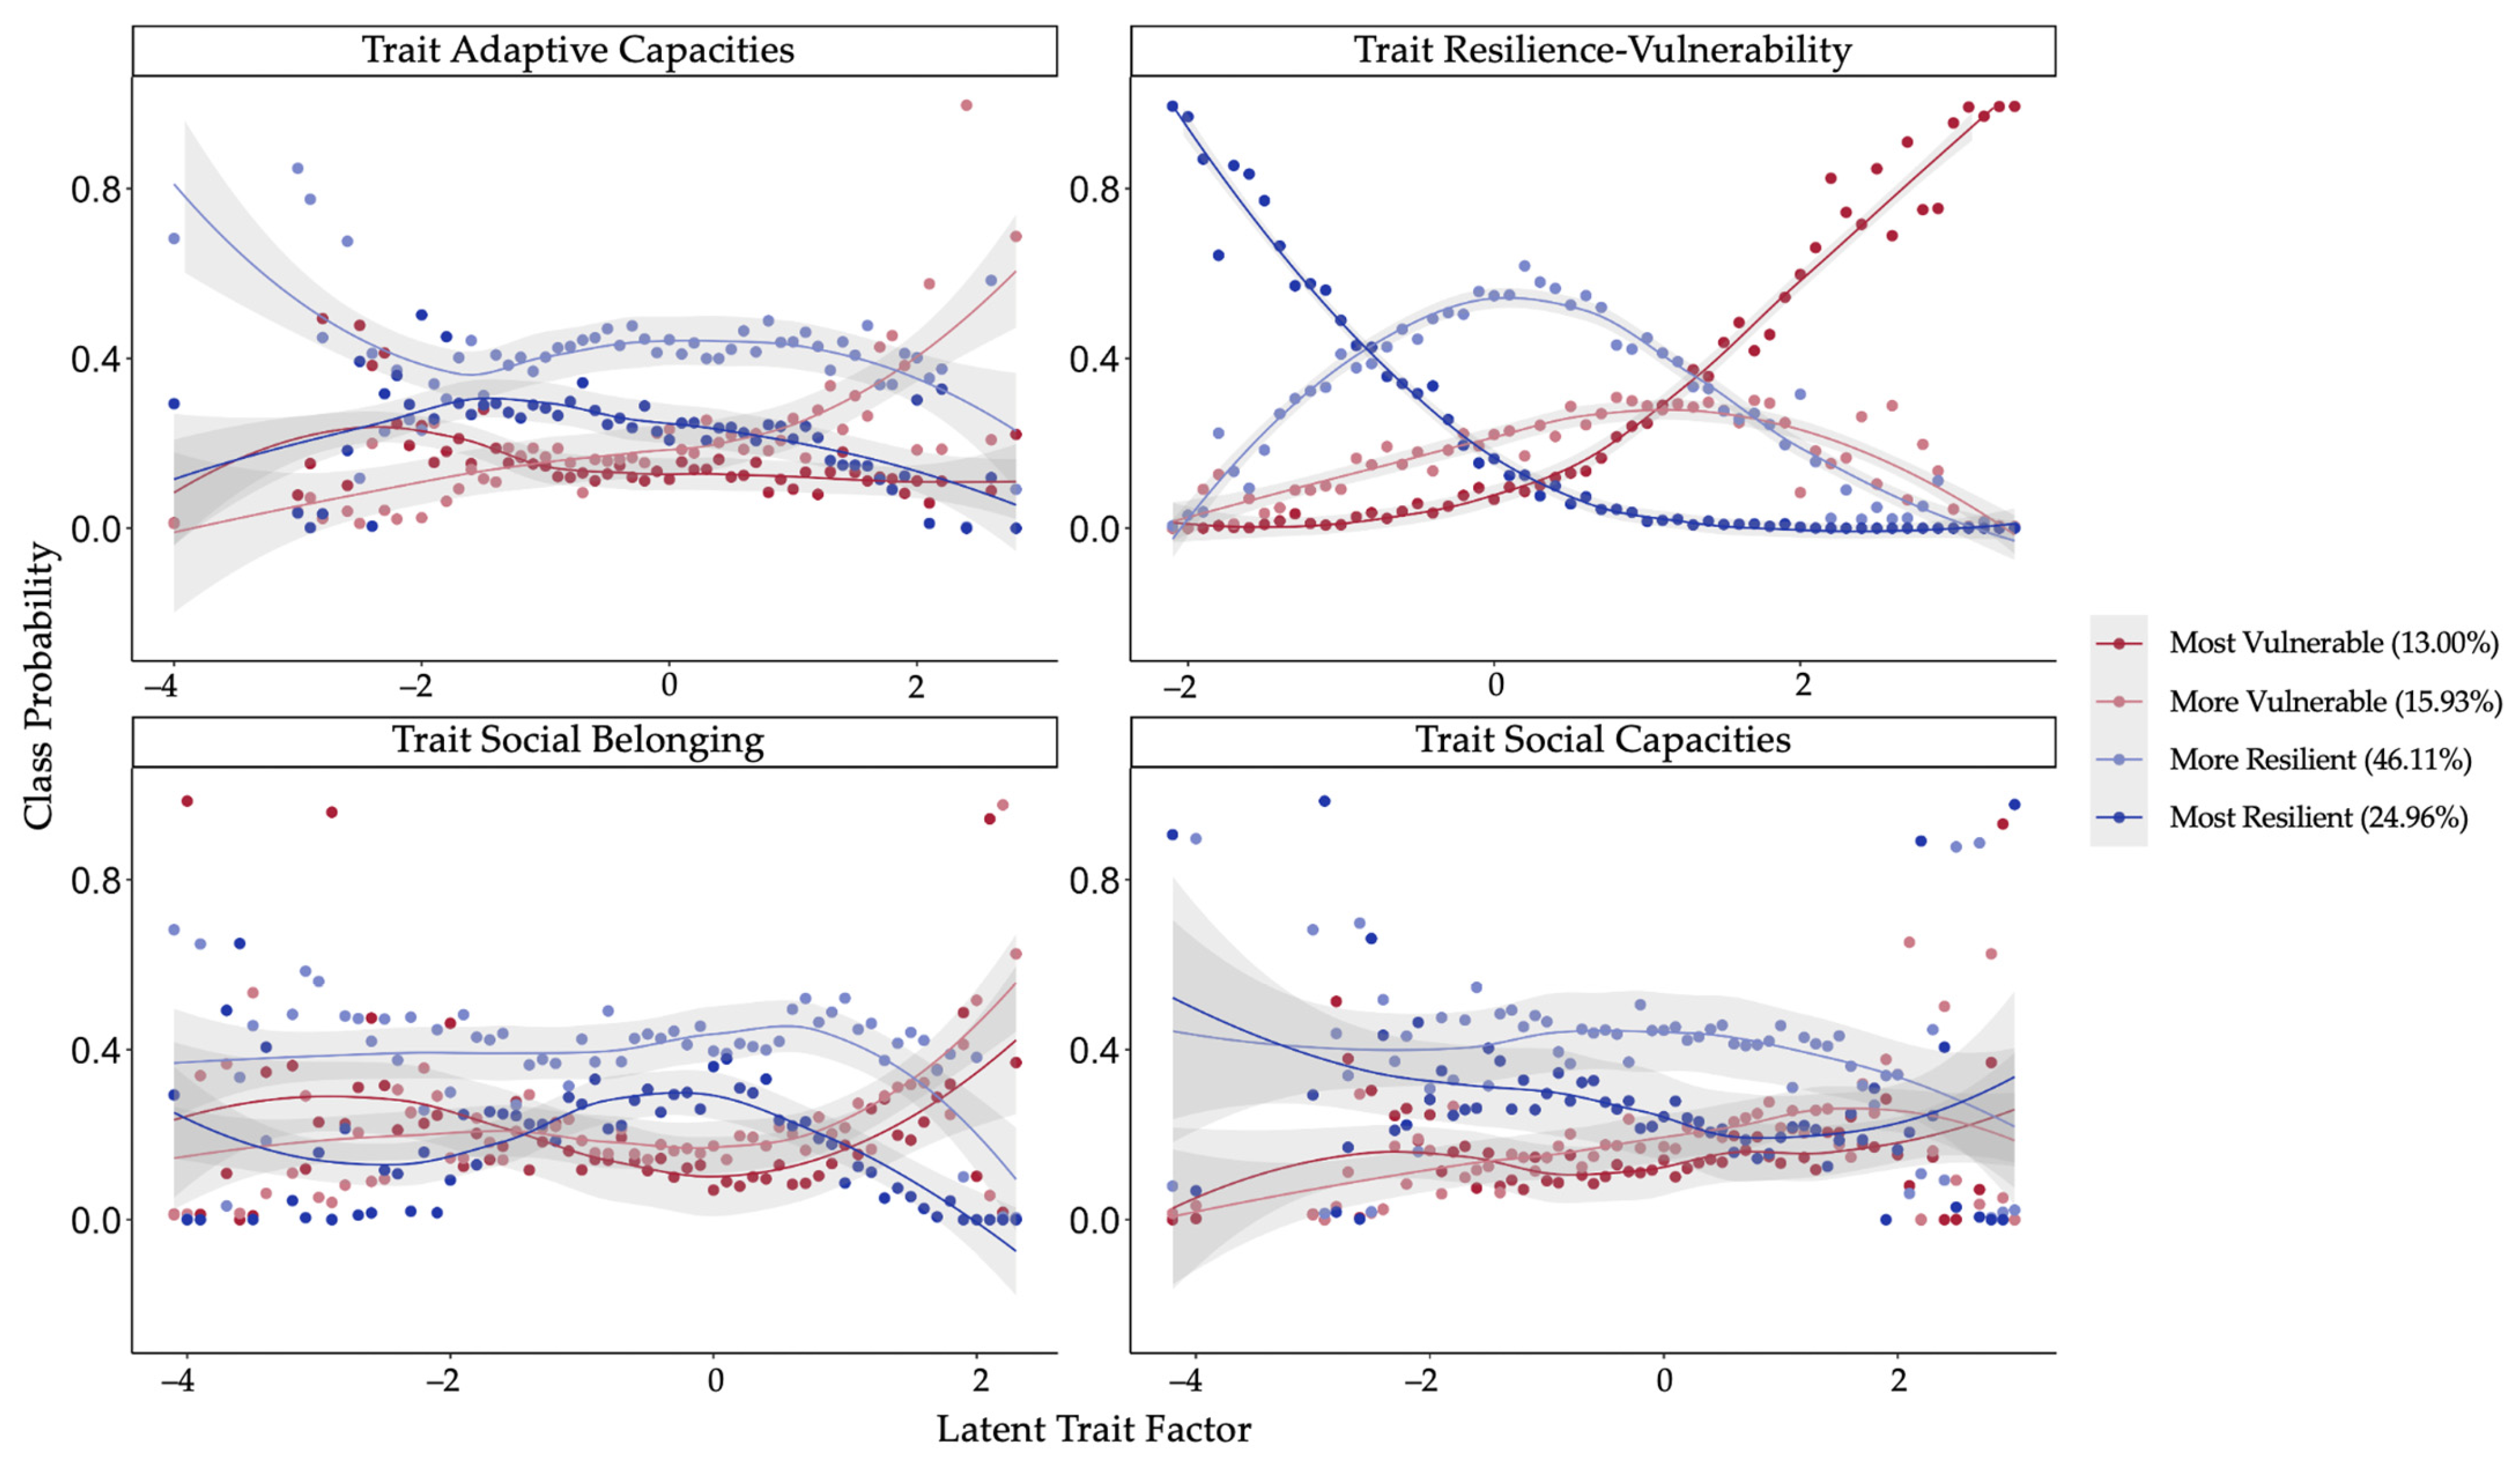
2.4.4. Multinomial Logistic Regression
3. Results
4. Discussion
5. Strengths and Limitations
6. Conclusions
Supplementary Materials
Author Contributions
Funding
Institutional Review Board Statement
Informed Consent Statement
Data Availability Statement
Acknowledgments
Conflicts of Interest
References
- Gruber, J.; Prinstein, M.J.; Abramowitz, J.S.; Albano, A.M.; Aldao, A.; Borelli, J.; Clark, L.A.; Davila, J.; Forbes, E.E.; Gee, D.G.; et al. Mental health and clinical psychological science in the time of COVID-19: Challenges, opportunities, and a call to action. Am. Psychol. 2021, 76, 409–426. [Google Scholar] [CrossRef] [PubMed]
- Blanc, J.; Briggs, A.Q.; Seixas, A.A.; Reid, M.; Jean-Louis, G.; Pandi-Perumal, S.R. Addressing Psychological Resilience during the Coronavirus Disease 2019 Pandemic: A Rapid Review. Curr. Opin. Psychiatry 2021, 34, 29–35. Available online: https://journals.lww.com/co-psychiatry/Fulltext/2021/01000/Addressing_psychological_resilience_during_the.5.aspx (accessed on 1 June 2021). [CrossRef] [PubMed]
- Hossain, M.M.; Tasnim, S.; Sultana, A.; Faizah, F.; Mazumder, H.; Zou, L.; McKyer, E.L.J.; Ahmed, H.U.; Ma, P. Epidemiology of mental health problems in COVID-19: A review. F1000Research 2020, 9, 636. Available online: https://www.ncbi.nlm.nih.gov/pmc/articles/PMC7549174/ (accessed on 1 June 2021). [CrossRef] [PubMed]
- Tsamakis, K.; Tsiptsios, D.; Ouranidis, A.; Mueller, C.; Schizas, D.; Terniotis, C.; Nikolakakis, N.; Tyros, G.; Kympouropoulos, S.; Lazaris, A.; et al. COVID-19 and its consequences on mental health. Exp. Ther. Med. 2021, 21, 1. Available online: http://www.spandidos-publications.com/10.3892/etm.2021.9675/abstract (accessed on 1 June 2021). [CrossRef]
- Vindegaard, N.; Benros, M.E. COVID-19 pandemic and mental health consequences: Systematic review of the current evidence. Brain Behav. Immun. 2020, 89, 531–542. [Google Scholar] [CrossRef]
- Holman, E.A.; Thompson, R.R.; Garfin, D.R.; Silver, R.C. The unfolding COVID-19 pandemic: A probability-based, nationally representative study of mental health in the United States. Sci. Adv. 2020, 6, eabd5390. [Google Scholar] [CrossRef]
- Pierce, M.; Hope, H.; Ford, T.; Hatch, S.; Hotopf, M.; John, A.; Kontopantelis, E.; Webb, R.; Wessely, S.; McManus, S.; et al. Mental health before and during the COVID-19 pandemic: A longitudinal probability sample survey of the UK population. Lancet Psychiatry 2020, 7, 883–892. [Google Scholar] [CrossRef]
- Racine, N.; Hetherington, E.; McArthur, B.A.; McDonald, S.; Edwards, S.; Tough, S.; Madigan, S. Maternal depressive and anxiety symptoms before and during the COVID-19 pandemic in Canada: A longitudinal analysis. Lancet Psychiatry 2021, 8, 405–415. [Google Scholar] [CrossRef]
- Robinson, E.; Sutin, A.R.; Daly, M.; Jones, A. A systematic review and meta-analysis of longitudinal cohort studies comparing mental health before versus during the COVID-19 pandemic in 2020. J. Affect. Disord. 2022, 296, 567–576. [Google Scholar] [CrossRef]
- Rosen, M.L.; Rodman, A.M.; Kasparek, S.W.; Mayes, M.; Freeman, M.M.; Lengua, L.J.; Meltzoff, A.N.; McLaughlin, K.A. Promoting youth mental health during the COVID-19 pandemic: A longitudinal study. PLoS ONE 2021, 16, e0255294. [Google Scholar] [CrossRef]
- Silveira, S.; Hecht, M.; Matthaeus, H.; Adli, M.; Voelkle, M.C.; Singer, T. Coping with the COVID-19 Pandemic: Perceived Changes in Psychological Vulnerability, Resilience and Social Cohesion before, during and after Lockdown. Int. J. Environ. Res. Public Health 2022, 19, 3290. [Google Scholar] [CrossRef] [PubMed]
- Wu, T.; Jia, X.; Shi, H.; Niu, J.; Yin, X.; Xie, J.; Wang, X. Prevalence of mental health problems during the COVID-19 pandemic: A systematic review and meta-analysis. J. Affect. Disord. 2021, 281, 91–98. [Google Scholar] [CrossRef] [PubMed]
- Ahrens, K.F.; Neumann, R.J.; Kollmann, B.; Brokelmann, J.; von Werthern, N.M.; Malyshau, A.; Weichert, D.; Lutz, B.; Fiebach, C.J.; Wessa, M.; et al. Impact of COVID-19 lockdown on mental health in Germany: Longitudinal observation of different mental health trajectories and protective factors. Transl. Psychiatry 2021, 11, 392. [Google Scholar] [CrossRef] [PubMed]
- Daly, M.; Robinson, E. Psychological distress and adaptation to the COVID-19 crisis in the United States. J. Psychiatr. Res. 2021, 136, 603–609. [Google Scholar] [CrossRef]
- Fancourt, D.; Steptoe, A.; Bu, F. Trajectories of anxiety and depressive symptoms during enforced isolation due to COVID-19 in England: A longitudinal observational study. Lancet Psychiatry 2021, 8, 141–149. [Google Scholar] [CrossRef]
- Zaninotto, P.; Iob, E.; Demakakos, P.; Steptoe, A. Immediate and Longer-Term Changes in the Mental Health and Well-being of Older Adults in England During the COVID-19 Pandemic. JAMA Psychiatry 2022, 79, 151. [Google Scholar] [CrossRef]
- Riehm, K.E.; Holingue, C.; Smail, E.J.; Kapteyn, A.; Bennett, D.; Thrul, J.; Kreuter, F.; McGinty, E.E.; Kalb, L.G.; Veldhuis, C.B.; et al. Trajectories of Mental Distress Among U.S. Adults During the COVID-19 Pandemic. Ann. Behav. Med. 2021, 55, 93–102. [Google Scholar] [CrossRef]
- Daly, M.; Robinson, E. Psychological distress associated with the second COVID-19 wave: Prospective evidence from the UK Household Longitudinal Study. J. Affect. Disord. 2022, 310, 274–278. [Google Scholar] [CrossRef]
- Wetherall, K.; Cleare, S.; McClelland, H.; Melson, A.J.; Niedzwiedz, C.L.; O’Carroll, R.E.; O’Connor, D.B.; Platt, S.; Scowcroft, E.; Watson, B.; et al. Mental health and well-being during the second wave of COVID-19: Longitudinal analyses of the UK COVID-19 Mental Health and Wellbeing study (UK COVID-MH). BJPsych Open 2022, 8, e103. [Google Scholar] [CrossRef]
- Shevlin, M.; Butter, S.; McBride, O.; Murphy, J.; Gibson-Miller, J.; Hartman, T.K.; Levita, L.; Mason, L.; Martinez, A.P.; McKay, R.; et al. Psychological responses to the COVID-19 pandemic are heterogeneous but have stabilised over time: 1 year longitudinal follow-up of the COVID-19 Psychological Research Consortium (C19PRC) study [Letter to the editor]. Psychol. Med, 2021; 1–3. [Google Scholar] [CrossRef]
- Laham, S.; Bertuzzi, L.; Deguen, S.; Hecker, I.; Melchior, M.; Patanè, M.; Pinucci, I.; Sijbrandij, M.; van der Waerden, J. Impact of Longitudinal Social Support and Loneliness Trajectories on Mental Health during the COVID-19 Pandemic in France. Int. J. Environ. Res. Public Health 2021, 18, 12677. [Google Scholar] [CrossRef]
- Gambin, M.; Oleksy, T.; Sękowski, M.; Wnuk, A.; Woźniak-Prus, M.; Kmita, G.; Holas, P.; Pisula, E.; Łojek, E.; Hansen, K. Pandemic trajectories of depressive and anxiety symptoms and their predictors: Five-wave study during the COVID-19 pandemic in Poland [Letter to the editor]. Psychol. Med. 2021, 1–3. [Google Scholar] [CrossRef] [PubMed]
- Ellwardt, L.; Präg, P. Heterogeneous mental health development during the COVID-19 pandemic in the United Kingdom. Sci. Rep. 2021, 11, 15958. [Google Scholar] [CrossRef] [PubMed]
- Carr, E.; Oetzmann, C.; Davis, K.; Bergin-Cartwright, G.; Dorrington, S.; Lavelle, G.; Leightley, D.; Polling, C.; Stevelink, S.A.M.; Wickersham, A. Trajectories of mental health among UK university staff and postgraduate students during the pandemic. Occup. Environ. Med. 2022, 79, 514–520. [Google Scholar] [CrossRef] [PubMed]
- Reis, D.; Krautter, K.; Hart, A.; Friese, M. Heterogeneity in mental health change during the COVID-19 pandemic in Germany: The role of social factors. Stress Health 2022, 39, 272–284. [Google Scholar] [CrossRef] [PubMed]
- Fernández, R.S.; Crivelli, L.; Guimet, N.M.; Allegri, R.F.; Picco, S.; Pedreira, M.E. Psychological distress and mental health trajectories during the COVID-19 pandemic in Argentina: A longitudinal study. Sci. Rep. 2022, 12, 5632. [Google Scholar] [CrossRef] [PubMed]
- Rosa, L.; Godwin, H.J.; Cortese, S.; Brandt, V. Predictors of longer-term depression trajectories during the COVID-19 pandemic: A longitudinal study in four UK cohorts. Evid. Based Ment. Health 2022, 25, e3. [Google Scholar] [CrossRef] [PubMed]
- Galea, S.; Brewin, C.R.; Gruber, M.; Jones, R.T.; King, D.W.; King, L.A.; McNally, R.J.; Ursano, R.J.; Petukhova, M.; Kessler, R.C. Exposure to Hurricane-Related Stressors and Mental Illness After Hurricane Katrina. Arch. Gen. Psychiatry 2007, 64, 1427. [Google Scholar] [CrossRef] [PubMed]
- Lowe, S.R.; McGrath, J.A.; Young, M.N.; Kwok, R.K.; Engel, L.S.; Galea, S.; Sandler, D.P. Cumulative Disaster Exposure and Mental and Physical Health Symptoms among a Large Sample of Gulf Coast Residents. J. Trauma. Stress 2019, 32, 196–205. [Google Scholar] [CrossRef]
- McLaughlin, K.A.; Rosen, M.L.; Kasparek, S.W.; Rodman, A.M. Stress-related psychopathology during the COVID-19 pandemic. Behav. Res. Ther. 2022, 154, 104121. [Google Scholar] [CrossRef]
- Godara, M.; Silveira, S.; Matthäus, H.; Singer, T. The Wither or Thrive Model of Resilience: An Integrative Framework of Dynamic Vulnerability and Resilience in the Face of Repeated Stressors During the COVID-19 Pandemic. Advers. Resil. Sci. 2022, 3, 261–282. [Google Scholar] [CrossRef]
- WHO Pandemic Fatigue. Reinvigorating the Public to Prevent COVID-19. Policy Framework for Supporting Pandemic Prevention and Management. 2020. Available online: www.apps.who.int/iris/handle/10665/335820 (accessed on 23 February 2023).
- McPherson, K.E.; McAloney-Kocaman, K.; McGlinchey, E.; Faeth, P.; Armour, C. Longitudinal analysis of the UK COVID-19 Psychological Wellbeing Study: Trajectories of anxiety, depression and COVID-19-related stress symptomology. Psychiatry Res. 2021, 304, 114138. [Google Scholar] [CrossRef] [PubMed]
- Taylor, S.; Rachor, G.S.; Asmundson, G.J.G. Who develops pandemic fatigue? Insights from Latent Class Analysis. PLoS ONE 2022, 17, e0276791. [Google Scholar] [CrossRef] [PubMed]
- Haktanir, A.; Can, N.; Seki, T.; Kurnaz, M.F.; Dilmaç, B. Do we experience pandemic fatigue? current state, predictors, and prevention. Curr. Psychol. 2021, 41, 7314–7325. [Google Scholar] [CrossRef] [PubMed]
- Bonanno, G.A. Loss, Trauma, and Human Resilience: Have We Underestimated the Human Capacity to Thrive After Extremely Aversive Events? Am. Psychol. 2004, 59, 20–28. [Google Scholar] [CrossRef]
- Galatzer-Levy, I.R.; Huang, S.H.; Bonanno, G.A. Trajectories of resilience and dysfunction following potential trauma: A review and statistical evaluation. Clin. Psychol. Rev. 2018, 63, 41–55. [Google Scholar] [CrossRef]
- Gloster, A.T.; Lamnisos, D.; Lubenko, J.; Presti, G.; Squatrito, V.; Constantinou, M.; Nicolaou, C.; Papacostas, S.; Aydın, G.; Chong, Y.Y.; et al. Impact of COVID-19 pandemic on mental health: An international study. PLoS ONE 2020, 15, e0244809. [Google Scholar] [CrossRef]
- Pieh, C.; Budimir, S.; Probst, T. The effect of age, gender, income, work, and physical activity on mental health during coronavirus disease (COVID-19) lockdown in Austria. J. Psychosom. Res. 2020, 136, 110186. [Google Scholar] [CrossRef]
- Oshio, A.; Taku, K.; Hirano, M.; Saeed, G. Resilience and Big Five personality traits: A meta-analysis. Pers. Individ. Dif. 2018, 127, 54–60. [Google Scholar] [CrossRef]
- Boldor, N.; Bar-Dayan, Y.; Rosenbloom, T.; Shemer, J.; Bar-Dayan, Y. Optimism of health care workers during a disaster: A review of the literature. Emerg. Health Threats J. 2012, 5, 7270. [Google Scholar] [CrossRef]
- Tolin, D.F.; Foa, E.B. Sex differences in trauma and posttraumatic stress disorder: A quantitative review of 25 years of research. Psychol. Trauma 2008, S1, 37–85. [Google Scholar] [CrossRef]
- Kawakami, N.; Abdulghani, E.A.; Alonso, J.; Bromet, E.J.; Bruffaerts, R.; Caldas-de-Almeida, J.M.; Chiu, W.T.; de Girolamo, G.; de Graaf, R.; Fayyad, J.; et al. Early-Life Mental Disorders and Adult Household Income in the World Mental Health Surveys. Biol. Psychiatry 2012, 72, 228–237. [Google Scholar] [CrossRef] [PubMed]
- Singer, T.; Koop, S.; Godara, M. Das CovSocial Projekt: Wie haben sich die Menschen in Berlin während der COVID-19 Pandemie gefühlt? Max-Planck-Gesellschaft: Berlin, Germany, 2021. [Google Scholar]
- Werner, E.E.; Smith, R.S. Journeys from Childhood to Midlife: Risk, Resilience, and Recovery; Cornell University Press: Ithaca, NY, USA, 2001. [Google Scholar]
- Friborg, O.; Hjemdal, O.; Martinussen, M.; Rosenvinge, J.H. Empirical Support for Resilience as More than the Counterpart and Absence of Vulnerability and Symptoms of Mental Disorder. J. Individ. Differ. 2009, 30, 138–151. [Google Scholar] [CrossRef]
- Cohen, S.; Kamarck, T.; Mermelstein, R. A Global Measure of Perceived Stress. J. Health Soc. Behav. 1983, 24, 385. [Google Scholar] [CrossRef] [PubMed]
- Löwe, B.; Kroenke, K.; Gräfe, K. Detecting and monitoring depression with a two-item questionnaire (PHQ-2). J. Psychosom. Res. 2005, 58, 163–171. [Google Scholar] [CrossRef] [PubMed]
- Löwe, B.; Wahl, I.; Rose, M.; Spitzer, C.; Glaesmer, H.; Wingenfeld, K.; Schneider, A.; Brähler, E. A 4-item measure of depression and anxiety: Validation and standardization of the Patient Health Questionnaire-4 (PHQ-4) in the general population. J. Affect. Disord. 2010, 122, 86–95. [Google Scholar] [CrossRef]
- Beierlein, C.; Kemper, C.J.; Kovaleva, A.; Rammstedt, B. Short Scale for Measuring General Self-efficacy Beliefs (ASKU). Kurzskala zur Erfassung allgemeiner Selbstwirksamkeitserwartungen (ASKU). Methoden Daten Anal. 2013, 7, 251–278. [Google Scholar]
- Silveira, S.J.; Hecht, M.; Adli, M.; Voelkle, M.; Singer, T. Exploring the Structure and Interrelations of Time-Stable Psychological Resilience, Psychological Vulnerability, and Social Cohesion. Front. Psychiatry 2022, 13, 4763. [Google Scholar] [CrossRef]
- R Core Team. R: A Language and Environment for Statistical Computing; R Foundation for Statistical Computing: Vienna, Austria, 2021; Available online: https://www.R-project.org/ (accessed on 23 February 2023).
- Van Buuren, S.; Groothuis-Oudshoorn, K. Mice: Multivariate Imputation by Chained Equations in R. J. Stat. Softw. 2011, 45, 1–67. [Google Scholar] [CrossRef]
- Rosseel, Y. Iavaan: An R Package for Structural Equation Modeling. J. Stat. Softw. 2012, 48, 1–36. [Google Scholar] [CrossRef]
- Mutheén, L.K.; Mutheén, B.O. Mplus User’s Guide, 8th ed.; Mutheén & Mutheén: Los Angeles, CA, USA, 2017. [Google Scholar]
- Zhang, Z. Multiple imputation with multivariate imputation by chained equation (MICE) package. Ann. Transl. Med. 2016, 4, 30. [Google Scholar]
- Muthén, B. Latent Variable Analysis: Growth Mixture Modeling and Related Techniques for Longitudinal Data. In The SAGE Handbook of Quantitative Methodology for the Social Sciences; SAGE Publications, Inc.: Thousand Oaks, CA, USA, 2004; pp. 346–369. [Google Scholar]
- Vermunt, J.K. Latent Class Modeling with Covariates: Two Improved Three-Step Approaches. Political Anal. 2010, 18, 450–469. [Google Scholar] [CrossRef]
- Nylund-Gibson, K.; Choi, A.Y. Ten frequently asked questions about latent class analysis. Transl. Issues Psychol. Sci. 2018, 4, 440–461. [Google Scholar] [CrossRef]
- Amt für Statistik. Statistischer Bericht—Einwohnerregisterstatistik; Amt für Statistik: Berlin, Germany, 2021. [Google Scholar]
- Wickrama, K.A.S.; Lee, T.K.; O’Neal, C.W.; Lorenz, F.O. Higher-Order Growth Curves and Mixture Modeling with Mplus; Routledge: New York, NY, USA, 2021. [Google Scholar]
- Weller, B.E.; Bowen, N.K.; Faubert, S.J. Latent Class Analysis: A Guide to Best Practice. J. Black Psychol. 2020, 46, 287–311. [Google Scholar] [CrossRef]
- Weber, M.; Schulze, L.; Bolzenkötter, T.; Niemeyer, H.; Renneberg, B. Mental Health and Loneliness in University Students During the COVID-19 Pandemic in Germany: A Longitudinal Study. Front. Psychiatry 2022, 13, 848645. [Google Scholar] [CrossRef] [PubMed]
- Pietrzak, R.H.; Tracy, M.; Galea, S.; Kilpatrick, D.G.; Ruggiero, K.J.; Hamblen, J.L.; Southwick, S.M.; Norris, F.H. Resilience in the Face of Disaster: Prevalence and Longitudinal Course of Mental Disorders following Hurricane Ike. PLoS ONE 2012, 7, e38964. [Google Scholar] [CrossRef] [PubMed]
- Schäfer, S.K.; Kunzler, A.M.; Kalisch, R.; Tüscher, O.; Lieb, K. Trajectories of resilience and mental distress to global major disruptions. Trends Cogn. Sci. 2022, 26, 1171–1189. [Google Scholar] [CrossRef]
- Ingram, R.E.; Luxton, D.D. Vulnerability-stress models. In Development of Psychopathology: A Vulnerability-Stress Perspective; Hankin, B.L., Abela, J.R.Z., Eds.; Sage Publications: Thousand Oaks, CA, USA, 2005; pp. 32–46. [Google Scholar]
- Groarke, J.M.; Berry, E.; Graham-Wisener, L.; McKenna-Plumley, P.E.; McGlinchey, E.; Armour, C. Loneliness in the UK during the COVID-19 pandemic: Cross-sectional results from the COVID-19 Psychological Wellbeing Study. PLoS ONE 2020, 15, e0239698. [Google Scholar] [CrossRef]
- Palgi, Y.; Shrira, A.; Ring, L.; Bodner, E.; Avidor, S.; Bergman, Y.; Cohen-Fridel, S.; Keisari, S.; Hoffman, Y. The loneliness pandemic: Loneliness and other concomitants of depression, anxiety and their comorbidity during the COVID-19 outbreak. J. Affect. Disord. 2020, 275, 109–111. [Google Scholar] [CrossRef]
- Ernst, M.; Niederer, D.; Werner, A.M.; Czaja, S.J.; Mikton, C.; Ong, A.D.; Rosen, T.; Brähler, E.; Beutel, M.E. Loneliness before and during the COVID-19 pandemic: A systematic review with meta-analysis. Am. Psychol. 2022, 77, 660–677. [Google Scholar] [CrossRef]
- Matos, M.; McEwan, K.; Kanovský, M.; Halamová, J.; Steindl, S.R.; Ferreira, N.; Linharelhos, M.; Rijo, D.; Asano, K.; Gregório, S.; et al. Fears of compassion magnify the harmful effects of threat of COVID-19 on mental health and social safeness across 21 countries. Clin. Psychol. Psychother. 2021, 28, 1317–1333. [Google Scholar] [CrossRef]
- Sheppes, G.; Suri, G.; Gross, J.J. Emotion Regulation and Psychopathology. Annu. Rev. Clin. Psychol. 2015, 11, 379–405. [Google Scholar] [CrossRef]
- Sanchez-Lopez, A. How Flexible are we in Regulating our Emotions? A Discussion on Current Conceptual Frameworks of Emotion Regulation Flexibility, Requirements for Future Research and Potential Practical Implications. Span. J. Psychol. 2021, 24, e31. [Google Scholar] [CrossRef] [PubMed]
- Buecker, S.; Mund, M.; Chwastek, S.; Sostmann, M.; Luhmann, M. Is loneliness in emerging adults increasing over time? A preregistered cross-temporal meta-analysis and systematic review. Psychol. Bull. 2021, 147, 787–805. [Google Scholar] [CrossRef] [PubMed]
- Gresenz, C.R.; Sturm, R.; Tang, L. Income and mental health: Unraveling community and individual level relationships. J. Ment. Health Policy Econ. 2001, 4, 197–204. [Google Scholar] [PubMed]
- Hodes, G.E.; Epperson, C.N. Sex Differences in Vulnerability and Resilience to Stress Across the Life Span. Biol. Psychiatry 2019, 86, 421–432. [Google Scholar] [CrossRef] [PubMed]
- Flentje, A.; Obedin-Maliver, J.; Lubensky, M.E.; Dastur, Z.; Neilands, T.; Lunn, M.R. Depression and Anxiety Changes Among Sexual and Gender Minority People Coinciding with Onset of COVID-19 Pandemic. J. Gen. Intern. Med. 2020, 35, 2788–2790. [Google Scholar] [CrossRef] [PubMed]
- Maffly-Kipp, J.; Eisenbeck, N.; Carreno, D.F.; Hicks, J. Mental health inequalities increase as a function of COVID-19 pandemic severity levels. Soc. Sci. Med. 2021, 285, 114275. [Google Scholar] [CrossRef] [PubMed]
- Zheng, J.; Morstead, T.; Sin, N.; Klaiber, P.; Umberson, D.; Kamble, S.; DeLongis, A. Psychological distress in North America during COVID-19: The role of pandemic-related stressors. Soc. Sci. Med. 2021, 270, 113687. [Google Scholar] [CrossRef]
- Wilson, J.M.; Lee, J.; Fitzgerald, H.N.; Oosterhoff, B.; Sevi, B.; Shook, N.J. Job Insecurity and Financial Concern During the COVID-19 Pandemic Are Associated With Worse Mental Health. J. Occup. Environ. Med. 2020, 62, 686–691. [Google Scholar] [CrossRef]
- Di Gessa, G.; Maddock, J.; Green, M.J.; Thompson, E.J.; McElroy, E.; Davies, H.L.; Mundy, J.; Stevenson, A.J.; Kwong, A.S.F.; Griffith, G.J.; et al. Pre-pandemic mental health and disruptions to healthcare, economic and housing outcomes during the COVID-19 pandemic: Evidence from 12 UK longitudinal studies. Br. J. Psychiatry 2022, 220, 21–30. [Google Scholar] [CrossRef]
- Gibson, B.; Schneider, J.; Talamonti, D.; Forshaw, M. The impact of inequality on mental health outcomes during the COVID-19 pandemic: A systematic review. Can. Psychol. 2021, 62, 101–126. [Google Scholar] [CrossRef]
- Veer, I.M.; Riepenhausen, A.; Zerban, M.; Wackerhagen, C.; Puhlmann, L.M.C.; Engen, H.; Köber, G.; Bögemann, S.A.; Weermeijer, J.; Uściłko, A.; et al. Psycho-social factors associated with mental resilience in the Corona lockdown. Transl. Psychiatry 2021, 11, 15. [Google Scholar] [CrossRef] [PubMed]
- Jacobi, F.; Höfler, M.; Siegert, J.; Mack, S.; Gerschler, A.; Scholl, L.; Busch, M.A.; Hapke, U.; Maske, U.; Seiffert, I.; et al. Twelve-month prevalence, comorbidity and correlates of mental disorders in Germany: The Mental Health Module of the German Health Interview and Examination Survey for Adults (DEGS1-MH). Int. J. Methods Psychiatr. Res. 2014, 23, 304–319. [Google Scholar] [CrossRef] [PubMed]
- Fiorenzato, E.; Zabberoni, S.; Costa, A.; Cona, G. Cognitive and mental health changes and their vulnerability factors related to COVID-19 lockdown in Italy. PLoS ONE 2021, 16, e0246204. [Google Scholar] [CrossRef]
- Hawke, L.D.; Szatmari, P.; Cleverley, K.; Courtney, D.; Cheung, A.; Voineskos, A.N.; Henderson, J. Youth in a pandemic: A longitudinal examination of youth mental health and substance use concerns during COVID-19. BMJ Open 2021, 11, e049209. [Google Scholar] [CrossRef]
- Wynn, J.K.; McCleery, A.; Novacek, D.M.; Reavis, E.A.; Senturk, D.; Sugar, C.A.; Tsai, J.; Green, M.F. The impact of the COVID-19 pandemic on mental health and functional outcomes in Veterans with psychosis or recent homelessness: A 15-month longitudinal study. PLoS ONE 2022, 17, e0273579. [Google Scholar] [CrossRef]
- Bas-Sarmiento, P.; Saucedo-Moreno, M.J.; Fernández-Gutiérrez, M.; Poza-Méndez, M. Mental Health in Immigrants Versus Native Population: A Systematic Review of the Literature. Arch. Psychiatr. Nurs. 2017, 31, 111–121. [Google Scholar] [CrossRef]
- Will, A.K. The German statistical category “migration background”: Historical roots, revisions and shortcomings. Ethnicities 2019, 19, 535–557. [Google Scholar] [CrossRef]
- Newnham, E.A.; Mergelsberg, E.L.P.; Chen, Y.; Kim, Y.; Gibbs, L.; Dzidic, P.L.; DaSilva, M.I.; Chan, E.Y.Y.; Shimomura, K.; Narita, Z.; et al. Long term mental health trajectories after disasters and pandemics: A multilingual systematic review of prevalence, risk and protective factors. Clin. Psychol. Rev. 2022, 97, 102203. [Google Scholar] [CrossRef]


| Mean (SD) | Count (%) | |
|---|---|---|
| Age | 44 (12.7) | |
| Female | 2293 (65.1) | |
| Marital status | ||
| Single | 1709 (48.5) | |
| Married | 1302 (37) | |
| Divorced | 293 (8.3) | |
| Other | 218 (6.2) | |
| Years of education | 17 (3.9) | |
| Average monthly net household income in EUR | 3227 (1210) | |
| Migration background | 384 (10.9) | |
| Working situation | ||
| Full-time | 1937 (55) | |
| Part-time | 752 (21.4) | |
| Retired | 116 (3.3) | |
| Unemployed | 93 (2.6) | |
| Other | 624 (17.7) | |
| Working hours per week; mean | 35.7 (11) | |
| Diagnosed mental disorder in lifetime | 876 (24.9) | |
| Depressive disorder | 652 (18.4) | |
| Anxiety disorder | 297 (8.4) | |
| Trauma-related disorder | 162 (4.6) | |
| COVID-19 | ||
| Biological risk group | 836 (23.8) | |
| Job with heightened risk of infection | 865 (25.2) |
| Number of Classes | AIC | BIC | Sample Size-Adjusted BIC | Log Likelihood | Entropy | Class 1 (N) | Class 2 (N) | Class 3 (N) | Class 4 (N) | Class 5 (N) |
|---|---|---|---|---|---|---|---|---|---|---|
| 1 | 40,033.87 | 40,181.87 | 40,105.61 | −19,802.49 | 100% | |||||
| 2 | 36,392.66 | 36,657.84 | 36,521.20 | −18,153.33 | 0.69 | 44.5% | 55.5% | |||
| 3 | 35,832.02 | 36,214.36 | 36,017.35 | −17,854.01 | 0.61 | 44.6% | 35.5% | 19.9% | ||
| 4 | 35,476.18 | 35,975.69 | 35,718.31 | −17,657.09 | 0.644 | 13.0% | 15.93% | 46.11% | 24.96% | |
| 5 | 35,307.75 | 35,924.43 | 35,606.68 | −17,553.87 | 0.66 | 10.2% | 14.7% | 42.9% | 5.5% | 25.6% |
| Most Likely Latent Class | |||||
|---|---|---|---|---|---|
| 1 | 2 | 3 | 4 | ||
| Latent Class | 1 | 0.830 | 0.088 | 0.000 | 0.001 |
| 2 | 0.166 | 0.771 | 0.115 | 0.101 | |
| 3 | 0.000 | 0.055 | 0.777 | 0.059 | |
| 4 | 0.003 | 0.086 | 0.107 | 0.839 | |
| Class | ||||
|---|---|---|---|---|
| Most Vulnerable | More Vulnerable | More Resilient | Most Resilient | |
| Means | ||||
| Res-Vul T1 | 1.017 (<0.001) | 0.173 (0.233) | 0.013 (0.861) | −0.720 (<0.001) |
| LCS1 | 1.346 (<0.001) | 0.898 (<0.001) | 0.618 (<0.001) | 0.248 (<0.001) |
| LCS2 | −0.640 (<0.001) | −0.585 (<0.001) | −0.545 (<0.001) | −0.324 (<0.001) |
| Intercept | 2.188 (<0.001) | 1.065 (<0.001) | 0.517 (<0.001) | −0.474 (<0.001) |
| Slope | 0.044 (<0.001) | 0.073 (<0.001) | 0.061 (<0.001) | 0.040 (<0.001) |
| Variances | ||||
| Res-Vul T1 | 1.455 (<0.001) | 0.922 (<0.001) | 0.530 (<0.001) | 0.281 (<0.001) |
| LCS1 | 1.653 (<0.001) | 1.387 (<0.001) | 0.633 (<0.001) | 0.174 (<0.001) |
| LCS2 | 0.862 (0.001) | 1.026 (<0.001) | 0.338 (<0.001) | 0.079 (<0.001) |
| Intercept | 0.525 (<0.001) | 0.820 (<0.001) | 0.582 (<0.001) | 0.477 (<0.001) |
| Slope | 0.001 (0.558) | 0.029 (<0.001) | 0.005 (<0.001) | 0.003 (<0.001) |
| Covariances | ||||
| LCS1 with Res-Vul T1 | −1.157 (<0.001) | −0.597 (0.042) | −0.263 (<0.001) | 0.030 (<0.001) |
| LCS1 with LCS2 | −0.396 (0.004) | −0.600 (<0.001) | −0.269 (<0.001) | −0.070 (<0.001) |
| LCS2 with Res-Vul T1 | 0.058 (0.428) | 0.050 (0.372) | 0.062 (0.001) | −0.009 (0.263) |
| Slope with Intercept | −0.001 (0.826) | −0.042 (0.010) | −0.007 (0.022) | 0.001 (0.697) |
| LCS1 Comparison | LCS2 Comparison | Slope Comparison | |
|---|---|---|---|
| Class 1—Class 2 | 2.245 (0.134) | 0.165 (0.685) | 0.129 (0.720) |
| Class 1—Class 3 | 15.420 (<0.001) | 1.029 (0.310) | 2.817 (0.093) |
| Class 1—Class 4 | 27.565 (<0.001) | 11.471 (<0.001) | 0.129 (0.720) |
| Class 2—Class 3 | 3.833 (0.050) | 0.309 (0.579) | 1.045 (0.307) |
| Class 2—Class 4 | 34.214 (<0.001) | 17.087 (<0.001) | 8.815 (0.003) |
| Class 3—Class 4 | 48.338 (<0.001) | 52.515 (<0.001) | 6.404 (0.011) |
| Predictor | Most Vulnerable Multinomial Odds Ratio (95% CI) | More Vulnerable Multinomial Odds Ratio (95% CI) | More Resilient Multinomial Odds Ratio (95% CI) |
|---|---|---|---|
| Trait Resilience-Vulnerability | 884.19 (323.11, 2419.55) *** | 23.29 (15.30, 35.44) *** | 18.71 (13.18, 26.58) *** |
| Trait Adaptive Capacities | 1.27 (0.65, 2.51) | 2.37 (1.63, 3.45) ** | 1.62 (1.19, 2.20) * |
| Trait Social Belonging | 0.83 (0.49, 1.39) | 0.66 (0.51, 0.87) * | 0.97 (0.76, 1.23) |
| Trait Social Capacities | 1.11 (0.61, 2.01) | 0.95 (0.67, 1.32) | 0.83 (0.63, 1.08) |
| Age | 0.96 (0.93, 0.99) * | 0.98 (0.96, 1.001) | 0.98 (0.96, 0.99) * |
| Female Sex | 3.26 (1.22, 8.75) *** | 3.97 (2.45, 6.43) *** | 2.79 (1.96, 3.99) *** |
| History of Psychiatric Diagnosis | 2.12 (0.79, 5.62) | 2.14 (1.21, 3.79) ** | 1.43 (0.84, 2.44) |
| Married/Cohabiting/Partnership | 1.15 (0.85, 1.54) | 1.12 (0.93, 1.34) | 1.10 (0.95, 1.28) |
| Lower than average household income | 0.98 (0.91, 1.05) | 0.95 (0.92, 0.99) * | 0.96 (0.93, 0.99) * |
| No full-time employment | 0.97 (0.88, 1.08) | 0.96 (0.91, 1.01) | 0.96 (0.92, 1.01) |
| Years of Education | 0.99 (0.86, 1.14) | 1.05 (0.99, 1.11) | 1.00 (0.96, 1.04) |
| Migration background | 3.23 (0.85, 12.28) | 1.61 (0.85, 3.06) | 1.47 (0.82, 2.64) |
Disclaimer/Publisher’s Note: The statements, opinions and data contained in all publications are solely those of the individual author(s) and contributor(s) and not of MDPI and/or the editor(s). MDPI and/or the editor(s) disclaim responsibility for any injury to people or property resulting from any ideas, methods, instructions or products referred to in the content. |
© 2023 by the authors. Licensee MDPI, Basel, Switzerland. This article is an open access article distributed under the terms and conditions of the Creative Commons Attribution (CC BY) license (https://creativecommons.org/licenses/by/4.0/).
Share and Cite
Godara, M.; Rademacher, J.; Hecht, M.; Silveira, S.; Voelkle, M.C.; Singer, T. Heterogeneous Mental Health Responses to the COVID-19 Pandemic in Germany: An Examination of Long-Term Trajectories, Risk Factors, and Vulnerable Groups. Healthcare 2023, 11, 1305. https://doi.org/10.3390/healthcare11091305
Godara M, Rademacher J, Hecht M, Silveira S, Voelkle MC, Singer T. Heterogeneous Mental Health Responses to the COVID-19 Pandemic in Germany: An Examination of Long-Term Trajectories, Risk Factors, and Vulnerable Groups. Healthcare. 2023; 11(9):1305. https://doi.org/10.3390/healthcare11091305
Chicago/Turabian StyleGodara, Malvika, Jessie Rademacher, Martin Hecht, Sarita Silveira, Manuel C. Voelkle, and Tania Singer. 2023. "Heterogeneous Mental Health Responses to the COVID-19 Pandemic in Germany: An Examination of Long-Term Trajectories, Risk Factors, and Vulnerable Groups" Healthcare 11, no. 9: 1305. https://doi.org/10.3390/healthcare11091305