
Effects of Velocity-Based versus Percentage-Based Resistance Training on Explosive Neuromuscular Adaptations and Anaerobic Power in Sport-College Female Basketball Players

 ,
,
Abstract
:1. Introduction
2. Materials and Methods
2.1. Participants
2.2. Experimental Design
2.3. Testing Procedure
2.4. Measurements
2.4.1. Anaerobic Power Performance
2.4.2. Jump and Sprint Testing
2.4.3. Body Composition
2.4.4. 1-RM Assessment
2.4.5. LVP Assessment
2.5. Resistance Training Program
2.6. Statistical Analysis
3. Results
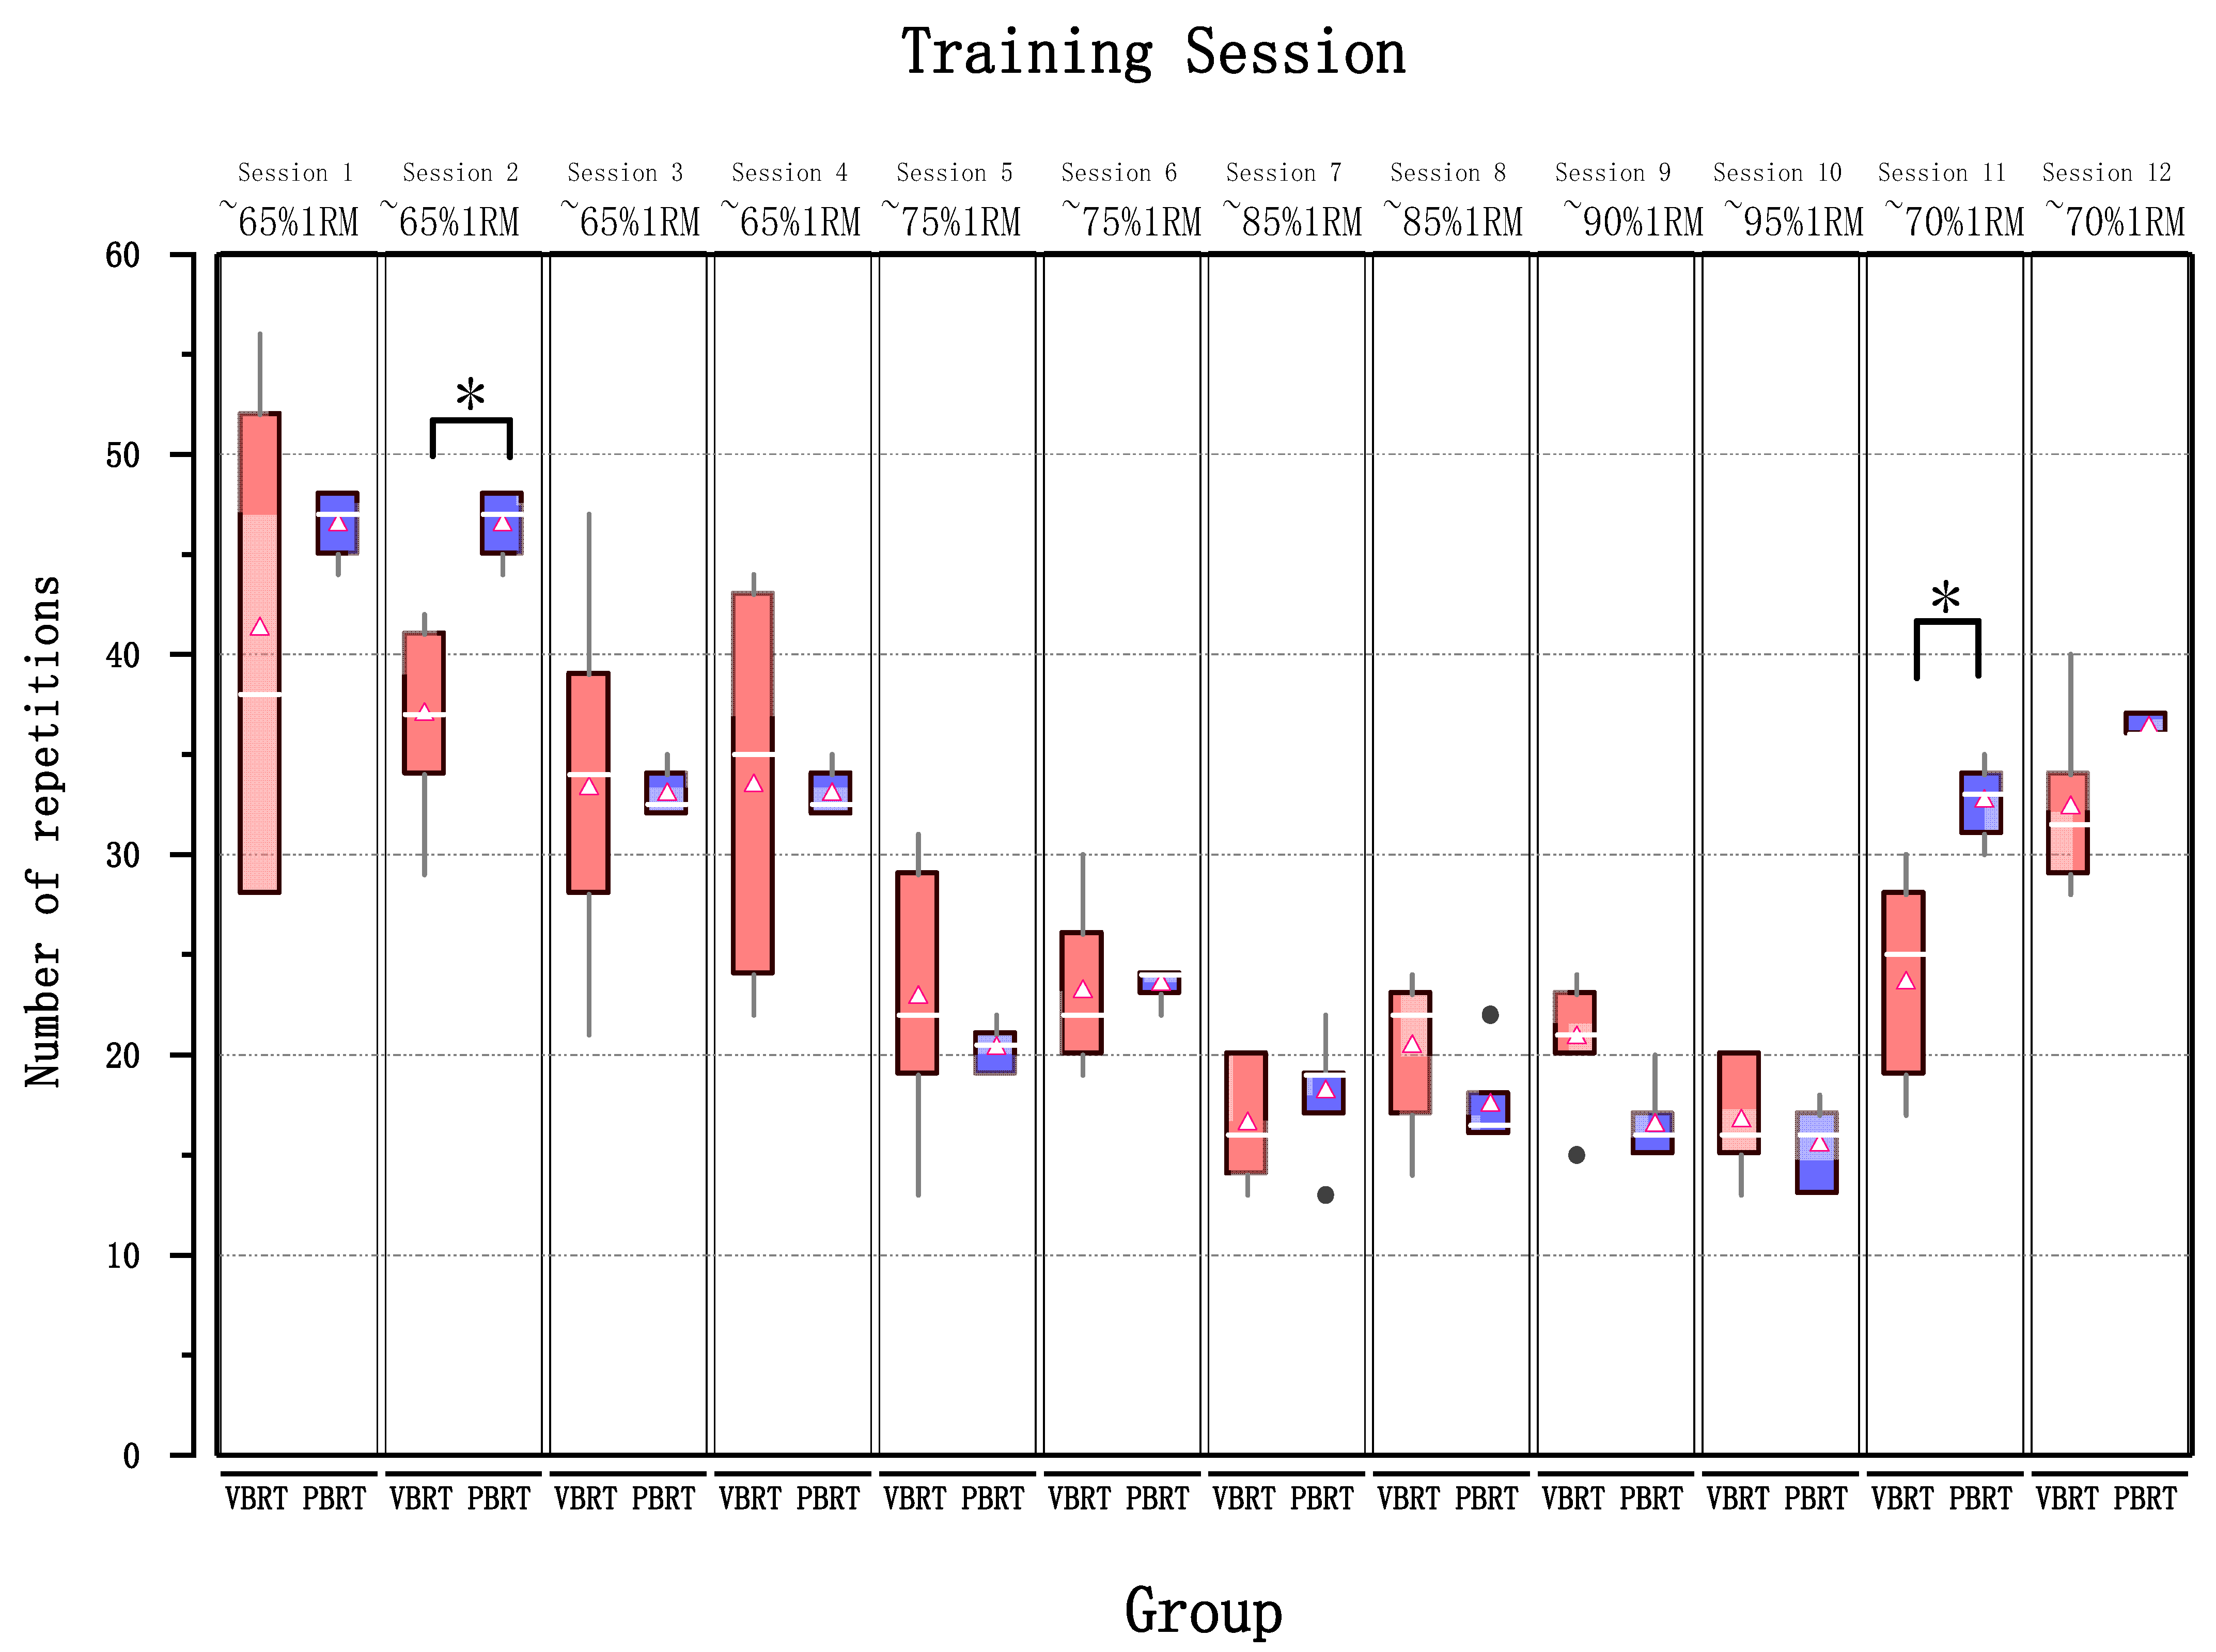
3.1. Training Loads
3.2. Body Composition
3.3. WAnT Performance
3.4. Jump and Sprint Performance
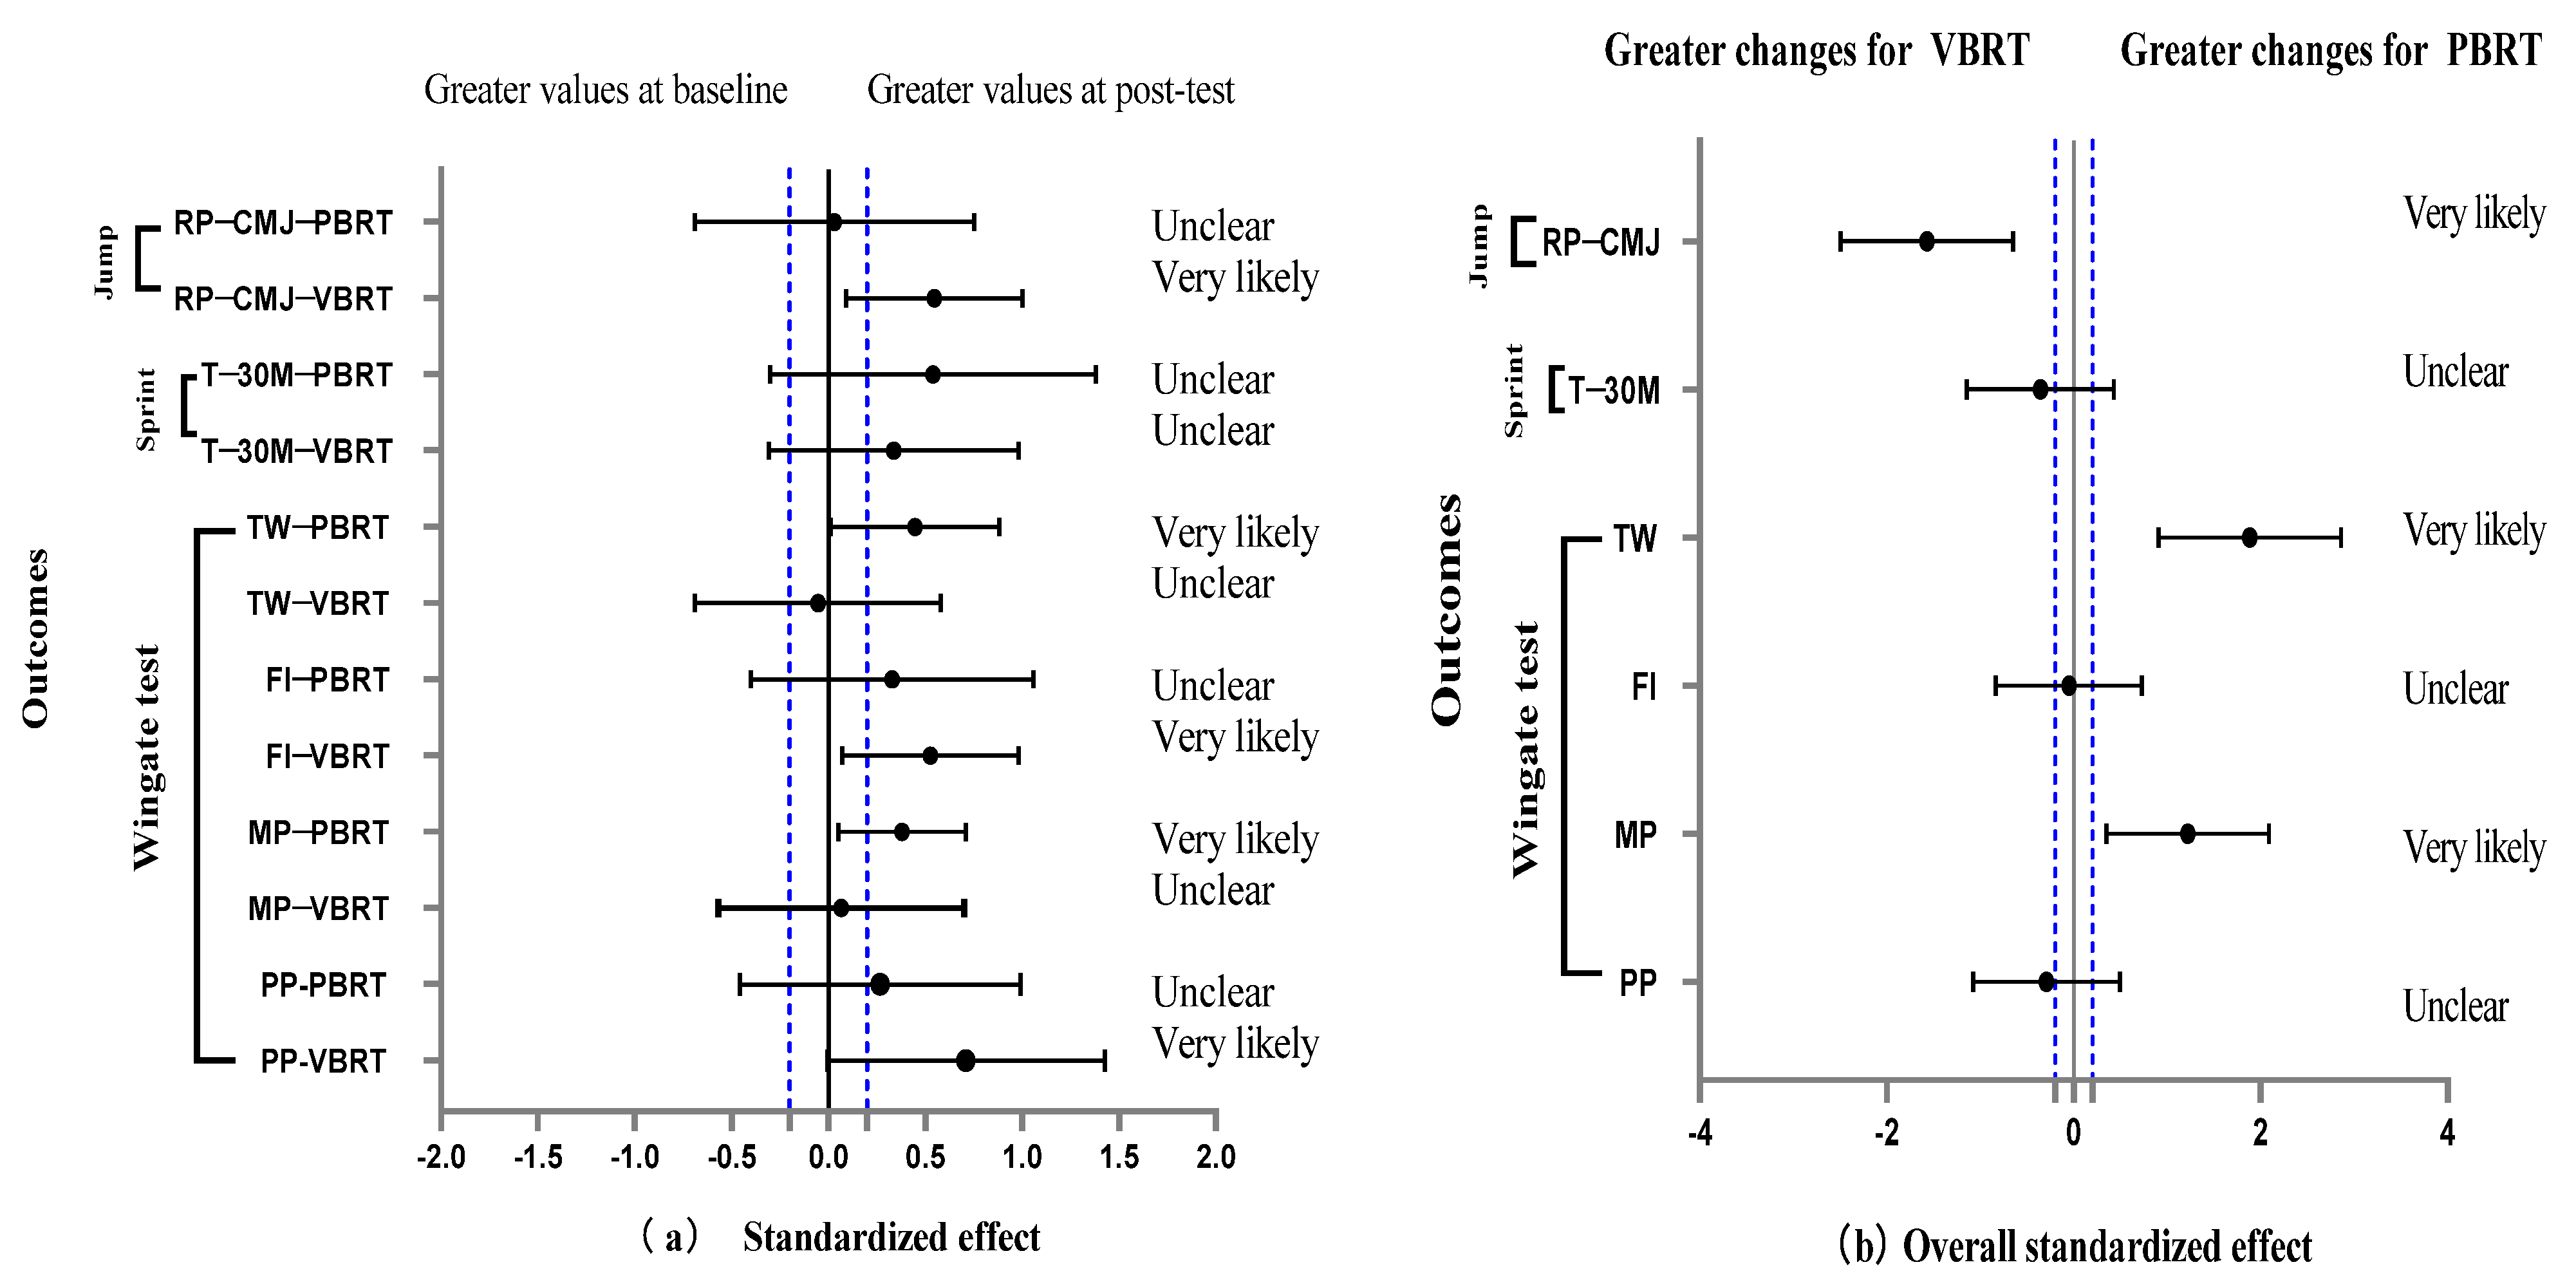
3.5. Training Effect
4. Discussion
5. Conclusions
Author Contributions
Funding
Institutional Review Board Statement
Informed Consent Statement
Data Availability Statement
Acknowledgments
Conflicts of Interest
References
- Dorrell, H.F.; Smith, M.F.; Gee, T.I. Comparison of Velocity-Based and Traditional Percentage-Based Loading Methods on Maximal Strength and Power Adaptations. J. Strength Cond. Res. 2020, 34, 46–53. [Google Scholar] [CrossRef] [PubMed]
- Weakley, J.; Mann, B.; Banyard, H.; Mclaren, S.; Garcia-Ramos, A. Velocity-Based Training: From Theory to Application. Strength Cond. J. 2020, 43, 31–49. [Google Scholar] [CrossRef]
- Zhang, M.; Tan, Q.; Sun, J.; Ding, S.; Yang, Q.; Zhang, Z.; Lu, J.; Liang, X.; Li, D. Comparison of Velocity and Percentage-based Training on Maximal Strength: Meta-analysis. Int. J. Sport. Med. 2022, 43, 981–995. [Google Scholar] [CrossRef] [PubMed]
- Nevin, J. Autoregulated Resistance Training: Does Velocity-Based Training Represent the Future? Strength Cond. J. 2019, 41, 34–39. [Google Scholar] [CrossRef] [Green Version]
- Hickmott, L.M.; Chilibeck, P.D.; Shaw, K.A.; Butcher, S.J. The Effect of Load and Volume Autoregulation on Muscular Strength and Hypertrophy: A Systematic Review and Meta-Analysis. Sport. Med.-Open 2022, 8, 1–35. [Google Scholar] [CrossRef]
- González-Badillo, J.J.; Marques, M.C.; Sánchez-Medina, L. The importance of movement velocity as a measure to control resistance training intensity. J. Hum. Kinet. 2011, 29, 15–19. [Google Scholar] [CrossRef]
- González-Badillo, J.J.; Sánchez-Medina, L. Movement velocity as a measure of loading intensity in resistance training. Int. J. Sports Med. 2010, 31, 347–352. [Google Scholar] [CrossRef]
- Montalvo-Perez, A.; Alejo, L.B.; Valenzuela, P.L.; Gil-Cabrera, J.; Talavera, E.; Luia, A.; Barranco-Gil, D. Traditional Versus Velocity-Based Resistance Training in Competitive Female Cyclists: A Randomized Controlled Trial. Front. Physiol. 2021, 12, 586113. [Google Scholar] [CrossRef]
- Banyard, H.G.; Tufano, J.J.; Weakley, J.J.S.; Wu, S.; Jukic, I.; Nosaka, K. Superior Changes in Jump, Sprint, and Change-of-Direction Performance but Not Maximal Strength Following 6 Weeks of Velocity-Based Training Compared With 1-Repetition-Maximum Percentage-Based Training. Int. J. Sports Physiol. Perform. 2020, 16, 232–242. [Google Scholar] [CrossRef]
- Zhang, M.; Liang, X.; Huang, W.; Ding, S.; Li, G.; Cui, X.; Li, C.; Zhou, Y.; Sun, J.; Li, D. The Effects of Velocity-based Versus Percentage-based Resistance Training on Athletic Performances in Sport-Collegiate Female Basketball Players. Front. Physiol. 2023, 13, 2739. [Google Scholar] [CrossRef]
- Orange, S.T.; Metcalfe, J.W.; Robinson, A.; Applegarth, M.J.; Liefeith, A. Effects of In-Season Velocity- Versus Percentage-Based Training in Academy Rugby League Players. Int. J. Sports Physiol. Perform. 2020, 15, 554–561. [Google Scholar] [CrossRef]
- Ziv, G.; Lidor, R. Physical attributes, physiological characteristics, on-court performances and nutritional strategies of female and male basketball players. Sports Med. 2009, 39, 547–568. [Google Scholar] [CrossRef] [PubMed]
- Apostolidis, N.; Nassis, G.; Bolatoglou, T.; Geladas, N. Physiological and technical characteristics of elite young basketball players. J. Sports Med. Phys. Fit. 2004, 44, 157–163. [Google Scholar]
- Hoare, D.G. Predicting success in junior elite basketball players–the contribution of anthropometic and physiological attributes. J. Sci. Med. Sport 2000, 3, 391–405. [Google Scholar] [CrossRef] [PubMed]
- Campa, F.; Toselli, S.; Mazzilli, M.; Gobbo, L.A.; Coratella, G. Assessment of body composition in athletes: A narrative review of available methods with special reference to quantitative and qualitative bioimpedance analysis. Nutrients 2021, 13, 1620. [Google Scholar] [CrossRef] [PubMed]
- Hopkins, W.G.; Marshall, S.W.; Batterham, A.M.; Hanin, J. Progressive statistics for studies in sports medicine and exercise science. Med. Sci. Sports Exerc. 2009, 41, 3–13. [Google Scholar] [CrossRef] [Green Version]
- Hopkins, W.G. Spreadsheets for analysis of controlled trials, with adjustment for a subject characteristic. Sport Sci. 2006, 10, 46–50. [Google Scholar]
- Pareja-Blanco, F.; Rodriguez-Rosell, D.; Sanchez-Medina, L.; Sanchis-Moysi, J.; Dorado, C.; Mora-Custodio, R.; Yanez-Garcia, J.M.; Morales-Alamo, D.; Perez-Suarez, I.; Calbet, J.A.L.; et al. Effects of velocity loss during resistance training on athletic performance, strength gains and muscle adaptations. Scand. J. Med. Sci. Sports 2017, 27, 724–735. [Google Scholar] [CrossRef] [Green Version]
- Sanchez-Medina, L.; González-Badillo, J.J. Velocity loss as an indicator of neuromuscular fatigue during resistance training. Med. Sci. Sports Exerc. 2011, 43, 1725–1734. [Google Scholar]
- Enoka, R.M.; Duchateau, J. Muscle fatigue: What, why and how it influences muscle function. J. Physiol. 2008, 586, 11–23. [Google Scholar]
- Ortega, J.A.F.; Reyes, Y.G.D.l.; Peña, F.R.G. Effects of strength training based on velocity versus traditional training on muscle mass, neuromuscular activation, and indicators of maximal power and strength in girls soccer players. Apunt. Sports Med. 2020, 55, 53–61. [Google Scholar] [CrossRef]
- Rønnestad, B.R.; Hansen, J.; Hollan, I.; Ellefsen, S. Strength training improves performance and pedaling characteristics in elite cyclists. Scand. J. Med. Sci. Sports 2015, 25, e89–e98. [Google Scholar] [CrossRef] [PubMed]
- Pallares, J.G.; Cava, A.M.; Courel-Ibanez, J.; Gonzalez-Badillo, J.J.; Moran-Navarro, R. Full squat produces greater neuromuscular and functional adaptations and lower pain than partial squats after prolonged resistance training. Eur. J. Sport Sci. 2020, 20, 115–124. [Google Scholar] [CrossRef] [PubMed]
- Izquierdo, M.; Ibanez, J.; Hakkinen, K.; Kraemer, W.J.; Ruesta, M.; Gorostiaga, E.M. Maximal strength and power, muscle mass, endurance and serum hormones in weightlifters and road cyclists. J. Sports Sci. 2004, 22, 465–478. [Google Scholar] [CrossRef]
- Wilmore, J.H.; Costill, D.L.; Gleim, G.W. Physiology of sport and exercise. Med. Sci. Sports Exerc. 1995, 27, 792. [Google Scholar] [CrossRef] [Green Version]
- Pareja-Blanco, F.; Alcazar, J.; Cornejo-Daza, P.J.; Sanchez-Valdepenas, J.; Rodriguez-Lopez, C.; Hidalgo-de Mora, J.; Sanchez-Moreno, M.; Bachero-Mena, B.; Alegre, L.M.; Ortega-Becerra, M. Effects of velocity loss in the bench press exercise on strength gains, neuromuscular adaptations, and muscle hypertrophy. Scand. J. Med. Sci. Sports 2020, 30, 2154–2166. [Google Scholar] [CrossRef]
- Lahti, J.; Jimenez-Reyes, P.; Cross, M.R.; Samozino, P.; Chassaing, P.; Simond-Cote, B.; Ahtiainen, J.; Morin, J.B. Individual Sprint Force-Velocity Profile Adaptations to In-Season Assisted and Resisted Velocity-Based Training in Professional Rugby. Sports 2020, 8, 74. [Google Scholar] [CrossRef]
- Randell, A.D.; Cronin, J.B.; Keogh, J.W.; Gill, N.D.; Pedersen, M.C. Effect of instantaneous performance feedback during 6 weeks of velocity-based resistance training on sport-specific performance tests. J. Strength Cond. Res. 2011, 25, 87–93. [Google Scholar] [CrossRef]
- Gantois, P.; Nakamura, F.; Alcazar, J.; Fortes, L.; Pareja-Blanco, F.; Fonseca, F. The effects of different intra-set velocity loss thresholds on lower-limb adaptations to resistance training in young adults: A systematic review and meta-analysis. SportRXiv 2021. [Google Scholar] [CrossRef]


| Characteristic | VBRT | PBRT | p-Value | SMD |
|---|---|---|---|---|
| Age (y) * | 22.6 ± 1.6 | 22.0 ± 2.0 | 0.49 | 0.32 |
| Training years (y) * | 7.8 ± 3.4 | 8.2 ± 2.6 | 0.85 | 0.1 |
| Height (cm) * | 169.8 ± 6.0 | 169.4 ± 8.1 | 0.9 | 0.06 |
| Body mass (kg) * | 60.0 ± 4.8 | 61.0 ± 7.7 | 0.92 | 0.04 |
| Fat mass (kg) * | 21.8 ± 6.1 | 21.5 ± 4.6 | 0.92 | 0.05 |
| Muscle mass (kg) * | 43.1 ± 3.1 | 45.1 ± 4.6 | 0.3 | 0.49 |
| BMI * | 21.7 ± 1.9 | 21.4 ± 2.1 | 0.78 | 0.13 |
| Fat Free Mass (FFM) * | 45.9 ± 3.3 | 46.6 ± 4.1 | 0.7 | 0.04 |
| FMS test ~ | 16 (13–16) | 15 (13–16) | 0.39 | 0.39 |
| The deep squat ~ | 2 (2–3) | 2 (2–3) | 1 | 0 |
| Back squat 1-RM (kg) * | 81.0 ± 12.4 | 85.9 ± 6.9 | 0.33 | −0.45 |
| R-SQ 1RM * | 1.3 ± 0.2 | 1.4 ± 0.2 | 0.34 | −0.45 |
| Total work (J) * | 12,492.2 ± 1294.4 | 12,262.3 ± 1709.1 | 0.75 | 0.15 |
| Outcome | VBRT (n = 10) | SMD (95%CI) | PBRT (n = 8) | SMD(95%CI) | RM-ANOVA | |||
|---|---|---|---|---|---|---|---|---|
| Baseline | Post-Intervention | Baseline | Post-Intervention | Time | Group × Time | |||
| BM (kg) | 60.0 ± 4.2 | 59.6 ± 5.0 | −0.08 (−0.22, 0.03) | 61.0 ± 7.7 | 61.2 ± 7.8 | −0.02 (−0.07, 0.11) | 0.636 | 0.305 |
| FFM (kg) | 45.9 ± 3.3 | 46.5 ± 4.0 | 0.15 (−0.22, 0.56) | 46.6 ± 4.1 | 46.5 ± 4.2 | −0.03 (−0.17, 0.11) | 0.557 | 0.391 |
| BMI (kg/m2) | 21.7 ± 1.9 | 21.5 ± 1.9 | −0.1 (−0.24, 0.02) | 21.4 ± 2.1 | 21.4 ± 2.0 | −0.01 (−0.12, 0.09) | 0.189 | 0.308 |
| MM (kg) | 43.1 ± 3.1 | 43.1 ± 3.6 | 0 (−0.20, 0.20) | 45.1 ± 4.6 | 44.8 ± 4.7 | −0.05 (−0.14, 0.04) | 0.609 | 0.609 |
| HC (cm) | 93.3 ± 2.5 | 93.1 ± 3.0 | −0.08 (−0.24, 0.06) | 92.8 ± 4.1 | 92.6 ± 4.1 | −0.04 (−0.14, 0.03) | 0.174 | 0.887 |
| LLC (cm) | 50.2 ± 1.3 | 50.0 ± 1.5 | −0.17 (−0.48, 0.1) | 50.4 ± 3.2 | 50.4 ± 3.1 | −0.02 (−0.11, 0.07) | 0.256 | 0.443 |
| RLC (cm) | 50.3 ± 1.4 | 50 ± 1.5 | −0.2(−0.55, 0.09) | 50.7 ± 3.3 | 50.5 ± 3.2 | −0.04 (−0.14, 0.04) | 0.116 | 0.571 |
| Outcome | VBRT | SMD (95%CI) | Inference | PBRT | SMD (95%CI) | Inference | RM-ANOVA | |||
|---|---|---|---|---|---|---|---|---|---|---|
| Baseline | Post-Intervention | Baseline | Post-Intervention | Time | Group × Time | |||||
| 30-m sprint (s) | 4.78 ± 0.2 | 4.71 ± 0.2 | −0.46 (−0.87, −0.16) | 71/28/1 | 4.8 ± 0.1 | 4.71 ± 0.2 | −0.2 (−1.35, 0.87) | 55/20/25 | 0.053 | 0.197 |
| Unclear | Unclear | |||||||||
| RP-CMJ (W/kg) | 45.7 ± 5.2 | 48.7 ± 5.3 ** | 0.55 (0.25, 0.99) | 98/2/0 | 47.3 ± 3.5 | 47.4 ± 2.8 | 0.03 (−0.43, 0.51) | 22/62/16 | 0.012 | 0.018 |
| Very Likely | Unclear | |||||||||
| T-PP (ms) | 2976.5 ± 853.7 | 2932.5 ± 2817.7 | −0.03 (−0.77, 0.7) | 54/35/11 | 2416.3 ± 995.4 | 2478.8.2 ± 1367 | 0.05 (−0.67, 0.55) | 62/25/14 | 0.639 | 0.568 |
| Unclear | Unclear | |||||||||
| V-max (m/s) | 147.8 ± 13.1 | 160.5 ± 13.0 *** | 0.94 (0.54, 1.37) | 99.9/0.1/0 | 145 ± 17.8 | 154.2 ± 14.4 | 0.54 (−0.06, 1.31) | 87/11/2 | 0.001 | 0.501 |
| Almost | Possibly | |||||||||
| TW (J) | 12,492 ± 1294 | 12,420 ± 1318 | 0.05 (−0.34, 0.22) | 4/81/15 | 12,262 ± 1709 | 12,998 ± 1388 ** | 0.45 (0.25, 0.80) | 96.5/3.4/0.0 | 0.018 | 0.006 |
| Unclear | Very Likely | |||||||||
| PP [W] | 572.7 ± 43.9 | 607.4 ± 54.0 ** | 0.68 (0.31, 1.21) | 99/1/0 | 592.1 ± 87.4 | 615.3 ± 76.5 | 0.27 (−0.11, 0.74) | 63.3/34.7/2.0 | 0.001 | 0.524 |
| Very Likely | Unclear | |||||||||
| RPP [W/kg] | 9.2 ± 1.0 | 9.8 ± 1.3 * | 0.5 (0.13, 1.31) | 96/4/0 | 9.7 ± 0.8 | 10.2 ± 0.8 | 0.65 (−0.03, 1.58) | 83.7/13.2/3.1 | 0.006 | 0.672 |
| Very Likely | Possibly | |||||||||
| MP [W] | 432.8 ± 48.3 | 436.3 ± 51.4 | 0.07 (−0.16, 0.31) | 15/83/2 | 427.8 ± 63.1 | 451.8 ± 55.5 ** | 0.38 (0.23, 0.66) | 97.4/2.6/0.0 | 0.002 | 0.016 |
| Unclear | Very Likely | |||||||||
| RMP [W/kg] | 7.1 ± 0.7 | 7.2 ± 0.9 | 0.16 (−0.09, 0.46) | 49/49/2 | 7.0 ± 0.6 | 7.4 ± 0.5 *** | 0.7 (0.41, 1.22) | 99.7/0.3/0.0 | 0.002 | 0.079 |
| Unclear | Almost | |||||||||
| PD [W] | 300.8 ± 47.0 | 331.0 ± 62.0 ** | 0.53 (0.26, 0.93) | 98/2/0 | 351.6 ± 87.9 | 379.4 ± 69.6 | 0.33 (−0.28, 1.07) | 65.1/29.4/5.5 | 0.022 | 0.916 |
| Very Likely | Unclear | |||||||||
| PD [W/kg] | 4.9 ± 0.9 | 5.5 ± 1.1 ** | 0.5 (0.26, 0.88) | 99/1/0 | 5.6 ± 0.9 | 6.1 ± 1.0 | 0.59 (−0.26, 1.49) | 80.5/14.1/5.4 | 0.008 | 0.981 |
| Very Likely | Possibly | |||||||||
| PD [W/s] | 10 ± 1.6 | 11 ± 2.1 ** | 0.53 (0.26, 0.93) | 98/2/0 | 11.7 ± 2.9 | 12.6 ± 2.3 | 0.33 (−0.28, 1.07) | 73.9/17.7/8.5 | 0.022 | 0.916 |
| Very Likely | Possibly | |||||||||
| PD [%] | 53.3 ± 5.3 | 55.7 ± 5.6 | 0.41 (−0.11, 1.05) | 80/18/2 | 56.8 ± 7.2 | 60.5 ± 6.4 | 0.51 (−0.47, 1.7) | 73.9/17.7/8.5 | 0.083 | 0.679 |
| Possibly | Possibly | |||||||||
Disclaimer/Publisher’s Note: The statements, opinions and data contained in all publications are solely those of the individual author(s) and contributor(s) and not of MDPI and/or the editor(s). MDPI and/or the editor(s) disclaim responsibility for any injury to people or property resulting from any ideas, methods, instructions or products referred to in the content. |
© 2023 by the authors. Licensee MDPI, Basel, Switzerland. This article is an open access article distributed under the terms and conditions of the Creative Commons Attribution (CC BY) license (https://creativecommons.org/licenses/by/4.0/).
Share and Cite
Zhang, M.; Li, D.; He, J.; Liang, X.; Li, D.; Song, W.; Ding, S.; Shu, J.; Sun, X.; Sun, J. Effects of Velocity-Based versus Percentage-Based Resistance Training on Explosive Neuromuscular Adaptations and Anaerobic Power in Sport-College Female Basketball Players. Healthcare 2023, 11, 623. https://doi.org/10.3390/healthcare11040623
Zhang M, Li D, He J, Liang X, Li D, Song W, Ding S, Shu J, Sun X, Sun J. Effects of Velocity-Based versus Percentage-Based Resistance Training on Explosive Neuromuscular Adaptations and Anaerobic Power in Sport-College Female Basketball Players. Healthcare. 2023; 11(4):623. https://doi.org/10.3390/healthcare11040623
Chicago/Turabian StyleZhang, Mingyang, Duanying Li, Jiaxin He, Xingyue Liang, Dongyu Li, Wenfeng Song, Shicong Ding, Jie Shu, Xiaoning Sun, and Jian Sun. 2023. "Effects of Velocity-Based versus Percentage-Based Resistance Training on Explosive Neuromuscular Adaptations and Anaerobic Power in Sport-College Female Basketball Players" Healthcare 11, no. 4: 623. https://doi.org/10.3390/healthcare11040623