
Modeling Consequences of COVID-19 and Assessing Its Epidemiological Parameters: A System Dynamics Approach

 , ,
, ,  and
and
Abstract
:1. Introduction
2. Literature Survey
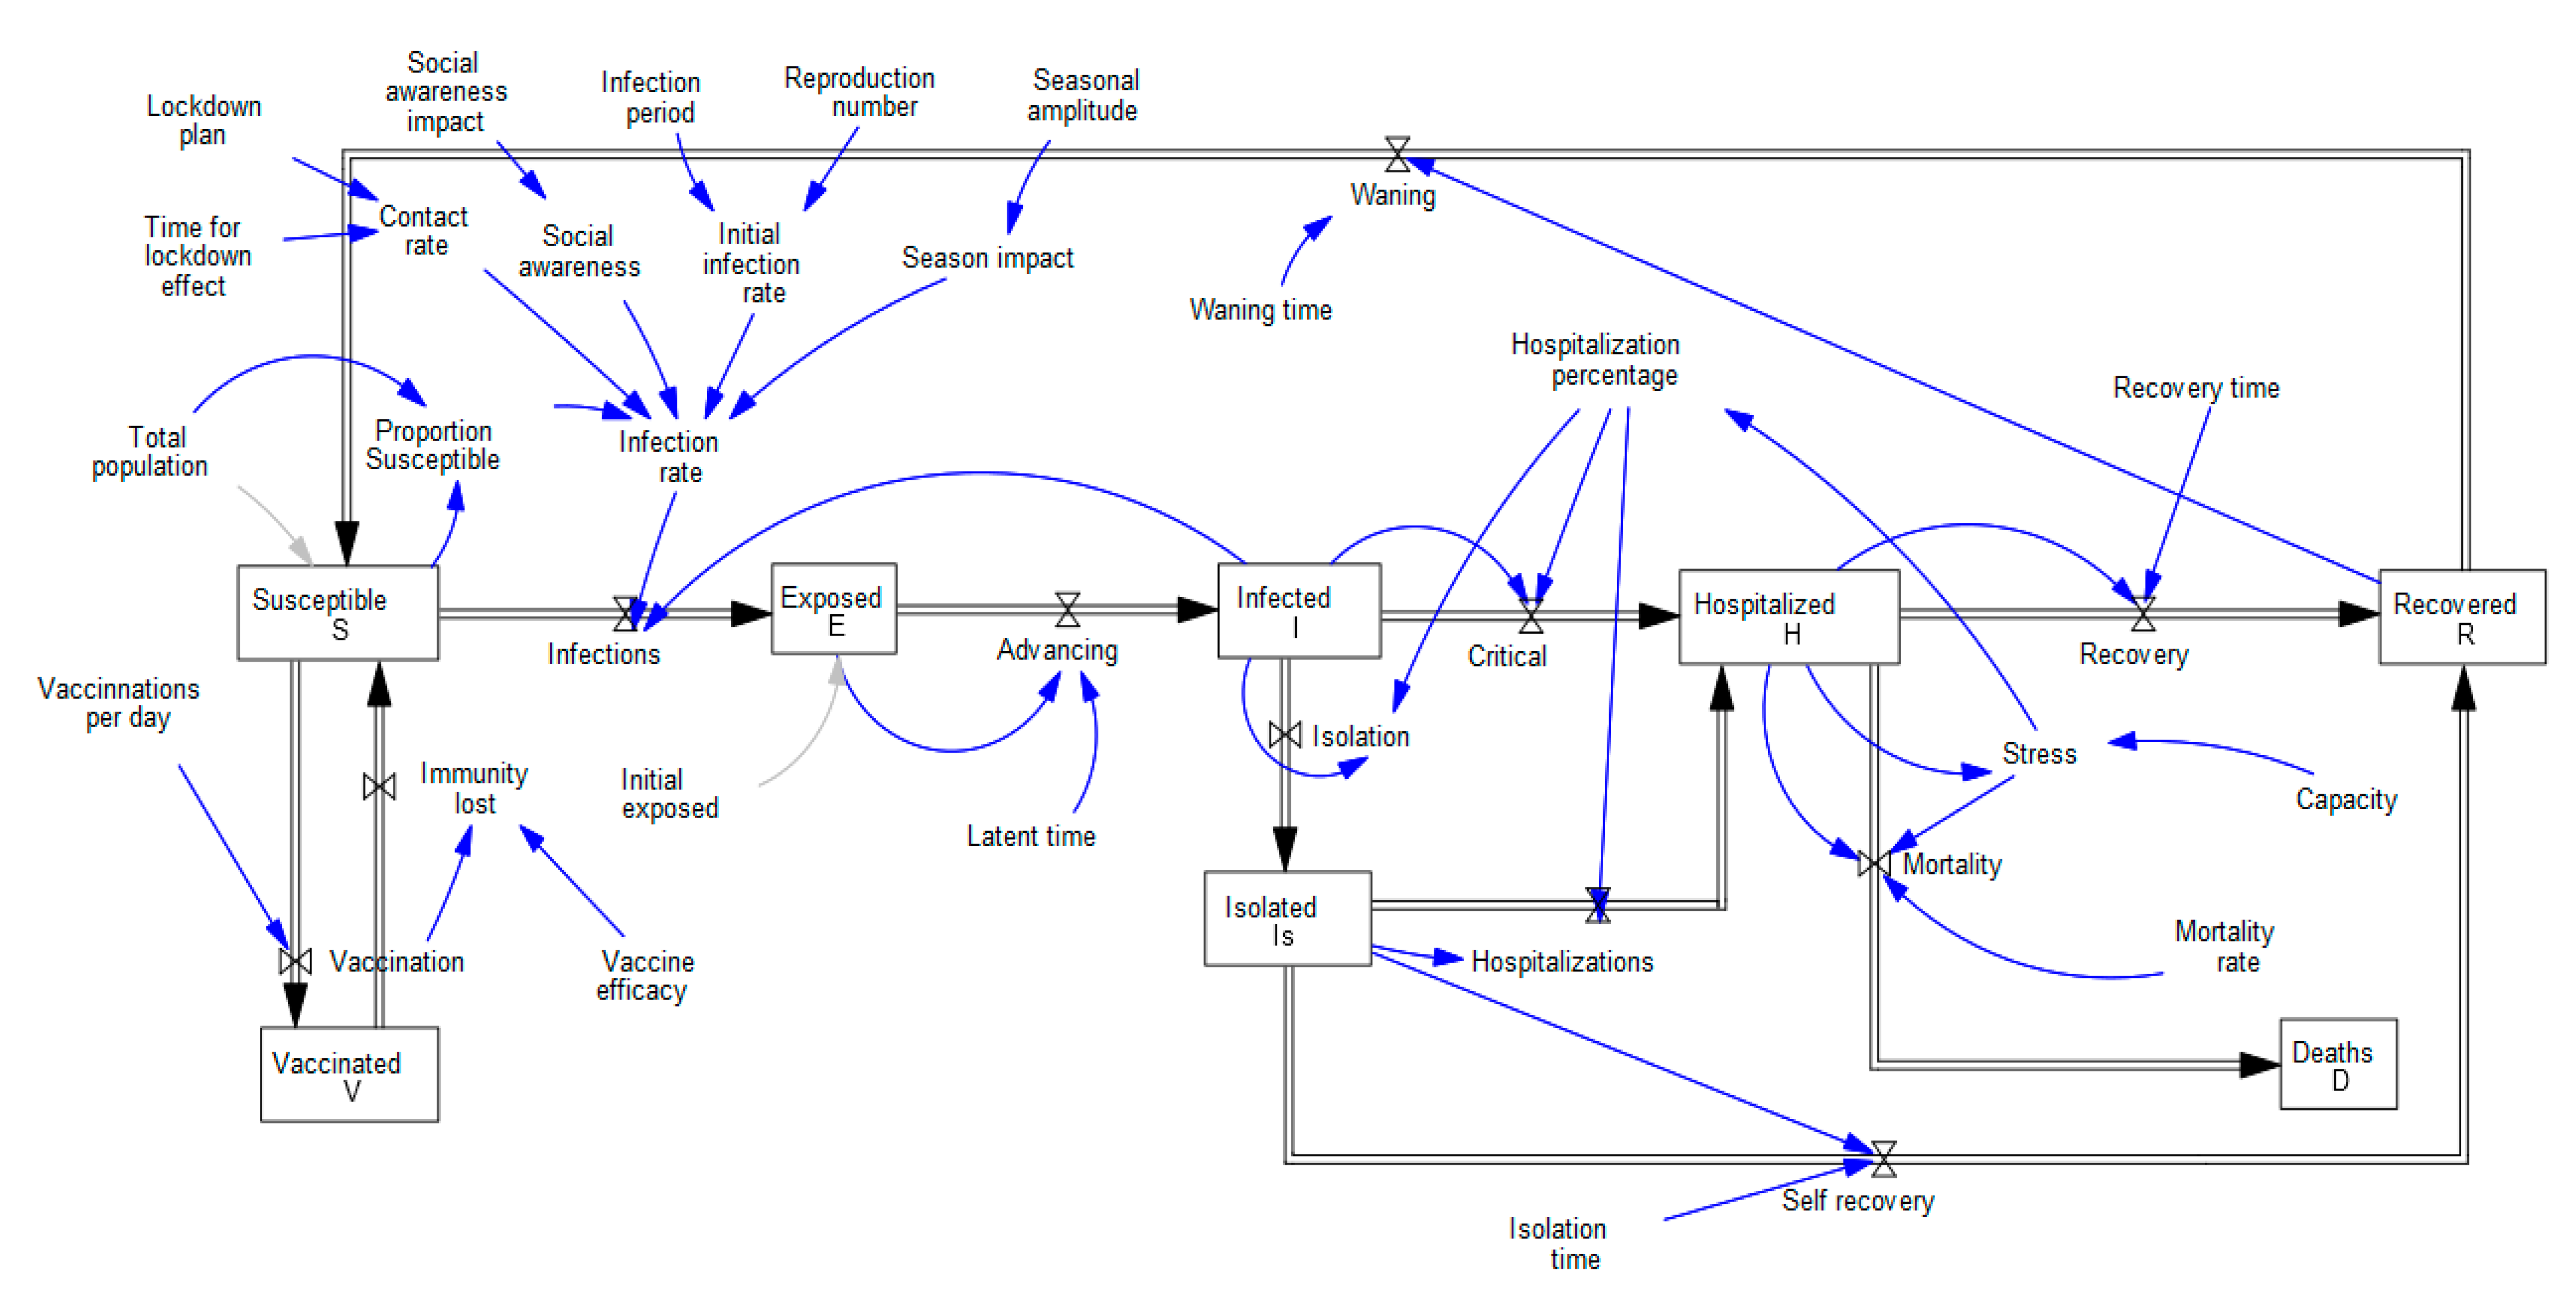
3. Model Description and Experiments
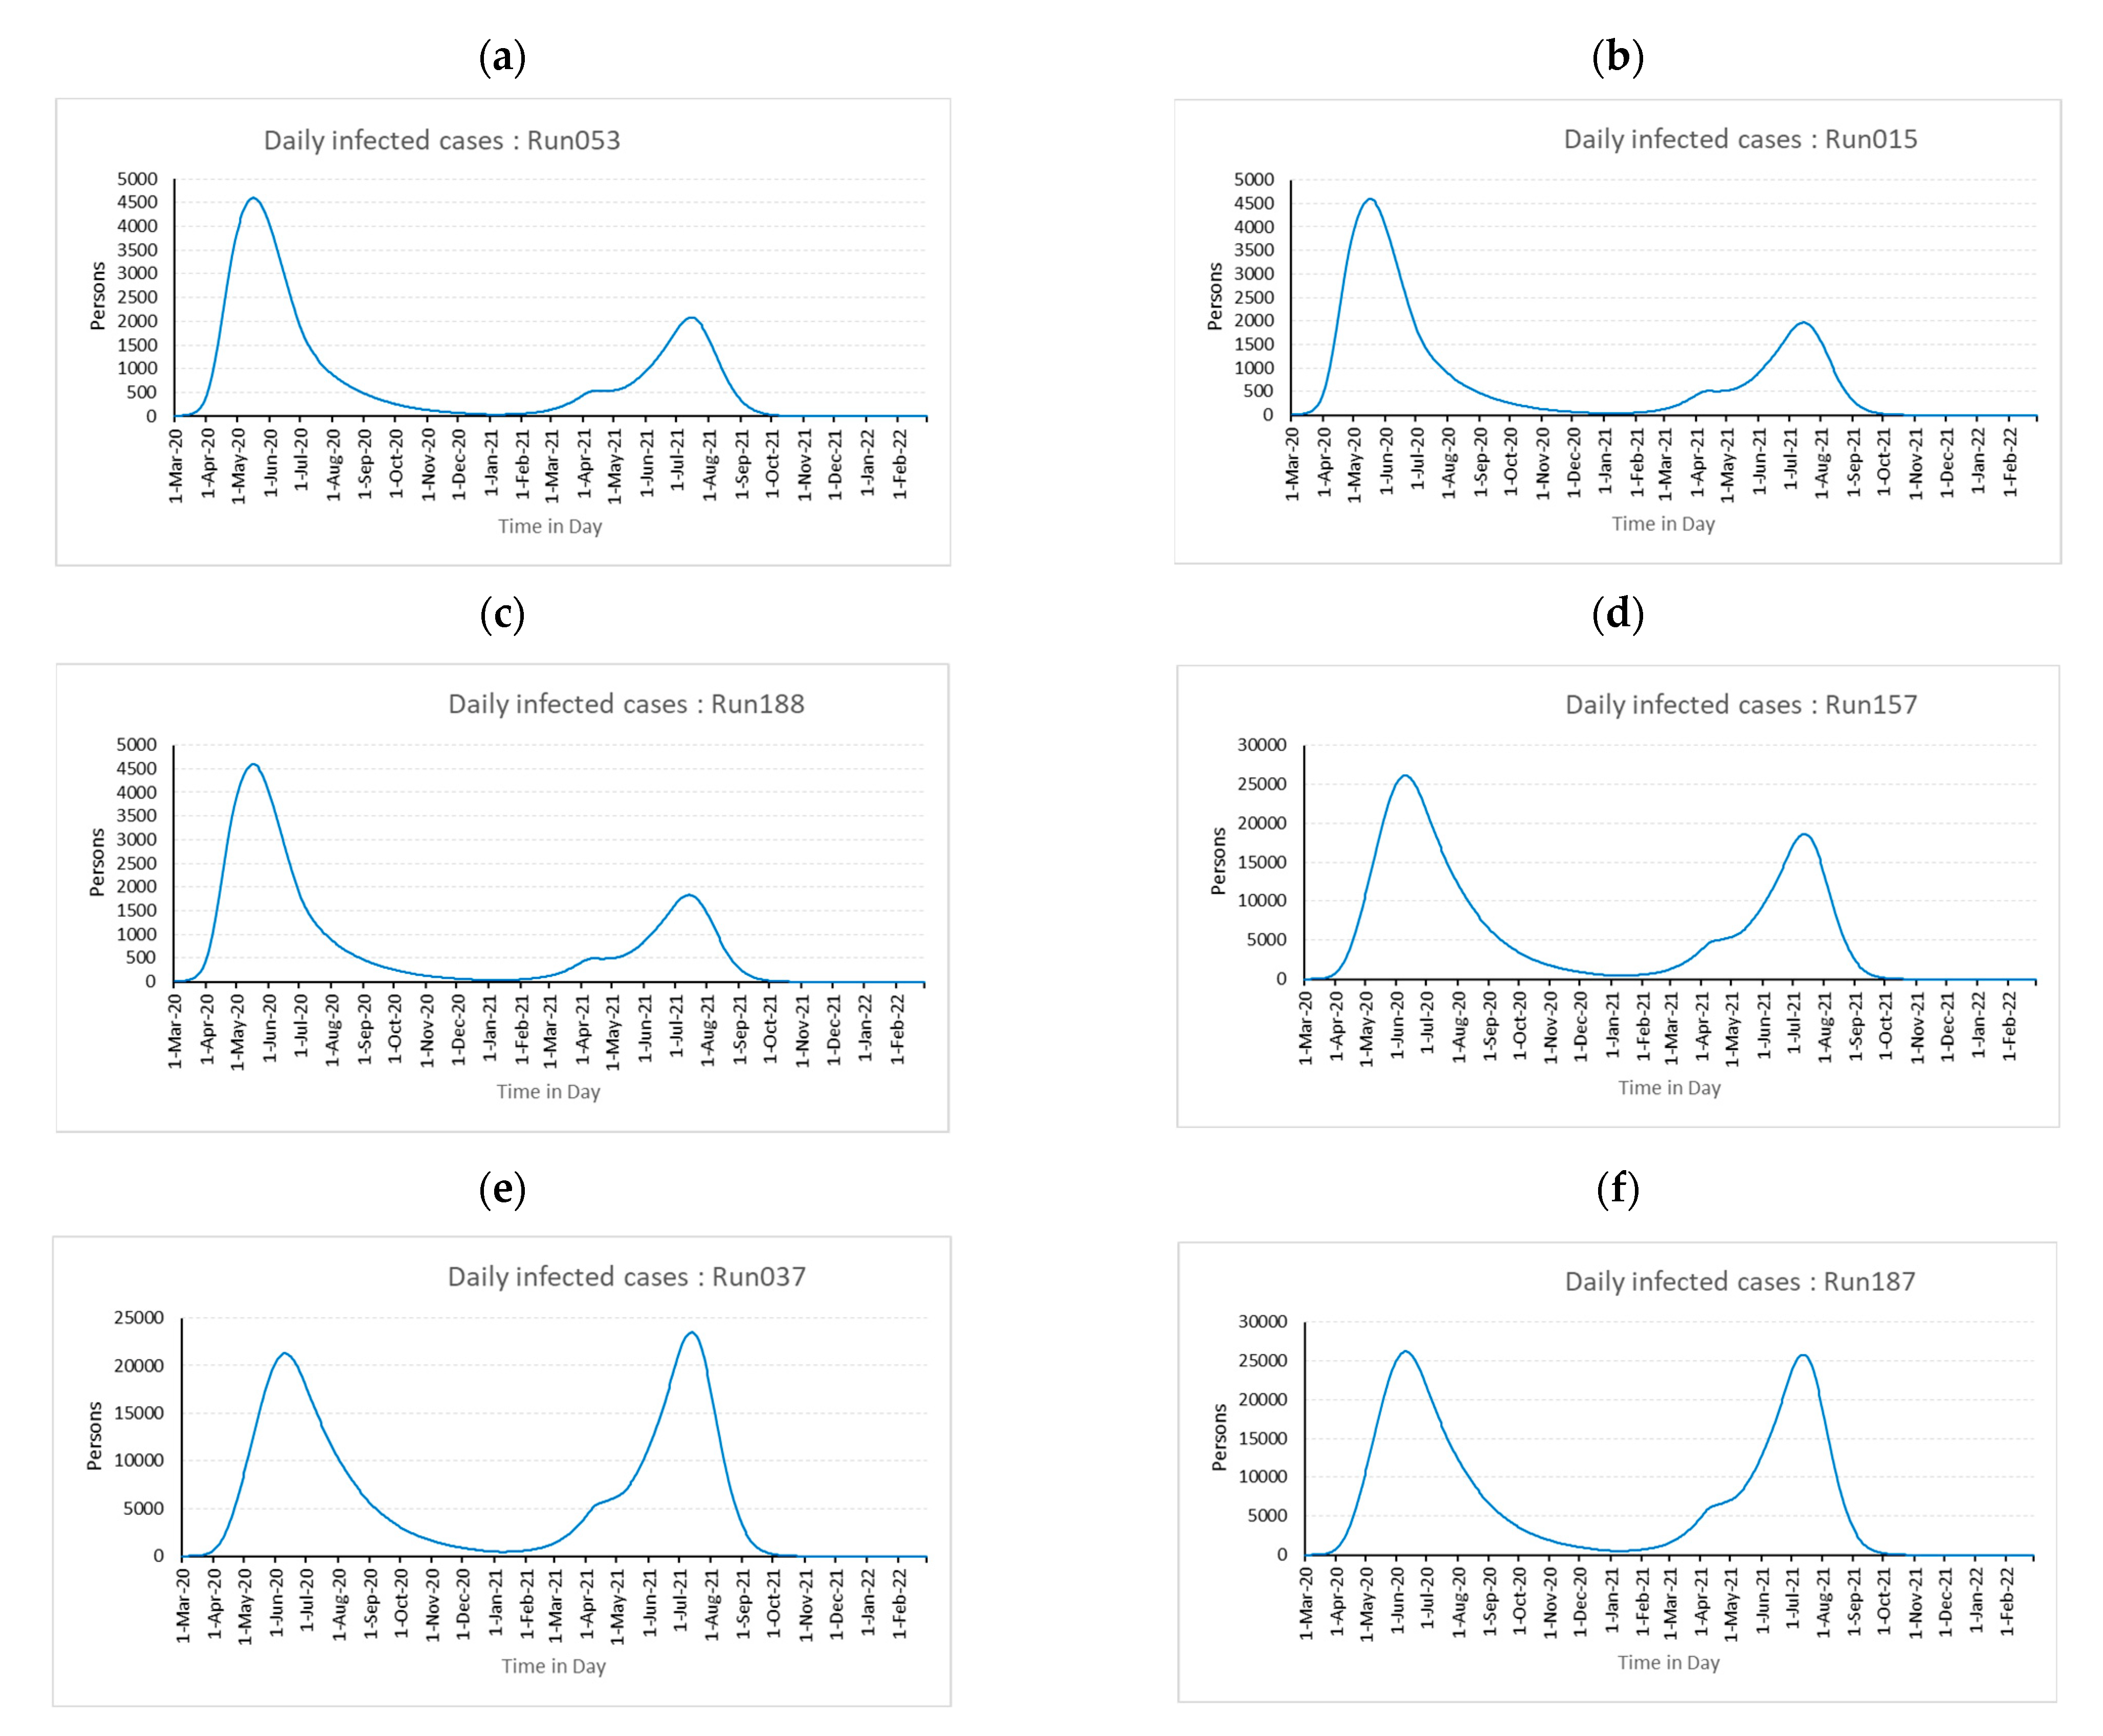
3.1. Experimentation
3.2. Impact of Policies Using the Established Model
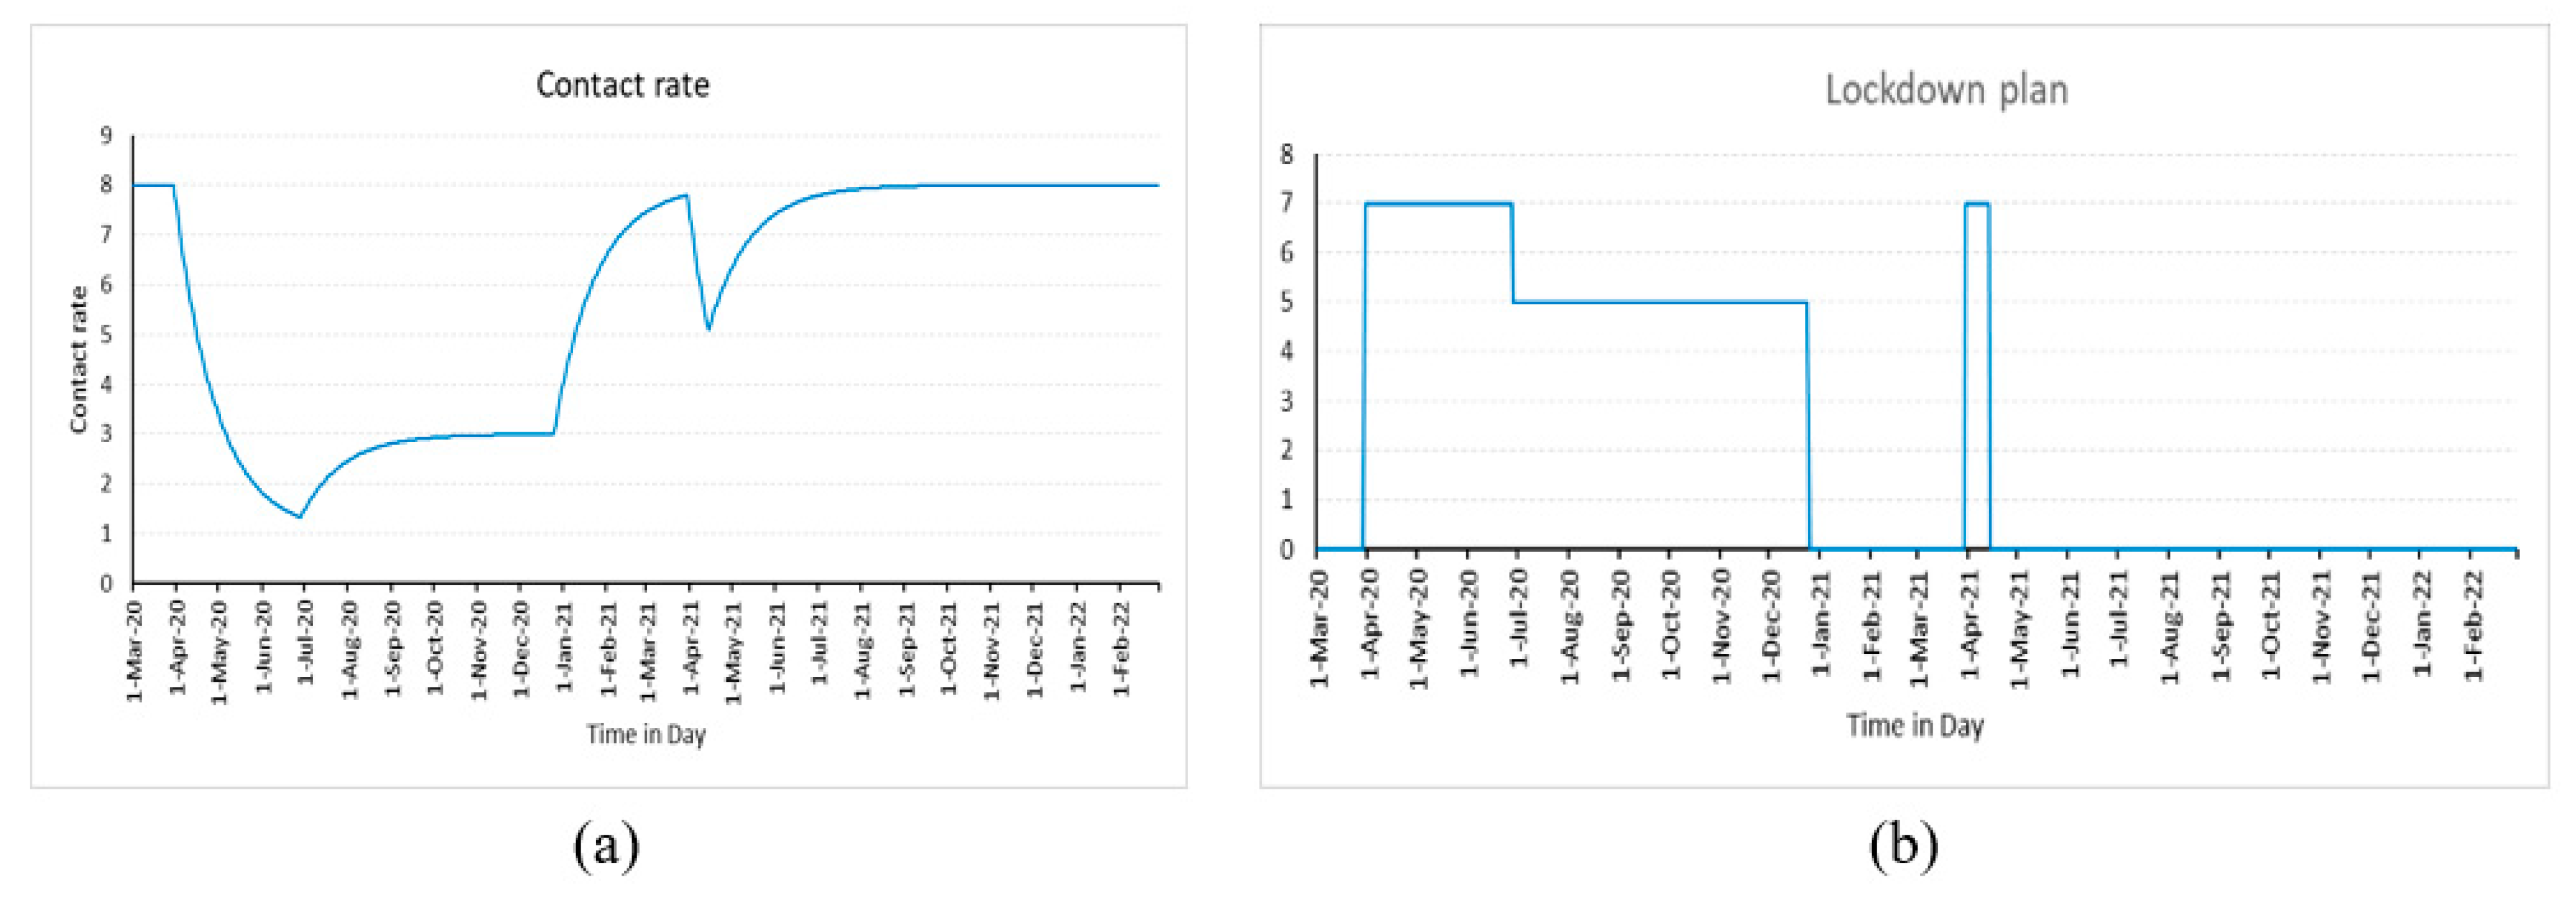
3.2.1. Effect of Lockdowns
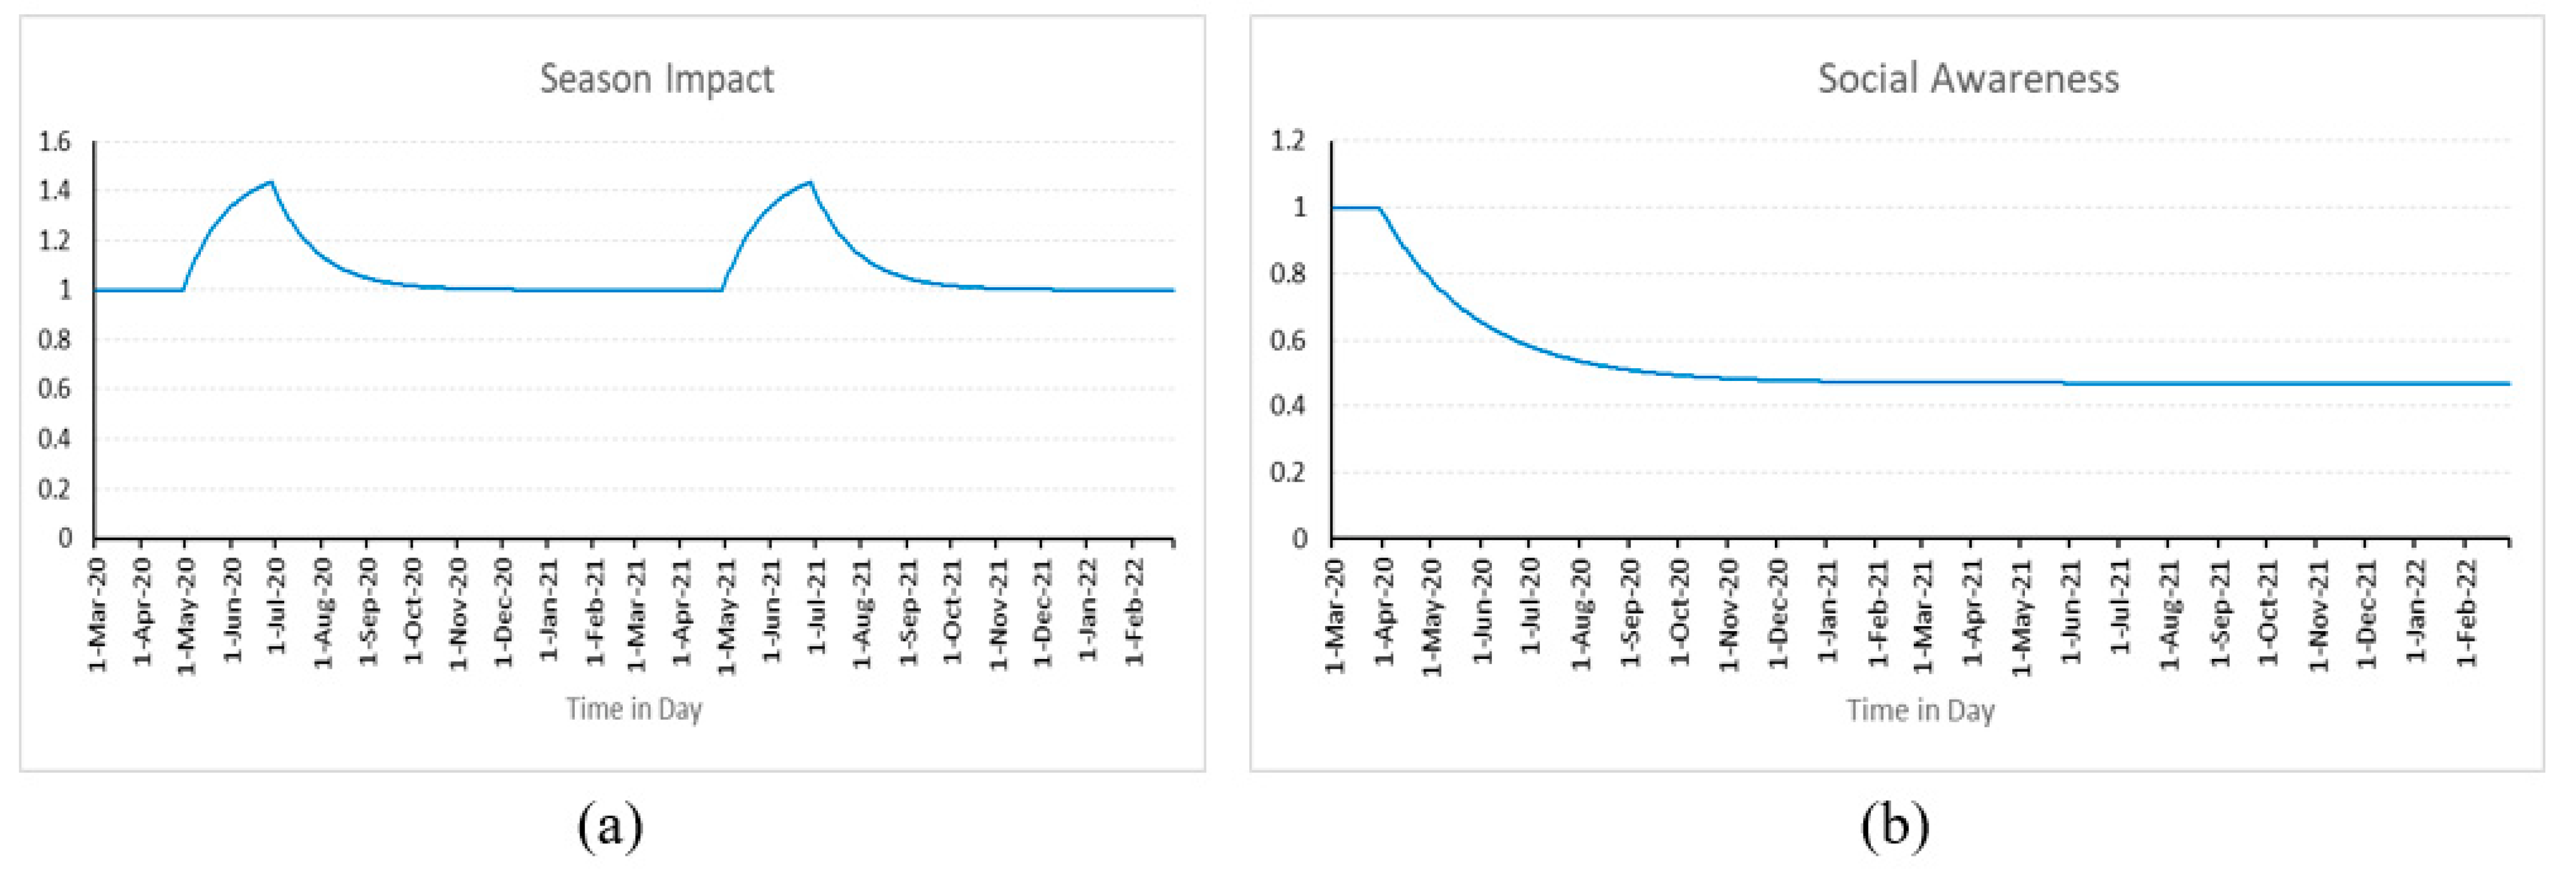
3.2.2. Impact of Social Awareness
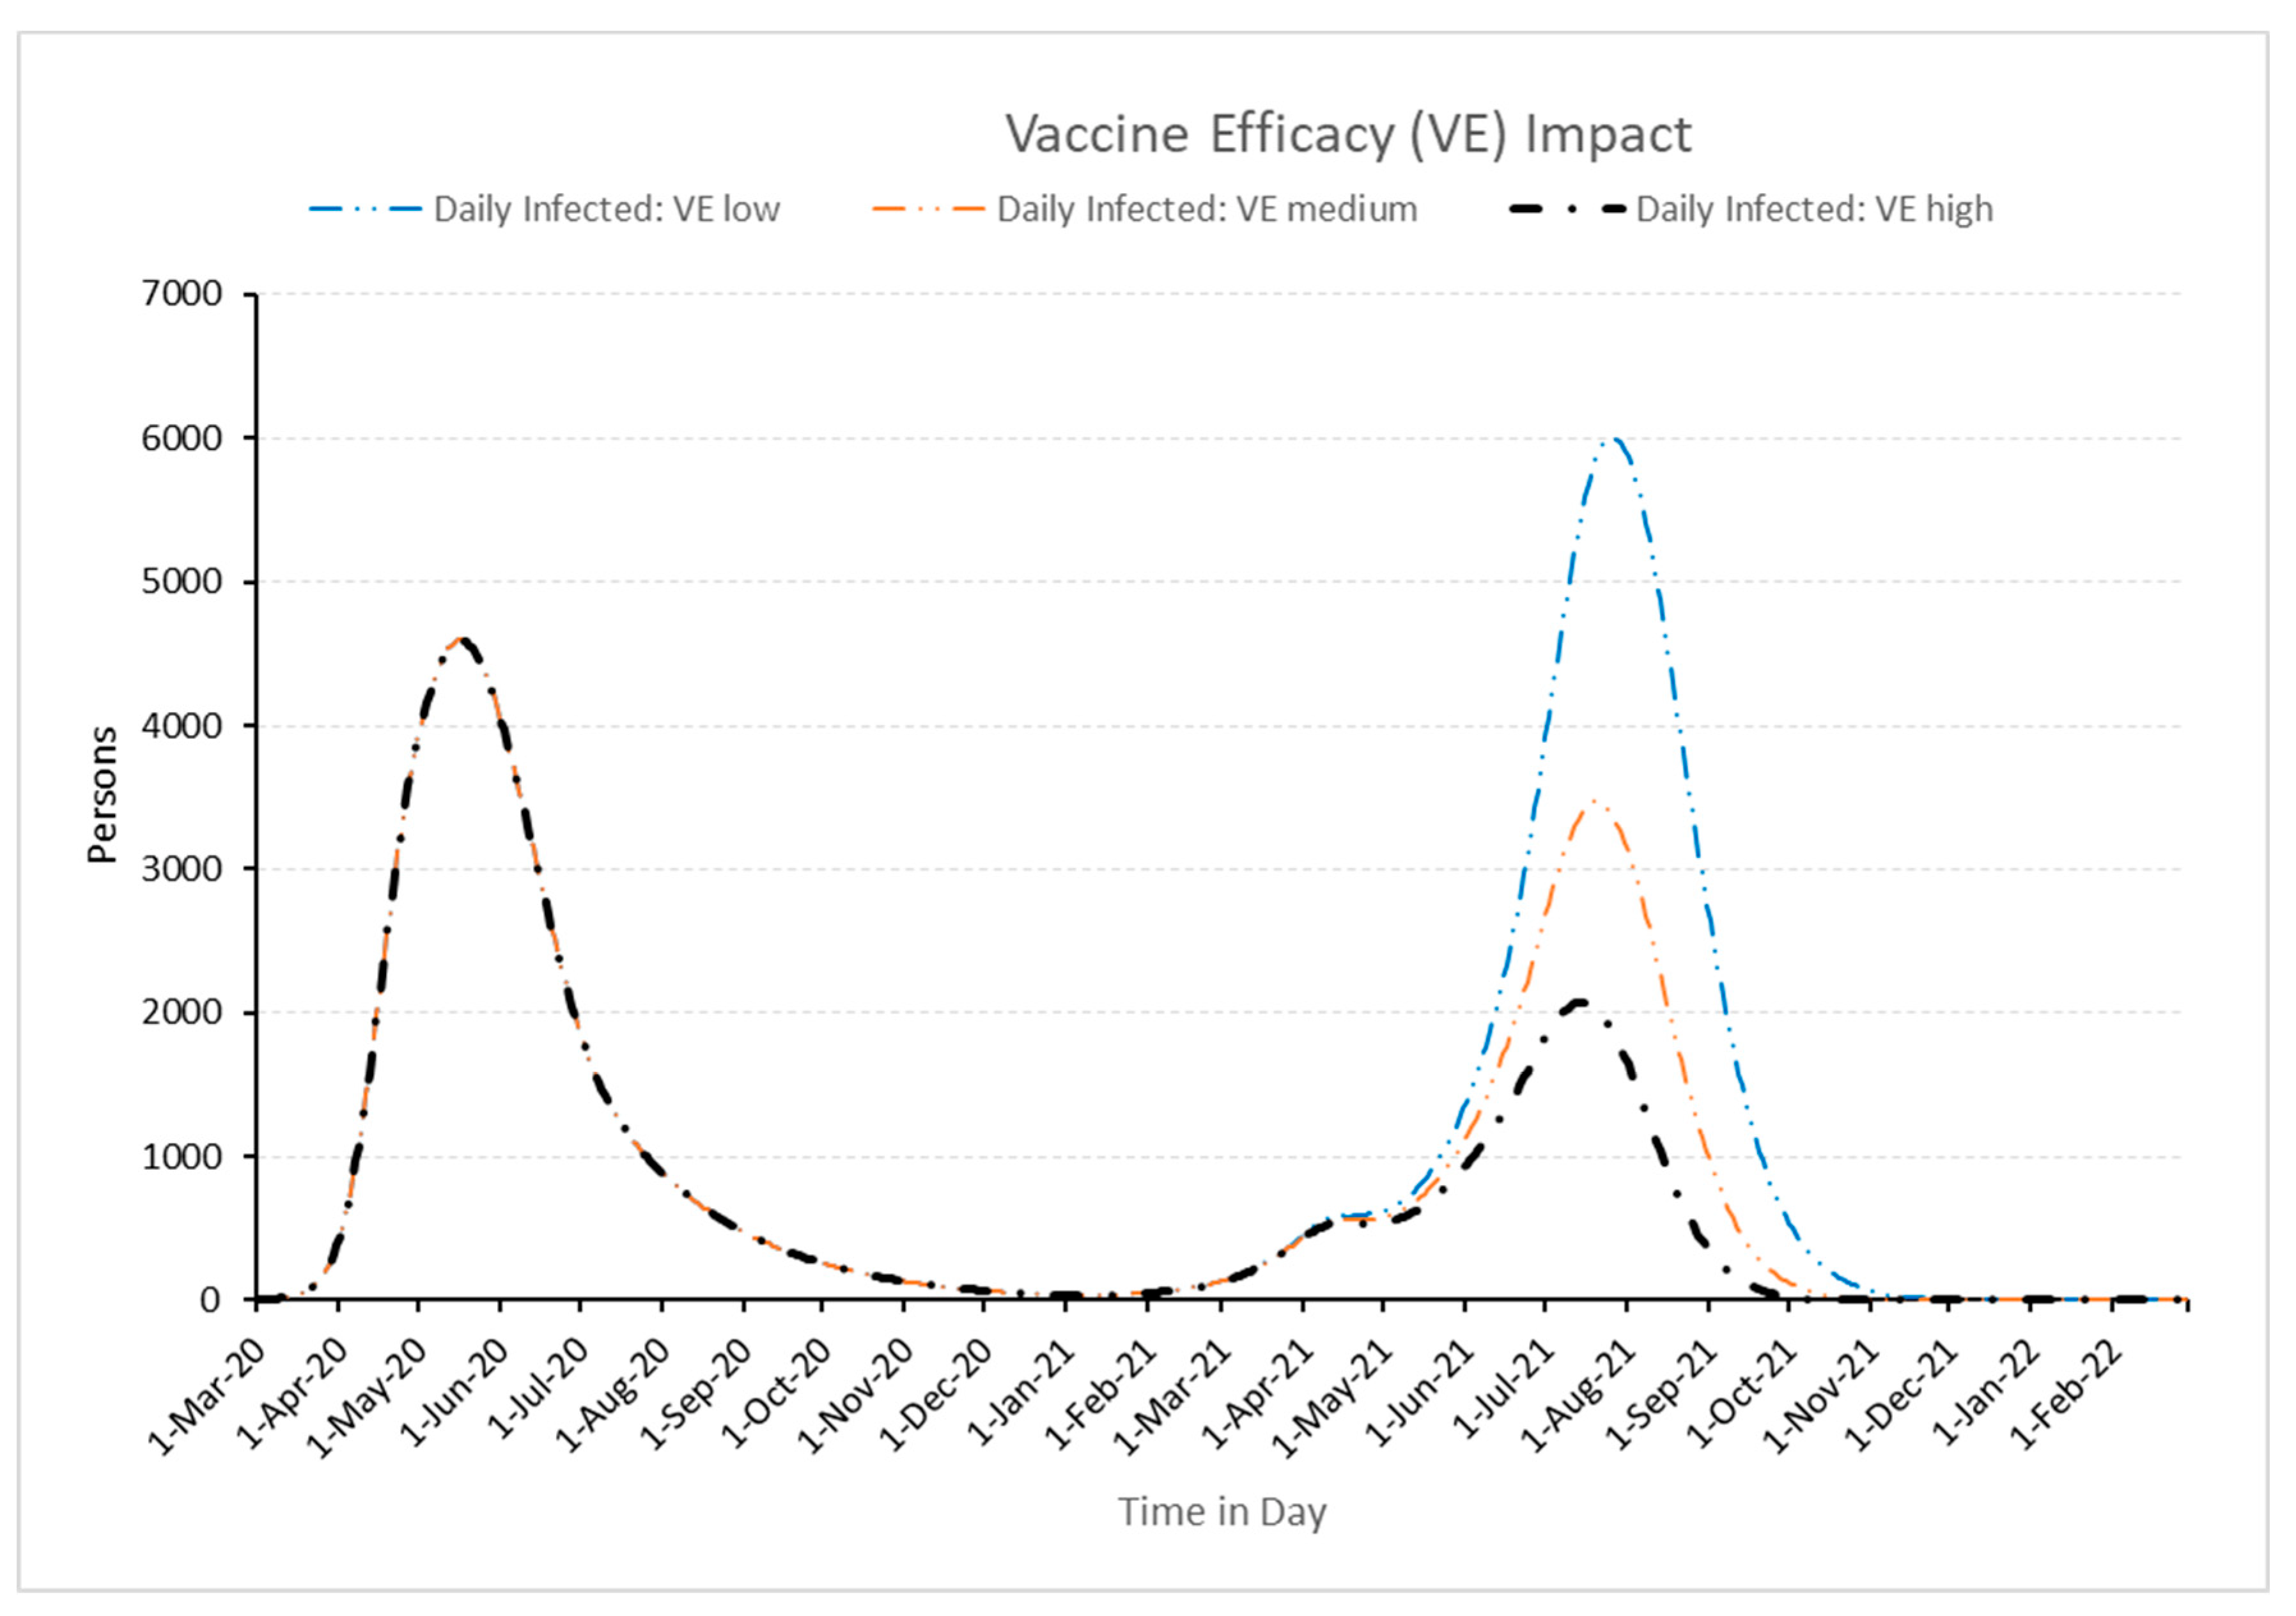
3.2.3. Influence of Vaccination Efficacy
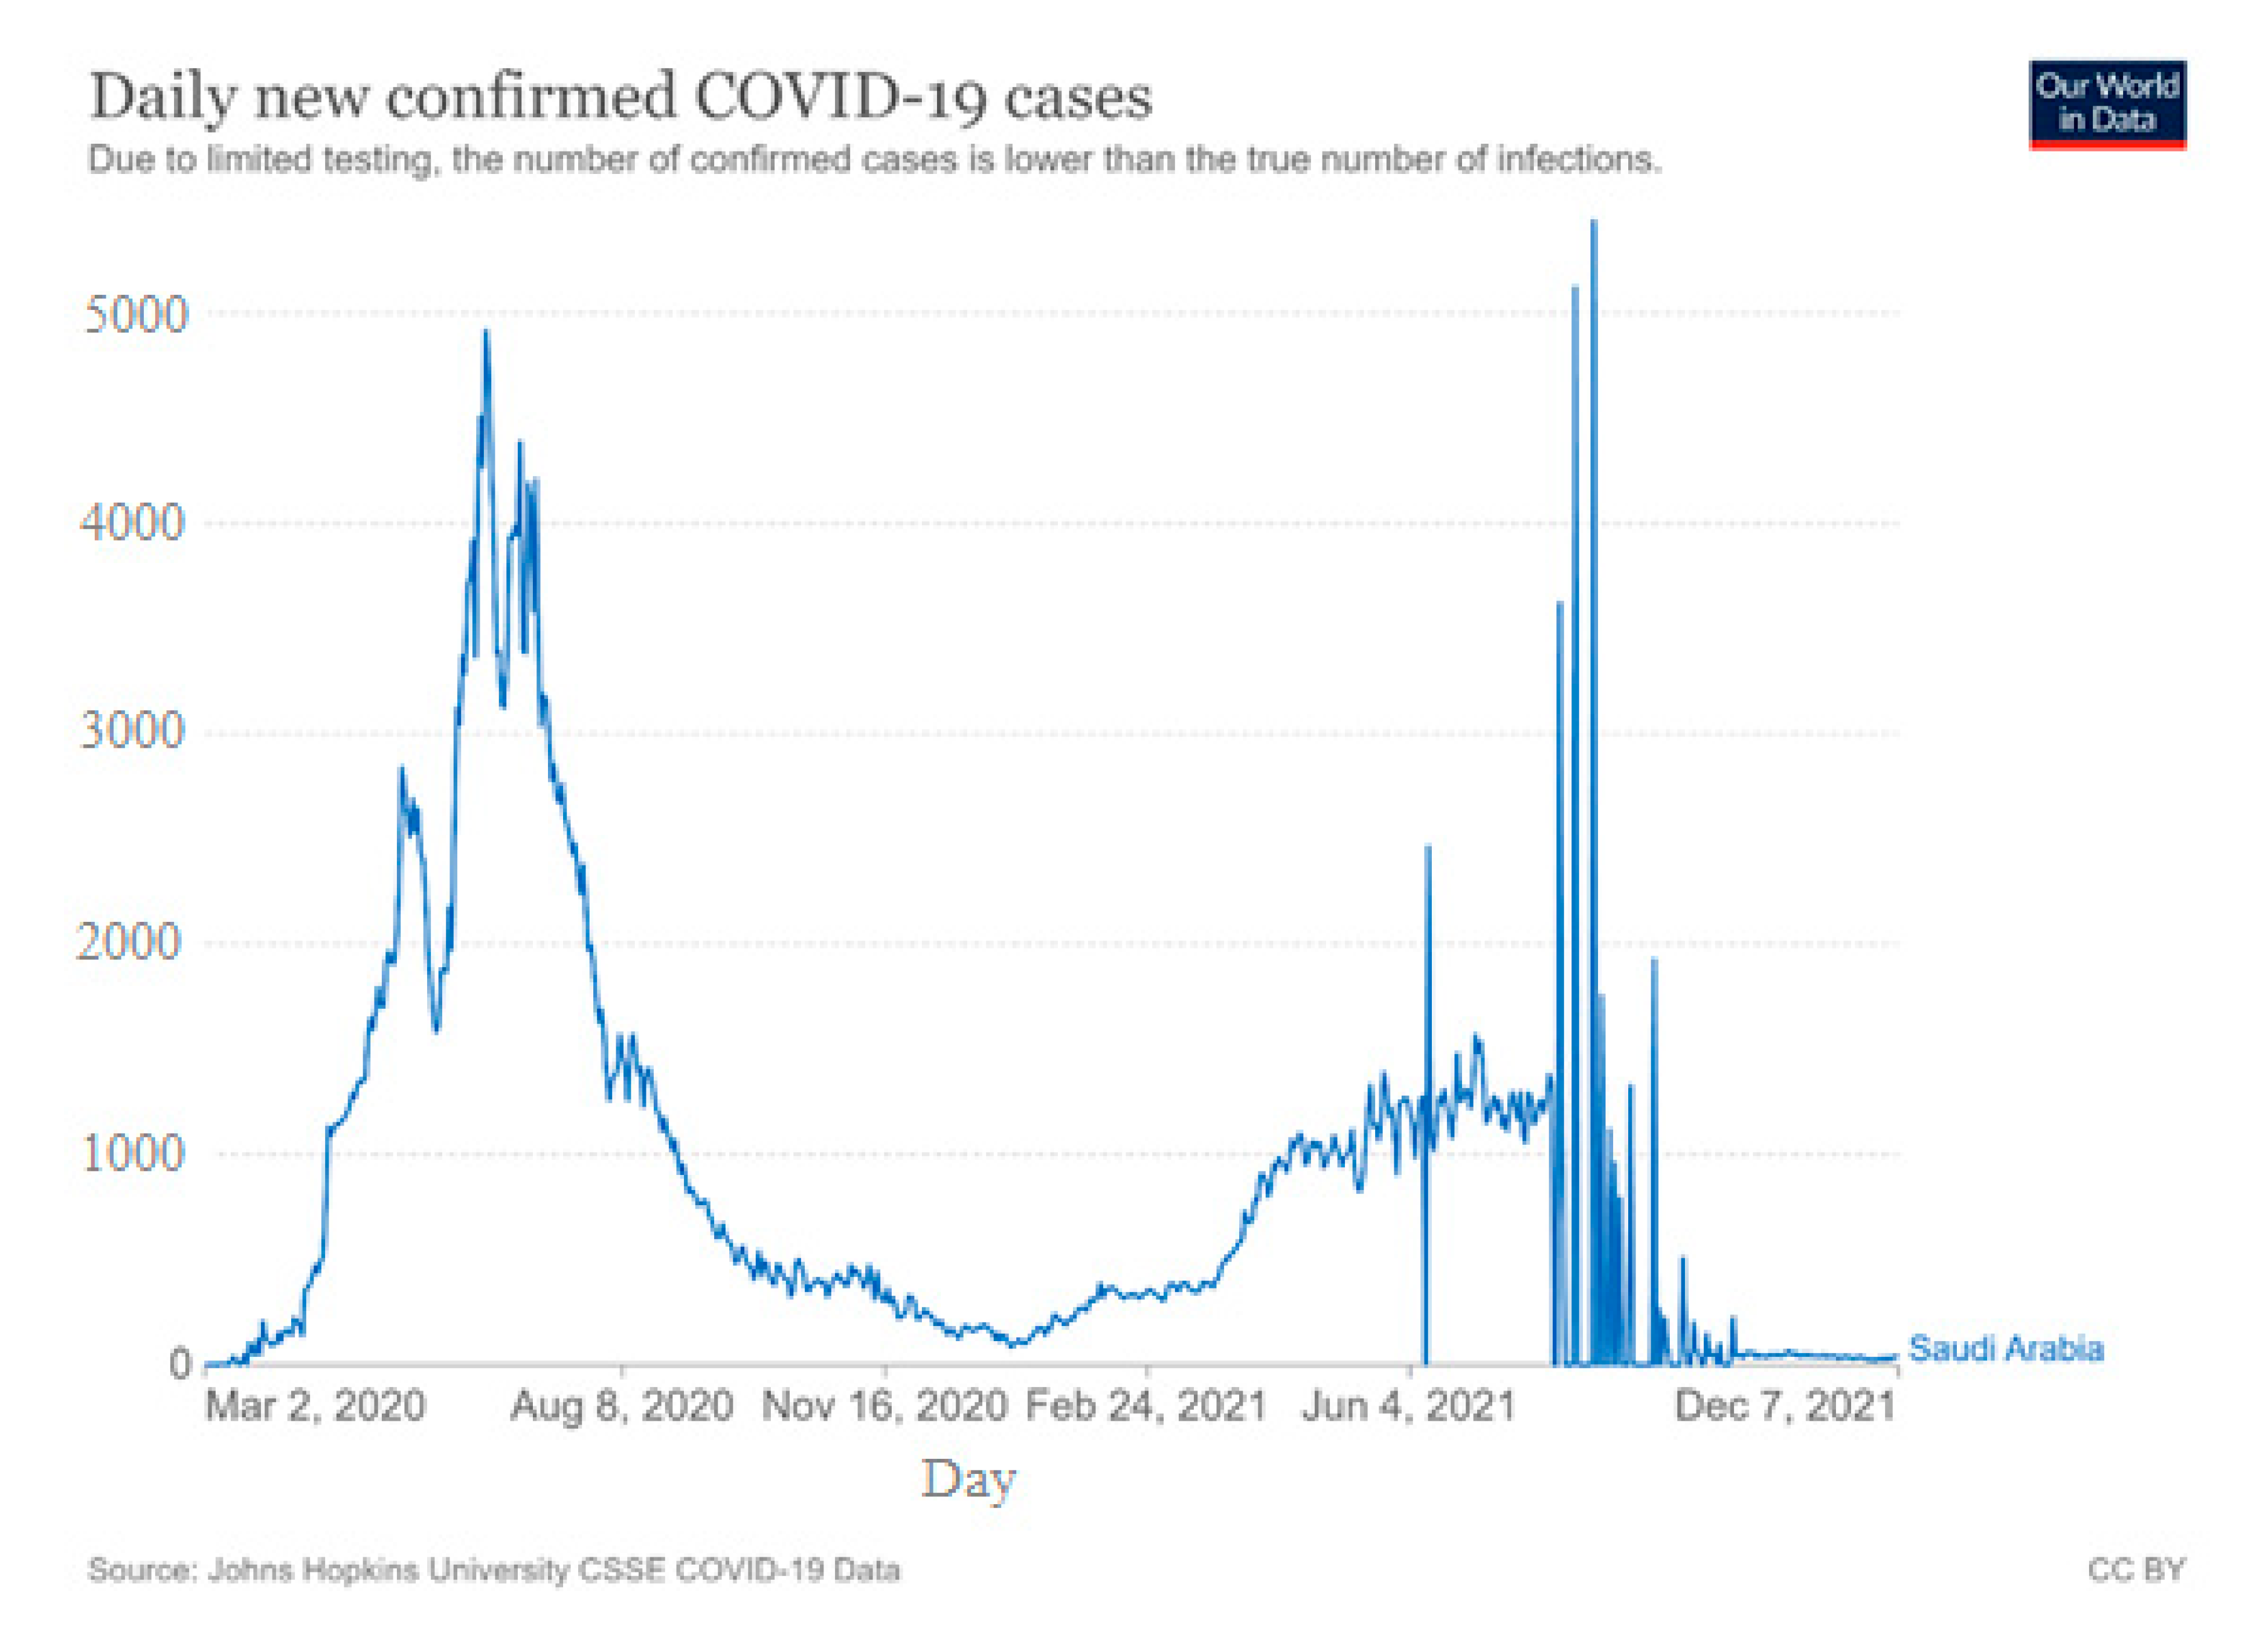
4. Results and Discussions
5. Conclusions and Future Work
Author Contributions
Funding
Institutional Review Board Statement
Informed Consent Statement
Data Availability Statement
Conflicts of Interest
References
- Purkayastha, S.; Bhattacharyya, R.; Bhaduri, R.; Kundu, R.; Gu, X.; Salvatore, M.; Ray, D.; Mishra, S.; Mukherjee, B. A Comparison of Five Epidemiological Models for Transmission of SARS-CoV-2 in India. BMC Infect. Dis. 2021, 21, 533. [Google Scholar] [CrossRef]
- WHO. WHO Coronavirus (COVID-19) Dashboard. Available online: https://covid19.who.int/ (accessed on 29 November 2022).
- Wang, Y.; Wang, Y.; Chen, Y.; Qin, Q. Unique Epidemiological and Clinical Features of the Emerging 2019 Novel Coronavirus Pneumonia (COVID-19) Implicate Special Control Measures. J. Med. Virol. 2020, 92, 568–576. [Google Scholar] [CrossRef] [Green Version]
- Milne, G.J.; Xie, S.; Poklepovich, D.; O’Halloran, D.; Yap, M.; Whyatt, D. A Modelling Analysis of the Effectiveness of Second Wave COVID-19 Response Strategies in Australia. Sci. Rep. 2021, 11, 11958. [Google Scholar] [CrossRef] [PubMed]
- Inoue, H.; Murase, Y.; Todo, Y. Do Economic Effects of the Anti-COVID-19 Lockdowns in Different Regions Interact through Supply Chains? PLoS ONE 2021, 16, e0255031. [Google Scholar] [CrossRef] [PubMed]
- Mandal, M.; Jana, S.; Nandi, S.K.; Khatua, A.; Adak, S.; Kar, T.K. A Model Based Study on the Dynamics of COVID-19: Prediction and Control. Chaos Solitons Fractals 2020, 136, 109889. [Google Scholar] [CrossRef] [PubMed]
- Lin, Q.; Zhao, S.; Gao, D.; Lou, Y.; Yang, S.; Musa, S.S.; Wang, M.H.; Cai, Y.; Wang, W.; Yang, L.; et al. A Conceptual Model for the Coronavirus Disease 2019 (COVID-19) Outbreak in Wuhan, China with Individual Reaction and Governmental Action. Int. J. Infect. Dis. 2020, 93, 211–216. [Google Scholar] [CrossRef]
- Ahmed, I.; Modu, G.U.; Yusuf, A.; Kumam, P.; Yusuf, I. A Mathematical Model of Coronavirus Disease (COVID-19) Containing Asymptomatic and Symptomatic Classes. Results Phys. 2021, 21, 103776. [Google Scholar] [CrossRef]
- Bachar, M.; Khamsi, M.A.; Bounkhel, M. A Mathematical Model for the Spread of COVID-19 and Control Mechanisms in Saudi Arabia. Adv. Differ. Equ. 2021, 2021, 253. [Google Scholar] [CrossRef]
- Kifle, Z.S.; Obsu, L.L. Mathematical Modeling for COVID-19 Transmission Dynamics: A Case Study in Ethiopia. Results Phys. 2022, 34, 105191. [Google Scholar] [CrossRef]
- Kim, B.N.; Kim, E.; Lee, S.; Oh, C. Mathematical Model of COVID-19 Transmission Dynamics in South Korea: The Impacts of Travel Restrictions, Social Distancing, and Early Detection. Processes 2020, 8, 1304. [Google Scholar] [CrossRef]
- Hu, H.; Kennedy, C.M.; Kevrekidis, P.G.; Zhang, H.-K. A Modified PINN Approach for Identifiable Compartmental Models in Epidemiology with Application to COVID-19. Viruses 2022, 14, 2464. [Google Scholar] [CrossRef] [PubMed]
- Alshammari, F.S.; Akyildiz, F.T.; Khan, M.A.; Din, A.; Sunthrayuth, P. A Stochastic Mathematical Model for Understanding the COVID-19 Infection Using Real Data. Symmetry 2022, 14, 2521. [Google Scholar] [CrossRef]
- de la Fuente-Mella, H.; Rubilar, R.; Chahuán-Jiménez, K.; Leiva, V. Modeling COVID-19 Cases Statistically and Evaluating Their Effect on the Economy of Countries. Mathematics 2021, 9, 1558. [Google Scholar] [CrossRef]
- Mansour, M.M.; Farsi, M.A.; Mohamed, S.M.; Abd Elrazik, E.M. Modeling the COVID-19 Pandemic Dynamics in Egypt and Saudi Arabia. Mathematics 2021, 9, 827. [Google Scholar] [CrossRef]
- Gkioulekas, E.; McCullough, P.A.; Zelenko, V. Statistical Analysis Methods Applied to Early Outpatient COVID-19 Treatment Case Series Data. COVID 2022, 2, 1139–1182. [Google Scholar] [CrossRef]
- Chatterjee, A.; Gerdes, M.W.; Martinez, S.G. Statistical Explorations and Univariate Timeseries Analysis on COVID-19 Datasets to Understand the Trend of Disease Spreading and Death. Sensors 2020, 20, 3089. [Google Scholar] [CrossRef] [PubMed]
- Jewell, N.P. Statistical Models for COVID-19 Incidence, Cumulative, Prevalence, and R (t). J. Am. Stat. Assoc. 2021, 116, 1578–1582. [Google Scholar] [CrossRef] [PubMed]
- Cui, Y.; Ni, S.; Shen, S. A Network-Based Model to Explore the Role of Testing in the Epidemiological Control of the COVID-19 Pandemic. BMC Infect. Dis. 2021, 21, 58. [Google Scholar] [CrossRef] [PubMed]
- Pizzuti, C.; Socievole, A.; Prasse, B.; Van Mieghem, P. Network-Based Prediction of COVID-19 Epidemic Spreading in Italy. Appl. Netw. Sci. 2020, 5, 91. [Google Scholar] [CrossRef]
- Thurner, S.; Klimek, P.; Hanel, R. A Network-Based Explanation of Why Most COVID-19 Infection Curves Are Linear. Proc. Natl. Acad. Sci. USA 2020, 117, 22684–22689. [Google Scholar] [CrossRef]
- Ayoub, A.; Mahboob, K.; Javed, A.R.; Rizwan, M.; Gadekallu, T.R.; Abidi, M.H.; Alkahtani, M. Classification and Categorization of COVID-19 Outbreak in Pakistan. Comput. Mater. Contin. 2021, 69, 1253–1269. [Google Scholar] [CrossRef]
- Yaşar, Ş.; Çolak, C.; Yoloğlu, S. Artificial Intelligence-Based Prediction of COVID-19 Severity on the Results of Protein Profiling. Comput. Methods Programs Biomed. 2021, 202, 105996. [Google Scholar] [CrossRef]
- Shamout, F.E.; Shen, Y.; Wu, N.; Kaku, A.; Park, J.; Makino, T.; Jastrzębski, S.; Witowski, J.; Wang, D.; Zhang, B.; et al. An Artificial Intelligence System for Predicting the Deterioration of COVID-19 Patients in the Emergency Department. NPJ Digit. Med. 2021, 4, 80. [Google Scholar] [CrossRef]
- Hassanat, A.B.; Mnasri, S.; Aseeri, M.A.; Alhazmi, K.; Cheikhrouhou, O.; Altarawneh, G.; Alrashidi, M.; Tarawneh, A.S.; Almohammadi, K.S.; Almoamari, H. A Simulation Model for Forecasting COVID-19 Pandemic Spread: Analytical Results Based on the Current Saudi COVID-19 Data. Sustainability 2021, 13, 4888. [Google Scholar] [CrossRef]
- Wang, P.; Zheng, X.; Liu, H. Simulation and Forecasting Models of COVID-19 Taking into Account Spatio-Temporal Dynamic Characteristics: A Review. Front. Public Health 2022, 10, 1033432. [Google Scholar] [CrossRef] [PubMed]
- Li, Y.; Liu, C.; Zhao, S.; Wang, Z.; Zhao, H.; Chu, S.; Xiong, Z.; Geng, L. Simulation Prediction and Control Strategy of COVID-19 Dynamic Contact Network in USA and Various States—Based on Effective Regeneration Number and Improved Discrete SEIQDHR Model. J. Phys. Conf. Ser. 2021, 1865, 042071. [Google Scholar] [CrossRef]
- Alrasheed, H.; Althnian, A.; Kurdi, H.; Al-Mgren, H.; Alharbi, S. COVID-19 Spread in Saudi Arabia: Modeling, Simulation and Analysis. Int. J. Environ. Res. Public Health 2020, 17, 7744. [Google Scholar] [CrossRef] [PubMed]
- Kermack, W.O.; McKendrick, A.G.; Walker, G.T. A Contribution to the Mathematical Theory of Epidemics. Proc. R. Soc. Lond. Ser. A Contain. Pap. Math. Phys. Character 1927, 115, 700–721. [Google Scholar] [CrossRef] [Green Version]
- Din, R.U.; Algehyne, E.A. Mathematical Analysis of COVID-19 by Using SIR Model with Convex Incidence Rate. Results Phys. 2021, 23, 103970. [Google Scholar] [CrossRef]
- Ajbar, A.; Alqahtani, R.T.; Boumaza, M. Dynamics of an SIR-Based COVID-19 Model with Linear Incidence Rate, Nonlinear Removal Rate, and Public Awareness. Front. Phys. 2021, 9, 634251. [Google Scholar] [CrossRef]
- Majeed, B.; Li, A.; Peng, J.; Lin, Y. A Multi-Period Curve Fitting Model for Short-Term Prediction of the COVID-19 Spread in the U.S. Metropolitans. Front. Public Health 2022, 9, 809877. [Google Scholar] [CrossRef] [PubMed]
- Wangping, J.; Ke, H.; Yang, S.; Wenzhe, C.; Shengshu, W.; Shanshan, Y.; Jianwei, W.; Fuyin, K.; Penggang, T.; Jing, L.; et al. Extended SIR Prediction of the Epidemics Trend of COVID-19 in Italy and Compared with Hunan, China. Front. Med. 2020, 7, 169. [Google Scholar] [CrossRef] [PubMed]
- Hao, X.; Cheng, S.; Wu, D.; Wu, T.; Lin, X.; Wang, C. Reconstruction of the Full Transmission Dynamics of COVID-19 in Wuhan. Nature 2020, 584, 420–424. [Google Scholar] [CrossRef]
- Giordano, G.; Blanchini, F.; Bruno, R.; Colaneri, P.; Di Filippo, A.; Di Matteo, A.; Colaneri, M. Modelling the COVID-19 Epidemic and Implementation of Population-Wide Interventions in Italy. Nat. Med. 2020, 26, 855–860. [Google Scholar] [CrossRef]
- Stanojevic, S.; Ponjavic, M.; Stanojevic, S.; Stevanovic, A.; Radojicic, S. Simulation and Prediction of Spread of COVID-19 in The Republic of Serbia by SEAIHRDS Model of Disease Transmission. Microb. Risk Anal. 2021, 18, 100161. [Google Scholar] [CrossRef]
- Hu, Y.; Jacob, J.; Parker, G.J.M.; Hawkes, D.J.; Hurst, J.R.; Stoyanov, D. The Challenges of Deploying Artificial Intelligence Models in a Rapidly Evolving Pandemic. Nat. Mach. Intell. 2020, 2, 298–300. [Google Scholar] [CrossRef]
- Currie, C.S.M.; Fowler, J.W.; Kotiadis, K.; Monks, T.; Onggo, B.S.; Robertson, D.A.; Tako, A.A. How Simulation Modelling Can Help Reduce the Impact of COVID-19. J. Simul. 2020, 14, 83–97. [Google Scholar] [CrossRef] [Green Version]
- Mwalili, S.; Kimathi, M.; Ojiambo, V.; Gathungu, D.; Mbogo, R. SEIR Model for COVID-19 Dynamics Incorporating the Environment and Social Distancing. BMC Res. Notes 2020, 13, 352. [Google Scholar] [CrossRef]
- He, S.; Peng, Y.; Sun, K. SEIR Modeling of the COVID-19 and Its Dynamics. Nonlinear Dyn. 2020, 101, 1667–1680. [Google Scholar] [CrossRef]
- Annas, S.; Isbar Pratama, M.; Rifandi, M.; Sanusi, W.; Side, S. Stability Analysis and Numerical Simulation of SEIR Model for Pandemic COVID-19 Spread in Indonesia. Chaos Solitons Fractals 2020, 139, 110072. [Google Scholar] [CrossRef] [PubMed]
- Yarsky, P. Using a Genetic Algorithm to Fit Parameters of a COVID-19 SEIR Model for US States. Math. Comput. Simul. 2021, 185, 687–695. [Google Scholar] [CrossRef] [PubMed]
- Chen, Z.; Feng, L.; Lay, H.A.; Furati, K.; Khaliq, A. SEIR Model with Unreported Infected Population and Dynamic Parameters for the Spread of COVID-19. Math. Comput. Simul. 2022, 198, 31–46. [Google Scholar] [CrossRef]
- Zhang, W.; Xie, R.; Dong, X.; Li, J.; Peng, P.; DR Santibanez Gonzalez, E. SEIR-FMi: A Coronavirus Disease Epidemiological Model Based on Intra-City Movement, Inter-City Movement and Medical Resource Investment. Comput. Biol. Med. 2022, 149, 106046. [Google Scholar] [CrossRef]
- Liu, J.; Ong, G.P.; Pang, V.J. Modelling Effectiveness of COVID-19 Pandemic Control Policies Using an Area-Based SEIR Model with Consideration of Infection during Interzonal Travel. Transp. Res. Part A Policy Pract. 2022, 161, 25–47. [Google Scholar] [CrossRef] [PubMed]
- Kamrujjaman, M.; Saha, P.; Islam, M.S.; Ghosh, U. Dynamics of SEIR Model: A Case Study of COVID-19 in Italy. Results Control Optim. 2022, 7, 100119. [Google Scholar] [CrossRef]
- Tello, I.F.Y.; Wouwer, A.V.; Coutinho, D. State Estimation of the Time–Space Propagation of COVID-19 Using a Distributed Parameter Observer Based on a SEIR-Type Model. J. Process Control 2022, 118, 231–241. [Google Scholar] [CrossRef] [PubMed]
- Kiarie, J.; Mwalili, S.; Mbogo, R. Forecasting the Spread of the COVID-19 Pandemic in Kenya Using SEIR and ARIMA Models. Infect. Dis. Model. 2022, 7, 179–188. [Google Scholar] [CrossRef]
- Yin, K.; Mondal, A.; Ndeffo-Mbah, M.; Banerjee, P.; Huang, Q.; Gurarie, D. Bayesian Inference for COVID-19 Transmission Dynamics in India Using a Modified SEIR Model. Mathematics 2022, 10, 4037. [Google Scholar] [CrossRef]
- Hatami, F.; Chen, S.; Paul, R.; Thill, J.-C. Simulating and Forecasting the COVID-19 Spread in a U.S. Metropolitan Region with a Spatial SEIR Model. Int. J. Environ. Res. Public Health 2022, 19, 15771. [Google Scholar] [CrossRef]
- Phan, T.; Brozak, S.; Pell, B.; Gitter, A.; Xiao, A.; Mena, K.D.; Kuang, Y.; Wu, F. A Simple SEIR-V Model to Estimate COVID-19 Prevalence and Predict SARS-CoV-2 Transmission Using Wastewater-Based Surveillance Data. Sci. Total Environ. 2023, 857, 159326. [Google Scholar] [CrossRef]
- Sun, Q. Analysis of COVID-19 in Japan with Extended SEIR Model and Ensemble Kalman Filter (Preprint). arXiv 2021, arXiv:2110.14892. [Google Scholar]
- Carcione, J.M.; Santos, J.E.; Bagaini, C.; Ba, J. A Simulation of a COVID-19 Epidemic Based on a Deterministic SEIR Model. Front. Public Health 2020, 8, 230. [Google Scholar] [CrossRef] [PubMed]
- Feng, S.; Feng, Z.; Ling, C.; Chang, C.; Feng, Z. Prediction of the COVID-19 Epidemic Trends Based on SEIR and AI Models. PLoS ONE 2021, 16, e0245101. [Google Scholar] [CrossRef]
- Prem, K.; Liu, Y.; Russell, T.W.; Kucharski, A.J.; Eggo, R.M.; Davies, N.; Flasche, S.; Clifford, S.; Pearson, C.A.B.; Munday, J.D.; et al. The Effect of Control Strategies to Reduce Social Mixing on Outcomes of the COVID-19 Epidemic in Wuhan, China: A Modelling Study. Lancet Public Health 2020, 5, e261–e270. [Google Scholar] [CrossRef] [PubMed] [Green Version]
- Chung, N.N.; Chew, L.Y. Modelling Singapore COVID-19 Pandemic with a SEIR Multiplex Network Model. Sci. Rep. 2021, 11, 10122. [Google Scholar] [CrossRef] [PubMed]
- Paul, S.; Venkateswaran, J. Inventory Management Strategies for Mitigating Unfolding Epidemics. IISE Trans. Healthc. Syst. Eng. 2018, 8, 167–180. [Google Scholar] [CrossRef]
- Brauer, F. Compartmental Models in Epidemiology. In Mathematical Epidemiology; Brauer, F., van den Driessche, P., Wu, J., Eds.; Lecture Notes in Mathematics; Springer: Berlin/Heidelberg, Germany, 2008; pp. 19–79. ISBN 978-3-540-78911-6. [Google Scholar]
- Sterman, J.D. System Dynamics: Systems Thinking and Modeling for a Complex World; Working Paper Series ESD-WP-2003-01.13-ESD Internal Symposium; Massachusetts Institute of Technology Engineering Systems Division: Cambridge, MA, USA, 2002. [Google Scholar]
- Alkahtani, T.A.; Alakeel, A.; Alakeel, R.A.; Khorshid, F.A.; Alshammari, H.H.; Alguwaihes, A.M.; Almohideb, M.; Ali, E.M.; Bin-Jumah, M.; Abdel-Daim, M.M.; et al. The Current Reproduction Number of COVID-19 in Saudi Arabia: Is the Disease Controlled? Environ. Sci. Pollut. Res. 2021, 28, 44812–44817. [Google Scholar] [CrossRef]
- Locatelli, I.; Trächsel, B.; Rousson, V. Estimating the Basic Reproduction Number for COVID-19 in Western Europe. PLoS ONE 2021, 16, e0248731. [Google Scholar] [CrossRef]
- Liu, Y.; Gayle, A.A.; Wilder-Smith, A.; Rocklöv, J. The Reproductive Number of COVID-19 Is Higher Compared to SARS Coronavirus. J. Travel Med. 2020, 27, taaa021. [Google Scholar] [CrossRef] [Green Version]
- Yu, C.-J.; Wang, Z.-X.; Xu, Y.; Hu, M.-X.; Chen, K.; Qin, G. Assessment of Basic Reproductive Number for COVID-19 at Global Level. Medicine 2021, 100, e25837. [Google Scholar] [CrossRef]
- Zhou, T.; Liu, Q.; Yang, Z.; Liao, J.; Yang, K.; Bai, W.; Lu, X.; Zhang, W. Preliminary Prediction of the Basic Reproduction Number of the Wuhan Novel Coronavirus 2019-nCoV. J. Evid. Based Med. 2020, 13, 3–7. [Google Scholar] [CrossRef] [PubMed]
- Wu, Y.; Kang, L.; Guo, Z.; Liu, J.; Liu, M.; Liang, W. Incubation Period of COVID-19 Caused by Unique SARS-CoV-2 Strains: A Systematic Review and Meta-Analysis. JAMA Netw. Open 2022, 5, e2228008. [Google Scholar] [CrossRef] [PubMed]
- Coronavirus Incubation Period (COVID-19)—Worldometer. Available online: https://www.worldometers.info/coronavirus/coronavirus-incubation-period/ (accessed on 22 November 2022).
- Sarkar, K.; Khajanchi, S.; Nieto, J.J. Modeling and Forecasting the COVID-19 Pandemic in India. Chaos Solitons Fractals 2020, 139, 110049. [Google Scholar] [CrossRef] [PubMed]
- Assiri, A.; Al-Tawfiq, J.A.; Alkhalifa, M.; Al Duhailan, H.; Al Qahtani, S.; Dawas, R.A.; El Seoudi, A.A.; Alomran, N.; Omar, O.A.; Alotaibi, N.; et al. Launching COVID-19 Vaccination in Saudi Arabia: Lessons Learned, and the Way Forward. Travel Med. Infect. Dis. 2021, 43, 102119. [Google Scholar] [CrossRef]
- Zhao, S.; Tang, B.; Musa, S.S.; Ma, S.; Zhang, J.; Zeng, M.; Yun, Q.; Guo, W.; Zheng, Y.; Yang, Z.; et al. Estimating the Generation Interval and Inferring the Latent Period of COVID-19 from the Contact Tracing Data. Epidemics 2021, 36, 100482. [Google Scholar] [CrossRef]
- de Carvalho Hessel Dias, V.M.; Oliveira, A.F.; Marinho, A.K.B.B.; dos Santos Ferreira, C.E.; Domingues, C.E.F.; Fortaleza, C.M.C.B.; de Lacerda Vidal, C.F.; de Maio Carrilho, C.M.D.; Pinheiro, D.O.B.P.; de Assis, D.B.; et al. COVID-19 and Isolation: Risks and Implications in the Scenario of New Variants. Braz. J. Infect. Dis. 2022, 26, 102703. [Google Scholar] [CrossRef]
- Alharbi, M.M.; Rabbani, S.I.; Asdaq, S.M.B.; Alamri, A.S.; Alsanie, W.F.; Alhomrani, M.; Mohzari, Y.; Alrashed, A.; Bamogaddam, R.F.; Alajlan, S.A.; et al. Infection Spread, Recovery, and Fatality from Coronavirus in Different Provinces of Saudi Arabia. Healthcare 2021, 9, 931. [Google Scholar] [CrossRef]
- Mathieu, E.; Ritchie, H.; Rodés-Guirao, L.; Appel, C.; Giattino, C.; Hasell, J.; Macdonald, B.; Dattani, S.; Beltekian, D.; Ortiz-Ospina, E.; et al. Coronavirus Pandemic (COVID-19); Our World in Data Publisher: Oxford, UK, 2020; Available online: https://ourworldindata.org/coronavirus (accessed on 22 November 2022).
- Wesselbaum, D.; Hansen, P. Lockdown Design: Which Features of Lockdowns Are Most Important to COVID-19 Experts? J. R. Soc. N. Z. 2022, 52, 569–579. [Google Scholar] [CrossRef]
- Sy, C.; Ching, P.M.; San Juan, J.L.; Bernardo, E.; Miguel, A.; Mayol, A.P.; Culaba, A.; Ubando, A.; Mutuc, J.E. Systems Dynamics Modeling of Pandemic Influenza for Strategic Policy Development: A Simulation-Based Analysis of the COVID-19 Case. Process Integr. Optim. Sustain. 2021, 5, 461–474. [Google Scholar] [CrossRef]
- Fawzy, M.S.; AlSadrah, S.A. COVID-19 and Saudi Arabia: Awareness, Attitude, and Practice. J. Multidiscip. Healthc. 2022, 15, 1595–1618. [Google Scholar] [CrossRef]
- Kathy, K. Comparing the COVID-19 Vaccines: How Are They Different? Yale Medicine: New Haven, CT, USA, 2022. [Google Scholar]


| Symbol | Name | Description | Units |
|---|---|---|---|
| S | Susceptible | People who have not yet been exposed to the infection but are likely to be vulnerable to the virus | Person |
| E | Exposed | Persons who have been exposed to the virus but have not yet begun to infect others | Person |
| I | Infected | Individuals who are infectious and spread the disease | Person |
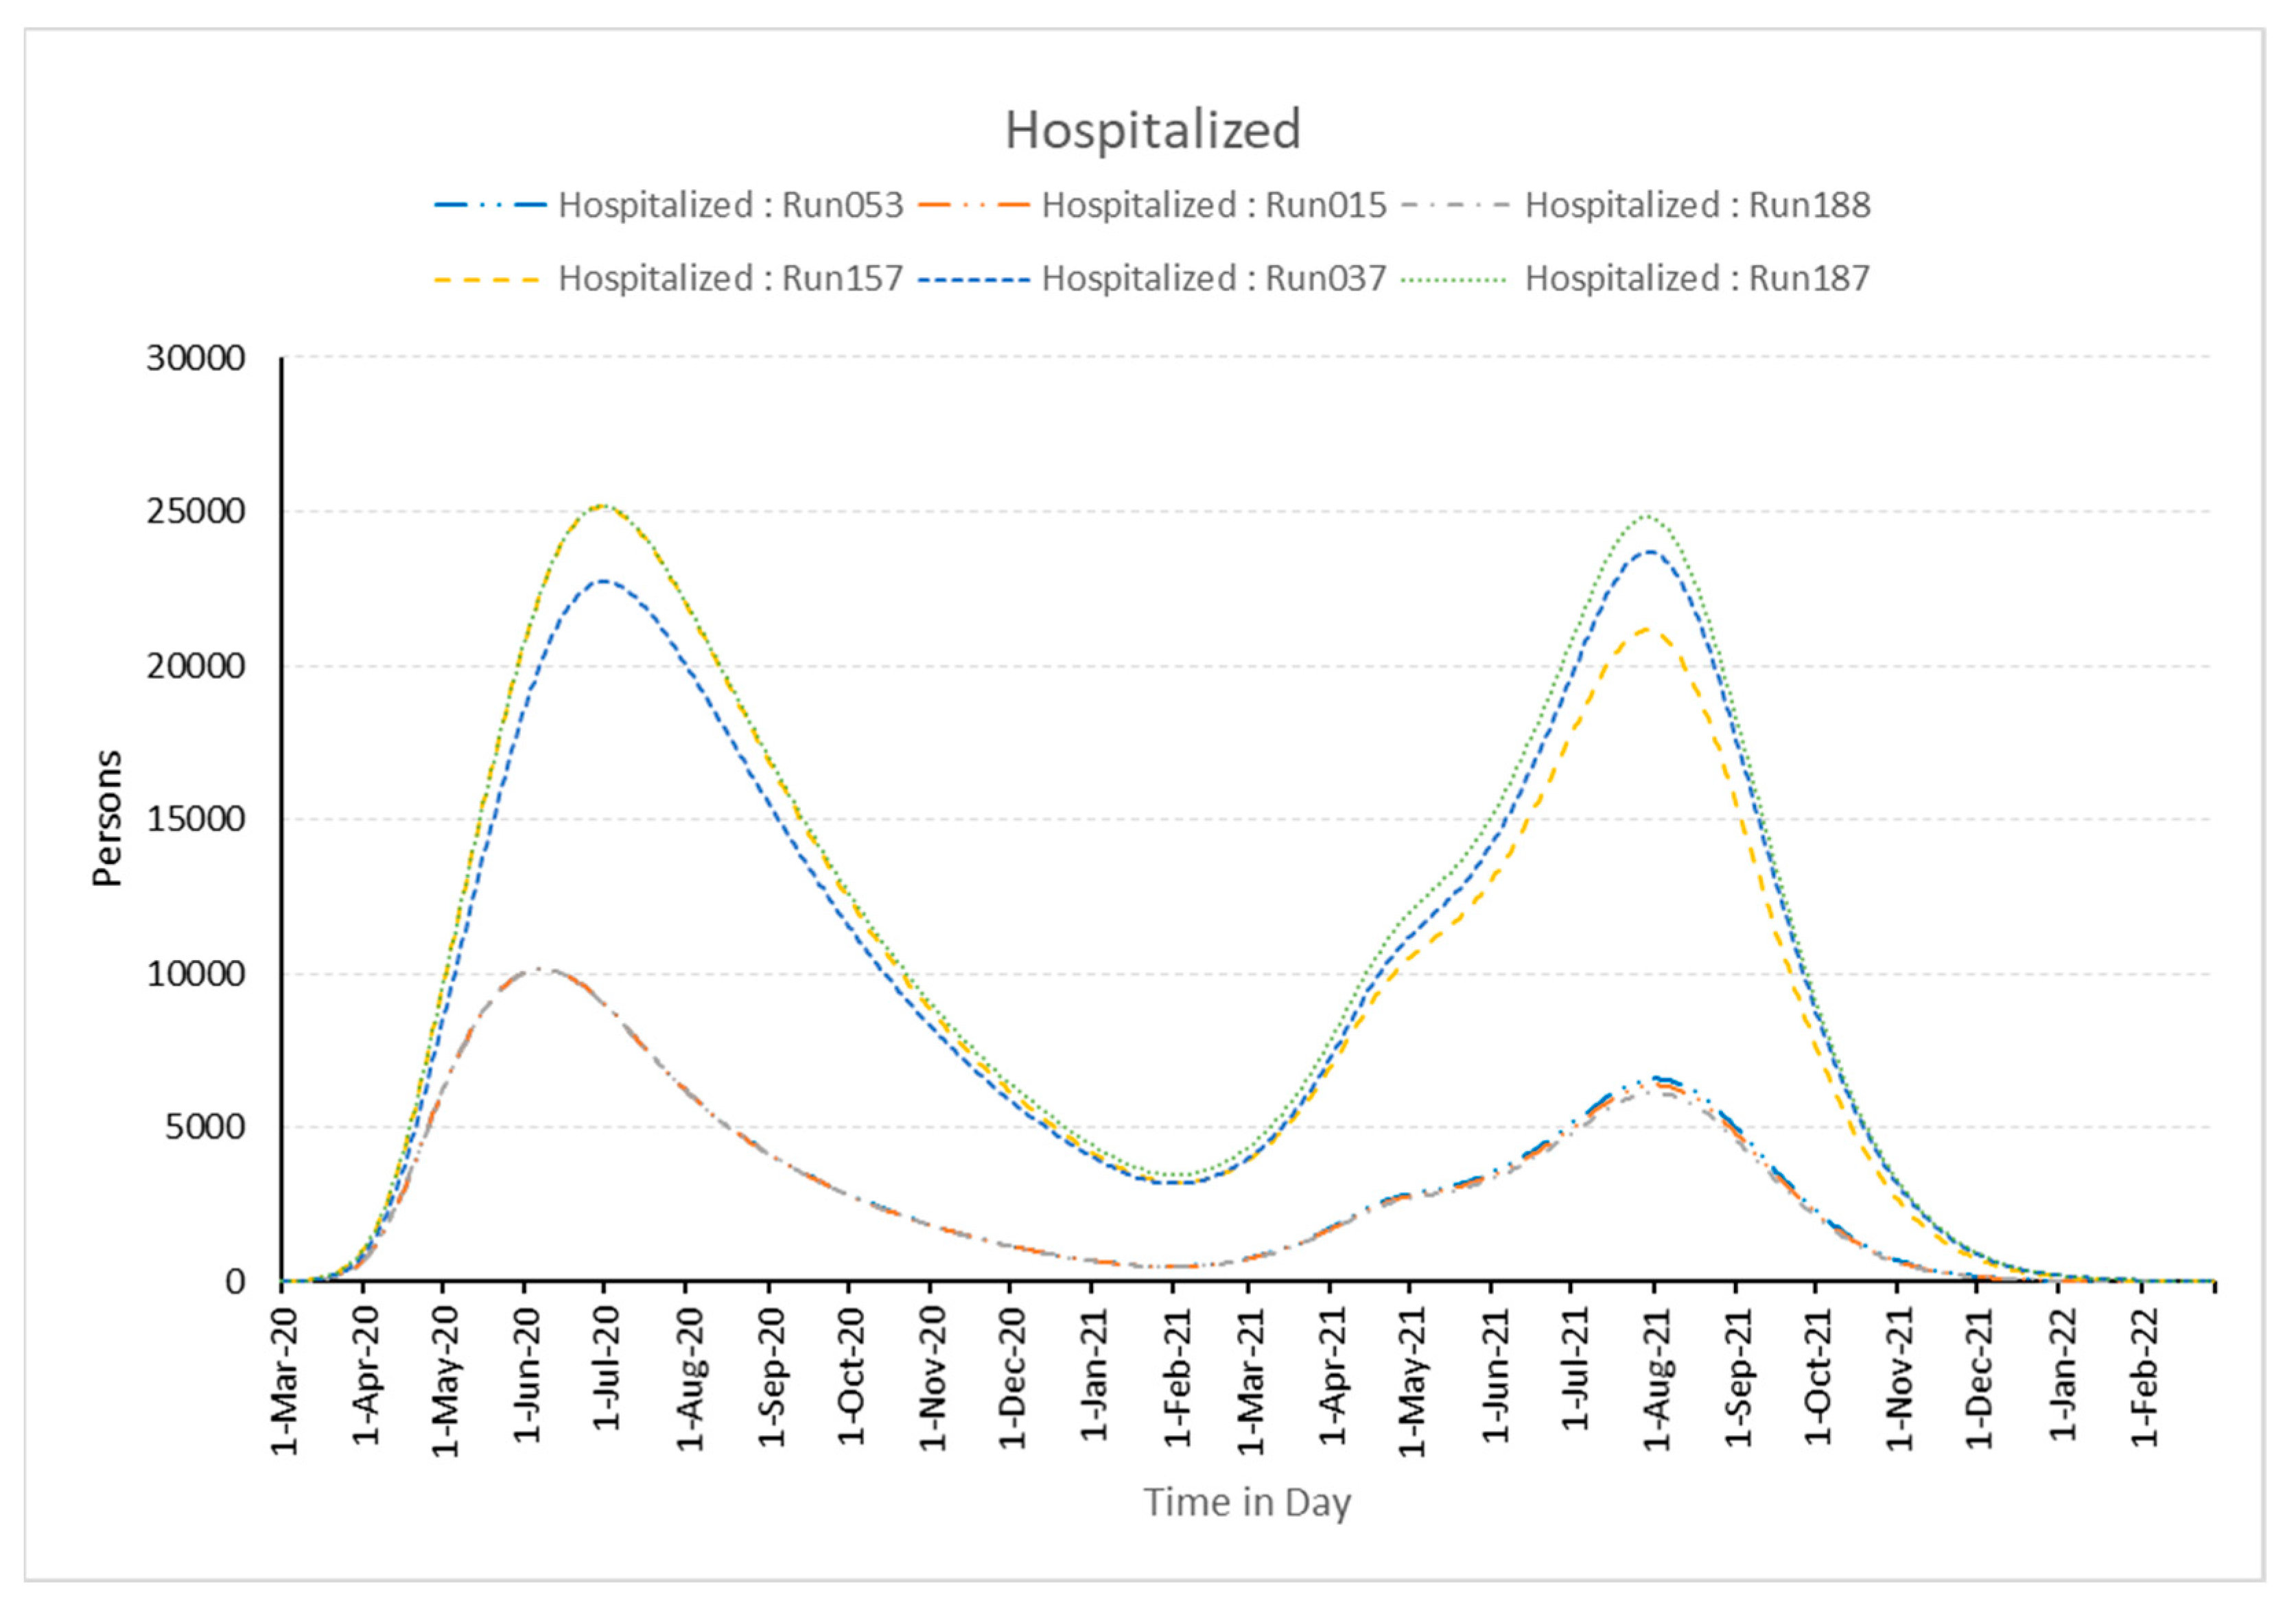
| H | Hospitalized | People treated with infectious diseases in the hospital | Person |
| Is | Isolated | Persons who are not admitted to a hospital for treatment but are instead kept in disconnection | Person |
| R | Recovered | Patients recuperated from COVID-19 | Person |
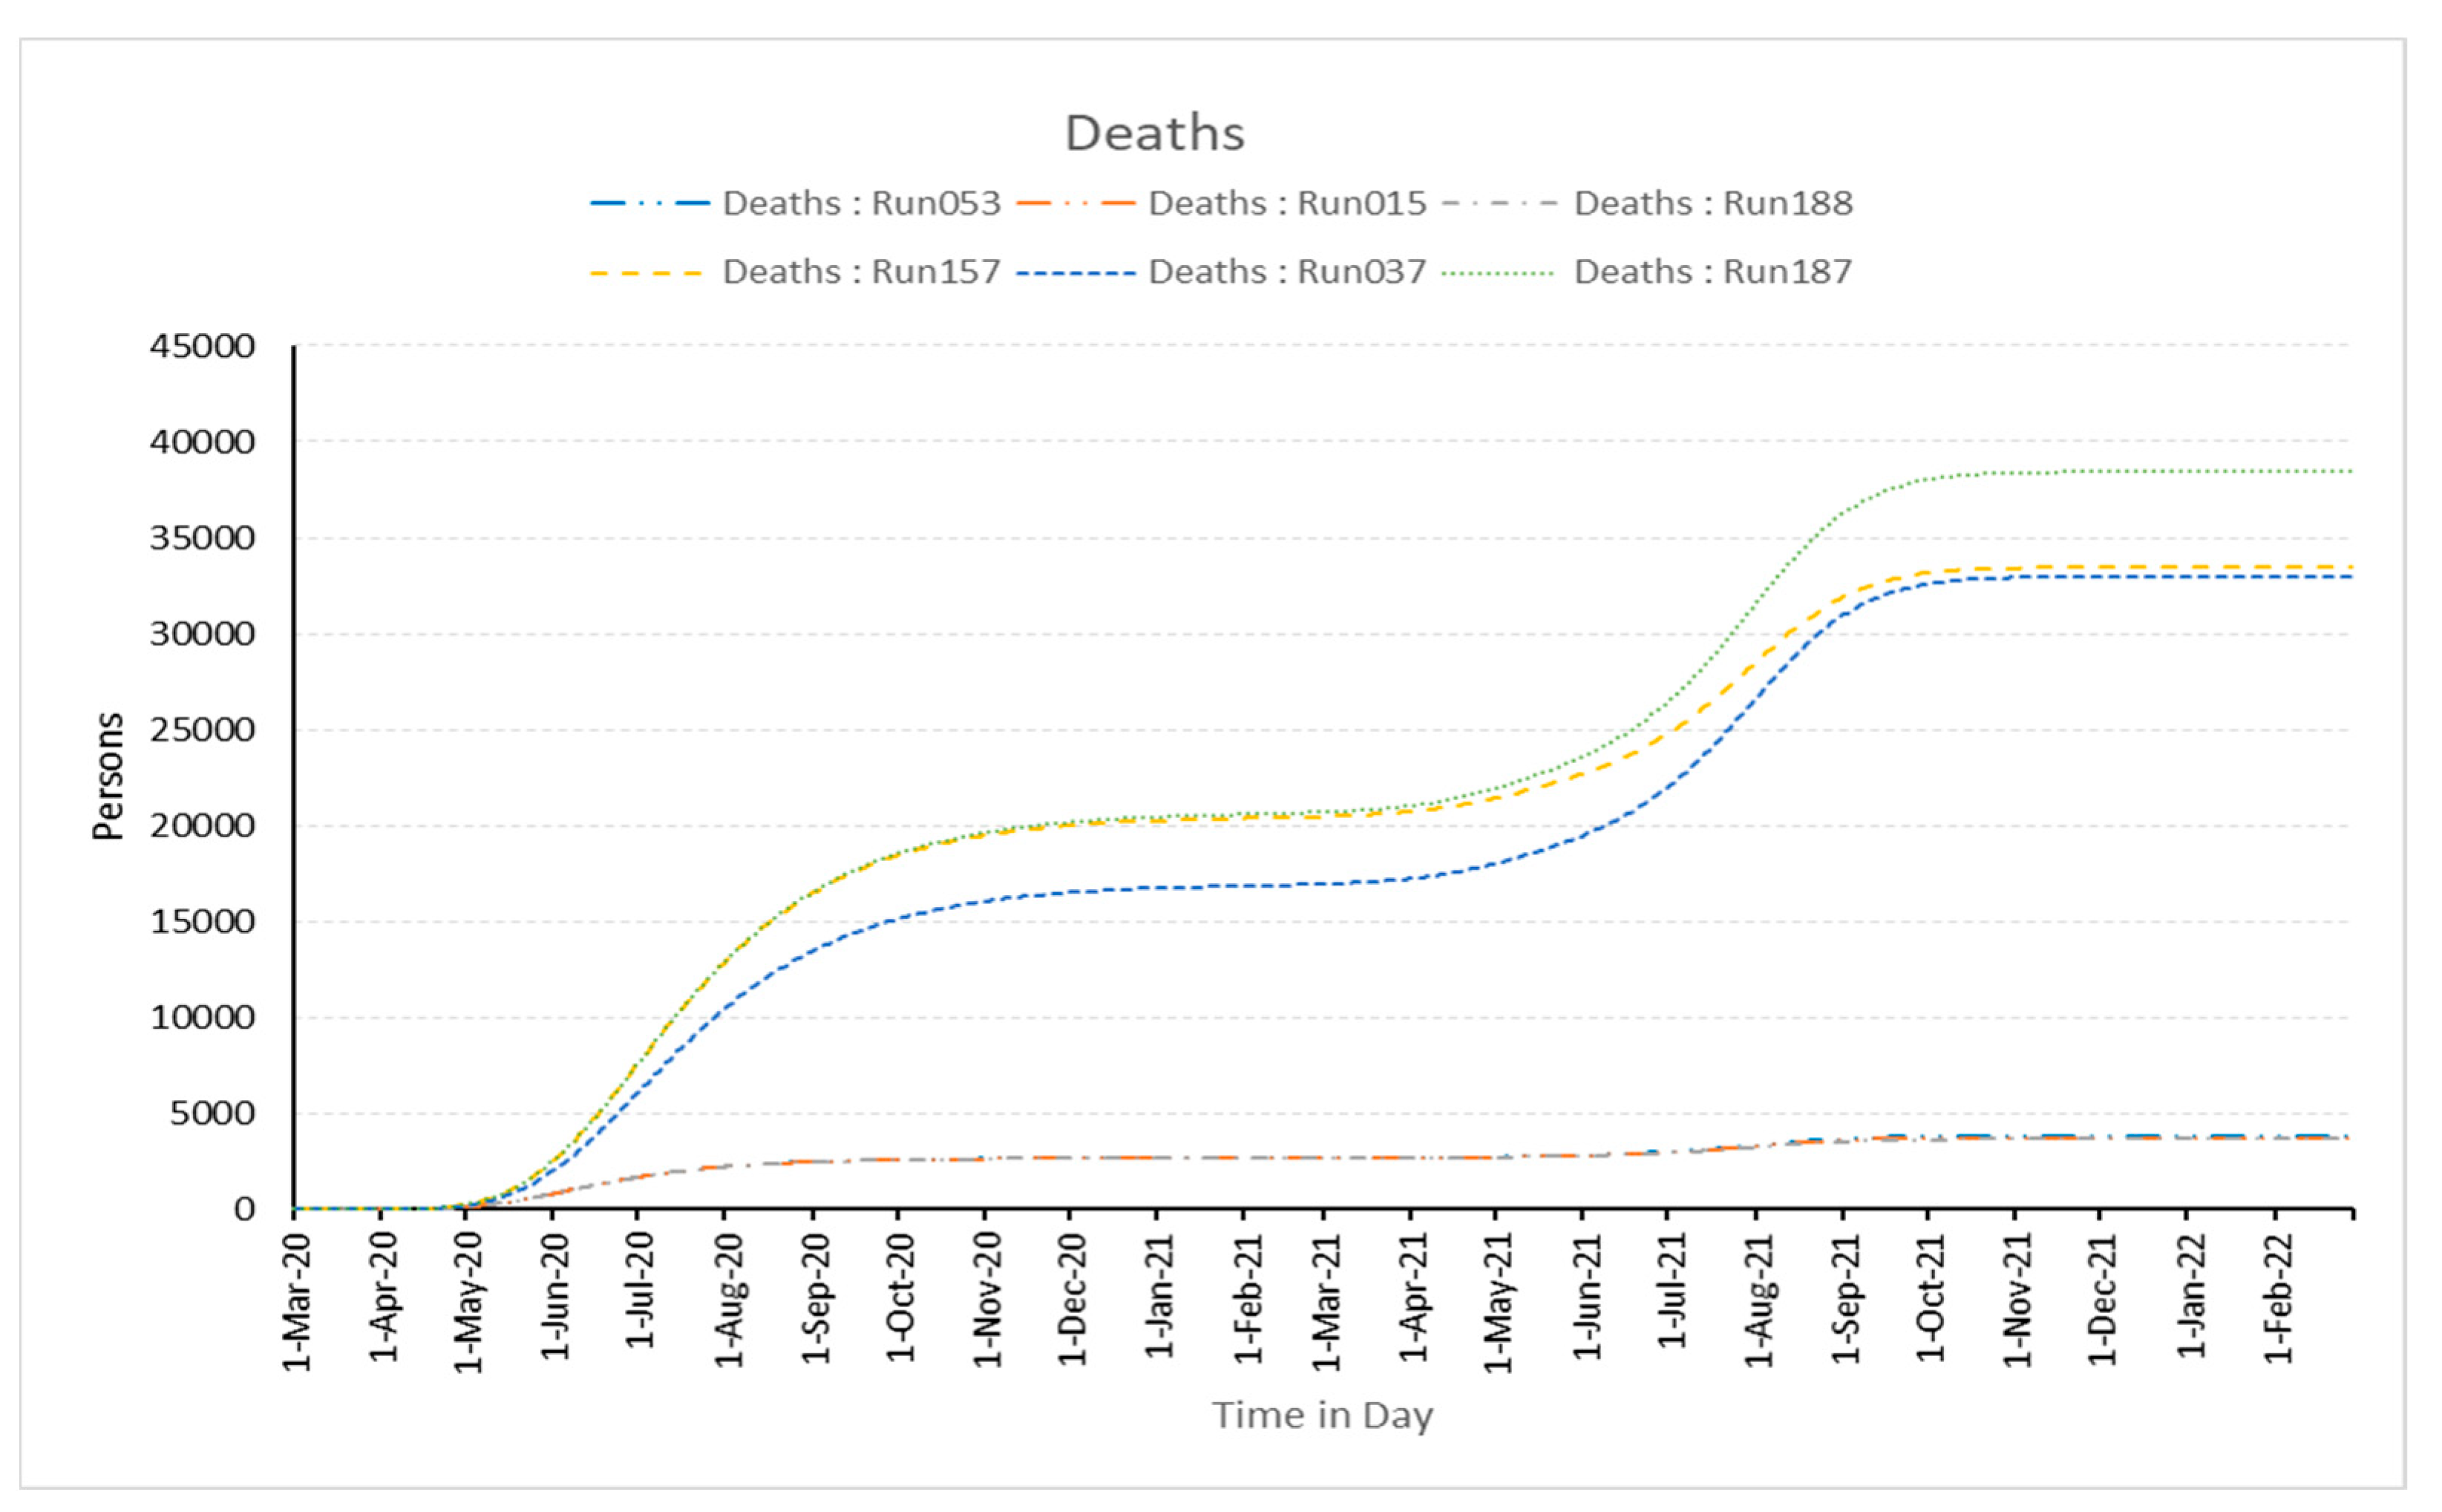
| D | Deaths | Individuals who have succumbed to COVID-19 infection | Person |
| V | Vaccinated | Individuals who have been immunized for COVID-19 infection | Person |
| Capacity | The number of individuals that can be effectively treated by the healthcare system. | Person | |
| IRi | Initial Infection Rate | The infection rate in the absence of any additional influencing elements | 1/Day |
| IR | Infection Rate | The rate at which infection takes place and it depends on several influencing factors | 1/Day |
| HP | Hospitalization Percentage | Admission rate or percentage of the infected population that is hospitalized | 1/Day |
| IHP | Initial Hospitalization Percentage | A normal proportion of infected patients admitted to hospitals | 1/Day |
| μ | Mortality rate | Number of deaths among COVID-19 patients each day | 1/Day |
| IP | Infection Period | Duration of an individual’s infectiousness | Day |
| LT | Latent time | Duration after which the COVID-19 exposed individual becomes contagious | Day |
| timpact | Time of impact | Duration after which the effects of lockdown are felt | Day |
| dseason | Days to seasonal change | The timeframe during which the seasonal impact takes place | Day |
| dachieve | Days to achieve | The timeframe during which the effect of social awareness takes place | Day |
| Ts | Start time | Day of the year when season impact begins | Day |
| TD | Season impact duration | The period during which the effects of the season persist | Day |
| TR | Season impact repeat | Day of the year when season effect recurs | Day |
| TF | Final time | The final time of the simulation | Day |
| IST | Isolation time | Duration of patients in seclusion after which self-recovery takes place | Day |
| RT | Recovery time | Duration of patients in hospital after which recovery takes place through treatment | Day |
| WT | Waning time | Duration after which recovered people lose their immunity and are once more vulnerable to COVID-19 | Day |
| Vaccination per day | Daily doses of vaccines administered | Person/Day | |
| λ | Contact rate | The rate at which individuals come in contact with each other, resulting in disease spread | Dimensionless |
| λNL | No lockdown contact rate | Contact rate when there is no lockdown | Dimensionless |
| SP | Proportion susceptibility | Fraction of the initial population other than susceptible who are located in the less dense region of the social network | Dimensionless |
| φ | Seasonal impact | Seasonal effects on the spread of the pandemic | Dimensionless |
| ρ | Seasonal amplitude | The extent to which the seasons influence the disease’s spread | Dimensionless |
| α | Social awareness | Effect of measures such as social distancing, usage of masks, frequent hand sanitization, etc. | Dimensionless |
| τ | Social awareness impact | The extent to which social awareness influences the control of disease’s spread | Dimensionless |
| R0 | Reproduction number | Number of times the virus reproduces | Dimensionless |
| β | Lockdown plan | Establishing the lockdown plan with start and end times | Dimensionless |
| σ | Stress | The burden on the healthcare system as a result of overloading | Dimensionless |
| ζ | Vaccine efficacy | Effectiveness of immunization | Dimensionless |
| Parameter | Levels | ||
|---|---|---|---|
| E (Initial) | 75 persons | 100 | 12 |
| ρ | Insignificant | Partial significant | Significant |
| τ | Low | high | Very high |
| timpact | 15 days | 30 | 45 |
| WT | 90 days | 180 | 365 |
| Symbol | Values | Symbol | Values |
|---|---|---|---|
| S | 34,810,000 | LT | 14 [69] |
| I | 0 | dseason | 30 |
| H | 0 | dachieve | 60 |
| Is | 0 | IsT | 15 [70] |
| R | 0 | RT | 20 [71] |
| R0 | 3.3 [60,61,62,63,64] | μ | 0.003 [71] |
| D | 0 | Sp | 1 |
| IHP | 0.2 | ζ | 0.95 |
| IP | 7 [65,66] | Data [72] |
| Parameter↓ Runs→ | Best Three Runs in the Best Fitting Order | Worst Three Runs in the Best Fitting Order | ||||
|---|---|---|---|---|---|---|
| 053 | 15 | 188 | 037 | 157 | 187 | |
| timpact | 30 | 30 | 45 | 45 | 45 | 15 |
| E (Initial value) | 75 | 75 | 100 | 125 | 125 | 75 |
| WT | 90 | 180 | 90 | 180 | 90 | 90 |
| τ | high | high | low | low | low | low |
| ρ | significant | significant | significant | significant | significant | partial significant |
Disclaimer/Publisher’s Note: The statements, opinions and data contained in all publications are solely those of the individual author(s) and contributor(s) and not of MDPI and/or the editor(s). MDPI and/or the editor(s) disclaim responsibility for any injury to people or property resulting from any ideas, methods, instructions or products referred to in the content. |
© 2023 by the authors. Licensee MDPI, Basel, Switzerland. This article is an open access article distributed under the terms and conditions of the Creative Commons Attribution (CC BY) license (https://creativecommons.org/licenses/by/4.0/).
Share and Cite
Rehman, A.U.; Mian, S.H.; Usmani, Y.S.; Abidi, M.H.; Mohammed, M.K. Modeling Consequences of COVID-19 and Assessing Its Epidemiological Parameters: A System Dynamics Approach. Healthcare 2023, 11, 260. https://doi.org/10.3390/healthcare11020260
Rehman AU, Mian SH, Usmani YS, Abidi MH, Mohammed MK. Modeling Consequences of COVID-19 and Assessing Its Epidemiological Parameters: A System Dynamics Approach. Healthcare. 2023; 11(2):260. https://doi.org/10.3390/healthcare11020260
Chicago/Turabian StyleRehman, Ateekh Ur, Syed Hammad Mian, Yusuf Siraj Usmani, Mustufa Haider Abidi, and Muneer Khan Mohammed. 2023. "Modeling Consequences of COVID-19 and Assessing Its Epidemiological Parameters: A System Dynamics Approach" Healthcare 11, no. 2: 260. https://doi.org/10.3390/healthcare11020260