
Comparison of Sleep Disturbance, Physical Activity, and Health-Related Quality of Life According to Depressive Symptoms in Patients with Metabolic Syndrome: A Secondary Analysis from the Korea National Health and Nutrition Examination Survey Using a Propensity Score Matching Analysis

Abstract
:1. Introduction
2. Materials and Methods
2.1. Study Design
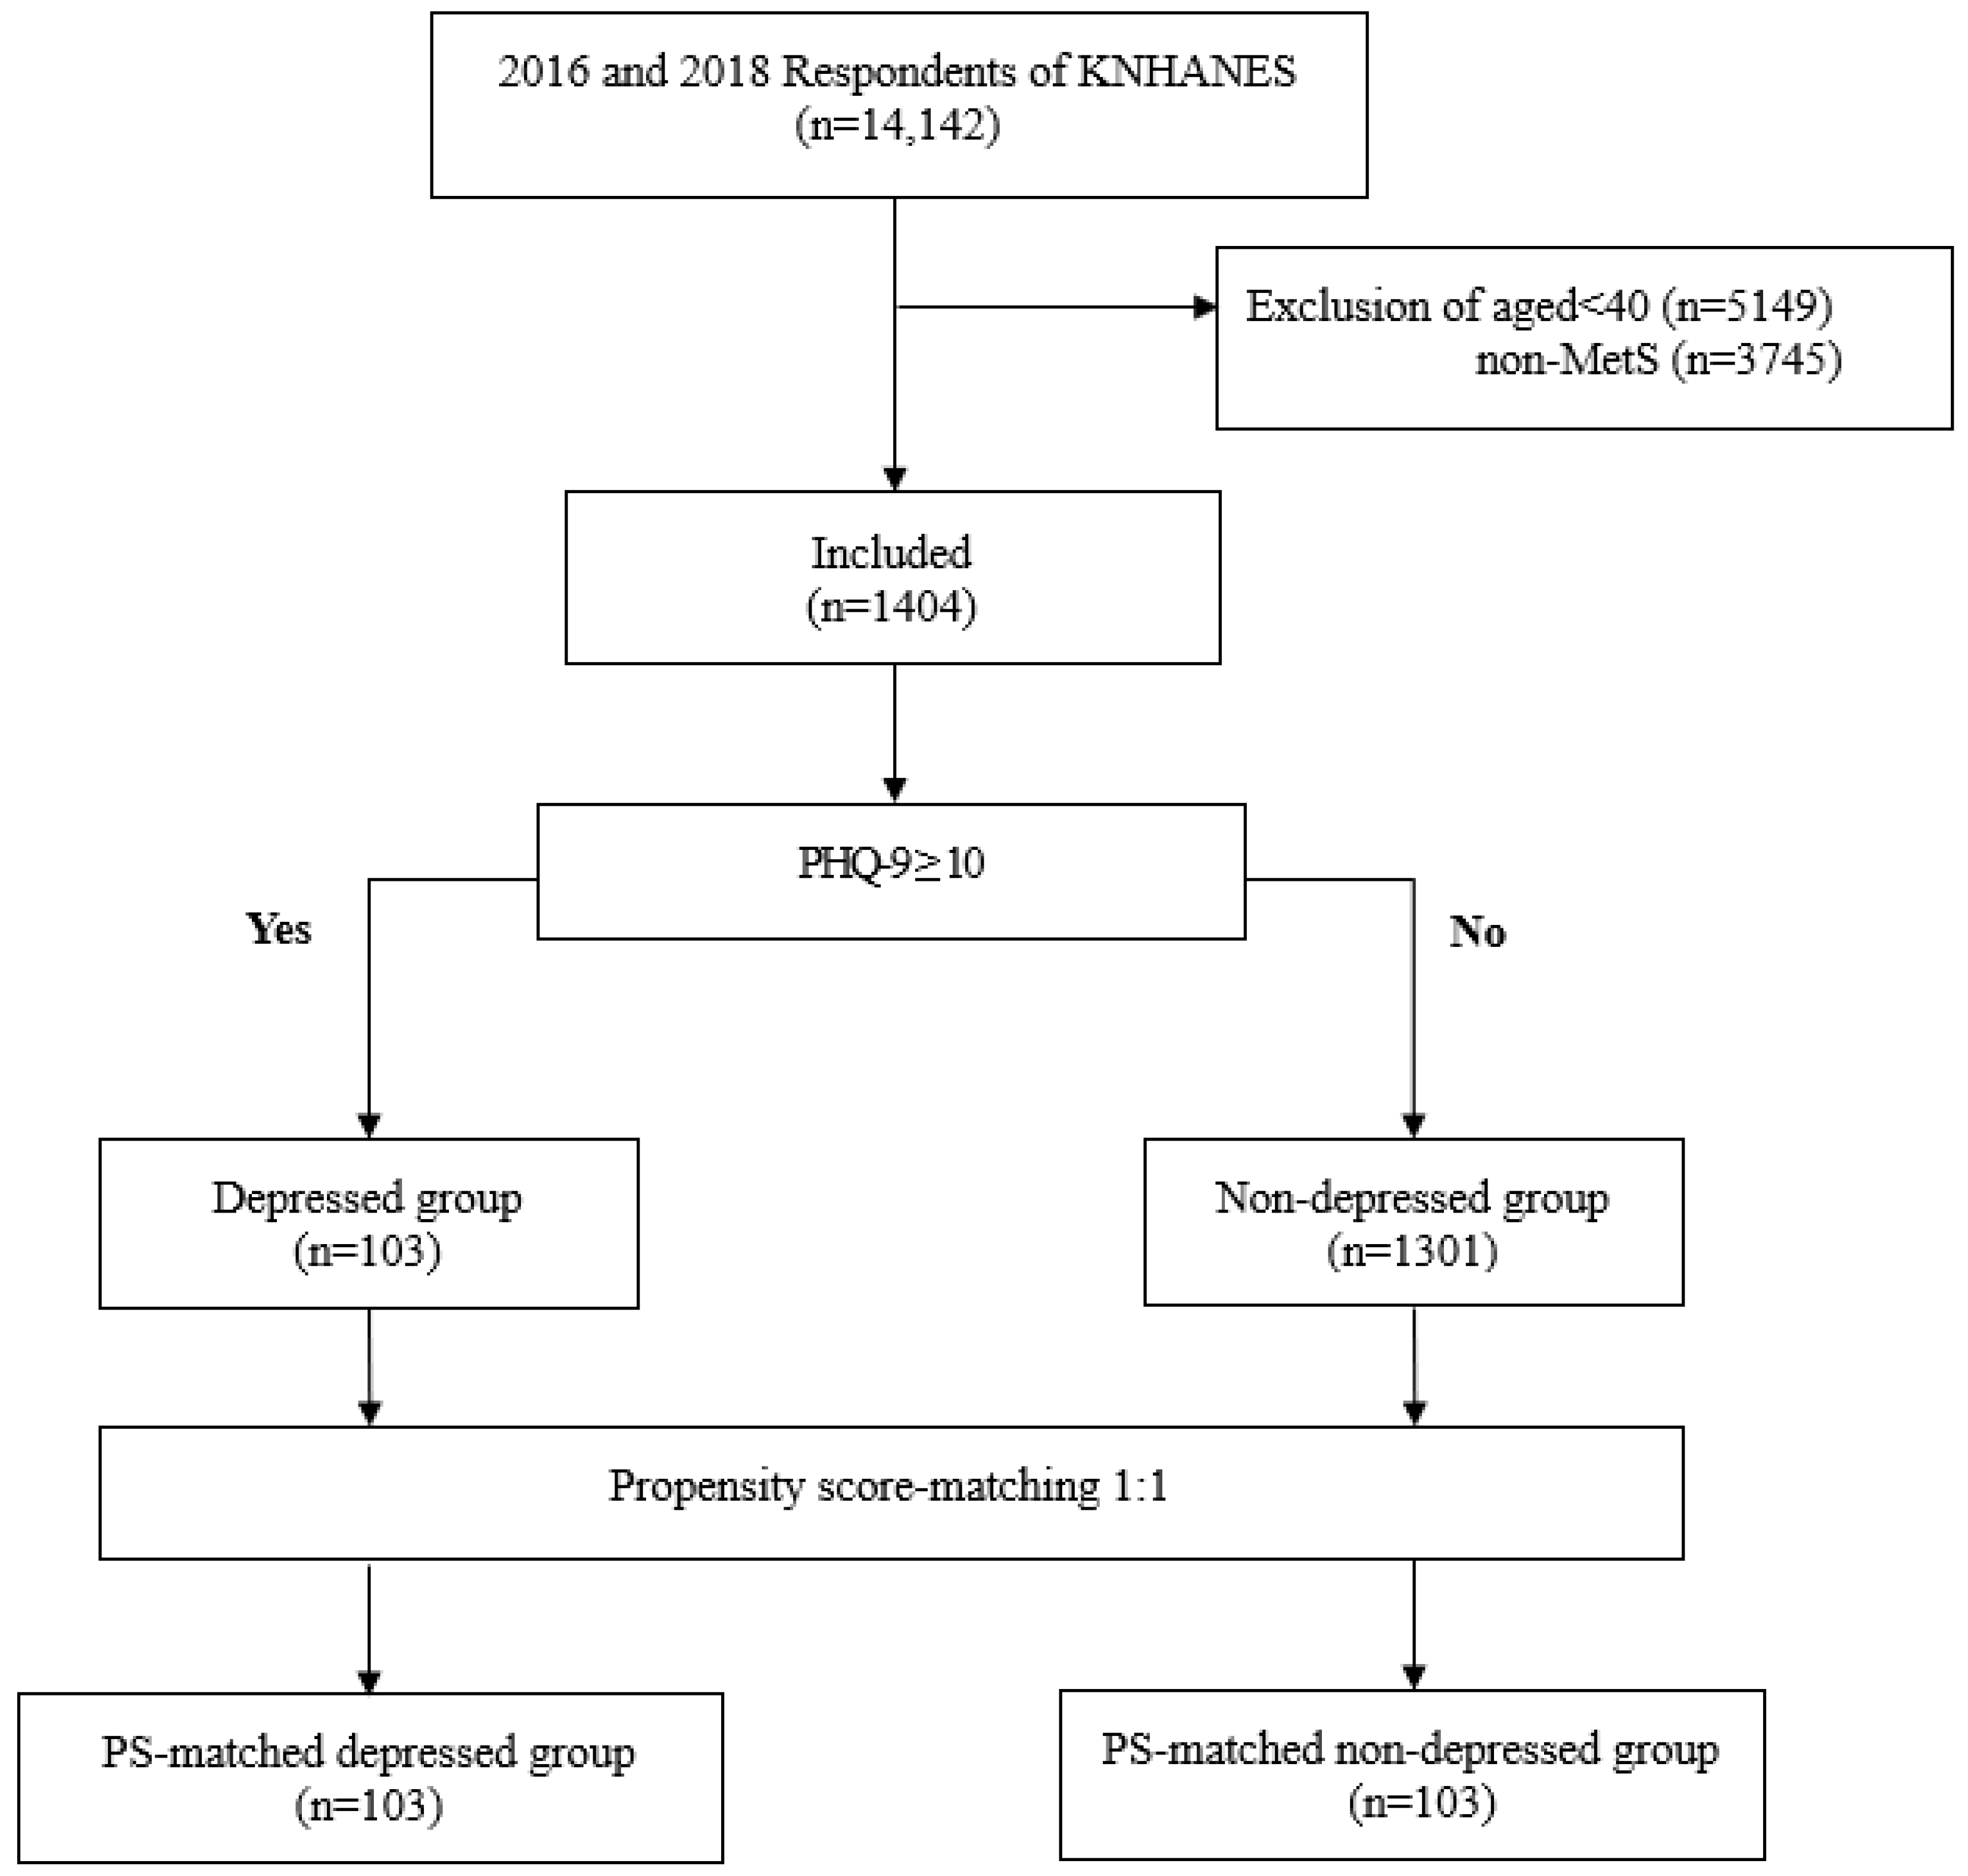
2.2. Data Source and Study Population
2.3. Patient and Public Involvement
2.4. Ethics Statement
2.5. Outcome Measures
2.5.1. Sociodemographic Characteristics
2.5.2. Health Status
2.5.3. Health Behaviors
2.5.4. Health-Related Quality of Life
2.5.5. Depression
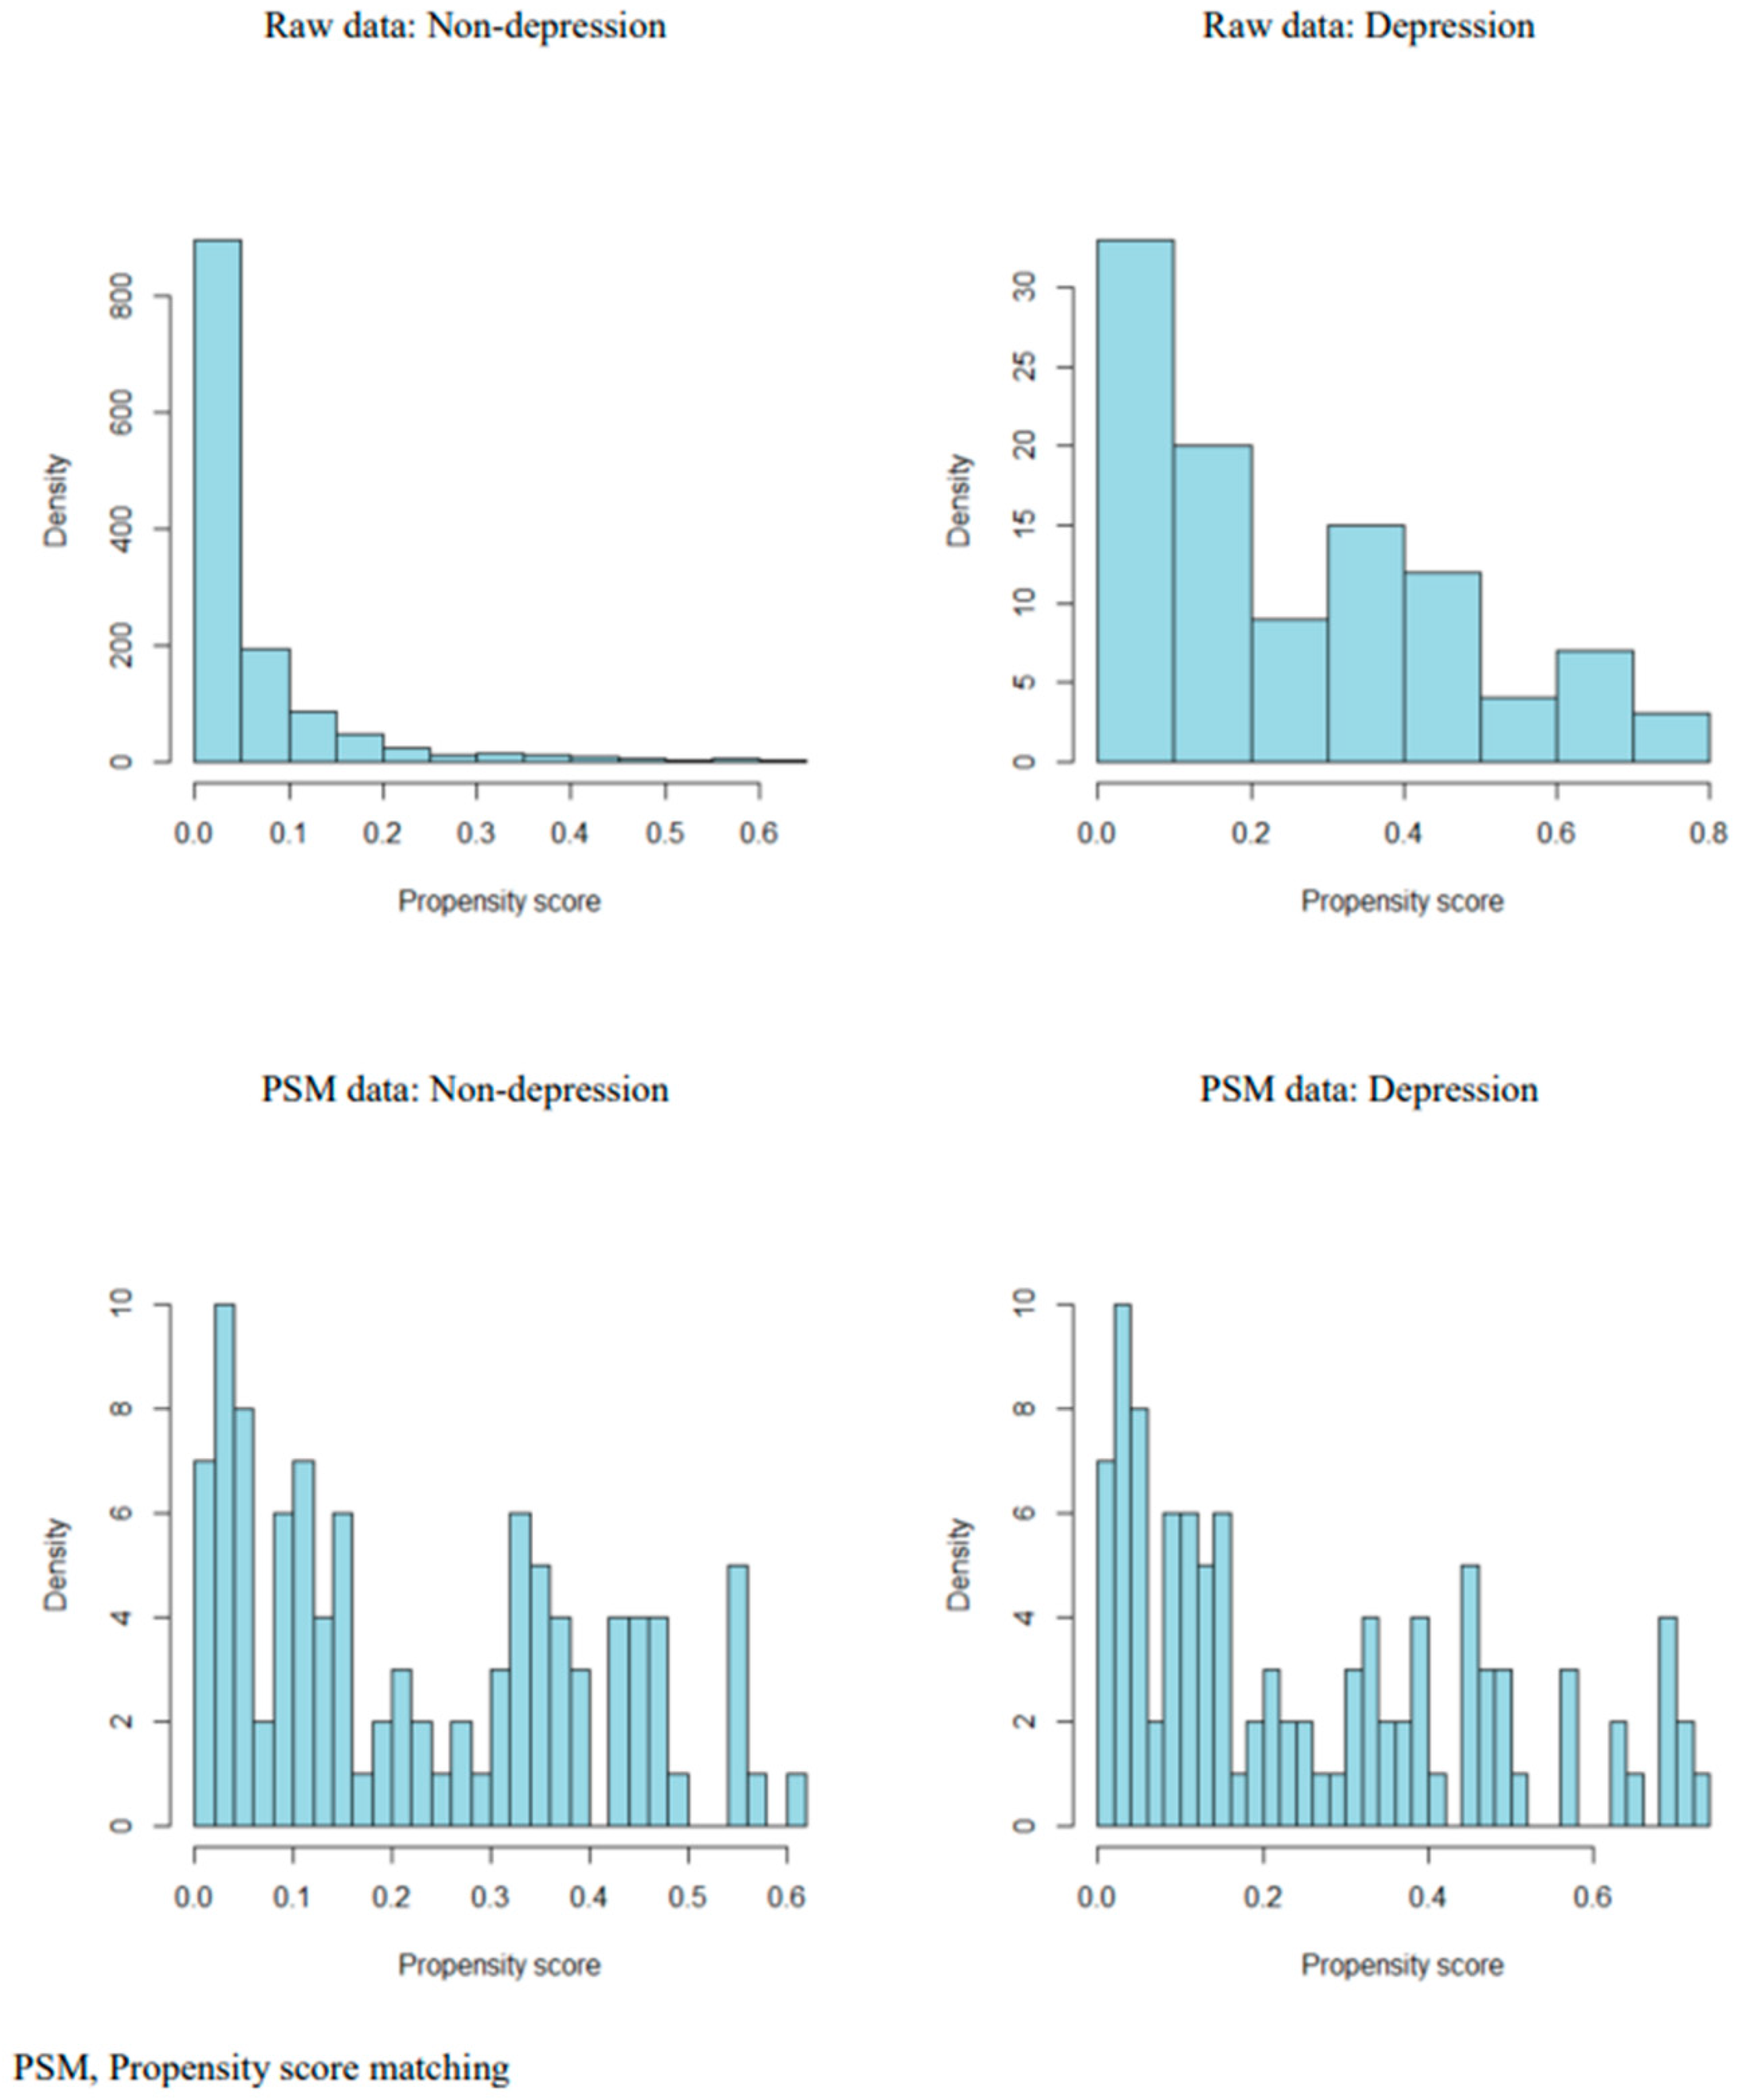
2.6. Data Analysis
3. Results
3.1. Comparison of Sociodemographics before and after PSM between the Two Groups
3.2. Comparison of Health Status Characteristics before and after PSM between the Two Groups
3.3. Comparison of Health-Behavior Variables and HRQoL before and after PSM between the Two Groups
4. Discussion
5. Conclusions
Author Contributions
Funding
Institutional Review Board Statement
Informed Consent Statement
Data Availability Statement
Conflicts of Interest
References
- Ranasinghe, P.; Mathangasinghe, Y.; Jayawardena, R.; Hills, A.; Misra, A. Prevalence and trends of metabolic syndrome among adults in the asia-pacific region: A systematic review. BMC Public Health 2017, 17, 101. [Google Scholar] [CrossRef] [Green Version]
- Grundy, S.M.; Cleeman, J.I.; Daniels, S.R.; Donato, K.A.; Eckel, R.H.; Franklin, B.A.; Gordon, D.J.; Krauss, R.M.; Savage, P.J.; Smith, S.C., Jr. Diagnosis and management of the metabolic syndrome: An American Heart Association/National Heart, Lung, and Blood Institute scientific statement. Circulation 2005, 112, 2735–2752. [Google Scholar] [CrossRef] [Green Version]
- Alberti, K.G.; Eckel, R.H.; Grundy, S.M.; Zimmet, P.Z.; Cleeman, J.I.; Donato, K.A.; Fruchart, J.-C.; James, W.P.T.; Loria, C.M.; Smith, S.C., Jr. Harmonizing the metabolic syndrome: A joint interim statement of the international diabetes federation task force on epidemiology and prevention; national heart, lung, and blood institute; American heart association; world heart federation; international atherosclerosis society; and international association for the study of obesity. Circulation 2009, 120, 1640–1645. [Google Scholar] [CrossRef] [Green Version]
- Jellinger, P.S.; Handelsman, Y.; Rosenblit, P.D.; Bloomgarden, Z.T.; Fonseca, V.A.; Garber, A.J.; Grunberger, G.; Guerin, C.K.; Bell, D.S.; Mechanick, J.I. American Association of Clinical Endocrinologists and American College of Endocrinology guidelines for management of dyslipidemia and prevention of cardiovascular disease. Endocr. Pract. 2017, 23, 1–87. [Google Scholar] [CrossRef] [Green Version]
- Koren, D.; Dumin, M.; Gozal, D. Role of sleep quality in the metabolic syndrome. Diabetes Metab. Syndr. Obes. 2016, 9, 281–310. [Google Scholar] [CrossRef] [Green Version]
- Korean Society of Lipidology and Atherosclerosis. Fact Sheets: Dyslipidemia Fact Sheet in Korea 2015. Available online: http://www.lipid.or.kr/file/Dyslipidemia%20fact%20sheet_kor_Final.pdf (accessed on 3 August 2018).
- Park, E.; Choi, S.J.; Lee, H.Y. The prevalence of metabolic syndrome and related risk factors based on the KNHANES V 2010. J. Agric. Med. Community Health 2013, 38, 1–13. [Google Scholar] [CrossRef] [Green Version]
- Ra, J.S.; Kim, H.S. Psychosocial factors associated with metabolic syndrome among Korean men and women aged over 40 years. J. Korean Public Health Nurs. 2019, 33, 20–32. [Google Scholar] [CrossRef]
- Anderson, R.J.; Freedland, K.E.; Clouse, R.E.; Lustman, P.J. The prevalence of comorbid depression in adults with diabetes: A meta-analysis. Diabetes Care 2001, 24, 1069–1078. [Google Scholar] [CrossRef] [Green Version]
- Hare, D.L.; Toukhsati, S.R.; Johansson, P.; Jaarsma, T. Depression and cardiovascular disease: A clinical review. Eur. Heart J. 2014, 35, 1365–1372. [Google Scholar] [CrossRef] [Green Version]
- Ho, C.S.; Zhang, M.W.; Mak, A.; Ho, R.C. Metabolic syndrome in psychiatry: Advances in understanding and management. Adv. Psychiatr. Treat. 2014, 20, 101–112. [Google Scholar] [CrossRef] [Green Version]
- Ho, R.C.; Chua, A.C.; Tran, B.X.; Choo, C.C.; Husain, S.F.; Vu, G.T.; McIntyre, R.S.; Ho, C.S. Factors associated with the risk of developing coronary artery disease in medicated patients with major depressive disorder. Int. J. Environ. Res. Public Health 2018, 15, 2073. [Google Scholar] [CrossRef] [Green Version]
- Pan, A.; Keum, N.; Okereke, O.I.; Sun, Q.; Kivimaki, M.; Rubin, R.R.; Hu, F.B. Bidirectional association between depression and metabolic syndrome: A systematic review and meta-analysis of epidemiological studies. Diabetes Care 2012, 35, 1171–1180. [Google Scholar] [CrossRef] [Green Version]
- Park, S.J.; Roh, S.; Hwang, J.; Kim, H.A.; Kim, S.; Lee, T.K.; Kang, S.H.; Ha, Y.J.; Jang, J.W.; Park, S. Association between depression and metabolic syndrome in korean women: Results from the korean national health and nutrition examination survey (2007–2013). J. Affect. Disord. 2016, 205, 393–399. [Google Scholar] [CrossRef]
- Skilton, M.R.; Moulin, P.; Terra, J.L.; Bonnet, F. Associations between anxiety, depression, and the metabolic syndrome. Biol. Psychiatry 2007, 62, 1251–1257. [Google Scholar] [CrossRef]
- Taheri, S.; Lin, L.; Austin, D.; Young, T.; Mignot, E. Short sleep duration is associated with reduced leptin, elevated ghrelin, and increased body mass index. PLoS Med. 2004, 1, e62. [Google Scholar] [CrossRef] [PubMed]
- Yoon, D.H.; Park, J.H.; Cho, S.C.; Park, M.J.; Kim, S.S.; Choi, S.H.; Choi, S.Y.; Jeong, I.K.; Lee, C.M.; Shin, C.S. Depressive symptomatology and metabolic syndrome in Korean women. Korean J. Obes. 2005, 14, 213–219. [Google Scholar]
- Hall, M.H.; Muldoon, M.F.; Jennings, J.R.; Buysse, D.J.; Flory, J.D.; Manuck, S.B. Self-reported sleep duration is associated with the metabolic syndrome in midlife adults. Sleep 2008, 31, 635–643. [Google Scholar] [CrossRef] [PubMed]
- Tchernof, A.; Després, J.P. Pathophysiology of human visceral obesity: An update. Physiol. Rev. 2013, 93, 359–404. [Google Scholar] [CrossRef] [PubMed] [Green Version]
- Bao, Y.P.; Han, Y.; Ma, J.; Wang, R.J.; Shi, L.; Wang, T.Y.; He, J.; Yue, J.L.; Shi, J.; Tang, X.D.; et al. Cooccurrence and bidirectional prediction of sleep disturbances and depression in older adults: Meta-analysis and systematic review. Neurosci. Biobehav. Rev. 2017, 75, 257–273. [Google Scholar] [CrossRef]
- Zhai, L.; Zhang, H.; Zhang, D. Sleep duration and depression among adults: A meta-analysis of prospective studies. Depress. Anxiety 2015, 32, 664–670. [Google Scholar] [CrossRef]
- Depner, C.M.; Melanson, E.L.; Eckel, R.H.; Snell-Bergeon, J.K.; Perreault, L.; Bergman, B.C.; Higgins, J.A.; Guerin, M.K.; Stothard, E.R.; Morton, S.J.; et al. Ad libitum weekend recovery sleep fails to prevent metabolic dysregulation during a repeating pattern of insufficient sleep and weekend recovery sleep. Curr. Biol. 2019, 29, 957–967.e954. [Google Scholar] [CrossRef] [Green Version]
- Son, S.M.; Park, E.J.; Cho, Y.H.; Lee, S.Y.; Choi, J.I.; Lee, Y.I.; Kim, Y.J.; Lee, J.G.; Yi, Y.H.; Tak, Y.J.; et al. Association between weekend catch-up sleep and metabolic syndrome with sleep restriction in Korean adults: A cross-sectional study using KNHANES. Diabetes Metab. Syndr. Obes. 2020, 13, 1465–1471. [Google Scholar] [CrossRef] [PubMed]
- Kelley, G.A.; Kelley, K.S. Effects of aerobic exercise on C-reactive protein, body composition, and maximum oxygen consumption in adults: A meta-analysis of randomized controlled trials. Metabolism 2006, 55, 1500–1507. [Google Scholar] [CrossRef] [PubMed]
- Roussel, M.; Garnier, S.; Lemoine, S.; Gaubert, I.; Charbonnier, L.; Auneau, G.; Mauriège, P. Influence of a walking program on the metabolic risk profile of obese postmenopausal women. Menopause 2009, 16, 566–575. [Google Scholar] [CrossRef]
- Heesch, K.C.; van Gellecum, Y.R.; Burton, N.W.; van Uffelen, J.G.; Brown, W.J. Physical activity, walking, and quality of life in women with depressive symptoms. Am. J. Prev. Med. 2015, 48, 281–291. [Google Scholar] [CrossRef] [Green Version]
- Nam, J.Y.; Kim, J.; Cho, K.H.; Choi, J.; Shin, J.; Park, E.-C. The impact of sitting time and physical activity on major depressive disorder in South Korean adults: A cross-sectional study. BMC Psychiatry 2017, 17, 274. [Google Scholar] [CrossRef] [Green Version]
- Sumlin, L.L.; Garcia, T.J.; Brown, S.A.; Winter, M.A.; Garcia, A.A.; Brown, A.; Cuevas, H.E. Depression and adherence to lifestyle changes in type 2 diabetes: A systematic review. Diabetes Educ. 2014, 40, 731–744. [Google Scholar] [CrossRef] [PubMed]
- Won, M.H. Mediating effect of physical activity in the relationship between depressive symptoms and health-related quality of life in patients with coronary artery disease: The 2016 nationwide community health survey in Korea. Korean J. Adult Nurs. 2019, 31, 691–700. [Google Scholar] [CrossRef]
- [Dataset] Korea Disease Control and Prevention Agency. Korea National Health & Nutrition Examination Survey VII. Available online: https://knhanes.kdca.go.kr/knhanes/sub03/sub03_02_05.do (accessed on 1 July 2020).
- Kwon, K.M.; Lee, J.S.; Jeon, N.E.; Kim, Y.H. Factors associated with health-related quality of life in Koreans aged over 50 Years: The fourth and fifth Korea National Health and Nutrition Examination Survey. Health Qual. Life Outcomes 2017, 15, 243. [Google Scholar] [CrossRef]
- Kroenke, K.; Spitzer, R.L. The PHQ-9: A new depression diagnostic and severity measure. Psychiatr. Ann. 2002, 32, 509–515. [Google Scholar] [CrossRef] [Green Version]
- Han, C.; Jo, S.A.; Kwak, J.H.; Pae, C.U.; Steffens, D.; Jo, I.; Park, M.H. Validation of the Patient Health Questionnaire-9 Korean version in the elderly population: The Ansan Geriatric study. Compr. Psychiatry 2008, 49, 218–223. [Google Scholar] [CrossRef]
- Choi, O.J.; Hwang, S.Y. A comparison of the prevalence of cardiovascular disease and lifestyle habits by disability status and type of disability in Korean adults: A propensity score matching analysis. J. Korean Acad. Community Health Nurs. 2020, 31, 534–548. [Google Scholar] [CrossRef]
- Park, S.; Park, Y.H. Predictors of physical activity in Korean older adults: Distinction between urban and rural areas. J. Korean Acad. Nurs. 2010, 40, 191–201. [Google Scholar] [CrossRef] [Green Version]
- Rabin, R.; de Charro, F. EQ-5D: A measure of health status from the EuroQol Group. Ann. Med. 2001, 33, 337–343. [Google Scholar] [CrossRef] [PubMed]
- Guo, S.; Fraser, M.W. Propensity Score Analysis: Statistical Methods and Applications, 2nd ed.; SAGE Publication: Thousand Oaks, CA, USA, 2014. [Google Scholar]
- Lee, D.K. An introduction to propensity score matching methods. Anesth. Pain Med. 2016, 11, 130–148. [Google Scholar] [CrossRef] [Green Version]
- Moon, H.J.; Kim, D.S.; Kim, K.K. An anaysis of health behavior among professional military personnel using propensity score matching. Korean J. Health Educ. Promot. 2021, 38, 1–12. [Google Scholar] [CrossRef]
- Choi, S.H.; Hwang, S.Y. Lifestyle and quality of life in patients with coronary artery disease: Apropensity-mathed comparison with a healthy control group. Korean J. Adult Nurs. 2020, 32, 199–208. [Google Scholar] [CrossRef]
- Rosenbaum, P.R.; Rubin, D.B. Constructing a control group using multivariate matched sampling methods that incorporate the propensity score. Am. Stat. 1985, 39, 33–38. [Google Scholar]
- Tran, B.X.; Nguyen, H.T.; Le, H.T.; Latkin, C.A.; Pham, H.Q.; Vu, L.G.; Le, X.T.T.; Nguyen, T.T.; Pham, Q.T.; Ta, N.T.K.; et al. Impact of COVID-19 on economic well-being and quality of life of the Vietnamese during the national social distancing. Front. Psychol. 2020, 11, 565153. [Google Scholar] [CrossRef] [PubMed]
- Tran, B.X.; Dang, A.K.; Truong, N.T.; Ha, G.H.; Nguyen, H.L.; Do, H.N.; Nguyen, T.Q.; Latkin, C.A.; Ho, C.S.; Ho, R.C. Depression and quality of life among patients living with HIV/AIDS in the era of universal treatment access in Vietnam. Int. J. Environ. Res. Public Health 2018, 15, 2888. [Google Scholar] [CrossRef] [Green Version]
- Nguyen, S.H.; Nguyen, L.H.; Vu, G.T.; Nguyen, C.T.; Le, T.H.T.; Tran, B.X.; Latkin, C.A.; Ho, C.S.H.; Ho, R.C.M. Health-related quality of life impairment among patients with different skin diseases in Vietnam: A cross-sectional study. Int. J. Env. Res. Public Health 2019, 16, 305. [Google Scholar] [CrossRef] [Green Version]
- Ngo, C.Q.; Phan, P.T.; Vu, G.V.; Pham, Q.L.T.; Nguyen, L.H.; Vu, G.T.; Tran, T.T.; Nguyen, H.L.T.; Tran, B.X.; Latkin, C.A.; et al. Effects of different comorbidities on health-related quality of life among respiratory patients in Vietnam. J. Clin. Med. 2019, 8, 214. [Google Scholar] [CrossRef] [Green Version]
- Nguyen, A.T.; Nguyen, L.H.; Nguyen, T.X.; Nguyen, H.T.T.; Nguyen, T.N.; Pham, H.Q.; Tran, B.X.; Latkin, C.A.; Ho, C.S.H.; Ho, R.C.M.; et al. Frailty prevalence and association with health-related quality of life impairment among rural community-dwelling older adults in Vietnam. Int. J. Environ. Res. Public Health 2019, 16, 3869. [Google Scholar] [CrossRef] [Green Version]
- Okosun, I.S.; Annor, F.; Esuneh, F.; Okoegwale, E.E. Metabolic syndrome and impaired health-related quality of life and in non-Hispanic White, non-Hispanic Blacks and Mexican-American Adults. Diabetes Metab. Syndr. 2013, 7, 154–160. [Google Scholar] [CrossRef]
- Ford, E.S.; Li, C. Metabolic syndrome and health-related quality of life among U.S. adults. Ann. Epidemiol. 2008, 18, 165–171. [Google Scholar] [CrossRef]
- Saboya, P.P.; Bodanese, L.C.; Zimmermann, P.R.; Gustavo, A.D.; Assumpção, C.M.; Londero, F. Metabolic syndrome and quality of life: A systematic review. Rev. Lat. Am. Enferm. 2016, 24, e2848. [Google Scholar] [CrossRef] [Green Version]
- Ferri, S.; Stefanini, B.; Minguzzi, M.; Leoni, S.; Capelli, R.; Secomandi, A.; Chen, R.; Abbati, C.; Santangeli, E.; Mattarozzi, K.; et al. Effects of COVID-19 pandemic on metabolic status and psychological correlates of a cohort of Italian NAFLD outpatients. Nutrients 2023, 15, 1445. [Google Scholar] [CrossRef] [PubMed]
- Lee, Y.J. Gender differences in factors associated with the severity of depression in middle-aged adults: An analysis of 2014 Korean National Health and Nutrition Examination Survey. J. Korea Converg. Soc. 2018, 9, 549–559. [Google Scholar] [CrossRef]
- Katano, S.; Nakamura, Y.; Nakamura, A.; Murakami, Y.; Tanaka, T.; Takebayashi, T.; Okayama, A.; Miura, K.; Okamura, T.; Ueshima, H. Relationship between sleep duration and clustering of metabolic syndrome diagnostic components. Diabetes Metab. Syndr. Obes. 2011, 4, 119–125. [Google Scholar] [CrossRef] [PubMed] [Green Version]
- Watson, N.F.; Harden, K.P.; Buchwald, D.; Vitiello, M.V.; Pack, A.I.; Strachan, E.; Goldberg, J. Sleep duration and depressive symptoms: A gene-environment interaction. Sleep 2014, 37, 351–358. [Google Scholar] [CrossRef] [Green Version]


| Characteristics | Categories | Total (n = 1404) | Before PSM | After PSM | ||||
|---|---|---|---|---|---|---|---|---|
| Non- Depressed (n = 1301) | Depressed (n = 103) | p | Non- Depressed (n = 103) | Depressed (n = 103) | p | |||
| n (Weighted %)/Mean (SE) | n (Weighted %)/Mean (SE) | n (Weighted %)/Mean (SE) | n (Weighted %)/Mean (SE) | n (Weighted %)/Mean (SE) | ||||
| Sex | Male | 565 (48.5) | 530 (48.7) | 35 (45.2) | 0.561 | 35 (46.5) | 35 (45.2) | 0.875 |
| Female | 839 (51.5) | 771 (51.3) | 68 (54.8) | 68 (53.5) | 68 (54.8) | |||
| Age (years) | 59.86 (0.76) | 59.51 (0.41) | 60.21 (1.45) | 0.650 | 58.39 (1.51) | 60.21 (1.45) | 0.395 | |
| Education | ≤Elementary school | 534 (29.4) | 482 (28.7) | 52 (38.8) | 0.312 | 46 (32.0) | 52 (38.8) | 0.819 |
| Middle school | 210 (14.5) | 194 (14.4) | 16 (16.0) | 14 (15.8) | 16 (16.0) | |||
| High school | 387 (31.0) | 365 (31.5) | 22 (24.9) | 25 (27.0) | 22 (24.9) | |||
| ≥College | 273 (25.1) | 260 (25.4) | 13 (20.4) | 18 (25.2) | 13 (20.4) | |||
| Household income | Low | 431 (26.1) | 376 (24.4) | 55 (48.8) | <0.001 | 49 (39.0) | 55 (48.8) | 0.515 |
| Middle-low | 375 (25.7) | 344 (25.3) | 31 (31.0) | 31 (32.4) | 31 (31.0) | |||
| Middle-high | 324 (26.2) | 313 (27.1) | 11 (14.1) | 14 (17.1) | 11 (14.1) | |||
| High | 274 (22.0) | 268 (23.2) | 6 (6.0) | 9 (11.5) | 6 (6.0) | |||
| Residential area | Urban | 1063 (81.6) | 990 (81.9) | 73 (77.9) | 0.446 | 73 (76.7) | 73 (77.9) | 0.862 |
| Rural | 341 (18.4) | 311 (18.1) | 30 (22.1) | 30 (23.3) | 30 (22.1) | |||
| Health insurance type | National health insurance | 1331 (95.0) | 1247 (96.0) | 84 (81.7) | <0.001 | 88 (89.9) | 84 (81.7) | 0.088 |
| Medical care | 73 (5.0) | 54 (4.0) | 19 (18.3) | 15 (10.1) | 19 (18.3) | |||
| Household type | Alone | 729 (40.6) | 665 (39.9) | 64 (50.1) | 0.080 | 62 (44.8) | 64 (50.1) | 0.506 |
| Family | 675 (59.4) | 636 (60.1) | 39 (49.9) | 41 (55.2) | 39 (49.9) | |||
| Occupation | Office workers | 164 (15.4) | 159 (15.8) | 5 (9.1) | 0.002 | 6 (8.9) | 5 (9.1) | 0.073 |
| Non-office workers | 574 (43.4) | 547 (44.6) | 27 (27.7) | 41 (46.6) | 27 (27.7) | |||
| Unemployed | 666 (41.2) | 595 (39.6) | 71 (63.2) | 56 (44.4) | 71 (63.2) | |||
| Characteristics | Categories | Total (n = 826) | Before PSM | After PSM | ||||
|---|---|---|---|---|---|---|---|---|
| Non- Depressed (n = 784) | Depressed (n = 42) | p | Non- Depressed (n = 55) | Depressed (n = 42) | p | |||
| n (Weighted %) /Mean (SE) | n (Weighted %) /Mean (SE) | n (Weighted %) /Mean (SE) | n (Weighted %) /Mean (SE) | n (Weighted %) /Mean (SE) | ||||
| Average working hours per week (h) | 39.79 (1.89) | 40.14 (0.74) | 39.44 (3.69) | 0.852 | 36.95 (2.81) | 39.44 (3.57) | 0.577 | |
| Working types | Regular workers | 714 (86.8) | 678 (86.9) | 36 (84.7) | 0.756 | 49 (90.6) | 36 (84.7) | 0.451 |
| Non-regular workers | 112 (13.2) | 106 (13.1) | 6 (15.3) | 6 (9.4) | 6 (15.3) | |||
| Characteristics | Categories | Total (n = 1404) | Before PSM | After PSM | ||||
|---|---|---|---|---|---|---|---|---|
| Non- Depressed (n = 1301) | Depressed (n = 103) | p | Non- Depressed (n = 103) | Depressed (n = 103) | p | |||
| n (Weighted %) /Mean (SE) | n (Weighted %) /Mean (SE) | n (Weighted %) /Mean (SE) | n (Weighted %) /Mean (SE) | n (Weighted %) /Mean (SE) | ||||
| SBP (mmHg) | 131.62 (1.26) | 131.34 (0.54) | 131.90 (2.48) | 0.824 | 133.21 (1.65) | 131.90 (2.48) | 0.636 | |
| DBP (mmHg) | 79.79 (0.84) | 81.23 (0.36) | 78.34 (1.66) | 0.091 | 81.40 (1.42) | 78.34 (1.66) | 0.188 | |
| WC (cm) | 90.64 (0.72) | 89.94 (0.28) | 91.35 (1.38) | 0.307 | 90.82 (1.02) | 91.35 (1.38) | 0.749 | |
| HDL-C (mg/dL) prevalence | 41.32 (0.59) | 41.98 (0.31) | 40.66 (1.14) | 0.272 | 40.89 (1.15) | 40.66 (1.14) | 0.890 | |
| Yes | 527 (36.2) | 480 (35.9) | 47 (39.5) | 0.527 | 44 (39.6) | 47 (39.5) | 0.993 | |
| No | 877 (63.8) | 821 (64.1) | 56 (60.5) | 59 (60.4) | 56 (60.5) | |||
| TG (mg/dL) prevalence | 247.74 (13.33) | 233.17 (6.02) | 262.31 (25.84) | 0.271 | 281.26 (34.03) | 262.31 (25.84) | 0.655 | |
| Yes | 598 (46.9) | 551 (46.7) | 47 (40.0) | 0.589 | 44 (49.4) | 47 (50.0) | 0.942 | |
| No | 806 (53.1) | 750 (53.3) | 56 (50.0) | 59 (50.6) | 56 (50.0) | |||
| Glucose (mg/dL) | 120.07 (1.76) | 117.10 (1.03) | 123.03 (3.34) | 0.089 | 122.64 (5.17) | 123.03 (3.34) | 0.948 | |
| BMI | 26.30 (0.11) | 26.28 (0.11) | 26.58 (0.52) | 0.565 | 26.74 (0.42) | 26.58 (0.52) | 0.808 | |
| Number of comorbid diseases | 1.87 (0.10) | 1.36 (0.04) | 2.37 (0.20) | <0.001 | 2.08 (0.16) | 2.37 (0.20) | 0.247 | |
| Perceived health status | Very good | 53 (4.0) | 53 (4.3) | 0 (0.0) | <0.001 | - | - | |
| Good | 212 (15.5) | 207 (16.3) | 5 (5.3) | 2 (1.3) | 5 (5.3) | 0.182 | ||
| Moderate | 735 (54.0) | 715 (56.8) | 20 (16.7) | 26 (28.2) | 20 (16.7) | |||
| Bad | 305 (20.6) | 269 (19.2) | 36 (39.0) | 33 (35.7) | 36 (39.0) | |||
| Very bad | 99 (5.8) | 57 (3.3) | 42 (39.1) | 42 (34.8) | 42 (39.1) | |||
| Characteristics | Categories | Total (n = 1404) | Before PSM | After PSM | ||||
|---|---|---|---|---|---|---|---|---|
| Non- Depressed (n = 1301) | Depressed (n = 103) | p | Non- Depressed (n = 103) | Depressed (n = 103) | p | |||
| n (Weighted %) /Mean (SE) | n (Weighted %) /Mean (SE) | n (Weighted %) /Mean (SE) | n (Weighted %) /Mean (SE) | n (Weighted %) /Mean (SE) | ||||
| Average sleep duration on weekdays (h) | <5 | 65 (5.1) | 54 (4.7) | 11 (10.8) | 0.214 | 6 (5.9) | 11 (10.8) | 0.488 |
| 5–6 | 159 (11.7) | 144 (11.6) | 15 (13.0) | 0.741 * | 11 (6.5) | 15 (13.0) | 0.934 * | |
| 6–7 | 313 (24.7) | 295 (25.0) | 18 (21.3) | 21 (28.6) | 18 (21.3) | |||
| 7–8 | 392 (28.2) | 372 (28.5) | 20 (23.5) | 22 (25.4) | 20 (23.5) | |||
| 8–9 | 301 (20.7) | 281 (20.8) | 20 (18.2) | 25 (21.3) | 20 (18.2) | |||
| ≥9 | 174 (9.7) | 155 (9.4) | 19 (13.2) | 18 (12.3) | 19 (13.2) | |||
| Average sleep duration on weekends (h) | <5 | 50 (3.2) | 41 (2.8) | 9 (8.7) | 0.047 | 5 (4.4) | 9 (8.7) | 0.074 |
| 5–6 | 124 (9.1) | 109 (8.9) | 15 (11.9) | 0.953 * | 6 (3.1) | 15 (11.9) | 0.838 * | |
| 6–7 | 238 (18.7) | 222 (18.8) | 16 (17.6) | 21 (24.2) | 16 (17.6) | |||
| 7–8 | 374 (26.2) | 356 (26.8) | 18 (18.6) | 26 (31.3) | 18 (18.6) | |||
| 8–9 | 347 (23.8) | 329 (24.1) | 18 (19.3) | 24 (19.8) | 18 (19.3) | |||
| ≥9 | 271 (19.0) | 244 (18.6) | 27 (23.9) | 21 (17.3) | 27 (23.9) | |||
| Physical activity | Inactive | 1250 (87.8) | 1154 (87.4) | 96 (91.9) | 0.458 | 91 (84.8) | 96 (91.9) | 0.145 |
| Minimally active | 135 (10.6) | 129 (10.9) | 6 (6.0) | 12 (15.2) | 6 (6.0) | |||
| HEPA | 19 (1.7) | 18 (1.7) | 1 (2.0) | 0 (0.0) | 1 (2.0) | |||
| Sedentary time (h) | 8.82 (0.22) | 8.16 (0.14) | 9.47 (0.41) | 0.002 | 8.60 (0.56) | 9.47 (0.41) | 0.164 | |
| HRQoL | 0.85 (0.01) | 0.94 (0.00) | 0.77 (0.03) | <0.001 | 0.87 (0.02) | 0.77 (0.03) | 0.001 | |
Disclaimer/Publisher’s Note: The statements, opinions and data contained in all publications are solely those of the individual author(s) and contributor(s) and not of MDPI and/or the editor(s). MDPI and/or the editor(s) disclaim responsibility for any injury to people or property resulting from any ideas, methods, instructions or products referred to in the content. |
© 2023 by the authors. Licensee MDPI, Basel, Switzerland. This article is an open access article distributed under the terms and conditions of the Creative Commons Attribution (CC BY) license (https://creativecommons.org/licenses/by/4.0/).
Share and Cite
Yun, J.; Lee, Y. Comparison of Sleep Disturbance, Physical Activity, and Health-Related Quality of Life According to Depressive Symptoms in Patients with Metabolic Syndrome: A Secondary Analysis from the Korea National Health and Nutrition Examination Survey Using a Propensity Score Matching Analysis. Healthcare 2023, 11, 1802. https://doi.org/10.3390/healthcare11121802
Yun J, Lee Y. Comparison of Sleep Disturbance, Physical Activity, and Health-Related Quality of Life According to Depressive Symptoms in Patients with Metabolic Syndrome: A Secondary Analysis from the Korea National Health and Nutrition Examination Survey Using a Propensity Score Matching Analysis. Healthcare. 2023; 11(12):1802. https://doi.org/10.3390/healthcare11121802
Chicago/Turabian StyleYun, Jungmi, and Yunji Lee. 2023. "Comparison of Sleep Disturbance, Physical Activity, and Health-Related Quality of Life According to Depressive Symptoms in Patients with Metabolic Syndrome: A Secondary Analysis from the Korea National Health and Nutrition Examination Survey Using a Propensity Score Matching Analysis" Healthcare 11, no. 12: 1802. https://doi.org/10.3390/healthcare11121802