
A Performance Evaluation Matrix for Measuring the Life Satisfaction of Older Adults Using eHealth Wearables


Abstract
:1. Introduction
2. Literature Review
2.1. eHealth Wearables and Elders’ Health
2.2. Life Satisfaction
3. Methodology
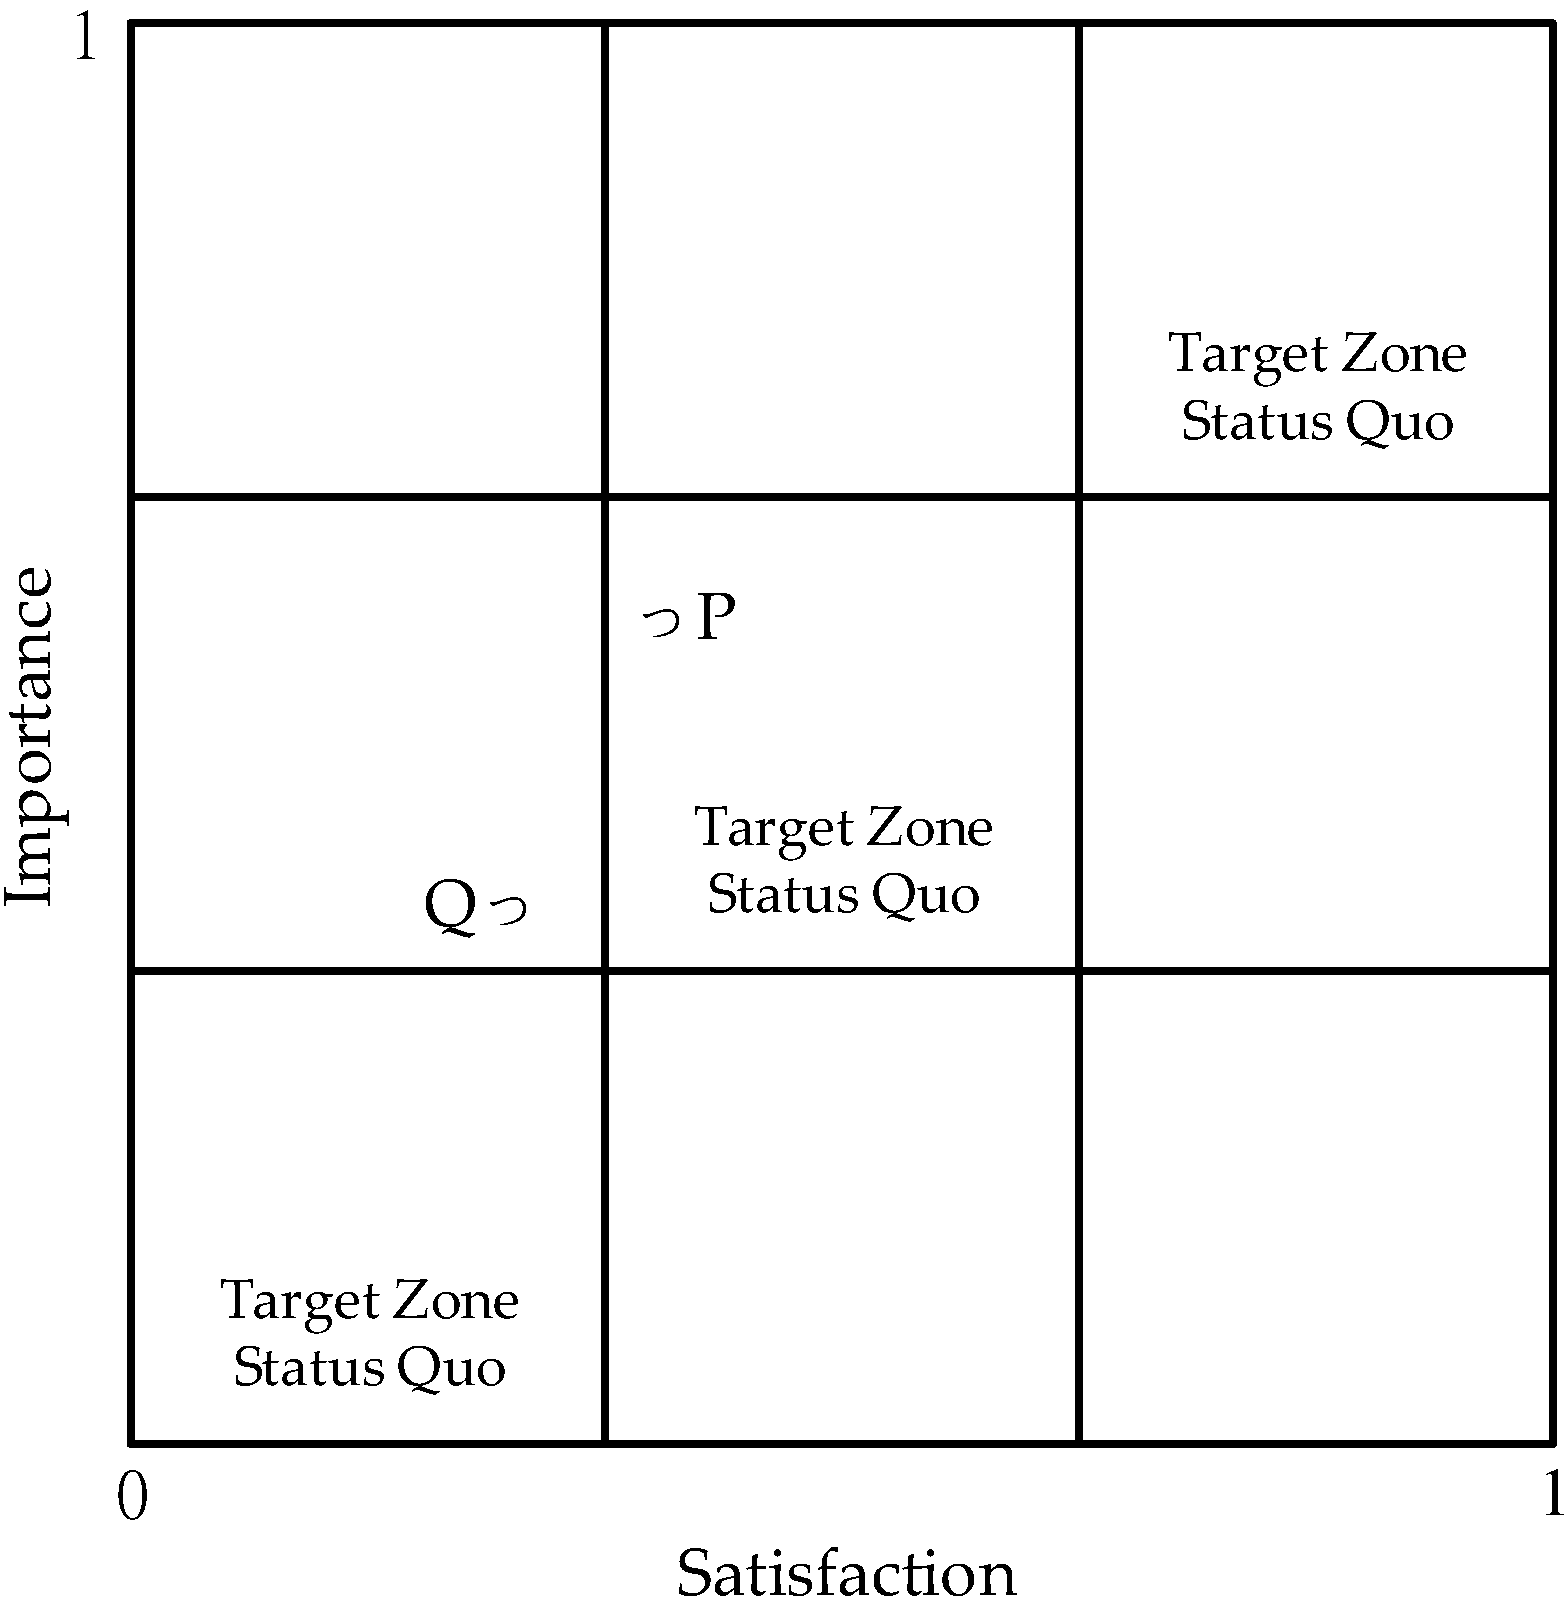
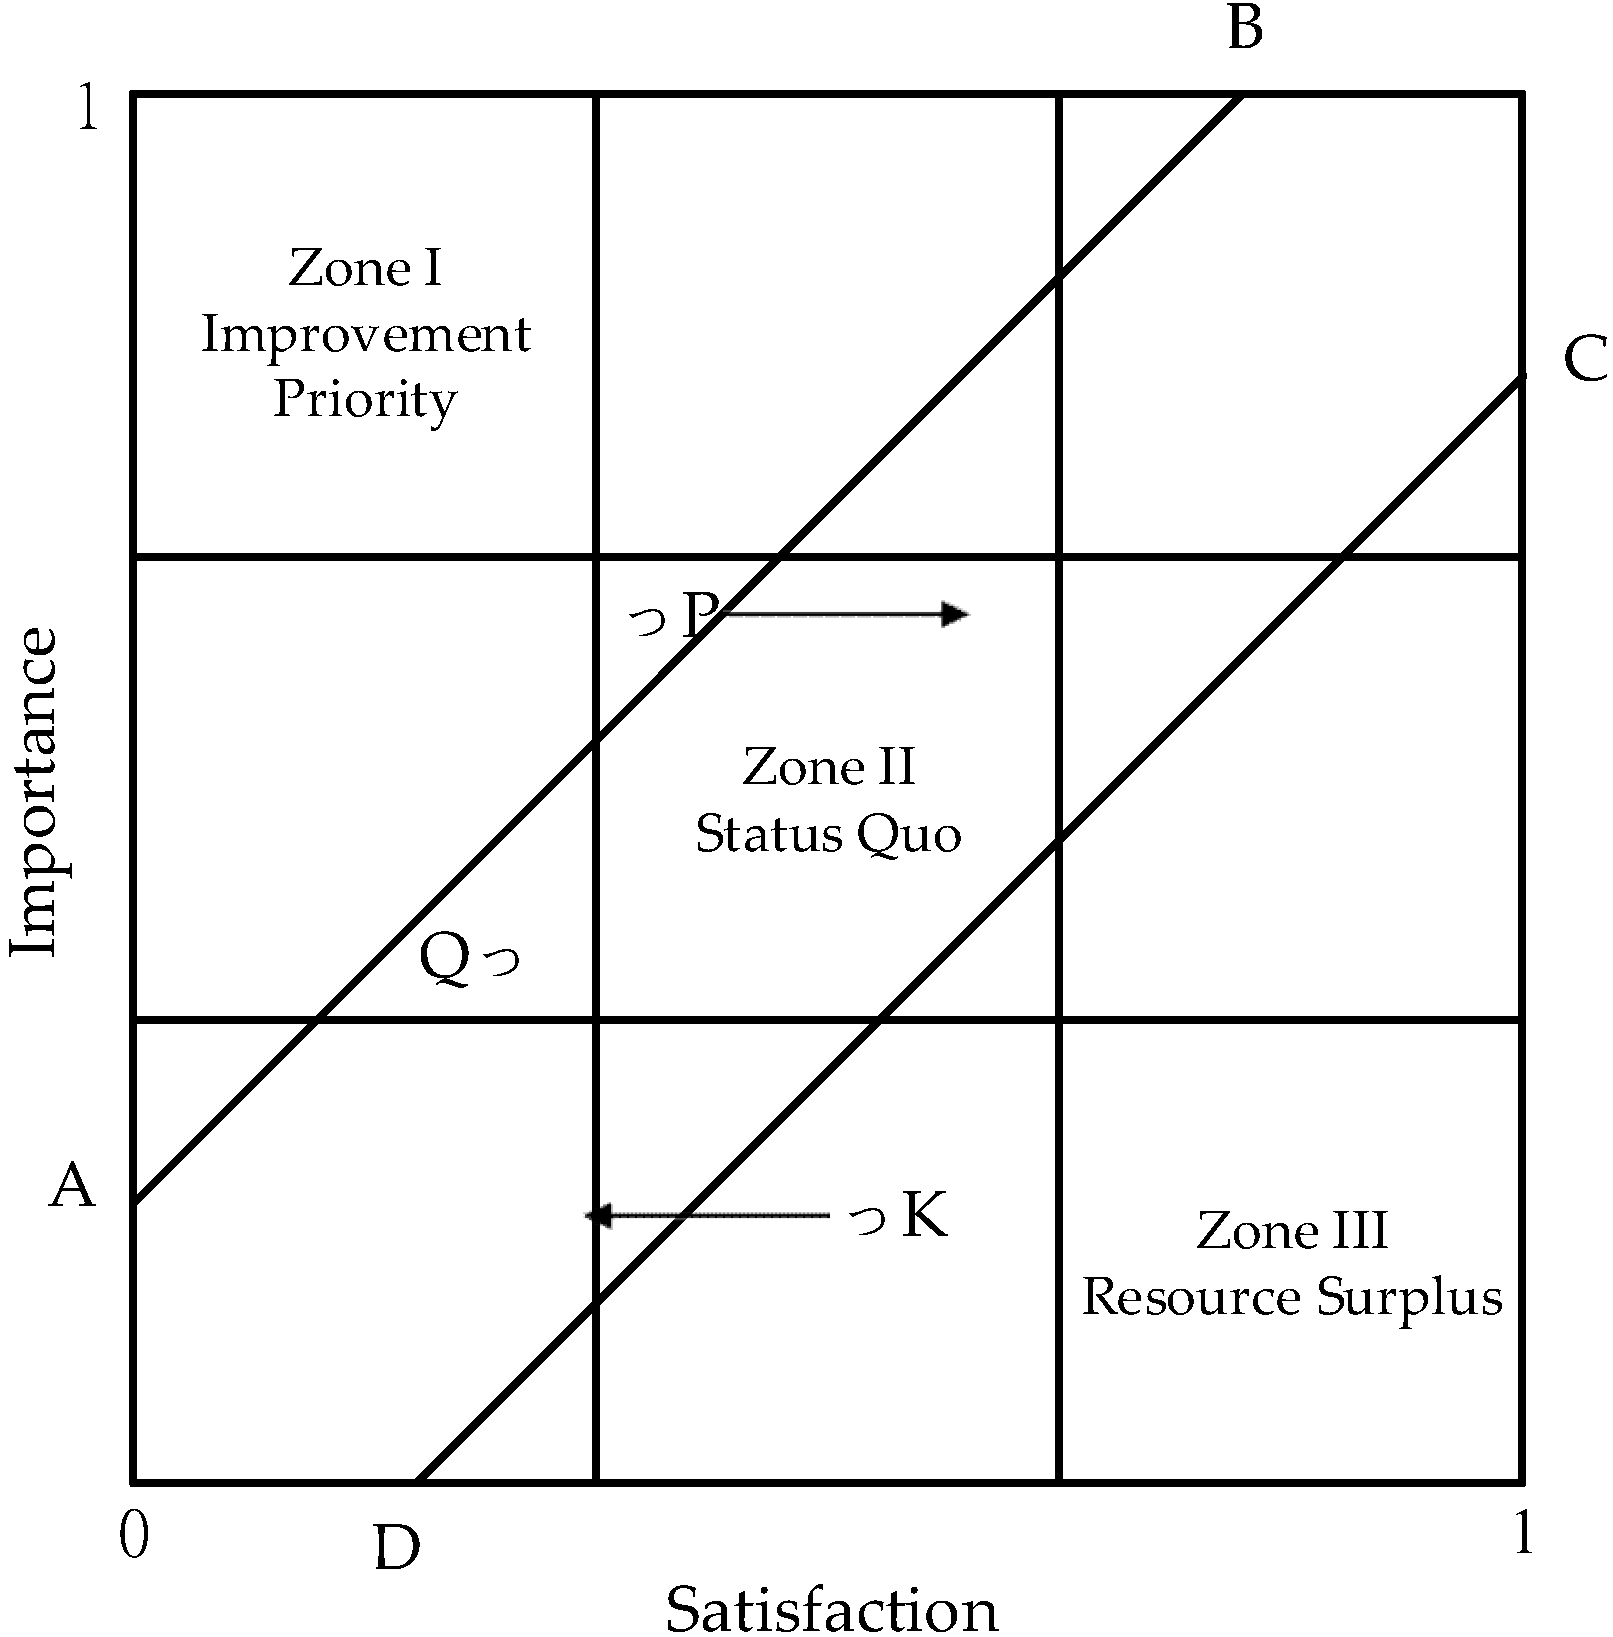
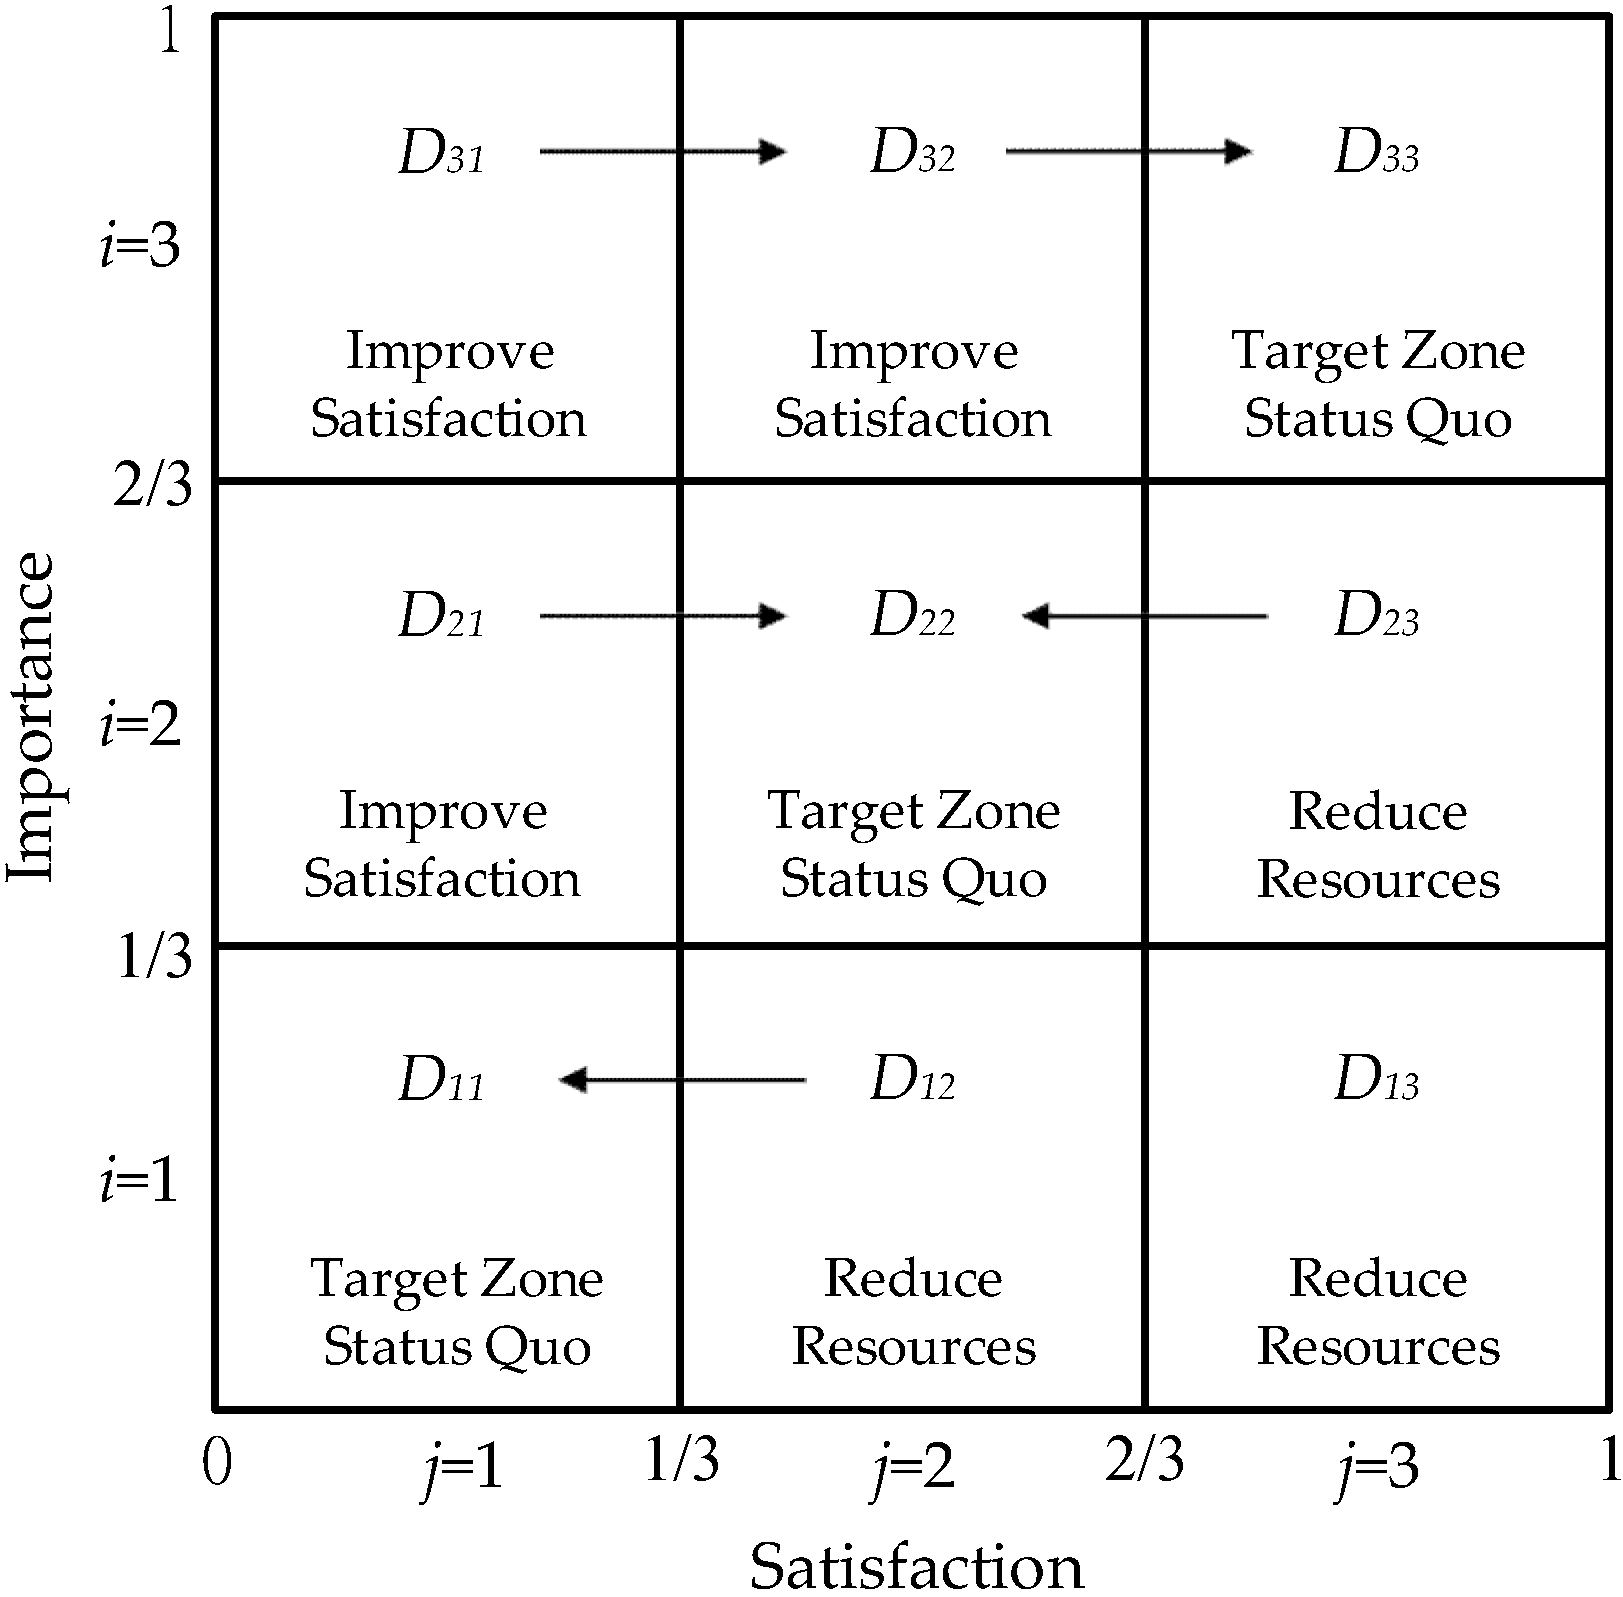
3.1. PEM Analysis
3.2. Research Design
- (1)
- Product attributes: tangible or intangible elements such as product packaging, price, quality, brand, function, after-sales services, and vendor reputation;
- (2)
- Beneficial consequences: users’ positive opinions of the product or service;
- (3)
- Personal values: personal beliefs and desires to achieve specific life goals (psychological factors that motivate consumers to achieve important life goals).
4. Results
4.1. Background Variables
4.2. Reliability Analysis
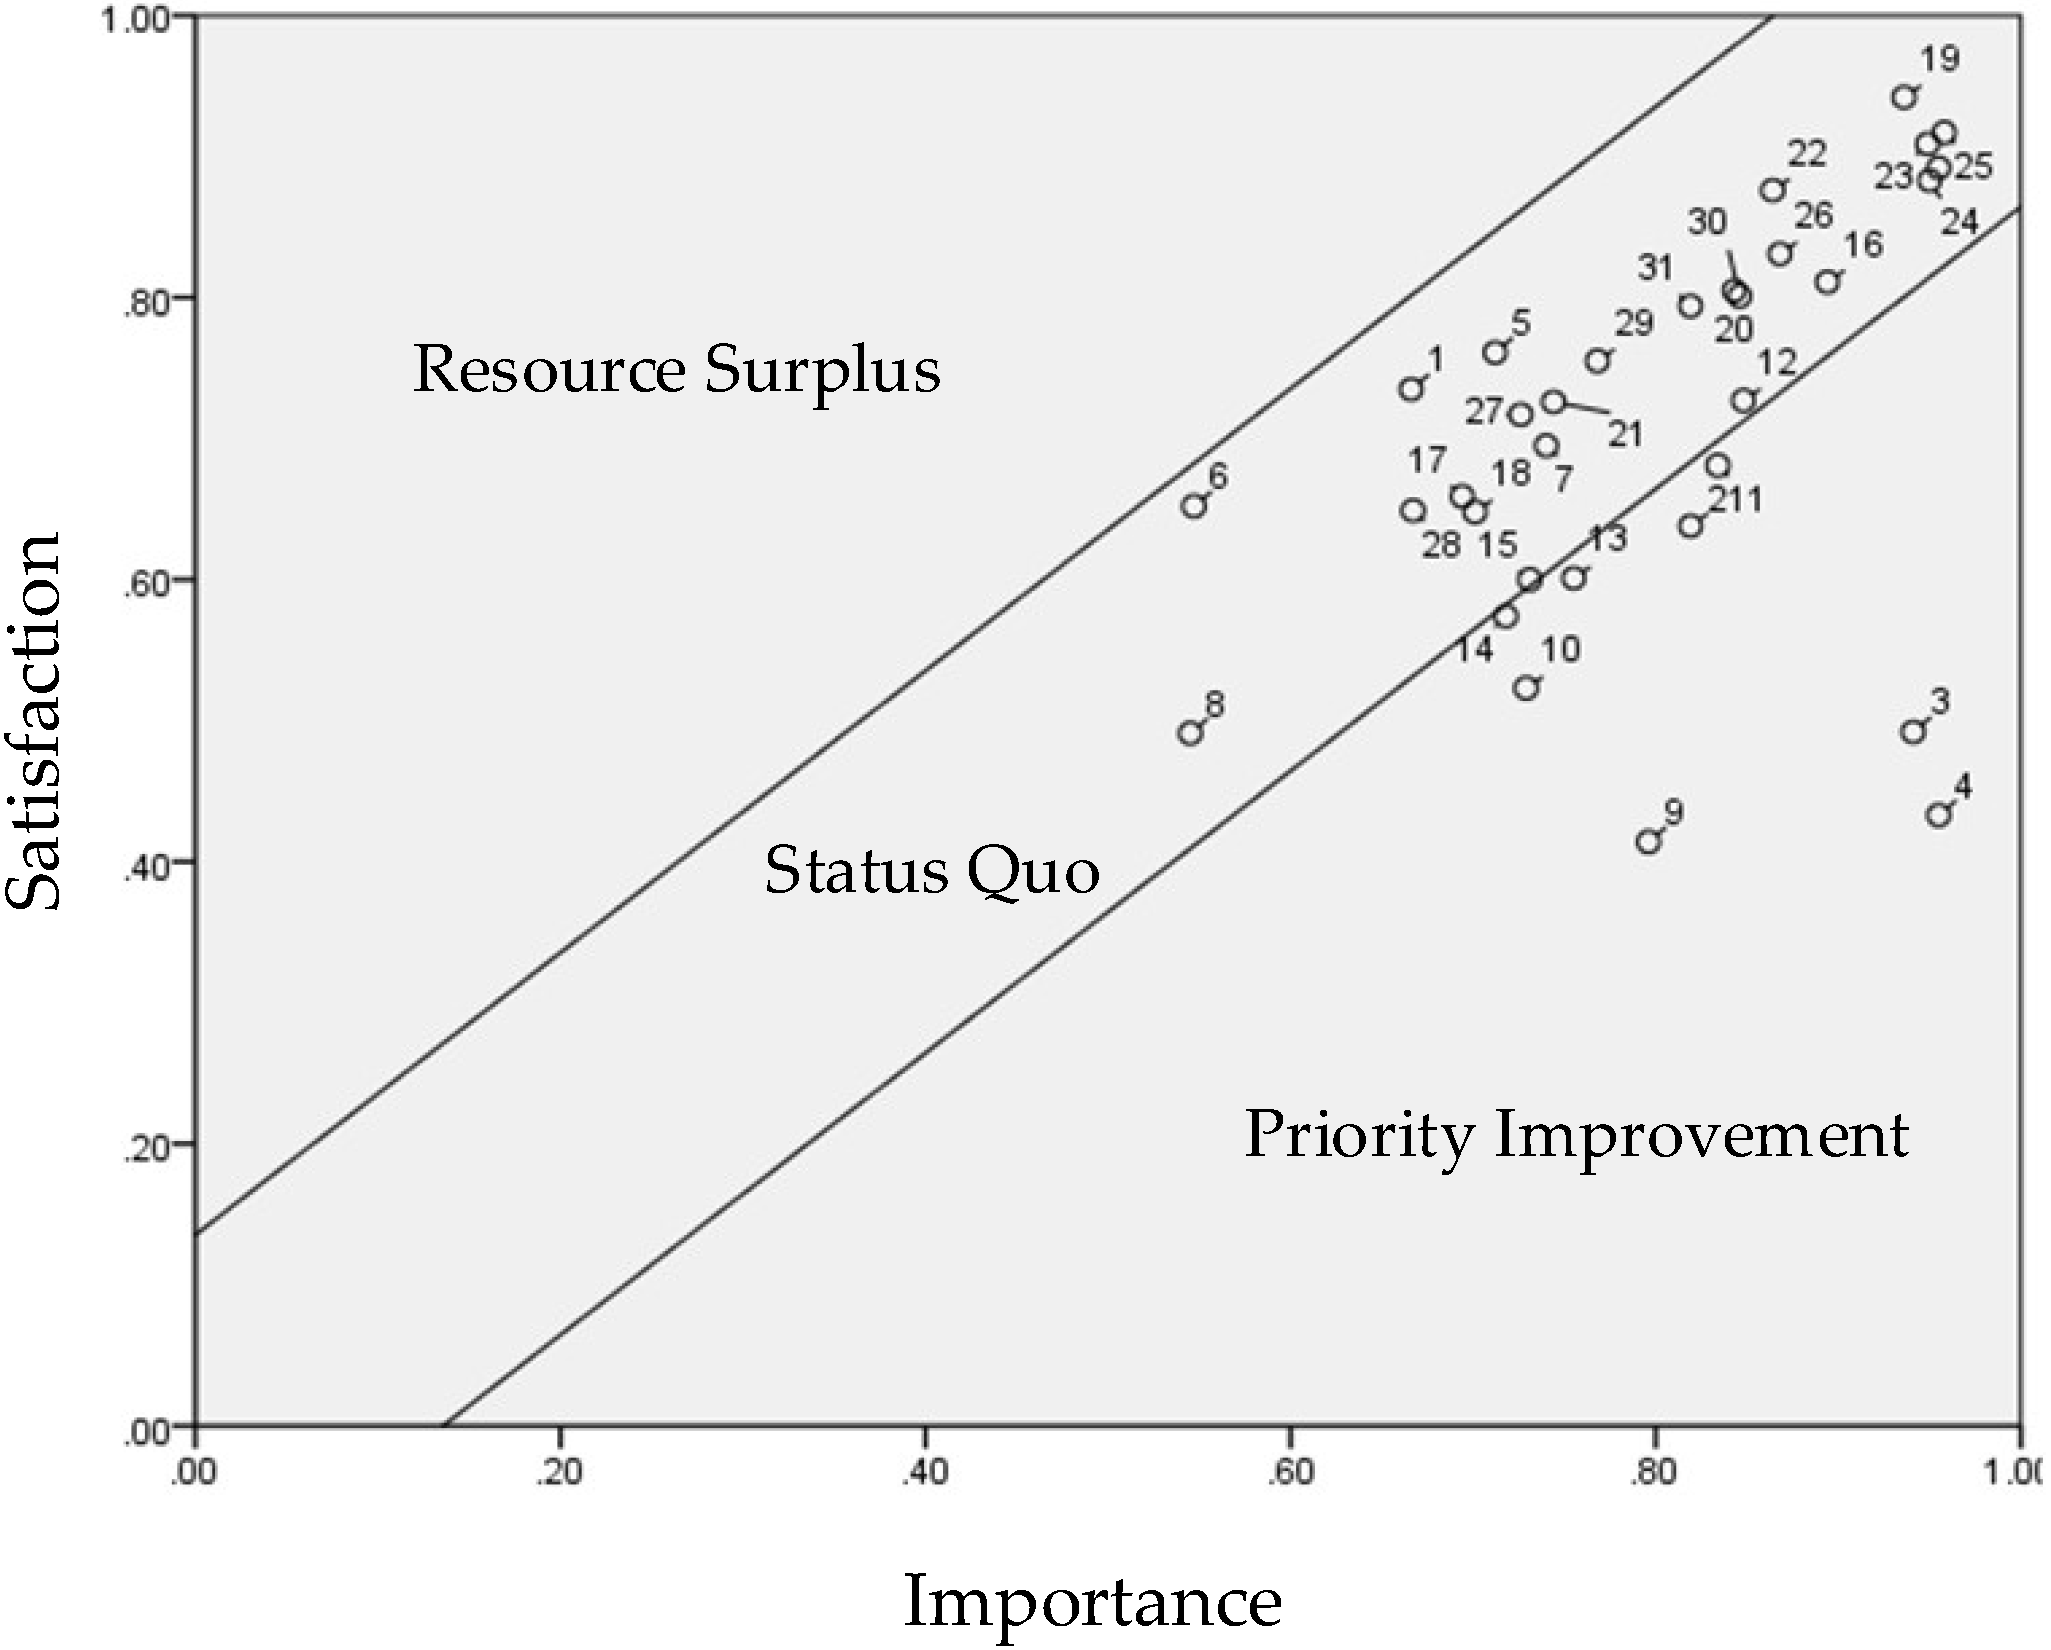
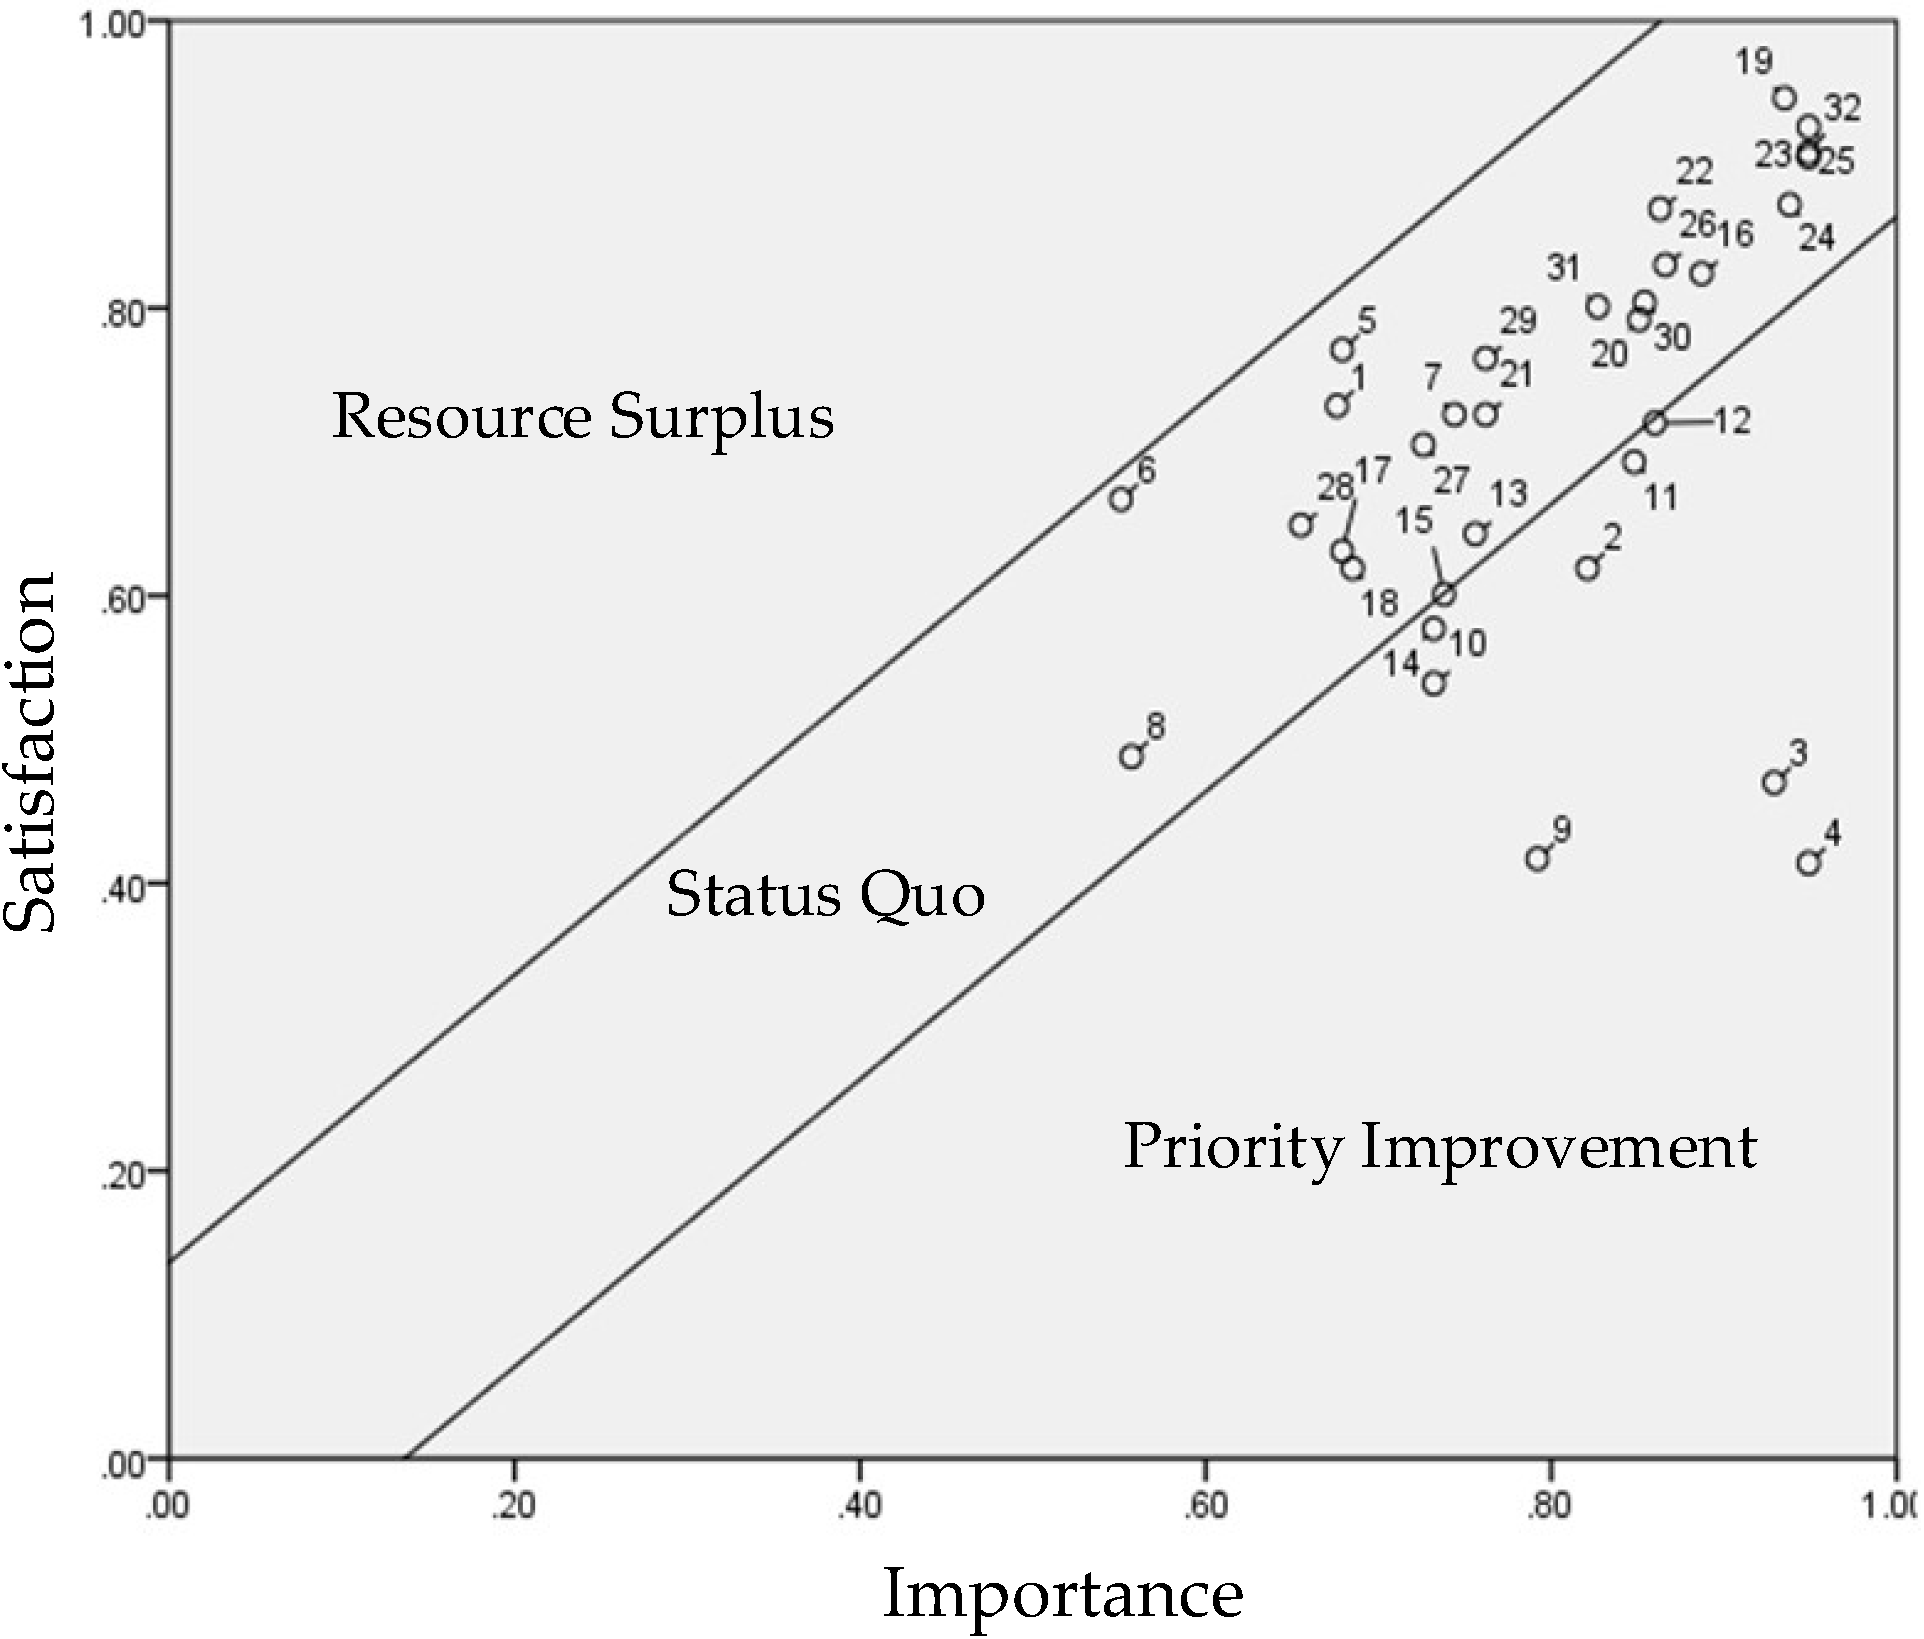
4.3. Overall PEM Analysis
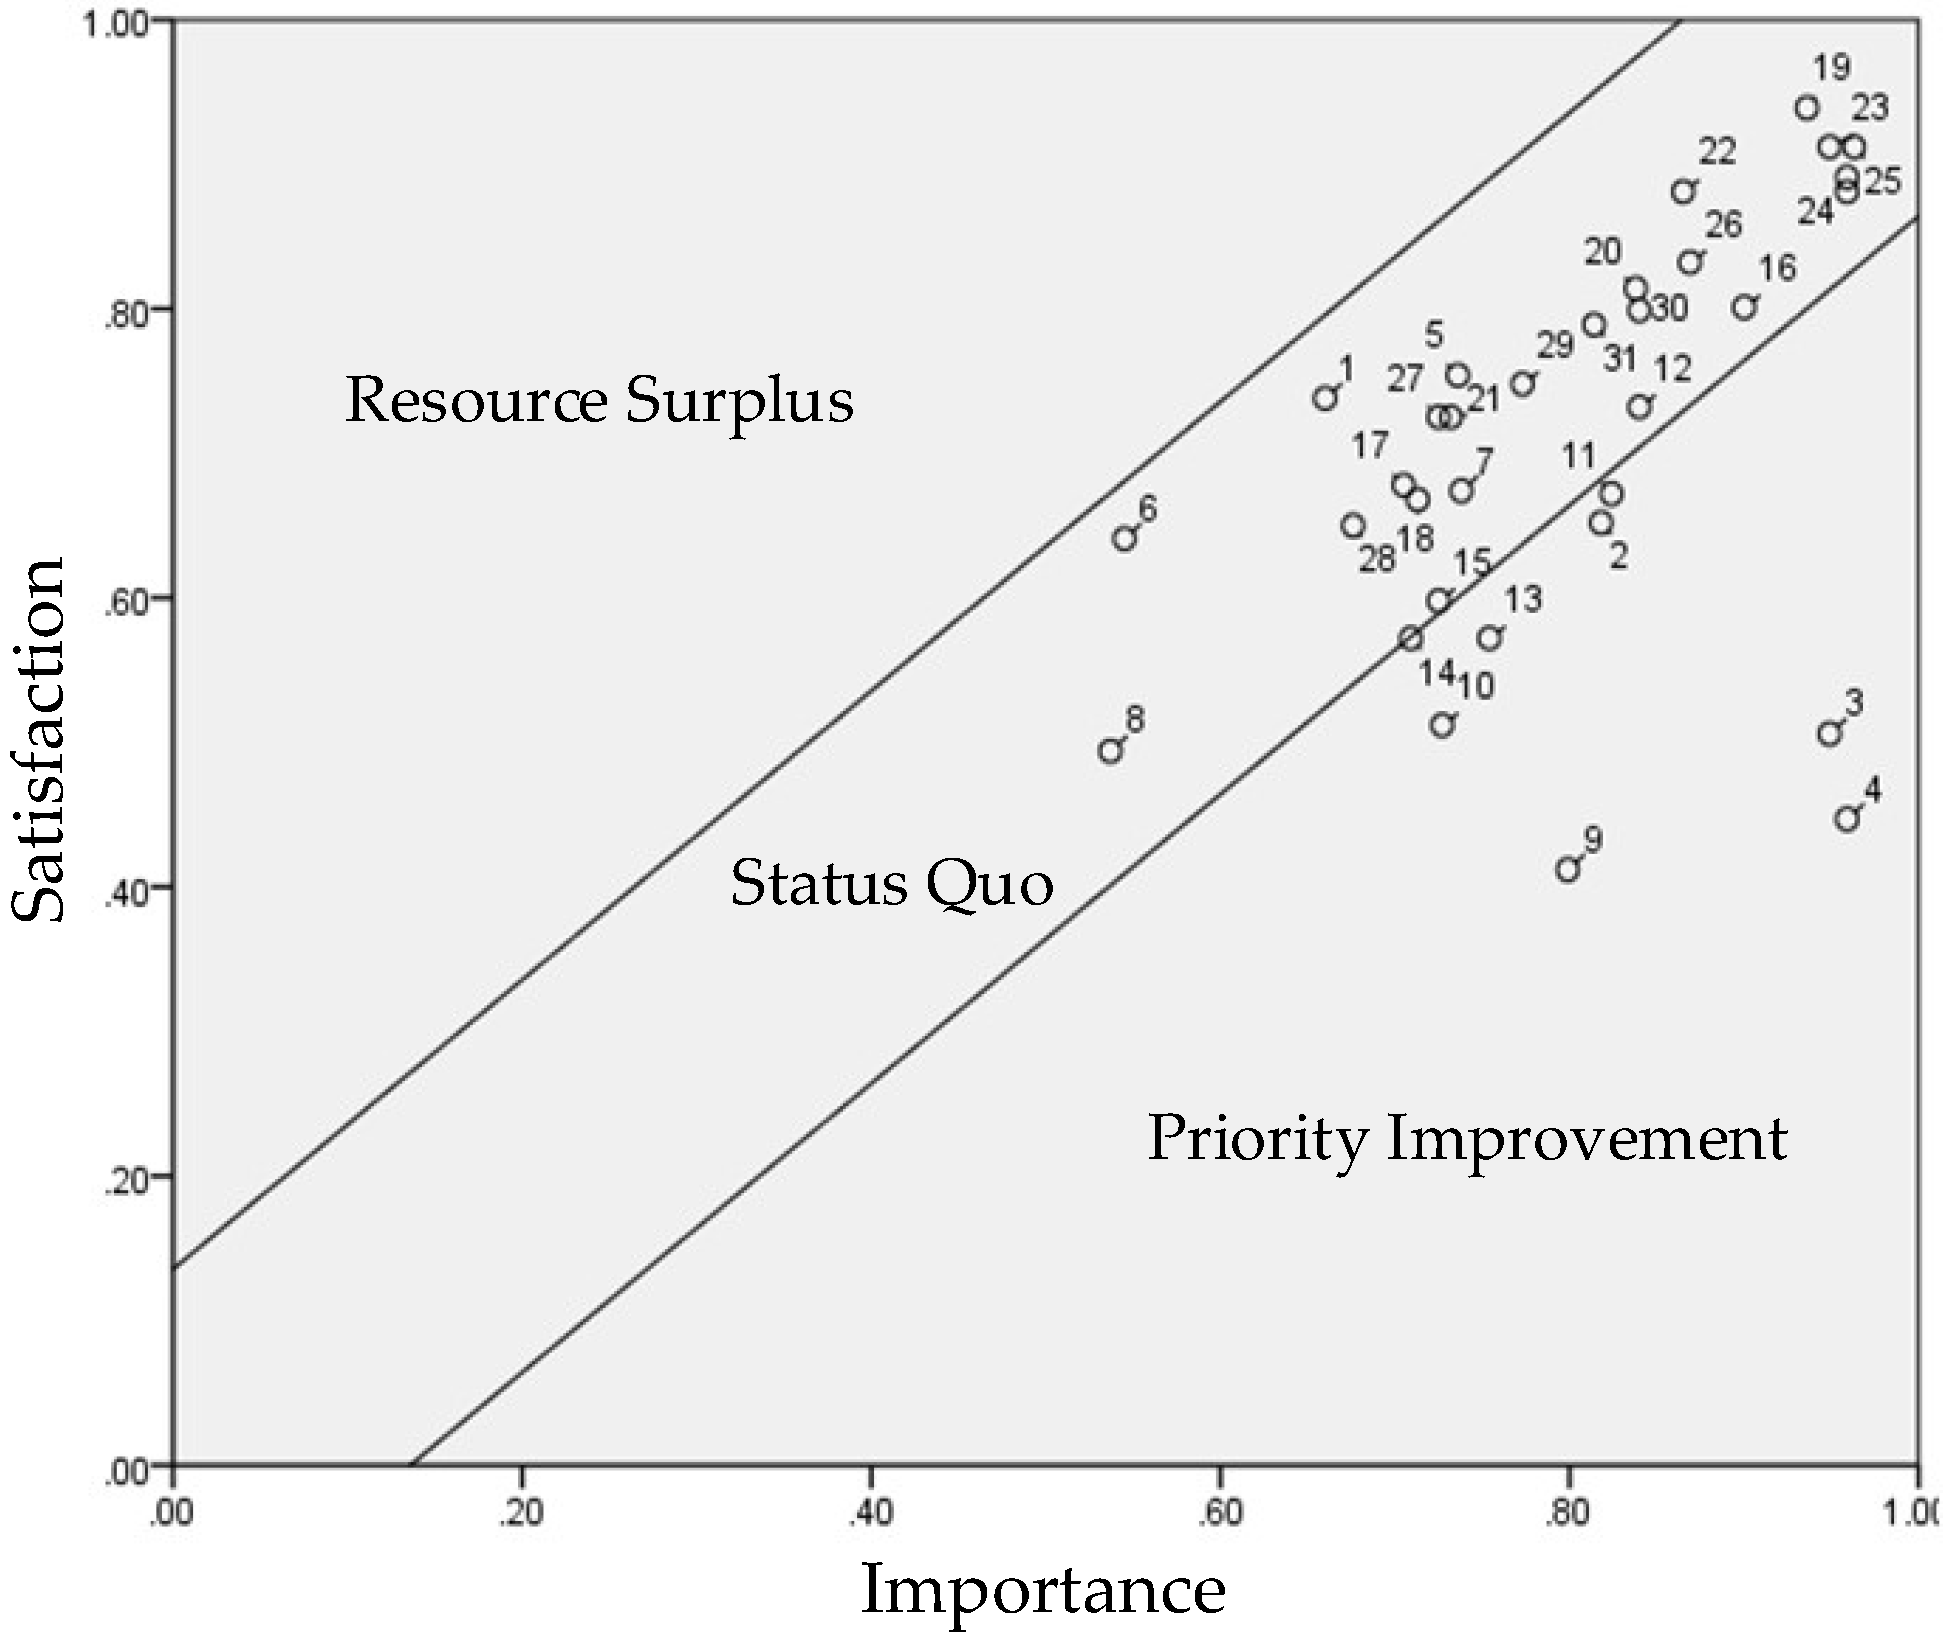
4.4. PEM Analysis for Gender
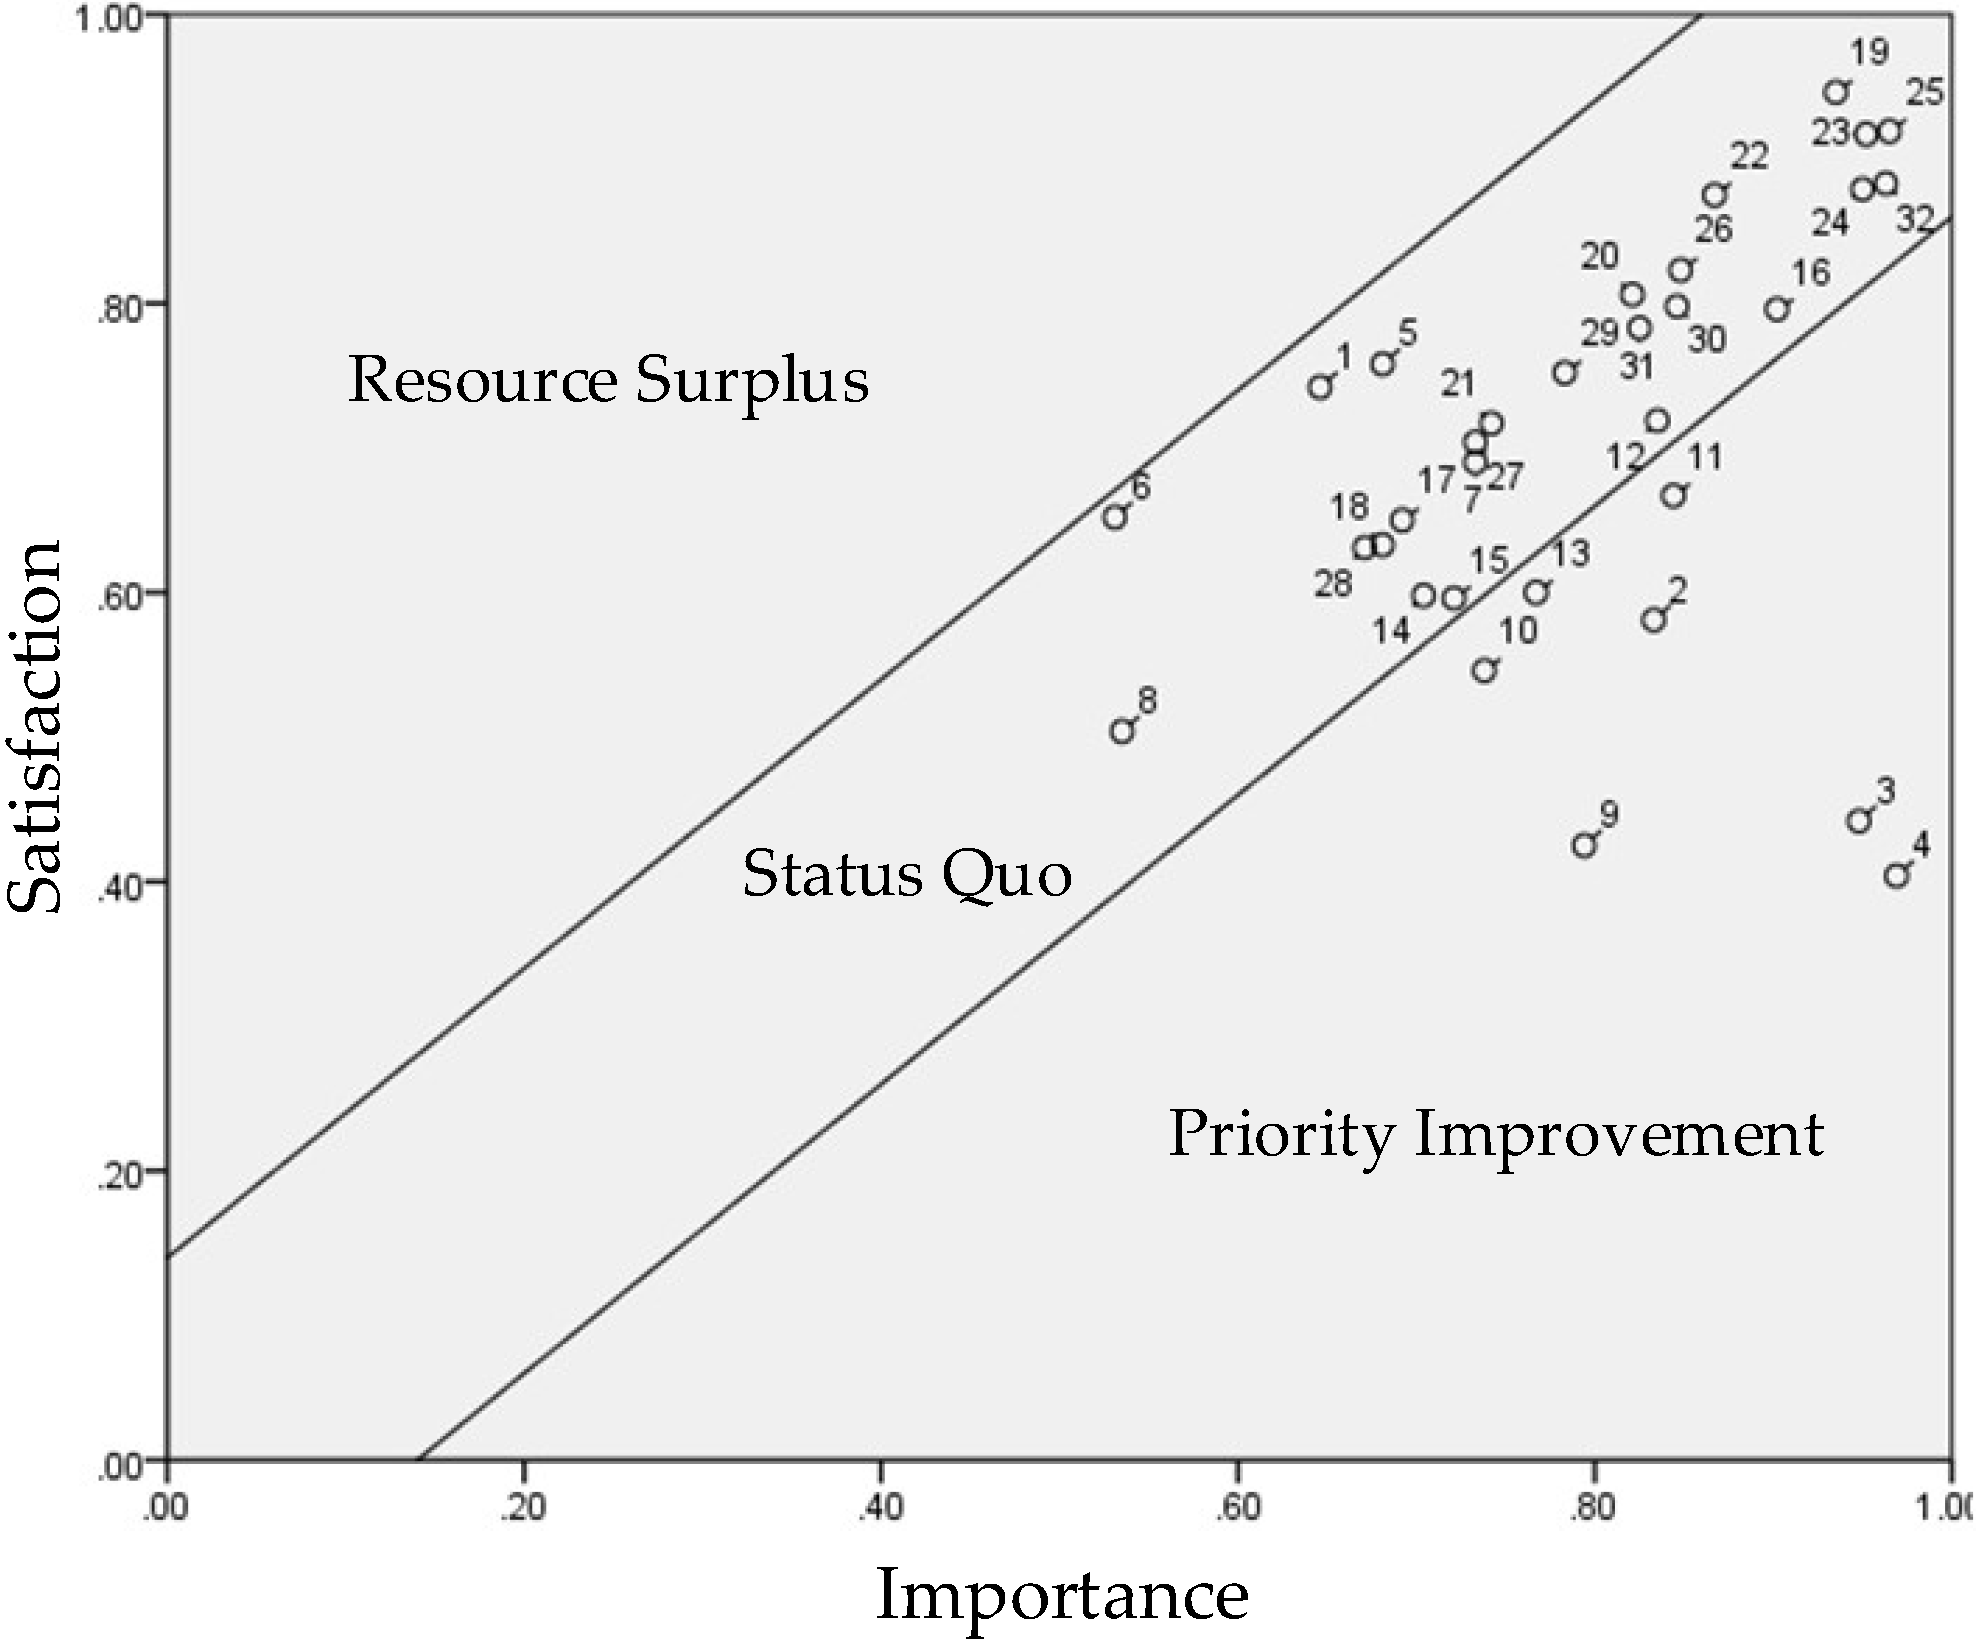
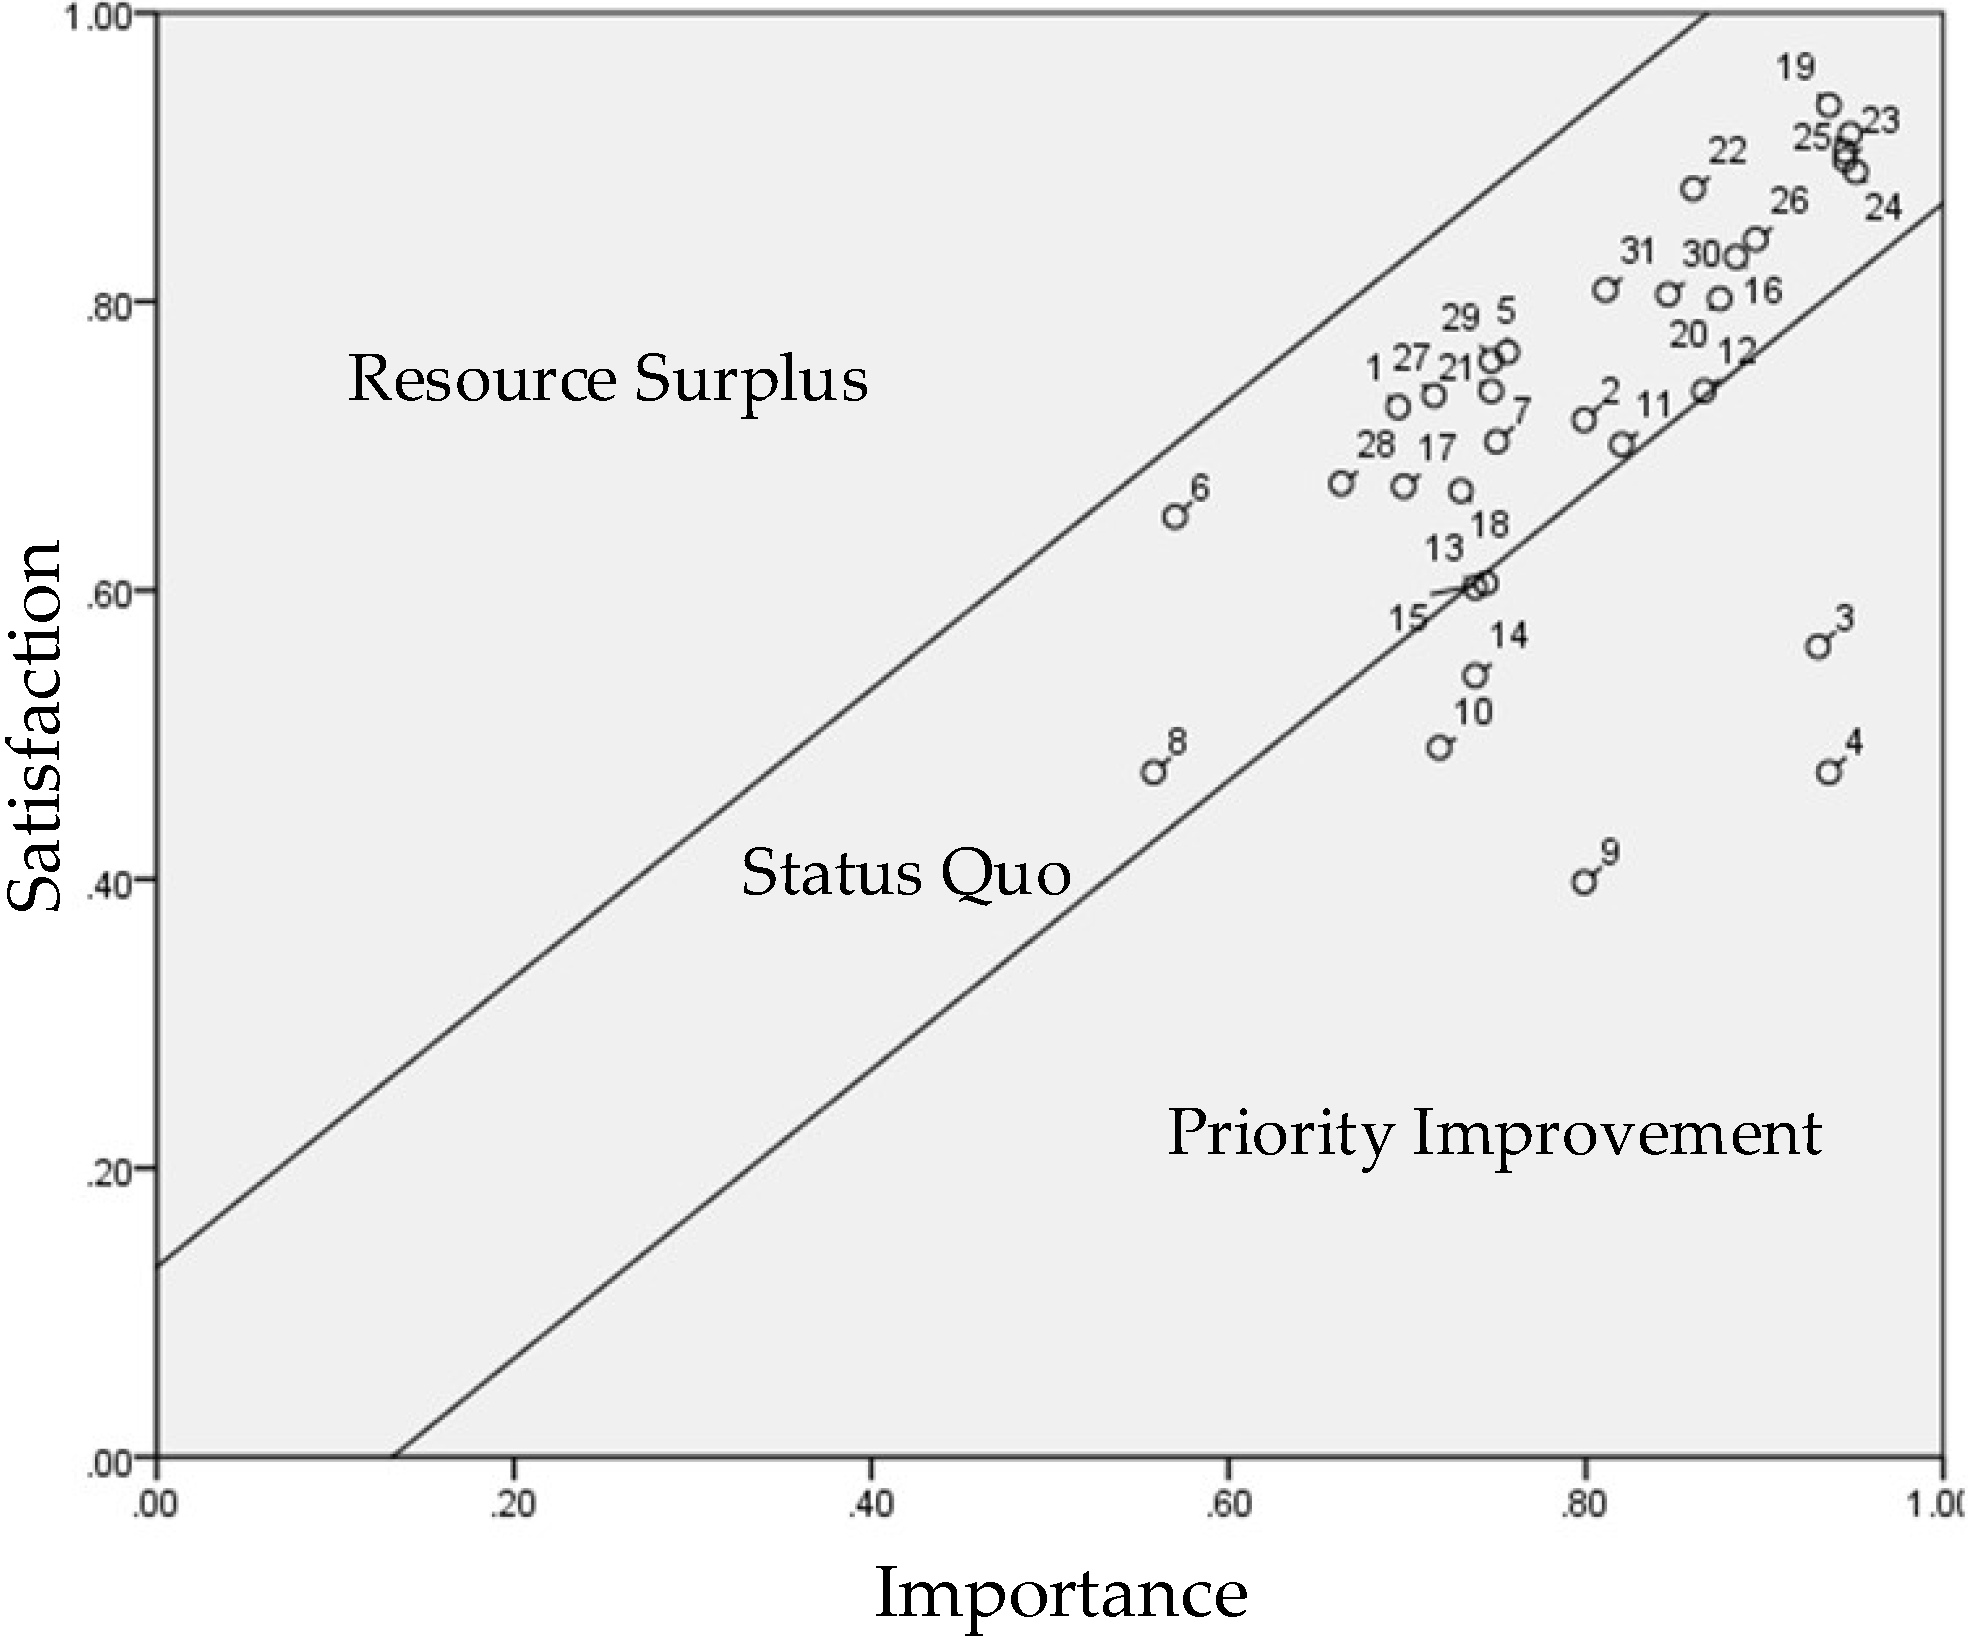
4.5. PEM Analysis for Age
4.6. Discussion
5. Conclusions and Suggestions
Author Contributions
Funding
Institutional Review Board Statement
Informed Consent Statement
Acknowledgments
Conflicts of Interest
References
- Sourour, Y.; Houda, B.A.; Maroua, T.E. Hospital morbidity among elderly in the region of Sfax, Tunisia: Epidemiological profile and chronological trends between 2003 and 2015. Clin. Epidemiol. Glob. Health 2019, 7, 131–135. [Google Scholar] [CrossRef] [Green Version]
- Jeng, M.Y.; Pai, F.Y.; Yeh, T.M. The virtual reality leisure activities experience on elderly people. Appl. Res. Qual. Life 2017, 12, 49–65. [Google Scholar] [CrossRef]
- Lin, C.S.; Jeng, M.Y.; Yeh, T.M. The elderly perceived meanings and values of virtual reality leisure activities: A means-end chain approach. Int. J. Environ. Res. Public Health 2018, 15, 663. [Google Scholar] [CrossRef] [PubMed] [Green Version]
- Fertelli, T.K.; Deliktas, T.A. A study on the relationship between perceptions of successful aging and life satisfaction of Turkish elderly people. Perspect. Psychiatr. Care 2020, 56, 386–392. [Google Scholar] [CrossRef]
- Yen, Y.K.; Chen, R.S. The Relationships among Mental Health Literacy, Mobile Phone Use, Self-Esteem, and Life Satisfaction of Elderly People. J. Health Sci. 2021, 7, 53–67. [Google Scholar]
- Shieh, M.-D.; Hsiao, H.-C.; Lin, Y.-H.; Lin, J.-Y. A study of the elderly people’s perception of wearable device forms. J. Interdiscip. Math. 2017, 20, 789–804. [Google Scholar] [CrossRef]
- Kekade, S.; Hseieh, C.H.; Islam, M.M.; Atique, S.; Mohammed Khalfan, A.; Li, Y.C.; Abdul, S.S. The usefulness and actual use of wearable devices among the elderly population. Comput. Methods Programs Biomed. 2018, 153, 137–159. [Google Scholar] [CrossRef]
- Tan, C.T. Safety and Efficiency in a New Era of Intelligent Healthcare. Formos. J. Med. 2021, 25, 604–612. [Google Scholar]
- Bruijink, A.W.; Viser, B.J.; Marshall, L. Medical Apps for Smartphones: Lack of Evidence Undermines Quality and Safety. BMJ Evid.-Based Med. 2015, 18, 90–92. [Google Scholar] [CrossRef]
- Quinn, C.C.; Shardell, M.D.; Terrin, M.L.; Barr, E.A.; Ballew, S.H.; Gruber-Baldini, A.L. Cluster-Randomized Trial of a Mobile Phone Personalized Behavioral Intervention for Blood Glucose Control. Diabetes Care 2011, 34, 1934–1942. [Google Scholar] [CrossRef] [Green Version]
- Bexelius, C.; Löf, M.; Sandin, S.; Lagerros, Y.T.; Forsum, E.; Litton, J.-E.; Slinde, F.; Bickmore, T.; Hekler, E. Measures of Physical Activity Using Cell Phones: Validation Using Criterion Methods. J. Med. Internet Res. 2010, 12, e2. [Google Scholar] [CrossRef] [PubMed] [Green Version]
- Carrasco, M.P.; Salvador, C.H.; Sagredo, P.G.; Márquez-Montes, J.; De Mingo, M.A.G.; Fragua, J.A.; Rodríguez, M.C.; García-Olmos, L.M.; López, F.J.G.; Carrero, A.M.; et al. Impact of Patient–General Practitioner Short-Messages-Based Interaction on the Control of Hypertension in a Follow-up Service for Low-to-Medium Risk Hypertensive Patients: A Randomized Controlled Trial. IEEE Trans. Inf. Technol. Biomed. 2008, 12, 780–791. [Google Scholar] [CrossRef] [PubMed]
- Burke, L.E.; Conroy, M.B.; Sereika, S.M.; Elci, O.U.; Styn, M.A.; Acharya, S.D.; Sevick, M.A.; Ewing, L.J.; Glanz, K. The Effect of Electronic Self-Monitoring on Weight Loss and Dietary Intake: A Randomized Behavioral Weight Loss Trial. Obesity 2011, 19, 338–344. [Google Scholar] [CrossRef]
- Schoeppe, S.; Alley, S.; Van Lippevelde, W.; Bray, N.A.; Williams, S.L.; Duncan, M.J.; Vandelanotte, C. Efficacy of interventions that use apps to improve diet, physical activity and sedentary behaviour: A systematic review. Int. J. Behav. Nutr. Phys. Act. 2016, 13, 127. [Google Scholar] [CrossRef] [PubMed] [Green Version]
- King, A.C.; Hekler, E.B.; Grieco, L.A.; Winter, S.J.; Sheats, J.L.; Buman, M.P.; Banerjee, B.; Robinson, T.N.; Cirimele, J. Effects of Three Motivationally Targeted Mobile Device Applications on Initial Physical Activity and Sedentary Behavior Change in Midlife and Older Adults: A Randomized Trial. PLoS ONE 2016, 11, e0156370. [Google Scholar] [CrossRef] [PubMed]
- Spagnolli, A.; Guardigli, E.; Orso, V.; Varotto, A.; Gamberini, L. Measuring user acceptance of wearable symbiotic devices: Validation study across application scenarios. In Proceedings of the Third International Workshop, Symbiotic 2014, Helsinki, Finland, 30–31 October 2014. [Google Scholar]
- Chuang, H.F. Factors influencing behavioral intention of wearable symbiotic devices—case study of the mi band. Soochow J. Econ. Bus. 2016, 93, 1–24. [Google Scholar]
- Boulos, M.N.K.; Wheeler, S.; Tavares, C.; Jones, R. How smartphones are changing the face of mobile and participatory healthcare: An overview, with example from eCAALYX. BioMedical Eng. OnLine 2011, 10, 1–14. [Google Scholar] [CrossRef] [Green Version]
- Jeng, M.-Y.; Yeh, T.-M.; Pai, F.-Y. Analyzing Older Adults’ Perceived Values of Using Smart Bracelets by Means–End Chain. Healthcare 2020, 8, 494. [Google Scholar] [CrossRef]
- Yeniaras, V.; Akarsu, T.N. Religiosity and Life Satisfaction: A Multi-dimensional Approach. J. Happiness Stud. 2017, 18, 1815–1840. [Google Scholar] [CrossRef]
- Papi, S.; Cheraghi, M. Multiple factors associated with life satisfaction in older adults. Menopausal. Rev. 2021, 20, 65–71. [Google Scholar] [CrossRef]
- Papi, S.; Karimi, Z.; Zilaee, M.; Shahry, P. Malnutrition and its relation to general health and multimorbidity in the older people. J. Holist. Nurs. Midwifery 2019, 29, 228–235. [Google Scholar] [CrossRef]
- Sato, M.; Jordan, J.S.; Funk, D.C. A distance-running event and life satisfaction: The mediating roles of involvement. Sport Manag. Rev. 2016, 19, 536–549. [Google Scholar] [CrossRef]
- Lambert, D.M.; Sharma, A. A customer-based competitive analysis for logistics decisions. Int. J. Phys. Distrib. Logist. Manag. 1990, 20, 17–24. [Google Scholar] [CrossRef]
- Chen, S.H.; Liu, A.C.; Chen, F.Y. Using the PEM method to determine service quality improvement strategies of medical industry. Int. J. Manag. Stud. Res. 2014, 2, 41–46. [Google Scholar]
- Chiou, K.C.; Lee, S.S.; Liao, T.C. A study on the application of performance evaluation matrix in home stay service quality. J. SME Dev. 2010, 16, 1–24. [Google Scholar]
- Yeh, T.-M.; Lai, H.-P. Evaluating the effectiveness of implementing quality management practices in the medical industry. J. Nutr. Health Aging 2015, 19, 102–112. [Google Scholar] [CrossRef] [PubMed]
- Hung, Y.H.; Huang, M.L.; Chen, K.-S. Service quality evaluation by service quality performance matrix. Total Qual. Manag. Bus. Excel. 2003, 14, 79–89. [Google Scholar] [CrossRef]
- Kotler, P.J. Marketing Management, 7th ed; Prentice Hall International, Inc.: Hoboken, NJ, USA, 2003. [Google Scholar]
- Gutman, J. Means-end chains as goal hierarchies. Psychol. Mark. 1997, 14, 545–560. [Google Scholar] [CrossRef]
- Miele, M.; Parisi, V. L’Etica del Mangiare, i valori e le preoccupazioni dei consumatori per il benessere animale negli allevamenti: Un’applicazione dell’analisi Means-end Chain. Riv. Di Econ. Agrar. 2001, 1, 81–103. [Google Scholar]
- Cuieford, J.P. Fundamental Statistics in Psychology and Education; McGraw-Hill: New York, NY, USA, 1965. [Google Scholar]
- Nunnally, J.C. Psychometric Theory, 2nd ed.; McGraw-Hill: New York, NY, USA, 1978. [Google Scholar]
- Saskia, M.; Sarah, F.; Tobias, M.; Eileen, B.; Hajo, Z.; Claudia, R.P. Effectiveness of eHealth interventions for the promotion of physical activity in older adults: A systematic review. Prev. Med. 2018, 108, 93–110. [Google Scholar]
- Jorunn, L.H.; Beatrix, V.; Clemens, B.; Chris, T.; Kristin, T.; Mirjam, P.; Kamiar, A.; Sabato, M. Mobile health applications to promote active and healthy ageing. Sensors 2017, 17, 622. [Google Scholar]


| Dimensions | Elements | Source |
|---|---|---|
| Product attributes | 1. Alerts and notifications | Jeng et al. [19] Kotler [29] |
| 2. Accessibility | ||
| 3. Learnability | ||
| 4. Usability | ||
| 5. Security | ||
| 6. Waterproof and anti-splash | ||
| 7. Comfort | ||
| 8. Design | ||
| 9. Affordability | ||
| 10. Positioning | ||
| 11. Pedometer | ||
| 12. Sleep tracker | ||
| 13. Heart rate monitor | ||
| 14. Data feedback | ||
| 15. Calories burned | ||
| Beneficial consequences | 16. Using a smart bracelet, I’ve gained firsthand experiences. | Jeng et al. [19] Gutman [30] |
| 17. Using a smart bracelet, I’ve learned about smart products. | ||
| 18. Using a smart bracelet, I’ve learned different technical applications. | ||
| 19. Using a smart bracelet, I’m more health-conscious. | ||
| 20. Using a smart bracelet, I’ve become closer to my family. | ||
| 21. Using a smart bracelet, I’ve made more friends. | ||
| 22. Using a smart bracelet, I’m more relaxed. | ||
| 23. Using a smart bracelet, I’m more able to relieve stress. | ||
| 24. Using a smart bracelet has satisfied my curiosity. | ||
| Personal values | 25. Using a smart bracelet has improved my health. | Jeng et al. [19] Miele and Parisi [31] |
| 26. Using a smart bracelet, I’m more able to enjoy life. | ||
| 27. Using a smart bracelet has improved my quality of life. | ||
| 28. Using a smart bracelet has improved my interpersonal relationships. | ||
| 29. Using a smart bracelet has improved my life. | ||
| 30. Using a smart bracelet has brought purpose to my life. | ||
| 31. Using a smart bracelet, I feel a sense of social belonging. | ||
| 32. Using a smart bracelet, I feel a sense of achievement. |
| Variable | Mean | Standard Deviation | Cronbach’s α |
|---|---|---|---|
| Product attributes (importance) | 4.023 | 0.766 | 0.631 |
| Beneficial consequences (importance) | 4.367 | 0.554 | 0.724 |
| Personal values (importance) | 4.303 | 0.562 | 0.747 |
| Product attributes (satisfaction) | 4.403 | 0.795 | 0.689 |
| Beneficial consequences (satisfaction) | 4.226 | 0.629 | 0.688 |
| Personal values (satisfaction) | 4.285 | 0.696 | 0.822 |
| Dimensions | Items | Px | Py | ||
|---|---|---|---|---|---|
| Product attributes | 1. Alerts and notifications | 3.665 | 3.942 | 0.666 | 0.735 |
| 2. Accessibility | 4.277 | 3.553 | 0.819 | 0.638 | |
| 3. Learnability | 4.762 | 2.966 | 0.941 | 0.492 | |
| 4. Usability | 4.820 | 2.733 | 0.955 | 0.433 | |
| 5. Security | 3.850 | 4.044 | 0.712 | 0.761 | |
| 6. Waterproof and anti-splash | 3.189 | 3.607 | 0.547 | 0.652 | |
| 7. Comfort | 3.961 | 3.782 | 0.740 | 0.695 | |
| 8. Design | 3.180 | 2.966 | 0.545 | 0.491 | |
| 9. Affordability | 4.285 | 2.655 | 0.796 | 0.414 | |
| 10. Positioning | 3.918 | 3.092 | 0.729 | 0.523 | |
| 11. Pedometer | 4.335 | 3.723 | 0.834 | 0.681 | |
| 12. Sleep tracker | 4.193 | 3.908 | 0.848 | 0.727 | |
| 13. Heart rate monitor | 4.019 | 3.403 | 0.755 | 0.601 | |
| 14. Data feedback | 3.874 | 3.296 | 0.718 | 0.574 | |
| 15. Calories burned | 3.922 | 3.398 | 0.731 | 0.600 | |
| Beneficial consequences | 16. Using a smart bracelet, I’ve gained firsthand experiences. | 4.578 | 4.243 | 0.894 | 0.811 |
| 17. Using a smart bracelet, I’ve learned about smart products. | 3.777 | 3.636 | 0.694 | 0.659 | |
| 18. Using a smart bracelet, I’ve learned different technical applications. | 3.806 | 3.592 | 0.701 | 0.648 | |
| 19. Using a smart bracelet, I’m more health-conscious. | 4.743 | 4.767 | 0.936 | 0.942 | |
| 20. Using a smart bracelet, I’ve become closer to my family. | 4.374 | 4.218 | 0.843 | 0.805 | |
| 21. Using a smart bracelet, I’ve made more friends. | 3.976 | 3.903 | 0.744 | 0.726 | |
| 22. Using a smart bracelet, I’m more relaxed. | 4.456 | 4.505 | 0.864 | 0.876 | |
| 23. Using a smart bracelet, I’m more able to relieve stress. | 4.796 | 4.636 | 0.949 | 0.909 | |
| 24. Using a smart bracelet has satisfied my curiosity. | 4.801 | 4.534 | 0.950 | 0.883 | |
| Personal values | 25. Using a smart bracelet has improved my health. | 4.830 | 4.670 | 0.958 | 0.917 |
| 26. Using a smart bracelet, I’m more able to enjoy life. | 4.471 | 4.325 | 0.868 | 0.831 | |
| 27. Using a smart bracelet has improved my quality of life. | 3.903 | 3.869 | 0.726 | 0.717 | |
| 28. Using a smart bracelet has improved my interpersonal relationships. | 3.670 | 3.597 | 0.667 | 0.649 | |
| 29. Using a smart bracelet has improved my life. | 4.073 | 4.019 | 0.768 | 0.755 | |
| 30. Using a smart bracelet has brought purpose to my life. | 4.384 | 4.204 | 0.846 | 0.801 | |
| 31. Using a smart bracelet, I feel a sense of social belonging. | 4.277 | 4.175 | 0.819 | 0.794 | |
| 32. Using a smart bracelet, I feel a sense of achievement. | 4.820 | 4.568 | 0.955 | 0.892 |
| Index Value | Population Mean (µ) | Population Error (σ) | UCL (1 × σ) | LCL (1 × σ) | |
|---|---|---|---|---|---|
| Performance Evaluation | |||||
| Importance vs. Satisfaction | 4.010 | 0.136 | +0.136 | −0.136 | |
| Dimension | Elements | Px | Py | ||||||
|---|---|---|---|---|---|---|---|---|---|
| Male | Female | Male | Female | Male | Female | Male | Female | ||
| Product attributes | 1. Alerts and notifications | 3.702 | 3.639 | 3.929 | 3.951 | 0.676 | 0.660 | 0.732 | 0.738 |
| 2. Accessibility | 4.286 | 4.271 | 3.476 | 3.607 | 0.821 | 0.818 | 0.619 | 0.652 | |
| 3. Learnability | 4.714 | 4.795 | 2.881 | 3.025 | 0.929 | 0.949 | 0.470 | 0.506 | |
| 4. Usability | 4.798 | 4.836 | 2.655 | 2.787 | 0.949 | 0.959 | 0.414 | 0.447 | |
| 5. Security | 3.714 | 3.943 | 4.083 | 4.016 | 0.679 | 0.736 | 0.771 | 0.754 | |
| 6. Waterproof and anti-plash | 3.202 | 3.180 | 3.667 | 3.566 | 0.551 | 0.545 | 0.667 | 0.641 | |
| 7. Comfort | 3.976 | 3.951 | 3.905 | 3.697 | 0.744 | 0.738 | 0.726 | 0.674 | |
| 8. Design | 3.226 | 3.148 | 2.952 | 2.975 | 0.557 | 0.537 | 0.488 | 0.494 | |
| 9. Affordability | 4.167 | 4.197 | 2.667 | 2.648 | 0.792 | 0.799 | 0.417 | 0.412 | |
| 10. Positioning | 3.929 | 3.910 | 3.155 | 3.049 | 0.732 | 0.727 | 0.539 | 0.512 | |
| 11. Pedometer | 4.393 | 4.295 | 3.774 | 3.689 | 0.848 | 0.824 | 0.693 | 0.672 | |
| 12. Sleep tracker | 4.441 | 4.361 | 3.881 | 3.926 | 0.860 | 0.840 | 0.720 | 0.732 | |
| 13. Heart rate monitor | 4.024 | 4.016 | 3.571 | 3.287 | 0.756 | 0.754 | 0.643 | 0.572 | |
| 14. Data feedback | 3.929 | 3.836 | 3.310 | 3.287 | 0.732 | 0.709 | 0.577 | 0.572 | |
| 15. Calories burned | 3.952 | 3.902 | 3.405 | 3.393 | 0.738 | 0.725 | 0.601 | 0.598 | |
| Beneficial consequences | 16. Using a smart bracelet, I’ve gained firsthand experiences. | 4.548 | 4.598 | 4.298 | 4.205 | 0.887 | 0.900 | 0.824 | 0.801 |
| 17. Using a smart bracelet, I’ve learned about smart products. | 3.714 | 3.820 | 3.524 | 3.713 | 0.679 | 0.705 | 0.631 | 0.678 | |
| 18. Using a smart bracelet, I’ve learned different technical applications. | 3.738 | 3.853 | 3.476 | 3.672 | 0.685 | 0.713 | 0.619 | 0.668 | |
| 19. Using a smart bracelet, I’m more health-conscious. | 4.738 | 4.746 | 4.786 | 4.754 | 0.935 | 0.936 | 0.946 | 0.939 | |
| 20. Using a smart bracelet, I’ve become closer to my family. | 4.405 | 4.353 | 4.167 | 4.254 | 0.851 | 0.838 | 0.792 | 0.814 | |
| 21. Using a smart bracelet, I’ve made more friends. | 4.048 | 3.926 | 3.905 | 3.902 | 0.762 | 0.732 | 0.726 | 0.725 | |
| 22. Using a smart bracelet, I’m more relaxed. | 4.452 | 4.459 | 4.476 | 4.525 | 0.863 | 0.865 | 0.869 | 0.881 | |
| 23. Using a smart bracelet, I’m more able to relieve stress. | 4.798 | 4.795 | 4.619 | 4.648 | 0.949 | 0.949 | 0.905 | 0.912 | |
| 24. Using a smart bracelet has satisfied my curiosity. | 4.750 | 4.836 | 4.488 | 4.566 | 0.938 | 0.959 | 0.872 | 0.891 | |
| Personal values | 25. Using a smart bracelet has improved my health. | 4.798 | 4.853 | 4.702 | 4.648 | 0.949 | 0.963 | 0.926 | 0.912 |
| 26. Using a smart bracelet, I’m more able to enjoy life. | 4.464 | 4.475 | 4.321 | 4.328 | 0.866 | 0.869 | 0.830 | 0.832 | |
| 27. Using a smart bracelet has improved my quality of life. | 3.905 | 3.902 | 3.821 | 3.902 | 0.726 | 0.725 | 0.705 | 0.725 | |
| 28. Using a smart bracelet has improved my interpersonal relationships. | 3.619 | 3.705 | 3.595 | 3.598 | 0.655 | 0.676 | 0.649 | 0.650 | |
| 29. Using a smart bracelet has improved my life. | 4.048 | 4.090 | 4.060 | 3.992 | 0.762 | 0.773 | 0.765 | 0.748 | |
| 30. Using a smart bracelet has brought purpose to my life. | 4.417 | 4.361 | 4.214 | 4.197 | 0.854 | 0.840 | 0.804 | 0.799 | |
| 31. Using a smart bracelet, I feel a sense of social belonging. | 4.310 | 4.254 | 4.202 | 4.156 | 0.827 | 0.814 | 0.801 | 0.789 | |
| 32. Using a smart bracelet, I feel a sense of achievement. | 4.798 | 4.836 | 4.631 | 4.525 | 0.949 | 0.959 | 0.908 | 0.881 | |
| Index Value | Population Mean (µ) | Population Error (σ) | UCL (1 × σ) | LCL (1 × σ) | |||||
|---|---|---|---|---|---|---|---|---|---|
| Performance Evaluation | Male | Female | Male | Female | Male | Female | Male | Female | |
| Importance vs. satisfaction | 4.009 | 4.009 | 0.136 | 0.135 | +0.136 | +0.135 | −0.136 | −0.135 | |
| Construct | Item | Px | Py | ||||||
|---|---|---|---|---|---|---|---|---|---|
| Younger than 70 | 70 and Older | Younger than 70 | 70 and Older | Younger than 70 | 70 and Older | Younger than 70 | 70 and Older | ||
| Product attributes | 1. Alerts and notifications | 3.583 | 3.779 | 3.967 | 3.907 | 0.646 | 0.695 | 0.742 | 0.727 |
| 2. Accessibility | 4.333 | 4.198 | 3.325 | 3.872 | 0.833 | 0.799 | 0.581 | 0.718 | |
| 3. Learnability | 4.792 | 4.721 | 2.767 | 3.244 | 0.948 | 0.930 | 0.442 | 0.561 | |
| 4. Usability | 4.875 | 4.744 | 2.617 | 2.895 | 0.969 | 0.936 | 0.404 | 0.474 | |
| 5. Security | 3.725 | 4.023 | 4.033 | 4.058 | 0.681 | 0.756 | 0.758 | 0.765 | |
| 6. Waterproof and anti-splash | 3.125 | 3.279 | 3.608 | 3.605 | 0.531 | 0.570 | 0.652 | 0.651 | |
| 7. Comfort | 3.933 | 4.000 | 3.758 | 3.814 | 0.733 | 0.750 | 0.690 | 0.703 | |
| 8. Design | 3.142 | 3.233 | 3.017 | 2.895 | 0.535 | 0.558 | 0.504 | 0.474 | |
| 9. Affordability | 4.175 | 4.198 | 2.700 | 2.593 | 0.794 | 0.799 | 0.425 | 0.398 | |
| 10. Positioning | 3.950 | 3.872 | 3.183 | 2.965 | 0.738 | 0.718 | 0.546 | 0.491 | |
| 11. Pedometer | 4.375 | 4.279 | 3.667 | 3.802 | 0.844 | 0.820 | 0.667 | 0.701 | |
| 12. Sleep tracker | 4.342 | 4.465 | 3.875 | 3.954 | 0.835 | 0.866 | 0.719 | 0.738 | |
| 13. Heart rate monitor | 4.067 | 3.954 | 3.400 | 3.407 | 0.767 | 0.738 | 0.600 | 0.602 | |
| 14. Data feedback | 3.817 | 3.954 | 3.392 | 3.163 | 0.704 | 0.738 | 0.598 | 0.541 | |
| 15. Calories burned | 3.883 | 3.977 | 3.383 | 3.419 | 0.721 | 0.744 | 0.596 | 0.605 | |
| Beneficial consequences | 16. Using a smart bracelet, I’ve gained firsthand experiences. | 4.608 | 4.535 | 4.183 | 4.326 | 0.902 | 0.884 | 0.796 | 0.831 |
| 17. Using a smart bracelet, I’ve learned about smart products. | 3.767 | 3.791 | 3.600 | 3.686 | 0.692 | 0.698 | 0.650 | 0.672 | |
| 18. Using a smart bracelet, I’ve learned different technical applications. | 3.725 | 3.919 | 3.533 | 3.674 | 0.681 | 0.730 | 0.633 | 0.669 | |
| 19. Using a smart bracelet, I’m more health-conscious. | 4.742 | 4.744 | 4.783 | 4.744 | 0.935 | 0.936 | 0.946 | 0.936 | |
| 20. Using a smart bracelet, I’ve become closer to my family. | 4.283 | 4.500 | 4.225 | 4.209 | 0.821 | 0.875 | 0.806 | 0.802 | |
| 21. Using a smart bracelet, I’ve made more friends. | 3.967 | 3.988 | 3.867 | 3.954 | 0.742 | 0.747 | 0.717 | 0.738 | |
| 22. Using a smart bracelet, I’m more relaxed. | 4.467 | 4.442 | 4.500 | 4.512 | 0.867 | 0.860 | 0.875 | 0.878 | |
| 23. Using a smart bracelet, I’m more able to relieve stress. | 4.808 | 4.779 | 4.667 | 4.593 | 0.952 | 0.945 | 0.917 | 0.898 | |
| 24. Using a smart bracelet has satisfied my curiosity. | 4.800 | 4.802 | 4.517 | 4.558 | 0.950 | 0.951 | 0.879 | 0.890 | |
| Personal values | 25. Using a smart bracelet has improved my health. | 4.858 | 4.791 | 4.675 | 4.663 | 0.965 | 0.948 | 0.919 | 0.916 |
| 26. Using a smart bracelet, I’m more able to enjoy life. | 4.392 | 4.581 | 4.292 | 4.372 | 0.848 | 0.895 | 0.823 | 0.843 | |
| 27. Using a smart bracelet has improved my quality of life. | 3.933 | 3.861 | 3.817 | 3.942 | 0.733 | 0.715 | 0.704 | 0.735 | |
| 28. Using a smart bracelet has improved my interpersonal relationships. | 3.683 | 3.651 | 3.525 | 3.698 | 0.671 | 0.663 | 0.631 | 0.674 | |
| 29. Using a smart bracelet has improved my life. | 4.133 | 3.988 | 4.008 | 4.035 | 0.783 | 0.747 | 0.752 | 0.759 | |
| 30. Using a smart bracelet has brought purpose to my life. | 4.383 | 4.384 | 4.192 | 4.221 | 0.846 | 0.846 | 0.798 | 0.805 | |
| 31. Using a smart bracelet, I feel a sense of social belonging. | 4.300 | 4.244 | 4.133 | 4.233 | 0.825 | 0.811 | 0.783 | 0.808 | |
| 32. Using a smart bracelet, I feel a sense of achievement. | 4.850 | 4.779 | 4.533 | 4.616 | 0.963 | 0.945 | 0.883 | 0.904 | |
| Index | Population Mean (µ) | Population Error (σ) | UCL (1 × σ) | LCL (1 × σ) | |||||
|---|---|---|---|---|---|---|---|---|---|
| Evaluation | Younger than 70 | 70 and Older | Younger than 70 | 70 and Older | Younger than 70 | 70 and Older | Younger than 70 | 70 and Older | |
| Importance vs. Satisfaction | 3.993 | 4.033 | 0.140 | 0.132 | +0.140 | +0.132 | −0.140 | −0.132 | |
Publisher’s Note: MDPI stays neutral with regard to jurisdictional claims in published maps and institutional affiliations. |
© 2022 by the authors. Licensee MDPI, Basel, Switzerland. This article is an open access article distributed under the terms and conditions of the Creative Commons Attribution (CC BY) license (https://creativecommons.org/licenses/by/4.0/).
Share and Cite
Jeng, M.-Y.; Yeh, T.-M.; Pai, F.-Y. A Performance Evaluation Matrix for Measuring the Life Satisfaction of Older Adults Using eHealth Wearables. Healthcare 2022, 10, 605. https://doi.org/10.3390/healthcare10040605
Jeng M-Y, Yeh T-M, Pai F-Y. A Performance Evaluation Matrix for Measuring the Life Satisfaction of Older Adults Using eHealth Wearables. Healthcare. 2022; 10(4):605. https://doi.org/10.3390/healthcare10040605
Chicago/Turabian StyleJeng, Mei-Yuan, Tsu-Ming Yeh, and Fan-Yun Pai. 2022. "A Performance Evaluation Matrix for Measuring the Life Satisfaction of Older Adults Using eHealth Wearables" Healthcare 10, no. 4: 605. https://doi.org/10.3390/healthcare10040605